SWOT (Surface Water Ocean Topography)
EO
Atmosphere
Ocean
NASA
The Surface Water and Ocean Topography (SWOT) is a joint collaboration between the National Aeronautics and Space Administration (NASA), the French Space Agency (CNES), the Canadian Space Agency (CSA) and the United Kingdom Space Agency (UKSA), and was launched on December 16, 2022. As a swath-based Synthetic Aperture Radar (SAR) altimetry mission, following from the Jason-1, -2 and -3 missions with innovative technology, SWOT will perform a global survey of the Earth's surface water, collecting detailed measurements of how water bodies change over time. The data collected by these surveys could improve ocean circulation models and weather predictions, while aiding in freshwater management around the world.
Quick facts
Overview
| Mission type | EO |
| Agency | NASA, CNES, UKSA, CSA |
| Mission status | Operational (nominal) |
| Launch date | 16 Dec 2022 |
| Measurement domain | Atmosphere, Ocean, Land, Gravity and Magnetic Fields |
| Measurement category | Gravity, Magnetic and Geodynamic measurements, Atmospheric Humidity Fields, Landscape topography, Ocean topography/currents, Ocean surface winds, Ocean wave height and spectrum, Inland Waters |
| Measurement detailed | Atmospheric specific humidity (column/profile), Land surface topography, Wind speed over sea surface (horizontal), Significant wave height, Geoid, Sea level, Ocean dynamic topography, Gravity field, Lake Area, Lake level |
| Instruments | LRA, GPSP, POSEIDON-3C Altimeter, AMR-S, Ka-band Radar INterferometer (KaRIN), DGXX-S |
| Instrument type | Precision orbit, Imaging multi-spectral radiometers (passive microwave), Radar altimeters |
| CEOS EO Handbook | See SWOT (Surface Water Ocean Topography) summary |
Summary
Mission Capabilities
The SWOT payload comprises two subassemblies: KaRIn (Ka-band Radar Interferometer) and the nadir payload module, which contains the AMR-S (Advanced Microwave Radiometer), the Poseidon-3C (Positioning Ocean Solid Earth Ice Dynamics Orbiting Navigator) dual-frequency nadir altimeter, the DORIS receiver (Doppler Orbitography and Radiopositioning Integrated by Satellite), the GPSP receiver (GPS Payload), and the LRA (Laser Retroreflector Array), as well as the X-band communication subsystem for the scientific data downlink.
Poseidon-3C provides nadir viewing sounding radar for the provision of real-time high-precision sea surface topography, ocean circulation and wave height data.
The three-frequency microwave radiometer AMR-S corrects the nadir altimeter range measurements for wet tropospheric delay by measuring the amount of water vapour between SWOT and Earth's surface.
DORIS, GPSP and LRA are used for precise orbit determination.
As the primary instrument of the mission, KaRIn is a near-nadir viewing interferometric altimeter, consisting of two distinct 50 km swaths. It uses two SAR antennas, which are located at the opposite ends of a 10 m boom, enabling researchers to gather information along a roughly 120 km wide swath of the Earth’s surface and to discern currents and eddies as small as 20 km across. KaRIn bounces radar pulses off the water’s surface and receives the return signal with its antennas at the same time.
While the nadir altimeter will point straight down and take data in one dimension, the KaRIn antennas will tilt, scanning the surface in two dimensions and collecting data with greater precision than the nadir altimeter alone.
Performance Specifications
KaRIn is expected to have an average data rate of approximately 271 Mbit/s above land and 3 Mbit/s over the ocean, with onboard data processing of the returned pulses. This processing yields a 10 m - 70 m range resolution, with an elevation accuracy of about ± 0.5 m, which can be further improved to about ±30 mm through polynomial-based averaging. The instrument has a 10 m long physical baseline and a boresight look angle of ±2.7°. Several sources of errors limit the accuracy of the final height, including random errors, spacecraft bus and instrument systematic errors, orbit and electromagnetic propagation errors or wave-related errors.
The nadir altimeter, based on a former Jason technology, can identify currents and eddies down to about 100 km wide.
The satellite will cover a distance of 150 km in about 20 seconds, providing a nearly instantaneous snapshot of the Sea Surface Height (SSH) over a 120 km x 150 km area. The SWOT spacecraft will survey the globe between 78° N latitude and 78° S latitude, covering about 90 - 95% of the planet’s surface. The number of repeat observations at a given location during the 21-day repeat orbit varies with latitude, from two repeats at the equator to more than six at the high latitudes.
SWOT will maintain a near-circular, non sun-synchronous orbit at an altitude of 890 km and an orbital inclination of 77.6°.
Space and Hardware Components
The SWOT flight system is the spaceborne element of the mission. It is composed of the spacecraft bus supplied by CNES, and the two payload modules (KaRIn and nadir). The bus provides basic services to the payload modules and includes the C&DH (Command and Data Handling) subsystem, the EPS (Electrical Power Subsystem), the AOCS (Attitude and Orbit Control Subsystem), the TCS (Thermal Control Subsystem), and the RF (Radio Frequency) communication subsystem. The spacecraft’s mass at launch will be roughly 2000 kg, out of which KaRIn weighs 294 kg.
SWOT was launched into orbit aboard a Falcon 9 launch vehicle on December 16, 2022.
SWOT (Surface Water Ocean Topography) Mission
Overview
SWOT is a wide-swath altimeter mission concept - a proposal under study/definition in 2009 by NASA/JPL and CNES - for accurate future monitoring of local sea level changes at the land-sea interface. The SWOT mission has been recommended in 2007 by the NRC (National Research Council) decadal survey “Earth Science and Applications from Space: National Imperatives for the Next Decade and Beyond” for implementation by NASA. 1) 2) 3)
Note: The new name SWOT was adopted in February 2008, replacing the original name WATER HM (Water And Terrestrial Elevation Recovery) Hydrosphere Mapper. 4) 5)
The overall scientific objectives and goals of SWOT, in particular by the water resources and hydrologic community, are to contribute to a fundamental understanding of the Earth system by providing global measurements of continental surface water storage changes and discharge, which are critical for water and climate cycle models. 6) 7) 8) 9) 10) 11) 12) 13) 14) 15) 16) 17) 18) 19) 20) 21)
The main mission goals of the demonstration mission are:
• The primary oceanographic objectives of the SWOT mission are to characterize the ocean mesoscale and sub-mesoscale circulation at spatial resolutions of 10 km and larger.
• The hydrologic science objectives of the SWOT mission are:
- To provide a global inventory of all terrestrial surface water bodies whose surface area exceeds 250 m2 (lakes, reservoirs, wetlands) and rivers whose width exceeds 100 m (requirement) (50 m goal)
- To measure the global storage change in terrestrial surface water bodies (for man-made reservoirs, total storage) at sub-monthly, seasonal, and annual time scales.
- To estimate the global change in river discharge at sub-monthly, seasonal, and annual time scales.
In 2006, WatER was an international (NASA, CNES, ESA) proposal and initiative (satellite mission in study phase) focused on the hydrologic processes related to the spatial and temporal variability in global terrestrial surface fresh water storage. Fresh water bodies cover at least 4% of Earth's terrestrial surface whereas tropical wetlands, particularly in the Amazon Basin, cover nearly 20% of their watershed. The vast storage capacity of wetlands, reservoirs, rivers, etc. impact the global water cycle.
The processes include the movement of water through a basin, across a continent and into the oceans; the hydrologic mass exchange that occurs between floodplains and channels; the changes in water storage on the continents; and the management of water resources. Climatic, sediment, biogeochemical, and temperature processes are inherently tied to hydrologic mass-balance and transport, thus they are included in our science goals to make for a more complete understanding of the terrestrial surface water branch of the global water cycle.
To identify the temporal and spatial variability in surface water storage requires measurements of volumetric change. Thus, the minimum requirements are the measurements of: 1) surface water area extent, 2) elevations of the water surface, h, of wetlands, rivers, lakes, reservoirs, etc., and 3) temporal changes in water levels, i.e. the derivatives in time and space (Δh/Δt, Δh/Δx). The requirements call for spatial resolutions of water surfaces in the range of 10-100 m at temporal resolutions of 1 week.
In the fall of 2012, SWOT passed two important milestones and has now entered "Phase A" in the NASA mission development life cycle. 22)
Some Background: A series of workshops and a symposium were held in Europe since 2003 [by a group of European (France, ESA, UK, etc.) and US scientists, in particular the NASA SWWG (Surface Water Working Group)] on the topic of defining a proposal for a satellite mission dedicated to terrestrial surface water.
- Workshop on Hydrology from Space, Toulouse, France, Sept. 29-Oct. 1, 2003
- Workshop at LEGOS (Laboratoire d'Études en Géophysique et Océanographie Spatiale), Toulouse, France, Nov. 15-16, 2004
- Surface Water Satellite Mission workshop at ESA/ESRIN, Frascaty, Italy March 7-8, 2005
- Symposium: 15 Years of Progress in Radar Altimetry, Venice, Italy, March 13-16, 2006
- Joint Meeting of Ocean Sciences and Surface Water Hydrology in Support of Wide-Swath Altimetry Measurements, Washington DC, Oct. 30-31, 2006
- OSTST (Ocean Surface Topography Science Team) meeting was held in Hobart, Australia on March 12-15, 2007.
The growing concern about our planet's fresh water resources, coupled with the economically driven decrease in groundbased gauge measurements, has focused attention on the possibility of using space-based data sets for remote measurements of river and lake heights. The most direct measurements of inland water heights are obtained from satellite altimeters, with long time series of such observations having been built up over the past decade.
Presently, altimeters are configured for oceanographic applications, thus lacking the spatial resolution that may be possible for rivers and wetlands. The conventional nadir-looking altimeters (of radar or lidar type) provide a very limited coverage (intersatellite distance of typically 150 km for the TOPEX/Poseidon - Jason-1 tandem), and a spatial resolution of ....... These conventional altimeter profiles are not suitable of supplying the measurements needed to address scientific and societal questions.
SWOT will repeatedly measure the spatially distributed water surface elevations (h) of wetlands, rivers, lakes, reservoirs, etc. Successive h measurements yield dh/dt, (t is time), hence a volumetric change in water stored or lost. Individual images of h yield dh/dx (x is distance), hence surface water slope, which is necessary for estimating streamflow. 23)
Mission Architecture
SWOT is a swath-based SAR altimetry mission designed to acquire elevations of water surfaces at spatial and temporal scales necessary for answering key water cycle and water management questions of global importance. SAR altimetry is the only method capable of producing images of high resolution water surface elevation measurements [i.e., provision of h, Δh/Δx (slope), and Δh/Δt (changes in water level over time)].
The SWOT mission architecture is pictured in Figure 12 and consists of a space segment comprising a Flight System composed of the spacecraft bus and science payload and a ground segment that includes the ground station network, spacecraft and payload operations centers, data processing systems, and data archiving systems. The Flight System collects data from its science payload and relays it via an X-band downlink of 800 Mbit/s to a global network of CNES-supplied ground stations. The large daily volume of ~7 Tbit requires ~ 20 downlinks/day. The spacecraft engineering and housekeeping telemetry, with its much more modest volume, is downlinked via S-band twice a day to the ground network. The spacecraft and science instrument commanding is done via S-band through the same ground station network. Once received, the science data are relayed to the JPL and CNES POCs (Payload Operation Centers) for processing, distribution to science and other users, and archiving. 41)
Key mission drivers: A number of top level mission requirements are key drivers to the mission concept design. The are the orbit, the ocean height accuracy, and the hydrology surface water spatial resolution. A non-sun-synchronous highly inclined orbit of 78º inclination was selected to minimize tidal aliasing of the ocean SSH measurements and to ensure coverage of major water bodies on land. The associated large variation in solar angle relative to the spacecraft drives the power subsystem design, resulting in large solar arrays (area ~35 m2) and increased battery sizing. The ocean height accuracy drives the interferometer baseline length, the antenna/boom stability and the roll knowledge drift requirement to < 50 marsec/2.5 minutes. The surface water spatial resolution of 50 m impacts the onboard data handling and data downlink requirements due to the large associated data volume (+ 7 TBit/day) and the raw data rate of KaRIn of 360 Mbit/s.
Measurement Concept
The SWOT measurement concept is illustrated in Figure 14. The SWOT spacecraft measures satellite and ocean range through its nadir altimeter, corrected for the effects of columnar water water through its microwave radiometer. These measurements are coupled with those made in two swaths by the KaRIn instrument. Ground based laser ranging systems and DORIS beacons, plus the spaceborne GPS (Global Positioning System) provide POD (Precision Orbit Determination) for calculating SSH (Sea Surface Height). For hydrology-related height and slope measurements for water bodies and rivers, a similar approach is taken, although the nadir altimeter measurements are not required due to less stringent height accuracy requirements. SWOT will provide measurements with a spatial resolution of 1 km for the ocean (after on-board processing), and 50 m for land water, both with centimetric height accuracy , ~ 3 cm for ocean and 10 cm for land (Ref. 41).
While conventional altimetry relies on the power and the specific shape of the leading edge of the return waveform, which is only available for the nadir point, the interferometric technique relies on the measurement of the relative delay between the signals measured by two antennas separated by a known distance (hereafter termed “baseline”, Figure 15), together with the system ranging information, to derive the height for every imaged pixel in the scene. 43)
For a given point on the ground, a triangle is thus formed by the baseline B, and the range distance to the two antennas, which can be used to geolocate in the plane of the observation. The range difference between the two antennas is determined by the relative phase difference between the two signals (Figure 16).
The importance of the cross-track pointing angle, including the roll knowledge (Θ), in the measurement is evident. For that reason, the SWOT flight system includes a precision gyro in the KaRIn payload module. In addition, its antenna/boom must be very stable and disturbances from spacecraft mechanisms must be minimized. The KaRIn antenna baseline (B) is specified to be 10 m.
The difference between two sides (Δ r) is obtained from the phase difference (Θ) between the two radar channels. One can determine the height measurement from the two equations stated in Figure 16.
KaRIn operates in the so- called “Non Ping Pong mode”: nominally, the radar transmits out of one antenna and receives on both, thus creating an interferometric pair of each swath (Figure 17) The isolation between the two swaths is accomplished by means of offset feed reflectarray antennas which produce beams of orthogonal polarizations for each swath.
The intrinsic range resolution is 75 cm, and the ground cross-track range resolution varies from about 70 m in the near swath to about 10 m in the far swath.
Several sources of errors limit the accuracy of the final height:
• Random errors, most notably the measurement noise of the interferometric phase difference. The random error contribution depends on several factors, most remarkably the system SNR (Signal-to-Noise Ratio), the length of the interferometric baseline, and the processing algorithm.
• Spacecraft bus and instrument systematic errors, such as unknown roll, baseline, range and phase drift errors. Lack of knowledge in the spacecraft roll angle, changes in the baseline due to thermal contraction or expansion, system timing errors, and phase errors introduced by the antennas or the electronics will induce height errors.
• Orbit and electromagnetic propagation (or media) errors, such as tropospheric and ionospheric propagation delays. While KaRIn will not directly measure tropospheric and ionospheric corrections, the SWOT altimeter/radiometer suite will be used to perform each range correction at nadir. The POD suite of instruments will be used to correct orbit errors.
• Wave-related errors, such and sea-state (also termed “electromagnetic”, EM) bias and SWH (Significant Wave Height) errors. The spatial variability of the wave and wind fields will introduce height biases.
Spacecraft
The SWOT flight system is the spaceborne element of the mission. It is composed of the spacecraft bus, supplied by CNES, and two payload modules, the nadir payload module and the KaRIn payload module. The spacecraft bus provides basic services to the payload modules and includes C&DH (Command and Data Handling) subsystem, the EPS (Electrical Power Subsystem), AOCS (Attitude and Orbit Control Subsystem), TCS (Thermal Control Subsystem), and the RF communication subsystem. The 35 m2 area twin solar arrays are oversized to minimize disturbances from array articulation. The arrays are fixed along the velocity vector also to minimize dynamic disturbances. 61)
Other features of the spacecraft bus are batteries with 320 Ah capacity to support 2 kW observatory average power requirements, a SSR (Solid State Recorder) of 2.3 Tbit capacity, and a propulsion subsystem with a propellant tank capacity to meet the French Law on orbital debris mitigation.
The spacecraft bus uses high heritage technologies and generic standards developed through the CNES ISIS program. The nadir payload module accommodates all the science instruments aside from KaRIn [microwave radiometer, nadir altimeter, DORIS,GPSP(GPS Payload receiver), and LRA], and the X-band communication subsystem for the high rate downlink of the science data, including KaRIn's. The nadir payload module faces nadir and is mounted to the KaRIn payload module, which in turn is mounted to the spacecraft bus. The KaRIn payload module accommodates the KaRIn instrument, including the reflector antennas, the RF feeds and electronics, antenna booms, and a precision gyro to measure the roll parameters.
The nadir and KaRIn payload modules will be integrated and tested in parallel prior to environmental testing at JPL and subsequent shipment to France for integration with the spacecraft bus. This approach maximizes schedule efficiency and results in a fully qualified and integrated Nadir/KaRIn payload module assembly. The flight system configuration is illustrated in Figure 23 (Ref. 41).
Spacecraft launch mass | ~2000 kg |
Spacecraft power | 2 kW total power demand |
Solar panel size | 35 m2 |
Batteries | 150 kg battery mass (320 Ah capacity) |
Mass memory size | 2.3 TB SSR capacity |
KaRIn data rate | 360 Mbit/s high rate between KaRIn and the SSR |
Propellant | 130 liter propellant tank |
Spacecraft envelope | 5m total observatory height and 23 m span |
Mission life | 3 years (5 years goal) |
RF communication system: The SWOT spacecraft will survey at least 90% of the globe, studying Earth's lakes, rivers, reservoirs, and oceans at least twice every 21 days. The data collected by these surveys could improve ocean circulation models and weather and climate predictions, while aiding in freshwater management around the world.
Taking such frequent and extensive surveys of Earth’s bodies of water requires SWOT to communicate a large amount of data to ground stations. SWOT will be capable of collecting and transferring more than 7.2 Tb of science data per day. This requires a downlink data rate of 620 Mbit/s to deliver this volume in the brief time intervals when SWOT is in view of a ground station. 62)
The 620 Mbit/s downlink data rate could be supported if the satellite had a steerable high-gain antenna with a gimbal capable of continuously pointing toward the ground station. However, using a gimbal generates vibrations that would degrade the accuracy of one of SWOT’s instruments,KARIN (Ka-band Radar Interferometer). Instead, a LGA (Low-Gain Antenna) with a broad-beam radiation pattern is necessary to provide maximum contact time with ground stations. An isoflux radiation pattern allows the antenna to cover the full visible Earth and to compensate for range attenuation.
Using an LGA at the 8.025-8.400 GHz band allocated for Earth-exploration satellite service, the data will need to be divided into two channels of 310 Mbit/s to satisfy the 620 Mbit/s downlink data rate and the allocated microwave band. The two channels are transmitted using different polarizations: RHCP (Right-Hand Circular Polarization) and LHCP (Left-Hand Circular Polarization).
In order to use the LGA as a viable option, self-interference issues needed to be addressed. The first type of inference that needs to be accounted for is referred to as polarization interference. If SWOT uses two antennas with different polarization (RHCP and LHCP), undesired polarization from one antenna will generate interference to the other one. An antenna with a high cross-polarization discrimination (XPD) will receive an insignificant amount of undesired polarization. The SWOT telecom antenna needed to demonstrate high XPD (~25dB) to mitigate this interference, which is very difficult across the large frequency band (8.025-8.400 GHz) and especially at an angle of ± 60º from antenna boresight. No commercially available antennas met such stringent requirements.
The nadir deck of the SWOT satellite is a rich environment with a 1 m aperture radiometer reflector antenna, a 1.2 m altimeter reflector antenna, a DORIS (Doppler Orbitography and Radiopositionning Integrated by Satellite) antenna, and a LRA (Laser Reflector Array). These antennas generate the second type of interference — multipath interference. This occurs when one antenna is radiating RHCP, for instance, power will be reflected by the large reflectors and becomes LHCP.
AOCS architecture: 63)
The SWOT payload has in particular impacted the AOCS architecture of the satellite. What is specific on SWOT? The fact that the payload has to be taken into account before the mission, during the mission and after the mission! In the end, the AOCS has to manage a very large satellite (similar to a geostationary satellite), a variable geometry (due to the payload deployment in flight) and a variable orbital domain (due to the controlled re-entry after the mission).
The satellite is classically split into a payload with its main instrument (the wide-swath Ka-band radar interferometer, KaRin) developed by the NASA-JPL and a platform developed by Thales Alenia Space for CNES.
The KaRin instrument is constituted of two radar antennas perched at the end of two 5-meter booms. The platform is very large too, as shown in Figure 26 (satellite mass near 2 tons and power near 2 kW) in order to satisfy the mission on a low earth orbit (altitude near 900 km, inclination of 78 degrees) with a local nadir and track compensation guidance.
The platform uses the generic Step2 avionics developed by TAS. Its AOCS is based for the mission on a gyroless estimation and a 4-RW (Reaction Wheel) control, as shown in Figure 27. The survival mode uses a magnetometer-CSS estimation and a 3-MTBs control (with a stabilization by a 2-RW kinetic momentum).
The AOCS modes are described in Figure 28:
- ESAM (Emergency Safe Attitude Mode) is used just after launch or after an anomaly (axis Zs pointed towards the Sun with a spin),
- TRM (Transition Mode) is an automatic mode allowing the transition from ESAM to NOM
- NOM (Nominal Operating Mode) is dedicated to the mission phase (axis Zs pointed towards the Earth according to the local nadir and track compensation guidance law autonomously processed thanks to the GNSS orbit estimation)
- OCM (Orbit Control Mode) allows to manage the orbit configuration (initial orbit acquisition, station keeping, end of life).
Key drivers for AOCS: Considering the system needs, the SWOT AOCS is highly constrained all along the lifetime of the satellite:
- before the beginning of the mission, as the KaRin instrument has to be deployed after launch,
- during the mission, as the quality of the products depends on two major criteria: a very high dynamical stability and a very good knowledge of the attitude,
- at the end of the mission, as the French Space Operation Act applied to the satellite architecture requires a controlled re-entry of the satellite.
Each of these key points will imply either a dedicated AOCS design, either an optimized operational strategy, either the development of processing tools or a specific validation process.
Payload Deployment
Decoupling a complex problem: The deployment of the KaRin instrument is realized in 3 separate steps. Each step begins by a spring release generating a very short but high perturbation torque, is followed by the motion of the hinge and ends by the hinge latching. Each intermediary configuration has a very different geometry (with a great variation of the inertia), as shown in Figure 29. The flexible modes depend on the configuration too and on the latching status.
Due to these characteristics, the deployment was not possible in AOCS NOM mode but in ESAM mode where the control is done by the high capacity MTBs (Magneto Torquer Bars). In order to prevent from any impact of the MTBs torques to the deployment mechanisms, it was decided to inhibit the control during the deployment duration. In order to be robust to any impact of the deployment on the dynamics, the strategy foresees to trigger a new survival sequence. This allows a decoupling between platform and payload but implies a requirement on the maximum duration of each deployment step, as the AOCS is not robust to a too long period without control. Other requirements exist, as a limitation of the load at the solar arrays roots and a limitation of the pointing errors for payload thermal considerations.
Validation process: In order to verify these requirements and the integrity of the satellite during the deployment, the following approach was adopted:
- JPL developed an ADAMS simulator with a very precise payload model and a simplified platform model (solar arrays flexible modes, RW kinetic momentum, satellite rotation but no AOCS control), for verifying the payload integrity and to estimate the durations and the mechanical load at the solar arrays roots.
- TAS developed a Matlab/Simulink simulator with a very precise platform model (including the AOCS algorithms) and a simplified payload model (flexible modes but no deployment model), for verifying the platform integrity during and after the deployment and to estimate the pointing errors.
- CNES developed a Matlab/Simulink simulator with a precise platform model and a simplified payload model (flexible modes and a deployment model delivered by JPL), for doing system cross-checks and characterizations.
The first step of the validation was the cross-check between simulators in terms of dynamics behavior without and with deployment. Figure 30 (respectively Figure 31) shows an example of comparison between the JPL and CNES simulators in terms of hinge rotation during the second step of deployment (respectively angular velocity during the first step of deployment).
When validated, the simulators were used for robustness and sensitivity analysis for verifying the integrity at payload and platform levels and the compliance to the requirements. For the payload, the dispersed parameters concerned the hinges, dampers, mass and inertia. For the platform, the dispersions were applied on the mass properties, the flexible mode (platform and payload), the unit features, the initial orbital conditions, attitude and rates. Figure32 shows the results of these dispersions in terms of sun pointing error in the course of the time after the end of deployment.
Dynamic Stability
An exotic criterion: When the KaRin instrument is deployed, the mission will begin but the quality of the measurements depends a lot on the stability of the payload. JPL defined 3 geometrical components (characterizing the length of the baseline, the roll and the phase), each of them based on the motion of points located on different part of the payload, as presented in Figure 33.
The final stability criterion is a combination of these 3 components. The last step consisted in setting the acceptable threshold for the criterion. Two requirements applicable to the platform were defined: a PSD (Power Spectral Density) limit (applicable to frequencies until 6.5 Hz) and a RMS (Root Mean Square) limit (integration of frequencies above 6.5Hz).
Medium - high frequency approach: The medium-high frequency domain corresponds to the micro vibrations due to the RWs (Reaction Wheels).
A first step consisted for TAS in orienting the RWs in order to minimize the perturbations on the payload.
A second step allowed to TAS to define the optimal RWs speed during the mission in order to keep the harmonics of the perturbation outside the frequency zone the most sensible. The objective is in particular to avoid the rotation of the RWs at low frequency, due to the fact that one of the payload flexible mode appears below 10 Hz and the PSD limit is applicable until 6.5Hz. This is easy with the 4 RWs configuration but a specific unloading strategy had to be implemented for the 3 RWs configuration (in case of 1 RW failure). When a modification of the attitude is requested outside the mission period [yaw flip for keeping the –Y face in the shadow or slew before doing an OCM (Orbit Control Mode)], it is necessary to modify the initial RW rates, in order to restore a sufficient capacity for doing the attitude slews, as described in Figure 34.
The last step consisted for TAS in doing simulations with a dedicated micro-vibrations tool for verifying the compliance to the stability criterion and generating data for the JPL who did more precise verifications.
Low – medium frequency approach: The low-medium frequency domain corresponds to the other perturbations: AOCS actuators excepted RW micro vibrations, AOCS control loop noise, solar arrays commanded rotations or solar arrays motion at eclipse transitions.
The estimation of the criterion stability was done thanks to the AOCS study simulator, where the first flexible modes of the payload are modelled, with an estimation of the motion of the payload points involved in the criterion.
The first step consisted in estimating the criterion in routine phase (no solar array rotation, no eclipse): Figure 35 shows the great margin with regards to the requirement.
In a second step, the transient situations were analyzed and in case of the requirement is not fulfilled (this happens only in case of given solar arrays rotations), it is necessary to estimate the delay to recover the compliance to the requirement. Figure 36 gives the temporal evolution of the stability criterion: we observe the damping of the initial perturbation. Figure 37 shows that the damping is sufficient after 700 s in order to be compliant again to the requirement: the corresponding mission unavailability is acceptable due to the fact that the number of solar arrays rotations is very weak.
Attitude Estimation
An exotic criterion again: When the KaRin instrument is deployed, another major contribution to the mission performance is the knowledge of the attitude. CNES is in charge of delivering to the scientific community a precise attitude product, which is used then for processing the mission product chains.
As for the stability criterion, two requirements are here applicable: a PSD (Power Spectral Density) limit (applicable to frequencies above 5.2 e-4 Hz according to Figure 14) and a RMS limit (integration of the whole frequency domain: a few arcsec at 1σ).
There is no need to have such a precision on board in real time: the computation of the precise attitude will be done on ground thanks to a dedicated tool.
SWOT attitude sensors: For achieving the required performance at high frequencies, a FOG (Fiber Optical Gyroscope) was implemented inside the payload: it is the ASTRIX®200 developed by Airbus DS (Figure 39). 64)
The other attitude sensors available for the attitude estimation are the STR used by the platform AOCS for controlling the satellite pointing. It is a 3 optical heads sensor developed by Leonardo and implemented as in Figure 40.
Attitude estimation approach: In order to answer to the RMS requirement, it was decided to implement a classical blending of gyro and STR OH measurements (2 OHs, as the third can be considered as a cold redundancy) with a Kalman filtering.
But the difficulty concerned the compliance to the PSD (Power Spectral Density) requirement, as it was necessary to suppress the low frequency errors coming from the STR OH, so a very specific tuning of the filter was adopted.
Figure 41 shows an example of simulation with an adapted tuning : the STR low frequency errors are well suppressed (thanks to the gyro measurements) and the gyro drift is suppressed too (thanks to the STR measurements).
But Figure 42 shows that such a tuning causes a very slow convergence of the attitude after the initialization of the filter. A compromise shall be found between both aspects: a better performance when converged after a long time with regards to a quicker convergence to a less performant state. It will be possible to adapt this tuning in flight according to the performance during transients such as telemetry holes, measurements or dynamics perturbations.
Controlled Re-entry
French Space Operation Act: The French Space Operation Act (FSOA) was adopted by the French Senate in 2008. The purpose of this document is to set up a national regime to authorize and control Space operations following French government’s international commitments. So the French authorities mainly voted for this act in order to assure the protection of people, good and the environment against space activities.
As SWOT launch is scheduled after the year 2020 and as the control operations will be done at CNES in France, the satellite shall respect the requirements existing in the FSOA in terms of end of life.
One of the major constraints is the casualty risk limitation and due to payload constitution, there is only one solution: to guarantee a controlled reentry of the satellite after the end of the mission.
Adopted strategy: The strategy adopted in order to be compliant to the FSOA consists in aiming an impact of the satellite debris inside the SPOUA (South Pacific Ocean Uninhabited Area), as presented in Figure 40.
For doing this, a first phase consists in creating an elliptic orbit from the mission circular orbit and the second phase aims at realizing a last single thrust at the apogee in order to have the perigee in the SPOUA, as described in Figure 43.
Impacts on the AOCS: This strategy has a degree of freedom: this is the altitude of the perigee before the last burn. If this altitude is high, it is easier to control the attitude of the satellite but the amplitude of the last burn is greater with an impact on the propulsion subsystem. The compromise adopted for SWOT is to evaluate the lowest achievable altitude with the AOCS architecture defined for controlling the attitude during the mission phase and to design the propulsion subsystem necessary for this altitude.
The solution is to put 2 sets of four 22 N-thrusters, a large tank (628 liter) with a high pressure at end of life, as illustrated in Figure 45.
The use of 4 among these thrusters for managing the orbit at the beginning or during the mission implies the adaptation of the control laws. In order to limit the dynamical perturbations created by such powerful thrusters, a ramp is introduced at the beginning of the thrust and an “on-modulation” phase with a low actuation level is added at the end of the thrust, as shown in Figure 46.
Controllability of performances: For sizing the last burn duration, it is necessary to determine the altitude of the last perigee, so the capacity of the AOCS to control the attitude at such an altitude. In order to determine this capacity, a simulation campaign is conducted, with the dispersion of a lot of parameters, as the orbital configuration, the atmospheric density and wind, the errors on the geometry, the satellite and solar arrays pointing accuracy. Figure 30 presents for one of the simulated cases the evolution of the RW speed in the course of the time.
Thanks to the capacity to rotate the solar arrays, a degree of freedom is usable to optimize the geometry and reduce the level of the aerodynamic perturbation near the perigee. Figure 31 presents the optimal configuration called “glider mode”, with the solar arrays aligned along the satellite speed. This configuration is different from the configurations met during the mission but is compatible with the power need during this end-of-life phase, as the payload is switched off. With this optimal configuration, the minimum controllable altitude was fixed to 250 km.
The last verification concerns the STR (Star Tracker): firstly, the fields of view shall not be affected by the solar arrays orientation and secondly they have to be not blinded by the Earth (especially at low altitude) or by the Sun. Figure 49 shows that there is always at least one OH available, whatever the period (and the sun position with regards to the orbit plane).
In summary, the analysis (Ref. 63) shows how the SWOT payload has sized the AOCS of the satellite. It synthesizes the status of the satellite presented at the CDR (Critical Design Review). The AOCS is currently under system validation on the TAS avionics bench.
Next two years will be dedicated to the operational qualification thanks to a satellite simulator, embedding the AOCS on-board software. During this activity, both deployment and the reentry phases will be exercised and the ground attitude restitution chain will be connected to the generated telemetry.
The last step will concern in flight the final tuning of the RW speed and of the ground filter for the attitude restitution if estimated as necessary for improving the mission performance.
Launch
The SWOT spacecraft was launched on December 16, 2022 aboard a SpaceX Falcon-9 Heavy rocket from SLC-4E (Space Launch Complex 4E) at VSFB (Vandenberg Space Force Base), CA.65)
Calibration Orbit: Altitude of 857 km, 77.7° inclination, one day repeat cycle, operated for six months
Science Orbit: Near-circular (non sun-synchronous) 21-day orbit, altitude of 891 km, 77.6º inclination, operated for three years
Parameter | Fast-sampling orbit | Science orbit |
Repeat orbit parameters (N+P/Q) | 14+0/1 | 13+19/21 |
Mean semi-major axis | 7235379.8 m | 7268718.9 m |
Altitude [mean sma (semi-major axis) minus equivalent radius] | 857.244 km | 890.582 km |
Inclination | 77.6º | 77.6º |
Number of orbits per cycle | 14 | 292 |
Nodal period | 6131.25 s | 6173.62 s |
Exact repeat cycle duration (days) | 0.99349 | 20.86455 |
Longitude gap between 2 consecutive ground tracks | 25.714º | 25.890º |
Longitude gap between 2 adjacent ground tracks | 25.714º | 1.233º |
Drift of RAAN (Right Ascension of Ascending Node) local time | -9.44 minutes/day | -9.35 minutes/day |
Duration for 24h RAAN local time change | 152.6 days | 154.0 days |
Scientists Invited to Collaborate in Satellite Mission’s Debut
• January 2, 2019: The Surface Water and Ocean Topography mission will begin by scanning Earth’s surface once a day. We invite ocean scientists to contribute ground-based measurements to compare with the satellite data. 67)
Sea level is sea level, no matter where you go, right? Not necessarily. The Moon’s gravitational pull, ocean currents, melting glaciers, and a host of other factors ripple and distort the surfaces of the world’s oceans. Water levels in lakes, rivers, reservoirs, and other inland bodies are constantly changing as well, in response to floods, droughts, and human water use.
The SWOT (Surface Water and Ocean Topography) satellite mission, launched in December 2022, will map the elevation of water surfaces on Earth at a resolution that has not been possible before. This mission aims to improve estimates of sea surface elevations and the volumes of water stored in lakes, reservoirs, wetlands, and rivers around the world.
SWOT is scheduled to map the entire globe between 78° north and south latitude over the course of 3 years. Before it settles into its main orbit, covering Earth’s surface every 21 days, the first 90 days of the mission will be flown in a “fast-sampling” phase, revisiting each area once daily.
We are inviting members of the international ocean science community to participate in this unique fast-sampling phase. We encourage you to create programs to deploy in situ assets in the regions covered by the SWOT fast-sampling orbit to provide a global series of experiments with fine-scale ocean campaigns, as well as ground-based data for comparison with SWOT’s daily 2D sea surface height data.
A High-Resolution Look at the World’s Oceans
Today’s multimission satellite altimeter maps show sea level undulations, from large eddies up to basin-scale or global variations. We cannot resolve the smaller eddies with diameters less than 75 km because their signal gets lost in the noise. These unresolved 75-km-wide eddies have a spectral wavelength of 150 km; this defines the minimum spatial wavelength that we can resolve today.
SWOT will rely on a satellite altimeter that will use radar interferometry to make high-resolution (~2 km) measurements over two 50 km-wide swaths of water at once (see Figure 53), with a conventional nadir altimeter in the gap in between.
This new SWOT measurement will extend the two-dimensional resolution of ocean surface topography down to between 15 and 45 km in wavelength, detecting small eddies with diameters of 7 to 20 km, depending on ocean surface conditions. This advance will offer researchers new opportunities to study the oceanic dynamic processes at these scales over the global oceans. 68)
SWOT aims to bring new insight into ocean processes at scales of 15–150 km in wavelength that have typical temporal scales of hours to weeks. A number of dedicated local in situ campaigns have provided insight into these rapidly evolving submesoscale dynamics (e.g., the Lateral Mixing Experiment (LATMIX), Ocean Surface Mixing, Ocean Sub-mesoscale Interaction Study (OSMOSIS)) and the internal wave dynamics (e.g., internal wave experiment (IWEX), Ocean Storms). Globally, our current knowledge on the fine scales is largely based on untested simulations of high-resolution circulation models. SWOT will address this observational gap and provide an unprecedented opportunity to study the surface signature of these motions and their interactions.
These fine-scale processes are important in the generation and dissipation phases of ocean mesoscale eddies, and they provide both sinks and sources for the ocean’s kinetic energy at larger scales. They also act as one of the main gateways that connect the interior of the ocean to the upper layer: The active vertical exchanges linked to these scales may have important impacts on the local and global budgets of heat, carbon, and nutrients. Ocean stirring can be a main controller of oceanic fronts and plankton diversity and thus of the ocean ecosystem services. SWOT is therefore positioned to play a key role in studying the ocean climate system and in biogeochemical cycles. 69)
Internal Tides and Gravity Waves
A major challenge and opportunity offered by SWOT’s fine-scale sea surface height (SSH) observations are to study the interaction of these balanced ocean motions (driven by Earth’s rotation, wind, and buoyancy effects) with the internal tides and internal gravity waves that stir and circulate water beneath the ocean’s surface. Whereas a large part of the internal tide is predictable, the internal wave continuum is not.
Modeling studies suggest that the spatial scales at which balanced motions are clearly separated from internal waves in SSH vary geographically and seasonally. 70) Balanced motions tend to dominate in the middle to high latitudes, and internal waves are prominent in the weakly energetic eastern basins and tropical regions. Adequate observation of these processes made simultaneously with SWOT and in situ systems should allow progress on testing methodologies to separate these two entangled motions and to understand their interactions.
A Quick Look at Short-Lived Events
Given the width of the measurement swath, it will take SWOT 21 days to map Earth’s entire surface at latitudes lower than 78°. (In the Northern Hemisphere, the 78th parallel circles just north of the coasts of North America and Europe; in the Southern Hemisphere, it passes through Antarctica’s coastal regions and the Southern Ocean.)
In its 3-year science orbit, SWOT will loosely cover the global oceans (Figure 1, left) after 10.5 days, then shift westward and fill in the gaps to achieve full coverage after 21 days (Figure 54, middle).
Because of the swath coverage, the number of repeat observations at a given location during the 21-day repeat orbit varies with latitude, from two repeats at the equator to two to four at the midlatitudes to more than six at the high latitudes (Figure 54, right). This rather coarse temporal sampling presents a challenge for the study of the small-scale, rapid ocean processes that have timescales comparable to or shorter than the sampling intervals.
To catch a glimpse of these short-lived processes, the first 90 days of the SWOT science mission will be flown in a fast-sampling phase that revisits specific areas once per day. This phase will begin after a 90-day commissioning phase for engineering checkout and adjustment. Details of the various orbits are available online. The fast-sampling phase (January to March 2022) is intended for process studies with a reduced coverage, providing observations in the Northern Hemisphere winter and Southern Hemisphere summer (Figure 55). SWOT measurements are not impeded by clouds, so the synoptic maps of sea surface height provided by SWOT will track fine-scale circulation features at daily intervals (twice daily at crossovers) during this fast-sampling phase.
Comparing Snapshots from Earth and Space
The speed of SWOT’s measurements poses a challenge to researchers attempting to compare the mission’s results with in situ measurements from the surface: SWOT will cover a distance of 150 km in about 20 seconds, providing a nearly instantaneous snapshot of SSH over a 120 x 150 km area. In order to disentangle the substantial contributions of high-frequency motions (such as internal waves) to SSH, we need to observe the 2D in situ dynamic height on hourly timescales.
Jinbo Wang et al. 71) presented a basic design of an in situ observing system involving an array of 20 station-keeping underwater gliders to determine hourly dynamic height over scales of 15 to 150 km. Alternatives are to use moorings for continuous sampling, combined with fast underway CTDs (instruments that measure electrical conductivity, temperature, and depth), gliders, or profiling floats. To characterize the ocean pressure and velocity field in four dimensions (three spatial dimensions and time), we would need more in situ assets. SWOT’s fast-sampling phase will also open opportunities for designing in situ adaptive sampling strategies.
Although SWOT’s 2D radar interferometric technique will reduce the measurement error by more than an order of magnitude compared to today’s 1D along-track altimetry missions, SWOT’s actual spatial resolution will vary spatially and temporally, depending on the relative strength of ocean signals and the magnitude of measurement errors. Studies have predicted that SWOT’s resolution may approach 35–45 km in low-energy regions or in high surface wave regions.
Coupling Data Sources Yields Big Payoffs
Since the SWOT measurement performance and the oceanic fine-scale signals vary geographically and seasonally, our understanding of the oceanic variability at 15- to 150-km scales would greatly benefit from in situ observations made at different locations during the 90-day fast-sampling phase. Such an ambitious undertaking can be accomplished only through coordinated international campaigns and contributions. The payoff would be tremendous in advancing our understanding of the key fine-scale dynamics of the ocean governing the energy budget and the biophysical processes of the ocean circulation, as well as its role in the climate system.
Diverse in situ deployments covering multiple crossover regions during the 1-day fast-sampling phase would help unravel the complicated dynamic processes contributing to these SWOT SSH snapshots to achieve a truly global fine-scale ocean dynamics experiment.
We encourage the international ocean science community to join us in this unique opportunity by deploying in situ assets in different regions covered by the SWOT fast-sampling orbit. Such in situ efforts would require external funding, but the SWOT mission would enthusiastically welcome these collaborative validation efforts. These projects could be proposed in coordination with the mission’s next Science Team (NASA’s Research Opportunities in Earth and Space Science and Centre National d’Etudes Spatiales’ Terre, Océan, Surfaces Continentales, Atmosphère will issue a request for proposals in February 2019, with selection in late 2019). The next Science Team starts in 2020, about 1 year prior to the mission’s launch (nominally October 2021).
The preliminary science data from the SWOT mission will be made available to the mission’s science team in a timely manner during the fast-sampling phase to facilitate comparisons of the in situ observations with SWOT observations. The in situ results will contribute to the initial calibration and validation of the mission observations, as well as to SWOT’s Adopt a Crossover global experiment on fine-scale ocean processes. We encourage interested ocean scientists to contact any of the authors listed in Ref. 67) for further information.
A Bigger, Better Picture
- SWOT will provide its game-changing data using a new instrument called the Ka-band Radar Interferometer (KaRIn), which bounces radar pulses off the water’s surface and receives the return signal with two antennas at the same time. The antennas are spaced 33 feet (10 m) apart on a boom, enabling researchers to gather information along a roughly 75-mile-wide (120-kilometer-wide) swath of Earth’s surface – a wider path than that of the satellite’s predecessors.
- The engineering required for this kind of system is tricky because such a large antenna boom requires incredible stability, and because researchers need very precise calculations to produce measurements of Earth’s ocean and freshwater bodies. Satellites already in orbit can measure water height – in the ocean, very large lakes, and very wide rivers – or the surface area of a water body. But to calculate changes in volume over time, scientists need to match up the extent and height measurements that different instruments took on different days. This makes it difficult to determine basic details, like how much water flows through the world’s rivers and how much that volume varies.
- SWOT will eliminate the need to cobble together the extent and height information from different satellites, and at the same time the satellite will give researchers a global view of Earth’s surface water. Some studies, including one published last year in Nature, have used water level measurements to look at how lakes and rivers around the world change over time. However, the data that researchers expect from SWOT will provide a better understanding of water levels and surface area, both of which will be sampled more frequently and over a greater area of Earth. Once in orbit, SWOT will be sending back about one terabyte of unprocessed data a day.
Thinking Small
- Existing satellites can’t detect smaller-scale currents and eddies, limiting research into how those features interact with each other and with larger-scale flows.
- In addition to helping researchers study the climate impacts of small currents, SWOT’s ability to “see” smaller areas of Earth’s surface will allow it to collect more precise data along coastlines, where rising ocean levels and the flow of currents can have immediate impacts on land ecosystems and human activity.
- Higher seas, for example, can cause storm surges to penetrate farther inland. Also, currents intensified by sea level rise may increase saltwater intrusion into deltas, estuaries, and wetlands, as well as groundwater supplies.
- So how will measuring ocean height lead to better knowledge of currents and eddies?
- Researchers use height differences between points – known as the slope – to calculate the motion of currents. The math accounts for the force of Earth’s gravity, which pulls water from high to low, and the planet’s rotation, which, in the Northern Hemisphere, bends the flow clockwise around high points and counterclockwise around low points. The effect is the opposite in the south.
- Systems of currents hundreds of miles wide flow around broad expanses of the ocean. Along the way, smaller currents and eddies spin off and interact with one another. When they come together, they drive water from the surface downward to colder depths, taking along heat and carbon from the atmosphere. When those smaller currents and eddies flow apart, water from those colder depths rises to the surface, ready to absorb heat and carbon again.
- This vertical movement of heat and carbon also occurs at eddies themselves. In the Northern Hemisphere, clockwise eddies generate downward flows, while counterclockwise eddies create upward flows. The reverse occurs in the Southern Hemisphere.
Testing Phase
- The next six months or so will involve three phases of testing to make sure the satellite will be able to survive the rigors of launch and the harsh environment of space. Engineers and technicians will attach the satellite to a device called a shake table, which simulates the intense vibrations and rattling of launch. Then the spacecraft will move into an acoustic chamber to bombard it with high-decibel sounds similar to those of blastoff. Next, they’ll move SWOT into a chamber that mimics the temperature swings and vacuum of space. Last but not least, engineers will put the satellite through additional tests to make sure its systems can withstand any electromagnetic interference, including signals from various parts of the spacecraft and from other satellites.
- The mission’s science team is also in full swing, preparing for when the spacecraft is in orbit. Researchers are using simulated data to put their analytic tools through their paces, as well as prepping for the period right after launch called “calibration and validation.” This is when researchers compare data from the satellite with measurements taken on the ground in order to ensure the science instruments are collecting data properly and measuring what they’re supposed to be measuring. The international nature of the mission means that, like the engineering team, the science team spans continents.
Mission Status
• July 21, 2023: The SWOT mission operations teams completed several propulsive maneuvers to reposition the spacecraft into its final 21-day repeat orbit to start the global mapping science phase. The project teams successfully configured the KaRIn and Nadir instruments for science operations and re-started the Nadir data product processing.
The release of the O/I(GDR) Nadir Altimeter and radiometer science data products will resume by the end of August 2023 after some validation activities. 79)
• July 20, 2023: In mid-June, a team of freshwater researchers spent their nights drifting down Alaska’s Yukon River in an area that straddles the Arctic Circle. The hydrologists were using a GPS unit installed on their boat to measure the slope of the river at the same time that the Surface Water and Ocean Topography ( SWOT ) satellite passed overhead, collecting its own data on the waterway.
The midnight rendezvous was part of a larger effort by ocean and freshwater scientists to validate the measurements from the recently launched spacecraft, which begins science operations Tuesday, July 25. 78)
• March 17, 2023: SWOT satellite’s main scientific instrument – the Ka-band Radar Interferometer (KaRIn) – returned to regular commissioning activities. Following the shut off in late January, the team worked to analyze the situation and developed a plan to restore operations utilizing a backup KaRIn power unit. The backup unit was chosen to expedite the restoration of operations and to minimize overall risk to the mission.
The mission continues to monitor KaRIn, as well as overall operations, as it progresses with commissioning, calibration, and validation activities to ensure the performance of SWOT’s systems and science instruments in preparation for the planned start of science operations in July 2023. 77)
• February 23, 2023: After launching in December 2022, the international Surface Water and Ocean Topography (SWOT) mission started commissioning activities – the six-month checkout period before the scientific mission began. Commissioning has included turning on all the science instruments, among them the main science instrument, the Ka-band Radar Interferometer (KaRIn), which engineers fully powered on in mid-January 2023. They received performance information, but in late January one of the instrument’s subsystems – the high-power amplifier – was unexpectedly shut down due to a problem with the high-power amplifier subsystem. Once the KaRIn instrument was up and running again, the mission continued with its commissioning and calibration activities, planned from March through June, to ensure data accuracy in preparation for the beginning of science operations in July 2023. 76)
• December 16, 2022: SWOT was launched into orbit aboard a Falcon 9 launch vehicle.
• July 22, 2022: The Surface Water and Ocean Topography mission will make measurements of over 95% of Earth’s lakes, rivers, and reservoirs. 24)
- SWOT has several key tasks, including measuring the height of water bodies on Earth’s surface. Over the ocean, the satellite will be able to “see” features like eddies less than 60 miles (100 km) across – smaller than those that previous sea level satellites could observe. SWOT will also measure more than 95% of Earth’s lakes larger than 15 acres (6 hectares) and rivers wider than 330 feet (100 m) across. Along with measuring the water height – whether it be in a lake, river, or reservoir – SWOT will also measure its extent or surface area. That crucial information will enable scientists to calculate how much water moves through freshwater bodies.
• May 11, 2022: The Surface Water and Ocean Topography mission will explore how the ocean absorbs atmospheric heat and carbon, moderating global temperatures and climate change. 25)
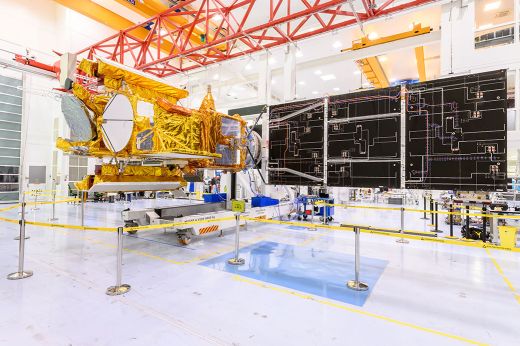
• November 18, 2021: The Surface Water and Ocean Topography spacecraft enters the home stretch as an international team prepares this next-generation satellite for launch in 2022. 26) An international team of engineers and technicians has finished assembling a next-generation satellite that will make the first global survey of Earth’s surface water and study fine-scale ocean currents. The Surface Water and Ocean Topography (SWOT) mission is just a year out from launch, and the final set of tests on the spacecraft has started.
• June 30, 2021: Set for launch next year, the Surface Water and Ocean Topography mission will help scientists monitor Earth’s ocean, as well as the amount of fresh water in its lakes and rivers. 27)
- The SWOT mission took a big step toward launch this week when a team at NASA’s Jet Propulsion Laboratory in Southern California shipped the scientific heart of the satellite to France. A U.S. Air Force C-17 airplane carrying the hardware – which includes finely tuned research instruments – left March Air Reserve Base in Riverside County, California, on June 27. It arrived on June 30, at Thales Alenia Space clean room facility near Cannes, France, where engineers and technicians will spend the next year integrating the hardware with the rest of the satellite.
- The information SWOT will provide on small-scale ocean currents will also support real-time ocean activities like shipping that are affected by tides, currents, storm surges, and other natural phenomena. And SWOT data will provide, for the first time, global observations of how circular currents, called eddies, affect how the ocean stores heat and releases it into the atmosphere, as well as how carbon moves through the marine environment.
• May 06, 2021: Targeting a late-2022 launch date, SWOT an SUV-size satellite will measure the height of Earth’s water. SWOT will help researchers understand and track the volume and location of water – a finite resource – around the world, making NASA’s first truly global survey of the planet’s surface water. 28)
- But before the mission can do all that, engineers and technicians need to finish building the spacecraft. The payload that will carry the science instruments for this hefty satellite is taking shape in a clean room at NASA’s Jet Propulsion Laboratory in Southern California, where rigorous testing is underway. Then in late June, it travels to France, where engineers and technicians from the French space agency CNES (Centre National d’Etudes Spatial), their prime contractor Thales Alenia Space, and JPL will complete the build and prepare the satellite for shipment to its California launch site at Vandenberg Air Force Base.
• June 5, 2018: TAS (Thales Alenia Space) of Cannes (France) announced that, following the successful CDR (Critical Design Review) at the end of 2017, right on schedule, it has reached major new milestones in the construction of the oceanography satellite SWOT (Surface Water and Ocean Topography), backed by a number of innovative small and medium-sized businesses. 29 The SWOT satellite is being built by Thales Alenia Space in conjunction with the Jet Propulsion Laboratory (JPL) of the United States, on behalf of the French and American space agencies, CNES and NASA. The SWOT oceanography program will demonstrate new applications. It is a follow-on to the Jason-1, -2 and -3 operational missions. The SWOT satellite is a pathfinder that will incorporate innovative new altimetry technologies.
- TAS chose STEEL ELECTRONIC to make a mass memory, a key electronic component in the satellite. Another Toulouse-based company, EREMS, also took an active role in this program, along with TAS in Belgium: it supplied the RTU (Remote Terminal Unit), an electronic unit that interfaces with most other equipment on the satellite. The SWOT program performs a two-pronged mission, encompassing oceanography and hydrology. For oceanography, the satellite will take measurements of the ocean surface and ocean wave height, with better resolution than on the Jason family of satellites. The SWOT payload comprises two subassemblies, KaRIn (Ka-band Radar Interferometer), a new-generation interferometry type altimeter, and the NADIR module. Thales Alenia Space, the world leader in space altimetry, is developing the RFU (Radio Frequency Unit) for KaRIn, and the Poseidon dual frequency altimeter for the NADIR module.
• January 16, 2017: CSA (Canadian Space Agency) awarded a $3.8M contract to CPI (Communications & Power Industries, Canada) to build components for the SWOT (Surface Water and Ocean Topography) mission.
• October 2016: The SWOT mission has progressed to Phase C of its development. The mission is now working on final design and fabrication. The top priorities during this phase included the completion of the plans for the mission’s calibration and validation and the development of science algorithms. In hydrology, the key objectives were to develop river discharge models, the effects of layover, and the wetland data product definition. The key oceanographic objectives include the effects of internal gravity waves and surface gravity waves on sea surface height observations, the development of tide models, and the utilization of high-resolution ocean models for developing science investigation plans. 30)
• July 12, 2016, TAS (Thales Alenia Space) announced the start of the SWOT satellite (Surface Water and Ocean Topography) production phase, of KaRIn (Ka-band Radar Interferometer) the altimeter’s heart, as well as Poseidon 3C radar altimeter, during a ceremony taking place at French space agency CNES (Centre National d’Etudes Spatiales). 31)
• April 18, 2016: NASA/JPL awarded a contract to Airbus DS to supply its highest-precision FOG (Fiber Optic Gyro) unit for the SWOT mission. The gyro will be integrated at the heart of the KaRIn (Ka-band Radar Interferometer) instrument. Airbus Defence and Space’s Astrix® family of Fiber Optic Gyros supplies very high accuracy rotation rate data with extremely low noise, crucial for space systems stabilization, pointing, and attitude control. Developed in cooperation with iXSea, the state-of-the-art Astrix® products provided some of the highest performances on the market. 32)
• September 29, 2015, CNES contracted with TAS to build a next-generation radar altimeter for the billion-dollar U.S.-French SWOT (Surface Water Ocean Topography) mission to launch in 2020. Under the contract, TAS would deliver SWOT’s Poseidon-3C nadir altimeter. 33)
• September 2014: The SWOT mission was being jointly developed by NASA and CNES, with contributions from CSA (Canadian Space Agency) and UKSA (United Kingdom Space Agency). The SWOT mission, along with the airborne concept validation project, AirSWOT, would provide valuable data and information that would benefit society in two critical areas; freshwater on land, and the oceans’ role in climate change. It would fulfill important observations of the amount and variability of water stored in global lakes, reservoirs, wetlands, and river channels and would support derived estimates of river discharge. SWOT would also provide critical information necessary for water management, particularly in international hydrological basins. 36) 37)
• August 18, 2014: The Canadian government announced, that Canada, via CSA (Canadian Space Agency), was investing in Canadian innovation that would play a key role in the first-ever global survey of surface water. CPI Canada ( Communications and Power Industries Canada Inc.) of Georgetown, Ontario, would develop the EIK (Extended Interaction Klystron), a satellite radar component that will generate pulses used to gather surface information. 38)
• May 2, 2014: NASA and CNES have agreed to jointly build, launch, and operate a spacecraft to conduct the first-ever global survey of Earth's surface water and to map ocean surface height with unprecedented detail. NASA Administrator Charles Bolden and CNES President Jean-Yves Le Gall signed an agreement at NASA Headquarters in Washington to move from feasibility studies to implementation of the SWOT mission. The two agencies began initial joint studies on the mission in 2009 and plan to complete preliminary design activities in 2016, with a launch planned in 2020. 39) 40)
- This new agreement covers the entire life cycle of the mission, from spacecraft design and construction through launch, science operations, and eventual decommissioning. NASA will provide the SWOT payload module, the KaRIn (Ka-band Radar Interferometer) instrument, the Microwave Radiometer (MR) with its antenna, a laser retroreflector array, a GPS receiver payload, ground support, and launch services. CNES will provide the SWOT spacecraft bus, the KaRIn instrument’s RFU (Radio Frequency Unit), the dual frequency Ku/C-band Nadir Altimeter, the DORIS (Doppler Orbitography and Radiopositioning Integrated by Satellite) receiver package, satellite command and control, and data processing infrastructure.
- SWOT would be able to measure the ocean's surface with 10 times the resolution of current technologies. This will allow scientists to study small-scale features that are key components of how heat and carbon are exchanged between the ocean and atmosphere. The higher resolution of SWOT observations also will enable researchers to compute the velocity and energy of ocean circulation. A better understanding of small-scale ocean currents and eddies is also important to impacts on coastal regions such as navigation, erosion and dispersing pollutants.
Sensor Complement
KaRIn (Ka-band Radar Interferometer)
SWOT's main instrument is KaRIn, a bistatic SAR system in Ka-band. The interferometric altimeter is a near-nadir viewing, 100 km wide-swath interferometric SAR (consisting of two separated 50 km swaths). The instrument concept uses two SAR antennas at opposite ends of a 10 m boom coupled to a nadir SAR to measure the highly reflective water surface. Interferometric processing of the returned pulses yield single-look 5 m azimuth and 10 m to 70 m range resolution, with an elevation accuracy of about ±50 cm. Polynomial based averaging increases the height accuracy to about ±3 cm. The entire globe is covered twice every 16 days. 44) 45) 46) 47) 48) 49) 50) 51) 52) 53)
The KaRIn measurement concept has a rich heritage based on:
1) The many highly successful ocean observing radar altimeters (ERS-1, TOPEX/Poseidon, ERS-2, Jason-1, Envisat, Jason-2, etc.)
2) The SRTM (Shuttle Radar Topography Mission) - the 11-day mission took place in the period Feb. 11-22, 2000. Obviously, this short Shuttle mission could not provide multi-temporal observations over long periods of time. The mission objective was to obtain single-pass interferometric SAR imagery in C-band and X-band for DEM generation. SRTM used incidence angles of 30º - 60º. Although C-band yields some returns from the water surface, X-band produces returns everywhere. SRTM is the only mission to produce image-based elevation measurements of water surfaces. - Changing to Ka-band and 1º - 3º incidence for SWOT, should provide returns over all water surfaces.
3) The development effort of WSOA (Wide Swath Ocean Altimeter) by NASA/JPL (however, the WSOA option for ocean monitoring was dropped from the Jason-2/OSTM spacecraft in the spring of 2005 because of concerns about programmatic risk to the core Jason-2/OSTM mission and due to cost overruns). WSOA would have provided high-resolution measurements of SSH (Sea Surface Height) on approximately a 10 km grid across a 200 km swath centered on the satellite ground track.
The KaRIn instrument covers near-nadir swaths (0.6-4.1º incidence angle) on both sides of the satellite track. There are relatively few reports on backscattering from natural surfaces in Ka-band, especially in near-nadir, and they are generally limited with respect to the surface types taken into account, and the number and range of associated parameters (local incidence angle, soil humidity and roughness, water salinity, wave height, etc.).
Interferometric near-nadir Ka-band acquisitions were realized during an airborne campaign in the Camargue area in Southern France in 2011. To the knowledge of the project, these are the very first interferometric acquisitions realized in this particular configuration, including the incidence range of KaRIn on SWOT (0.6-4.1º). Several scene types were covered, including ocean (Mediterranean), a coastal area (Piemanson), a lagoon (Vaccarès) and a hydrology site (the Rhône river south of Arles). Extensive ground truth were collected. 54) 55) 56) 57) 58)
Legend to Figure 49: SSH error spectrum (red curve) as a function of spatial frequency. Shown, for reference is the SSH spectrum for a reference Jason pass (pass 132) (jagged line). Also shown as the solid black line is the expected spectral continuation. The intersection of the spectral signal with the noise floor at 15 km determines the resolving capabilities for the SWOT instrument. As can be seen, instrument noise dominates the Jason signal for wavelengths smaller than ~100 km.
Integrated Measurement Approach
SWOT utilizes an integrated measurement approach, which includes the KaRIn system to observe in two off-nadir swaths, each of 50 km. KaRIn produces ocean and surface water heights and -co-registered weather imagery and elevations of 50 m and 1 km resolutions for hydrology and ocean communities, respectively. KaRIn includes an experimental nadir channel, either as a NNI (Near-Nadir Interferometer), or as a KNA (Ka-band Nadir Altimeter). The NNI is baselined. Both provide complimentary measurements to KaRIn and to support calibration and validation. The CNES-supplied Jason-heritage nadir altimeter specifically addresses SSH for long spatial wavelengths. The Jason-heritage microwave radiometer corrects the nadir altimeter range measurements for wet tropospheric delay and the GPS and DORIS receivers, with the LRA(Laser Retroreflector Assembly), provide precision orbit determination. The integrated measurement approach is illustrated in Figure 19 (Ref. 41).
KaRIn instrument: KaRIn is the primary instrument used to measure the swath of ocean and fresh water elevations. The instrument concept and core technologies for KaRIn were originally developed from NASA's ESD (Exploration Systems Development) efforts in the 2000's to develop the WSOA (Wide Swath Ocean Altimeter), a Ku-band centimeter-level precision concept for ocean observing that was developed to a substantial level of maturity, but deferred due to budgetary constraints. It demonstrated through hardware prototypes the ability to build very stable mechanical structures, phase stability, and ocean onboard processing directly relevant to the SWOT KaRIn instrument (Ref. 41).
The KaRIN instrument is expected to have a mass of ~294 kg, an orbital average power of ~ 810 W, and an average data rate of ~ 271 Mbit/s over land and ~ 3 Mbit/s over the ocean with onboard data processing. The overall size is: 3.0 m x 2.8 m x 2.8 m in stowed configuration, and 5.0 m x 10.6 m x 1.5 m in deployed configuration. KaRIn will use two graphine composite deployment masts attached to a central metering structure which also incorporates the antenna feeds. At the tip of each mast is a reflectarray support truss structure with two deployable wings. The configuration also takes advantage of the large transmit power (~1.5 kW) from the swath antennas to add receive channels pointing slightly off-nadir to eliminate the interference nadir gap to ±4 km and implement a synthetic aperture nadir altimeter, the NNI (Near Nadir Altimeter). The instrument detail, deployable reflectarray antenna, and the science mode of operations are illustrated in Figures 20, 21, and 17, respectively.
Center frequency | 35.75 GHz |
Tx bandwidth, Tx pulse width | 200 MHz, 4.5 µs |
PRF (Pulse Repetition Frequency) | 2 x 4420 Hz (average) |
Peak transmit power (EOL) | 1500 W |
Physical baseline length | 10 m |
Antenna size | 5 m x 0.25 m |
Boresight look angle | ±2.7º |
Polarization, right swath | VV |
Polarization, left swath | HH |
A precision deployable prototype Mast (10 m in length) for the KaRIn instrument is being developed and tested at NASA/JPL. 60)
The KaRIn instrument is complemented with the following suite of instruments (Ref. 53):
1) A dual-frequency (C- and Ku-band) Nadir Altimeter, similar to the Poseidon altimeter flown on the Jason series
2) A three-frequency microwave radiometer, similar to the AMR (Advanced Microwave Radiometer) flown on the Jason series
3) A DORIS receiver, a GPS receiver, and a LRA (Laser Retroreflector Array) for POD (Precise Orbit Determination).
Instrument technology readiness: The SWOT instruments, aside from KaRIn, are based on mature technologies derived from the Jason series altimetry missions and other projects. The dual-frequency nadir altimeter is based on an evolution of the Jason Poseidon-3 instrument and/or a design based on the SIRAL (SAR/Interferometric Radar Altimeter) flown on the CryoSat-2 mission of ESA (European Space Agency). Similarly, the three frequency microwave radiometer is of Jason series heritage. The GPSP and DORIS POD receivers are from existing product lines at Broad Reach Engineering and TAS (Thales Alenia Space). The LRA is a build to point copy of those used on the Jason series of spacecraft. The KaRIn instrument contains several technology development items. These are the RFU, the HPA (High Power Amplifier), the KaRIn digital electronics subsystem, and the reflectarray antenna. Their TRLs (Technology Readiness Levels) currently (2012) range from 3 to 5. All of these instrument areas will reach TRL 6 by the KaRIn PDR (Preliminary Design Review), scheduled for mid 2015, following a detailed and rigorous technology development plan. Fall-backs, using existing mature technologies, have been identified. Otherwise, 80% of the components within the instrument assembly require no new technology (Ref. 41).
Nadir Altimeter
The nadir (Earth-facing) altimeter instrument measures the height of water on Earth’s surface in a narrow strip directly below the satellite, between the swaths the KaRIn instrument observes.
Provided by CNES and used on previous ocean-observing satellites, including the Jason series of spacecraft, the altimeter beams radio signals to the water’s surface and measures how long the reflected signal takes to return to a receiver. 74)
This instrument builds upon the dual-frequency Poseidon family of altimeters that trace their roots to the TOPEX/Poseidon mission launched in 1992.
The Poseidon family of altimeters was developed and built by Thales Alenia Space.
AMR (Advanced Microwave Radiometer)
Water vapor affects the propagation of radar signals from the KaRIn and nadir altimeter instruments, causing the water level they’re measuring to appear higher or lower than it actually is. The microwave radiometer instrument provides water vapor measurements used to correct this effect. It uses heritage technology employed on the Jason-3 mission, pointing two measurement beams in between the two KaRIn swaths. NASA JPL provided this instrument.
Precise Orbit Determination Package
Precisely determining the position of the SWOT spacecraft in orbit is critical when collecting measurements. To do this, SWOT carries a state-of-the-art precise orbit determination instrument package. Each of the package’s three science instruments uses a different approach to provide tracking measurements of SWOT’s position.
The measurements are then used to determine the 3D position and speed of the satellite. The instruments include:
Doppler Orbitography and Radiopositioning Integrated by Satellite (DORIS): The DORIS instrument measures the radio signals from 50 to 60 global ground stations that compose the International DORIS Service. Each ground station acts as a beacon to broadcast two stable radio frequencies at 2036.25 megahertz (S-band) and 401.25 megahertz (VHF).
SWOT’s DORIS instrument measures the Doppler shift of the radio beacons’ frequencies to ultimately determine the satellite’s position. CNES provided this instrument and it was built by Thales Alenia Space.
Laser retroreflector array (LRA): LRA consists of nine precisely shaped mirrors located on the spacecraft’s Earth-facing side. Ground-based laser-ranging stations send laser beams to the satellite’s LRA mirrors, which reflect them back to the stations. By measuring how long it takes the laser beams to return to Earth’s surface, engineers can determine the distance between the spacecraft and the station.
NASA JPL provided this instrument.
Global positioning system (GPS) receiver: The GPS receives tracking signals transmitted by GPS satellites orbiting Earth. The instrument uses these signals to determine the distance between the spacecraft and the GPS satellites.
NASA JPL provided this instrument. 75)
Ground Segment
The ground segment architecture integrates all of the functions required to completely support mission operations. These elements provide various services: mission planning, sequence generation, station scheduling, spacecraft analysis, orbit determination, trajectory analysis and planning, maneuver design, instruments analysis, time correlation, data capture and distribution, science data gap reporting, generation of products for science support, as illustrated in Figure 55.
Spacecraft communication services will be provided by CNES Network Operation Center. SWOT will benefit from the CNES new multimission capabilities of ISIS (Initiative for Space Innovative Standards) for Spacecraft Command and Control, currently under development for future CNES missions.
JPL and CNES will provide engineering monitoring and commands for operating their respective instruments. Science data will be transmitted via X-band, while engineering telemetry and uplink data will be communicated via S-band, to the CNES provided Ground Station Network. There will be one pass per orbit of Inuvik/ Kiruna & Aussaguel Stations including Kiruna / Aussaguel overlapping plus one pass per day on HBK (Hartebeesthoek), South Africa. Each pass is relatively short in duration, less than 10 minutes. The spacecraft will downlink raw science data at a rate of 620 Mbit/s . Once the science data is downlinked to the ground, it is delivered to the SDS (Science Data System) at JPL and CNES.
Amongst the many key challenges to the SDS is the large data volume with an average production volume of 7 Tbit/day acquired by the Payload, and the consequent huge volume of data products produced (on the order of 23 PB for 3 years of operation). JPL and CNES have reached an initial agreement to jointly develop and operate the science data system using common data processing flow and interfaces, but each institution will develop their own unique data production and distribution system.
Element | Description |
Tracking Stations | - CNES S‐band stations: Downlink for spacecraft engineering. Uplink commanding |
Front End Networks | - Networks to/from CNES S-band stations to CNES (contractor) spacecraft operations center |
Spacecraft Control Center (SCC, CNES spacecraft contractor) | Real time monitoring of spacecraft and payload via S-band housekeeping telemetry |
Payload Operations Centers (POC) | - JPL: NRT (Near Real Time) health monitoring of KaRIn, GPS, Radiometer |
Science Processing Centers | - JPL: Processing of KaRIn and associated data, POD |
Data Archiving and Distribution Centers | - JPL: NASA-specified archive center (PO.DAAC) |
Project Data Distribution Networks | - JPL‐CNES link |
The SWOT science data products will include ocean, hydrology, and enhanced hydrology higher level products in addition to level 1 products. These data products will be processed in a coordinated fashion by the NASA and CNES SDSs (Science Data processing Centers) and distributed to the NASA PO.DACC (Physical Oceanography Data Active Archive Center) and the CNES AVISO (Archivage, Validation et Interprétation des données des Satellites Océanographiques) systems for distribution to scientific and other users.
Data product | Description | Initial data delivery to PO.DAAC* |
Level 1 | KaRIn, altimeter and radiometer sensor and ancillary data | Commissioning + 7 mos. |
Level 2 Ocean | Maps of sea surface height, slope, height uncertainty, and backscatter | Commissioning + 7 mos. |
Level 2 Hydrology | Surface water height, slope with uncertainties, water classification masks | Commissioning + 7 mos. |
Level 2 enhanced hydrology | Global river discharge estimates**, floodplain height map (annual update) *** | Commissioning + 12 mos. |
* The terminology “Commissioning+ x mos.” is understood to mean x-months after the completion of the Commissioning Phase | ||
The SWOT NASA mission will study the global oceans at unprecedented temporal and spatial scales and provide unique insight into global terrestrial surface waters, including lake level height and river discharge volume. It is an international partnership involving the French space agency, CNES, and CSA (Canadian Space Agency). CSA is supporting the development of a sophisticated EIK (Enhanced Interaction Klystron) that will be at the heart of the interferometric radar instrument, KaRIn, on the SWOT mission.
An airborne version of SWOT, called AirSWOT, has been developed at NASA/JPL to provide calibration and validation for the mission when on orbit as well as to support science and technology during mission development. The first AirSWOT science flights will start in 2013. 72)
BUSARD Campaign of CNES/ONERA
To support SWOT and future altimetry space missions at Ka-band, an airborne measurement campaign has been realized under CNES funding, involving the ONERA BUSARD motorglider platform equipped with the DRIVE radar. The particularity of this experiment is the line of sight geometry, with very steep incident angles, along with a SAR/XTI (SAR/Cross Track Interferometry) configuration.
Airborne Campaign
The objective of this airborne campaign was to acquire XTI radar data representative of future InSAR data from KaRIn, in order to validate simulation results over a large selection of surfaces (from inland, coastal and sea areas). Particular attention has been paid on contrast evaluation between water and coastal backscattering levels. 73)
Center frequency | 35 GHz |
Bandwidth | 400 MHz |
PRF (Pulse Repetition Frequency) | 2 kHz |
Altitude of BUSARD glider | 3 km |
Antenna aperture | 4º x 27º |
Slant range resolution | 30 cm |
One validation and five measurement flights (2011) have been realized in the frame of this campaign, with an altitude around 3000 m. The project focused on the 0 to 5° incident angles range flying over different types of surfaces. The areas of interest for those campaigns, mainly dedicated to water surface measurements, were located in the Camargue region in South of France. This region is well-known for including a large number of ponds and marshlands.
During this campaign, a Ka-band radar dataset has been recorded on dry, wet soils and sea surfaces with different wind conditions: null wind, low wind (about 10 km/h) and medium wind (about 30 km/h). The main areas of interest were the Vaccarès lake (Figure 57), the Rhône river (Figure 59), the Piemanson coastal area (Figure 61), and an area over the open sea.
Ground Truth Collection and Data Calibration
In parallel to the radar data airborne recording an exhaustive ground truth data collection has been performed. More than three thousand pictures have been taken from an onboard camera whose line of sight is similar to the radar one, and more than one hundred pictures have been taken at ground level, with geometrical and temporal references. The locations of the trihedral reflectors, used for the calibration purposes, have been accurately measured by a partner (this information is of primary interest for SAR data processing). These pictures have been used to document the sea states during the flights, and to identify vegetation on ground.
In addition to the ground truth data collection, a particular attention has been paid to data calibration. Applying a fine calibration was a key point as these experiments aimed at getting accurate estimation of water surface backscatter coefficient. The dedicated calibration scheme used was based on three main steps:
1) An accurate control of our radar system: The radar sensor was fully characterized at laboratory level to identify precisely transmit and receive channel paths (differential gains). Additional ground tests with trihedral calibrators were done for accurate power budget estimation.
2) In flight calibration process with steep incident angles geometry: Incidence angle was centered at 15°. During the flights, the project used a dedicated calibration area where corner reflectors were installed. The objective of this second step was to determine accurately the calibration coefficients to be applied to the radar data.
3) Data calibration: The project flew over regions of interest and applied calibration coefficients estimated at previous steps.
Backscattering Measurements
The entire radar dataset has been acquired in interferometric condition. This is illustrated in Figure 62 on the Rhône river area of interest. One of the interferometric pair of SAR images is presented in figure (top), the coherence figure is presented in figure (middle), and the interferometric phase is presented in figure (bottom).
In Figure 62 (top), one can notice there is some signal folding phenomenon around the nadir area. This is more particularly visible with signals from the river on the left and right parts of the SAR image. The radar look angle is at the left hand side from the aircraft, and water surface backscattering from the right hand side is mixing with land surface backscattering on those areas. This phenomenon extends from nadir up to about 4° incidence angle.
Figure 62 (middle) is presenting the coherence figure; those areas with folded signals are well observable with some characteristic fringes. In addition, one can observe that coherence level on water is very high, around 0.9, and the forestry area is well observed in the center part of the image even though it was not easy to find it out from the SAR image. The coherence on land and crops is ranging from 0.5 to 0.9.
Finally, Figure 62 (bottom) is presenting the interferometric phase. One can notice that on left / right ambiguities areas, fringes are rotating in opposite directions compared to others and the phase rotation velocity is much higher than the one on the water, for example.
Once calibrated following the previous calibration scheme, the project extracted from the SAR image dataset several backscattering profiles, in terms of sigma 0 (σo) values. This has been done over different surfaces: Forest area, water surfaces from river, lake, marshes and ponds, bare soils and agricultural areas with different kinds of crops. An example of sigma 0 profile is shown in Figure 63.
The backscattering effect close to nadir area is quite high, with a sigma 0 value close to 17dBm2/m2. Then the backscattering is decreasing as a function of the incident angle down to 0dBm2/m2 at 15° incidence angle.
Finally, the power return due to folding mechanism (Figure 62) has been estimated using the strong hypothesis that left/right scatterers are identical. In this case, the precise computation of the illumination pattern on each side can be used to compensate for folding. This hypothesis is the most likely to be valid over water surfaces, which are the areas of main interest in the frame of the measurement series.
References
1) ”NASA SWOT Home,” http://swot.jpl.nasa.gov/
2) Ernesto Rodríguez, “Surface Water and Ocean Topography Mission (SWOT), Science Requirements Document,” NASA/JPL, March 19, 2009, URL: http://swot.jpl.nasa.gov/files/SWOT_science_reqs_final.pdf
3) Lee-Lueng Fu, Douglas Alsdorf, Ernesto Rodriguez, Rosemary Morrow, Nelly Mognard, Juliette Lambin, Parag Vaze, Thierry Lafon, “The SWOT (Surface Water and Ocean Topography) Mission: Spaceborne Radar Interferometry for Oceanographic and Hydrological Applications,” Proceedings of OceanObs'09, Venice, Italy, Sept. 21-25, 2009, URL: [web source no longer available]
4) http://bprc.osu.edu/water/index.php
5) “WatER and ITC: The Proposed Water Elevation Recovery satellite mission,”Symposium: 15 Years of Progress in Radar Altimetry, March 13-18, 2006, URL: http://earth.esa.int/workshops/venice06/participants/865/poster_PosterDost_Venice.pdf
6) V. Enjolras, E. Rodriguez, P. Bates, S. Niemeyer, Ad De Roo, N. Mognard, A. Cazenave, “The WatER Mission in Europe: how can it help science?” Symposium: 15 Years of Progress in Radar Altimetry, Venice, Italy, March 13-16, 2006, URL: http://earth.esa.int/workshops/venice06/participants/788/poster_Venice_water.pdf
7) V. Enjolras, P. Vincent, J.-C. Souyris, E. Rodriguez, L. Phillippou, A. Cazenave, “Performances Study of Interferometric Radar Altimeters: From the Instrument to the Global Mission Definition,” Symposium: 15 Years of Progress in Radar Altimetry, Venice, Italy, March 13-16, 2006, URL: http://earth.esa.int/workshops/venice06/participants/782/paper_782_enjolras.pdf
8) A. Alsdorf, D. Lettenmaier, C. Vörösmarty, “The Need for Global, Satellite-based Observations of Terrestrial Surface Waters,” EOS Transactions of AGU, Vol. 84, No. 29, 22 July 2003, pp. 269-280, URL: http://bprc.osu.edu/water/publications/NASA_SWWG_EOS.pdf
9) Lee-Lueng Fu, Wide-Swath Ocean Altimeter Science Working Group, “Wide-Swath Altimetric Measurement of Ocean Surface Topography,” JPL Publication 03-002, Feb. 2003, URL: ftp://ftp-oceans.jpl.nasa.gov/pub/llf/WSOAreportFinal2.pdf
10) N. Mognard, D. Alsdorf, E. Rodriguez, “WatER: The proposed Water Elevation Recovery satellite mission,” Symposium: 15 Years of Progress in Radar Altimetry, Venice, Italy, March 13-16, 2006
11) E. Caubet, N. Steunou, M. Meerman, E. Thouvenot, P. Vincent, “Phase B and breadboard results of the Ka-band altimeter for future micro-satellite altimetry missions,” Proceedings of IGARSS 2003, Toulouse, France, July 21-25, 2003
12) R. J. J. Dost, B. H. P. Maathuis, Z. Su, “ITC and WatER: The Proposed Water Elevation Recovery satellite mission,” Symposium: 15 Years of Progress in Radar Altimetry, Venice, Italy, March 13-18, 2006
13) N. Mognard, D. Alsdorf, E. Rodriguez, “WatER: The proposed Water Elevation Recovery satellite mission,” Symposium: 15 Years of Progress in Radar Altimetry, Venice, Italy, March 13-18, 2006
14) V. Enjolras, E. Rodriguez, “An Assessment of the Ka band Interferometric Radar Altimeter for Monitoring Rivers and Lakes with the WatER Mission,” Proceedings of IGARSS 2007 (International Geoscience and Remote Sensing Symposium), Barcelona, Spain, July 23-27, 2007
15) E. Rodríguez, “SWOT Technology and Expected Performance,” SWOT Hydrology Workshop September 15-17, 2008, The Ohio State University, Columbus Ohio, USA, URL: http://bprc.osu.edu/water/Meetings_WATERHM/SWOT_Hydrology_Sept2008/Presentations/Monday%20SWOT%20As%20Presented/SWOT_OSU_Rodriguez.pdf
16) Lee-Lueng Fu, Douglas Alsdorf, Erensto Rodriguez, Rosemary Morrow, Nelly Mognard, Juliette Lambin, Parag Vaze, Thierry Lafon, “The SWOT (Surface Water and Ocean Topography) Mission: Spaceborne Radar Interferometry for Oceanographic and Hydrological Applications,” March, 2009, URL: http://swot.jpl.nasa.gov/publicationFiles/oceanobs09_swot.pdf
17) Michael Durand, Lee-Lueng Fu, Dennis P. Lettenmaier, Douglas, E. Alsdorf, Ernesto Rodriguez, Daniel Esteban-Fernandez, “The Surface Water and Ocean Topography Mission: Observing Terrestrial Surface Water and Oceanic Submesoscale Eddies,” Proceedings of the IEEE, Vol. 98, No. 5, May 2010, Special Issue: Satellite Remote Sensing: Monitoring Water, Carbon & Global Climate Change, URL: http://ecco2.org/manuscripts/2010/DurandIEEE2010.pdf
19) SWOT Hydrology Workshop, Sept. 15-17, 2008, OSU (Ohio State University), Columbus Ohio, Sponsored by NASA, CNES, JPL, and OSU’s Climate, Water, and Carbon Program, URL: http://bprc.osu.edu/water/Meetings_WATERHM/SWOT_Hydrology_Sept2008/
20) Lee-Lueng Fu, Douglas Alsdorf, Rosemary Morrow, Ernesto Rodriguez, Nelly Mognard, “SWOT: The Surface Water and Ocean Topography Mission - Wide-Swath Altimetric Measurement of Water Elevation on Earth,” JPL Publication 12-05, Feb. 2012, URL: http://swot.jpl.nasa.gov/files/SWOT_MSD_final-3-26-12.pdf
21) Lee-Lueng Fu, ”SWOT: Tracking Water on Earth from Mountains to the Deep Sea,” NASA/JPL, Jan. 6, 2017, URL: http://swot.jpl.nasa.gov/files/swot/Lee-Fu_SWOT_CCS_113016_web.pdf
22) “SWOT mission enters Phase A,” NASA/JPL, Nov. 20.2012, URL: http://swot.jpl.nasa.gov/news/index.cfm?FuseAction=ShowNews&NewsID=29
23) Ernesto Rodríguez, “Surface Water and Ocean Topography Mission (SWOT) - Science Requirements Document,” Initial Release, March 19, 2009, URL: https://web.archive.org/web/20170120054543/http://swot.jpl.nasa.gov/files/SWOT_science_reqs_final.pdf
24) ”US-European Satellite Will Make World’s First Global Freshwater Survey,” NASA/JPL News, 22 July 2022, URL: https://www.jpl.nasa.gov/news/us-european-satellite-will-make-worlds-first-global-freshwater-survey?utm_source=iContact&utm_medium=email&utm_campaign=nasajpl&utm_content=swot-media20220722
25) Andrew Wang , Jane J. Lee, ”International Satellite to Track Impacts of Small Ocean Currents,” NASA Feature, 11 May 2022, URL: https://www.nasa.gov/feature/jpl/international-satellite-to-track-impacts-of-small-ocean-currents
26) Jane J. Lee, Ian J. O’Neill, ”One Year From Launch: US-European Satellite to Track World’s Water,” NASA Feature, 18 November 2021, URL: https://www.nasa.gov/feature/jpl/one-year-from-launch-us-european-satellite-to-track-world-s-water
27) ”Assembly of Satellite to Track World’s Water Shifts From US to France,” NASA/JPL, 30 June 2021, URL: https://www.jpl.nasa.gov/news/assembly-of-satellite-to-track-worlds-water-shifts-from-us-to-france?utm_source=iContact&utm_medium=email&utm_campaign=nasajpl&utm_content=daily20210630-3
28) International Cutting-Edge SWOT Satellite to Survey the World’s Water,” NASA/JPL, 06 May 2021, URL: https://www.jpl.nasa.gov/news/international-cutting-edge-swot-satellite-to-survey-the-worlds-water?utm_source=iContact&utm_medium=email&utm_campaign=nasajpl&utm_content=weekly20210507-4
29) ”Thales Alenia Space takes major steps forward in production of SWOT,” TAS, 5 June 2018, URL: https://www.thalesgroup.com/en/worldwide/space/press-release/thales-alenia-space-takes-major-steps-forward-production-swot
30) Steve Platnick, ”Editor's Corner,” The Earth Observer, September - October 2016. Volume 28, Issue 5, URL: http://eospso.nasa.gov/sites/default/files/eo_pdfs/Sept-October%202016%20color%20508.pdf
31) ”Thales Alenia Space a key player in observation and exploration,” TAS, July 12, 2016, URL: https://www.thalesgroup.com/en/worldwide/press-release/thales-alenia-space-key-player-observation-and-exploration
32) ”Astrix® Fiber Optic Gyro to fly on NASA JPL / CNES mission,” Airbus DS, April 18, 2016, URL: https://airbusdefenceandspace.com/wp-content/uploads/2016/04/news-release-swot-en.pdf
33) Peter B, de Selding, ”Thales Alenia Space Awarded CNES Contract for Ocean Altimetry Instrument,” Space News, Sept. 29, 2015, URL: http://spacenews.com/thales-alenia-space-awarded-cnes-contract-for-ocean-altimetry-instrument/
34) “CNES and Thales Alenia Space sign contract for SWOT program,” CNES, Jan. 6, 2015, URL: http://www.cnes.fr/web/CNES-en/7134-press-releases.php?item=9515
35) Peter B. de Selding, “Thales Alenia Space Nabs $94 Million Contract for U.S.-French Ocean Topography Satellite,” Space News, Jan. 6, 2015, URL: http://spacenews.com/thales-alenia-space-nabs-94-million-contract-for-u-s-french-ocean-topography-satellite/
36) Margaret Srinivasan, Craig Peterson, Alice Andral, Michel Dejus, Faisal Hossain, Jean-Francois Creteaux, Ed Beighley, ”SWOT Applications Plan,” NASA/JPL, September 26, 2014, JPL D-79129, URL: https://web.archive.org/web/20240530162505/https://pdfslide.fr/documents/final-swot-applications-plan-d79129-1-nasa-earth-science-division-applied.html?page=1
37) M. Srinivasan, A. Andral, M. Dejus, F. Hossain, C. Peterson, E. Beighley, T. Pavelsky, Y. Chao, B. Doorn, E. Bronner, L. Houpert, ”Engaging the applications community of the future Surface Water and Ocean Topography (SWOT) mission,” The International Archives of the Photogrammetry, Remote Sensing and Spatial Information Sciences, Volume XL-7/W3, 2015, 36th ISPRS (International Symposium on Remote Sensing of Environment), 11–15 May 2015, Berlin, Germany, URL: http://www.int-arch-photogramm-remote-sens-spatial-inf-sci.net/XL-7-W3/1497/2015/isprsarchives-XL-7-W3-1497-2015.pdf
38) “The Government of Canada announces investment in innovative mapping system for first-ever global surface water survey,” Aug. 18, 2014, URL: https://web.archive.org/web/20160605120531/news.gc.ca/web/article-en.do?nid=877189
39) Dwayne Brown, Alan Buis, “NASA-CNES Move Forward with Global Water and Ocean Surface Mission,” NASA News Release 14-127, May 2, 2014, URL: http://www.nasa.gov/press/2014/may/nasa-cnes-move-forward-with-global-water-and-ocean-surface-mission/#.U2RmM6KegkA
40) “France, U.S. Space Agencies Agree on Satellite Observation Program,” Embassy of France in Washington, May 02.2014, URL: [web source no longer available]
41) Steven P. Neeck, Eric J. Lindstrom, Parag V. Vaze, Lee-Lueng Fu, “Surface Water and Ocean Topography (SWOT) Mission,” Proceedings of SPIE Remote Sensing 2012, 'Sensors, Systems, and Next-Generation Satellites,' Edinburgh, Scotland, UK, Vols. 8531-8539, Sept. 24-27, 2012
42) Alain Lamy, Vincent Albouys, ”Mission design for the SWOT Mission,” Proceedings of 24th International Symposium on Space Flight Dynamics, Laurel, Maryland, USA, 5 - 9 May, 2014, URL: http://issfd.org/ISSFD_2014/ISSFD24_Paper_S17-1_LAMY.pdf
43) Thierry Lafon , Vincent Albouys , Parag Vaze, Brian Pollard, “The SWOT Mission Concept Description,” Proceedings of the 1st Workshop on Ka-band Earth Observation Radar, ESA/ESTEC, Noordwijk, The Netherlands, Oct. 8-9, 2012
44) A. Mallet, Eric Rodriguez, Roger Fjørtoft, Thierry Lafon, Parag Vaze, “Surface Water and Ocean Topography Measurement Principle,” Proceedings of the 2nd Workshop on Advanced RF Sensors and Remote Sensing Instruments 2009, Noordwijk, The Netherlands, Nov. 17-18, 2009
45) Nelly Mognard, Sylvain Biancamaria, Doug Alsdorf, Aaron Boone, Stéphane Calmant, Anny Cazenave, Jean-François Crétaux, Philippe Maisongrande , and the SWOT Participants, “SWOT: The Surface Water and Ocean Topography Satellite Mission,” Earth Observation and Water Cycle Science - Towards a Water Cycle Multi-mission Observation Strategy, ESA/ESRIN, Frascati, Italy, Nov. 18-20, 2009
46) Daniel Esteban-Fernandez, Lee-Lueng Fu, Ernesto Rodriguez, Shannon Brown, Richard Hodges, “Ka-band SAR Interferometry Studies for the SWOT Mission,” Proceedings of IGARSS (IEEE International Geoscience and Remote Sensing Symposium) 2010, Honolulu, HI, USA, July 25-30, 2010
47) Parag Vaze, Vincent Albuys, Daniel Esteban-Fernandez, Thierry Lafon, Juliette Lambin, Alain Mallet, Ernesto Rodriguez, “The Surface Water and Ocean Mission: Building a Mission Concept zo Study the World's Oceans and Fresh Water,” Proceedings of the SPIE Remote Sensing Conference, Toulouse, France, Vol. 7826, Sept. 20-23, 2010, paper: 7826-35, 'Sensors, Systems, and Next-Generation Satellites XIV,' edited by Roland Meynart, Steven P. Neeck, Haruhisa Shimoda, doi: 10.1117/12.868439
48) Ernesto Rodriguez, Daniel Esteban-Fernandez, “The Surface Water and Ocean Topography Mission (SWOT): The Ka-band Radar Interferometer (KaRIn) for water level measurements at all scales,” Proceedings of the SPIE Remote Sensing Conference, Toulouse, France, Vol. 7826, Sept. 20-23, 2010, paper: 7826-36, 'Sensors, Systems, and Next-Generation Satellites XIV,' edited by Roland Meynart, Steven P. Neeck, Haruhisa Shimoda, doi: 10.1117/12.868525
49) D. Esteban-Fernandez, Ernesto Rodriguez, Lee-Lueng Fu, Douglas Alsdorf, Parag Vaze, “The Surface Water and Ocean Topography Mission: Centimetric Spaceborne Radar Interferometry,” Proceedings of the SPIE Remote Sensing Conference, Toulouse, France, Vol. 7826, Sept. 20-23, 2010, paper: 7826-37, Sensors, Systems, and Next-Generation Satellites XIV, edited by Roland Meynart, Steven P. Neeck, Haruhisa Shimoda, doi: 10.1117/12.868535
50) Jean-Claude Souyris, “Upcoming altimeter measurements: explaining Ka-band, SAR mode, interferometric SAR,” 2010 OSTST (Ocean Surface Topography Science Team) meeting, Lisbon, Portugal, Oct. 18-20, 2010, URL: http://www.aviso.oceanobs.com/fileadmin/documents/OSTST/2010/oral/souyris.pdf
51) A. Mallet, B. Mametsa, R. Fjørtoft, J. C. Souyris,V. Albouys, T. Lafon, “KaRIn/SWOT Performance analysis tool- Application to near nadir swath extension,” 2010 OSTST (Ocean Surface Topography Science Team) meeting, Lisbon, Portugal, Oct. 18-20, 2010, URL: http://www.aviso.oceanobs.com/fileadmin/documents/OSTST/2010/oral/MALLET.pdf
52) Ernesto Rodriguez, “The Surface Water and Ocean Topography (SWOT) Mission,” 2010 OSTST (Ocean Surface Topography Science Team) meeting, Lisbon, Portugal, Oct. 18-20, 2010, URL: http://www.aviso.oceanobs.com/fileadmin/documents/OSTST/2010/oral/22_Friday/afternoon/Rodriguez.pdf
53) Daniel Esteban-Fernandez, Lee-Lueng Fu, Ernesto Rodriguez, Brian Pollard, Eva Peral, Dalia McWatters, Richard Hughes, Phil Callahan, “KaRIn: The Ka-band radar interferometer for the SWOT mission,” Proceedings of the Advanced RF Sensors and Remote Sensing Instruments-Ka-band Earth Observation Radar Missions,” (ARSI'14 & KEO'14), ESA/ESTEC, Noordwijk, The Netherlands, Nov. 4-7, 2014
54) Roger Fjørtoft, Jean-Claude Lalaurie, Nadine Pourthié, Jean-Claude Souyris, Jean-François Nouvel, Joseph Martinot-Lagarde , Hélène Oriot , Pierre Borderies, “Near-nadir Ka-band Interferometric Acquisitions and Backscattering Measurements in Preparation of the SWOT Mission,” Proceedings of the 1st Workshop on Ka-band Earth Observation Radar, ESA/ESTEC, Noordwijk, The Netherlands, Oct. 8-9, 2012
55) J. F. Nouvel, H. Oriot, J. Martinot-Lagarde, “Ka-band Radar backscattering measurements over water surfaces,” Proceedings of the 1st Workshop on Ka-band Earth Observation Radar, ESA/ESTEC, Noordwijk, The Netherlands, Oct. 8-9, 2012
56) Doug Alsdorf, Nelly Mognard, Jean-Francois Cretaux, Stephane Calmant, Dennis Lettenmaier, Ernesto Rodriguez, “Recent Hydrologic Developments in the SWOT Mission,” AGU Fall Meeting, 2012, URL: http://earthsciences.osu.edu/~alsdorf/files/SWOT/AlsdorfEtAl_AGU2012_v2.pptx
57) Douglas Alsdorf, Nelly Mognard, Ernesto Rodriguez, “Transforming Surface Water Hydrology through SWOT Altimetry,” Proceedings of the Symposium '20 years of Progress in Radar Altimetry', Venice, Italy, Sept. 24-29, 2012, (ESA SP-710, Feb. 2013)
58) Lee-Lueng Fu, Douglas Alsdorf, Ernesto Rodriguez, Rosemary Morrow, Nelly Mognard, Parag Vaze, Thierry Lafon, “The Proposed Surface Water and Ocean Topography (SWOT) Mission,” Proceedings of the Symposium '20 years of Progress in Radar Altimetry', Venice, Italy, Sept. 24-29, 2012, (ESA SP-710, Feb. 2013)
59) Ernesto Rodríguez, “Surface Water and Ocean Topography Mission (SWOT), Science Requirements Document,” Second Release (V1.1), January 26, 2012, NASA/JPL, URL: http://swot.jpl.nasa.gov/files/SWOT_science_reqs_release2_v1.14.pdf
60) Greg Agnes, Mark Thomson, Lee Peterson, Ernesto Rodriguez, Richard Hughes, Jeff Waldman, Dan Kahn, Mickey Hui, “ACT-10-0043 precision deployable Mast for the SWOT KaRIn instrument,” ESTF 2014 (Earth Science Technology Forum), Leesburg, VA, USA, Oct. 28-30, 2014, URL: http://esto.nasa.gov/forum/estf2014/presentations/B5P1_Agnes.pdf
61) ”SWOT Flight Systems,” NASA/JPL, 30 May 2018, URL: https://swot.jpl.nasa.gov/flight_systems.htm
62) ”New Antenna for the SWOT Satellite Allows for High Data Rate Communication,” NASA/JPL, May 6, 2015, URL: http://scienceandtechnology.jpl.nasa.gov/newsandevents/newsdetails/?NewsID=3201
63) Bertrand Raffier, David Brethe, ”SWOT: an AOCS answering to high payload constraints,” Proceedings of the 70th IAC (International Astronautical Congress), Washington DC, USA, 21-25 October 2019, paper: IAC-19.C1.5.1, URL: https://iafastro.directory/iac/proceedings/IAC-19/IAC-19/C1/5/manuscripts/IAC-19,C1,5,1,x49475.pdf
64) A. Paveau, G. Cros, S. Masson, R. Mangeret, S. Marioujouls, J.-J. Bonnefois, ”Robustness of Astrix Fiber Optic Gyros in space radiative environment,” CEAS Space Journal, Volume 11, Issue 2, pp 219–227, June 2019, https://doi.org/10.1007/s12567-018-0231-7
65) ”NASA Selects Launch Services for Global Surface Water Survey Mission,” NASA Contract Release C10-029, 22 November 2016, URL: https://www.nasa.gov/press-release/nasa-selects-launch-services-for-global-surface-water-survey-mission
66) http://www.aviso.altimetry.fr/es/misiones/future-missions/swot/orbit.html
67) Rosemary Morrow, Lee-Lueng Fu, Francesco D’Ovidio, and J. Thomas Farrar, ”Scientists Invited to Collaborate in Satellite Mission’s Debut,” EOS (Earth & Space Science News), 2 January 2019, URL: https://eos.org/science-updates/scientists-invited-to-collaborate-in-satellite-missions-debut
68) Lee-Lueng Fu and Clement Ubelmann, ”On the Transition from Profile Altimeter to Swath Altimeter for Observing Global Ocean Surface Topography,” Journal of Atmospheric and Oceanic Technology, Vol. 31, Published online: 12 February 2014, https://doi.org/10.1175/JTECH-D-13-00109.1, URL: https://journals.ametsoc.org/doi/pdf/10.1175/JTECH-D-13-00109.1
69) Amala Mahadevan, ”The Impact of Submesoscale Physics on Primary Productivity of Plankton,” Annual Review of Marine Science, Vol. 8:161-184 (Volume publication date January 2016), https://doi.org/10.1146/annurev-marine-010814-015912
70) Bo Qiu, Shuiming Chen, Patrice Klein, Jinbo Wang, Hector Torres, Lee-Lueng Fu, and Dimitris Menemenlis, ”Seasonality in Transition Scale from Balanced to Unbalanced Motions in the World Ocean,” AMS, Published online: 8 March 2018, https://doi.org/10.1175/JPO-D-17-0169.1, URL: https://journals.ametsoc.org/doi/pdf/10.1175/JPO-D-17-0169.1
71) Jinbo Wang, Lee-Lueng Fu, Bo Qiu, Dimitris Menemenlis, J. Thomas Farrar, Yi Chao, Andrew F. Thompson, and Mar M. Flexas, ”An observing system simulation experiment for the calibration and validation of the Surface Water Ocean Topography sea surface height measurement using in situ platforms,” Journal of Atmospheric Oceanic Technology,Vol. 35, 281–297, Published online: 7 February 2018, https://doi.org/10.1175/JTECH-D-17-0076.1, URL: https://journals.ametsoc.org/doi/pdf/10.1175/JTECH-D-17-0076.1
72) Becky Oskin, “Water-Mapping Mission Takes Flight,” NBCNews, March 7, 2013, URL: http://www.nbcnews.com/id/51083044/ns/technology_and_science-science/t/water-mapping-mission-takes-flight/#.UUHLMpETa1w
73) J. F. Nouvel, H. Oriot, J. Martinot-Lagarde, “BUSARD support to SWOT mission,” Proceedings of the Advanced RF Sensors and Remote Sensing Instruments-Ka-band Earth Observation Radar Missions,” (ARSI'14 & KEO'14), ESA/ESTEC, Noordwijk, The Netherlands, Nov. 4-7, 2014
74) California Institute of Technology, Jet Propulsion Laboratory, Ocean Surface Topography from Space, “Jason-3”https://sealevel.jpl.nasa.gov/missions/jason-3/summary/
75) NASA, “SWOT, Surface Water Ocean Topography, Press Kit/November 2022”, November 2022, URL: https://d2pn8kiwq2w21t.cloudfront.net/documents/swot-press-kit.pdf
76) NASA Blogs, Naomi Hartono, Surface Water and Ocean Topography (SWOT), “Engineers Check SWOT Science Instrument During Commissioning Activities”, February 23, 2023, URL: https://blogs.nasa.gov/swot/2023/02/23/engineers-check-swot-science-instrument-during-commissioning-activities/
77) NASA Blogs, Naomi Hartono, Surface Water and Ocean Topography (SWOT), “SWOT Science Instrument Is Up and Running; Continues with Commissioning”, march 17, 2023, URL: https://blogs.nasa.gov/swot/2023/03/17/swot-science-instrument-is-up-and-running-continues-with-commissioning/
78) My Science, “Crews Head Down River, Out to Sea to Prep New SWOT Water Satellite” July 20, 2023, URL: https://www.myscience.org/news/2023/crews_head_down_river_out_to_sea_to_prep_new_swot_water_satellite-2023-NASA-JPL
79) Aviso, “Start of the global mapping science phase on July 21, 2023”, July 21, 2023, URL: https://www.aviso.altimetry.fr/en/news/front-page-news/news-detail.html?tx_ttnews%5Btt_news%5D=2902
Back to top