Solar-B / Hinode Mission
Non-EO
JAXA
Quick facts
Overview
| Mission type | Non-EO |
| Agency | JAXA |
| Launch date | 23 Sep 2006 |
Solar-B / Hinode Mission
Spacecraft Launch Mission Status Sensor Complement References
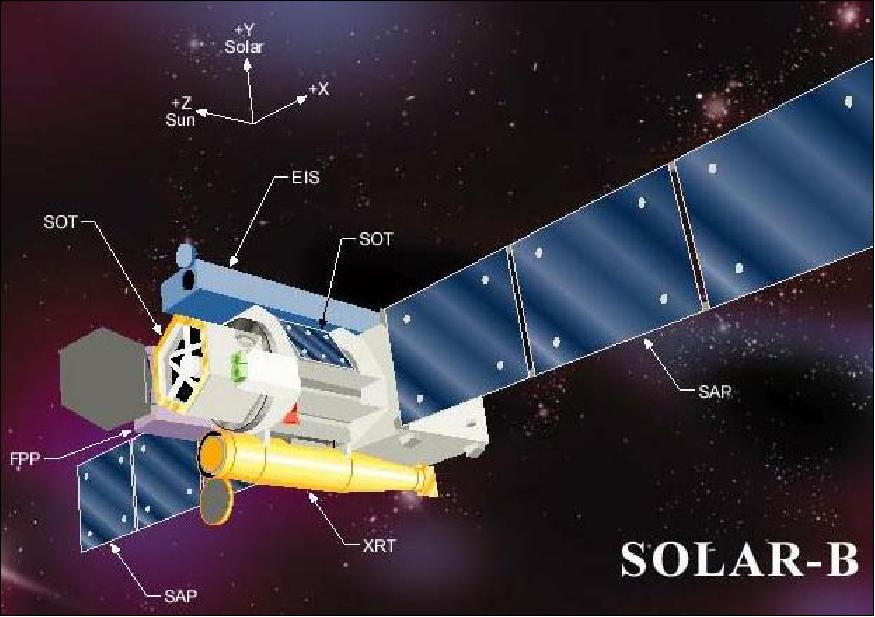
Solar-B is a Japanese solar physics mission of JAXA/ISAS, a successor to the highly successful Solar-A/Yohkoh mission of Japan/USA/UK. After launch, the in-orbit Solar-B spacecraft was given the name "Hinode," meaning "sunrise." Solar-B will, for the first time, provide quantitative measurements of the full vector magnetic field on small enough scales to resolve elemental flux tubes. The field of view and sensitivity allow changes in the magnetic energy to be related to both steady state (coronal heating) and transient changes (flares, coronal mass ejections) in the solar atmosphere.
The Solar-B mission is again being conducted as a multi-institutional and international collaboration between Japan (JAXA, NAOJ), the United States (NASA/GSFC and MSFC, SAO (Smithsonian Astrophysical Observatory), Lockheed Martin Solar and Astrophysics Laboratory, NRL (Naval Research Laboratory), and the United Kingdom with PPARC (Particle Physics and Astronomy Research Council); the MSSL (Mullard Space Science Laboratory) of the University College London and RAL (Rutherford Appleton Laboratory) are the prime partners of PPARC. As the lead agency, JAXA is responsible for the spacecraft, spacecraft integration, the optical telescope and the launch of the spacecraft. ESA (European Space Agency) and the Norwegian Space Center joined the Solar-B team in 2005; they are providing ground station coverage for the Solar-B mission. 1) 2) 3) 4) 5) 6)
The overall goal is to study and to understand the dynamic sun and its effect on terrestrial climate (global change) and space weather. Further major science objectives are:
• Comprehensive study of the sun's magnetic fields and a new view into the magnetic dynamics of the plasma universe (first spaceborne quantitative observations of the sun's full vector magnetic fields). Understanding basic plasma astrophysics such as the dynamo and magnetic reconnection processes.
• Study of the physics of the sun's luminosity and its variation
• Study of the processes which produce the UV and X-ray emission in the chromosphere and corona
• Study of solar wind energetics. Eruption and expansion of the sun's atmosphere.
Background: The conceptual design for a follow-up mission to Solar-A/Yohkoh (launched in Aug. 1991) started in 1994. After government approval of the mission in 1998, the SOLAR-B mission started in 1999 with the US (NASA) and the UK (PPARC) in the program as international partners. The first test of a prototype model of the electronics was conducted in 2001; the initial checks of the mechanical and thermal test models were conducted in 2002. Through these tests the validity of the initial design and the test method were confirmed.
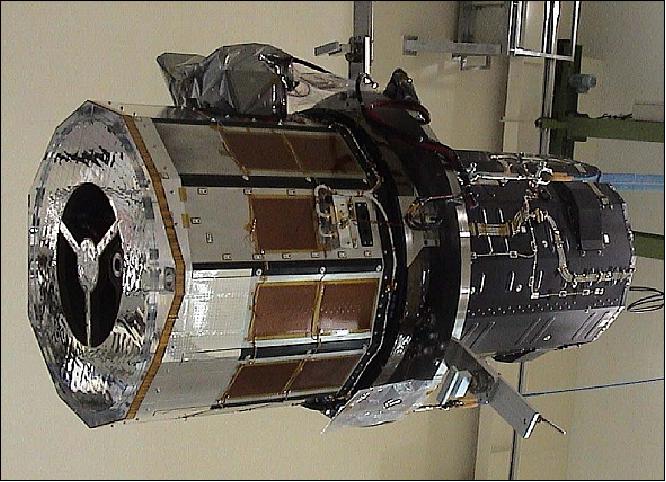
All the flight models were initially assembled in Sept. 2004, and the electrical and mechanical interface checks were executed. The flight models were integrated again in July 2005 for the final performance test after fixing problems. The performance tests were completed in July 2006, and the spacecraft was transported to the launch site in August 2006. 7)
Spacecraft
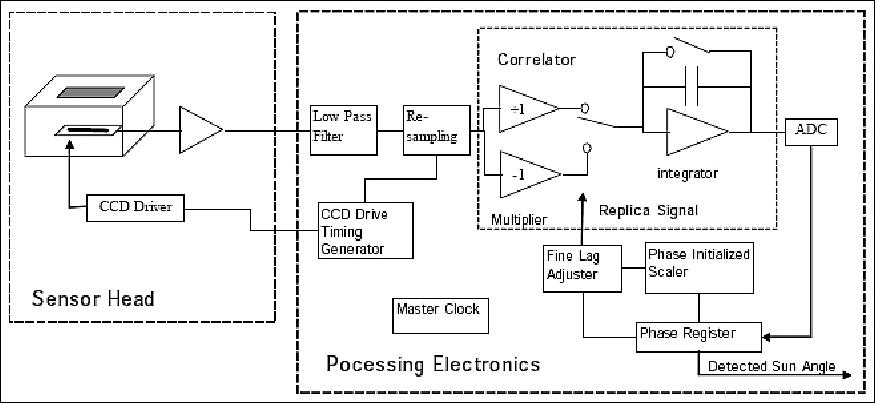
The Solar-B spacecraft is three-axis stabilized and pointed toward the sun. It is being developed/integrated by Mitsubishi Electric Corporation (MELCO) of Tokyo as prime contractor to JAXA. The spacecraft bus has a size of 2.0 m x 1.6 m x 3.8 m (L x W x H). Attitude is being sensed by IRU (Inertial Reference Unit) and by gyros with a combination of two types sun sensors and a star tracker providing absolute calibration. The two type CCD sun sensors provide highly accurate and stable sun angle to the attitude control system. One is the CCD sun sensor called NSAS (Non-Spin type Solar Aspect Sensor) and the others are two sets of UFSS (Ultra Fine Sun Sensor). NSAS is providing a pointing accuracy of 0.05º, random noise of 0.005º and FOV of ±50º. UFSS has very high accuracy of a few arcseconds and the resolution of 0.1 arcsec. The arithmetic average of pointing signals measured with UFSS-A and UFSS-B is used in controlling the spacecraft attitude in a normal operation mode. 8) 9)
Attitude actuation is provided by four reaction wheels, referred to as RCS (Reaction Control Subsystem). Solar-B is a sun-pointing spacecraft. The pointing stability is in the order of 0.1 arcsec over 10 seconds while finer image stabilization of 0.02 arcsec is achieved over 10 s for the optical telescope using its own correlation tracker/tip-tilt mirror system. Total electric power of 1 kW (EOL) is provided by two solar arrays (total length of 10 m).
An onboard solid-state recorder has a capacity of 8 Gbit. The onboard data compression technique (a special purpose, 12-bit JPEG/DPCM chip) provides either lossy or lossless image compression, dependent on the type of imagery processed. The spacecraft launch mass is about 900 kg (about 700 kg of dry mass with about 175 kg of thruster gas for orbit maintenance). The nominal mission life is three years (design life of 2 years min.). 10) 11) 12)
Spacecraft bus size | 2.0 m (L) x 1.6 m (W) x 3.8 m (H) |
Spacecraft pointing | Sun-pointing,stability of 0.1 arcsec, finer image stabilization of 0.02 arcsec is achieved over 10 s |
RF communications | X-band for science data with 4 Mbit/s downlink |
Power | 1 kW (EOL),2 solar arrays with a total length of 10 m |
Spacecraft mass | 893 kg (~700 kg of dry mass with ~175 kg of thruster gas for orbit maintenance) |
Mission design life | 2 years, with a goal of 3 years |
Launch
The Solar-B spacecraft was launched on Sept. 23, 2006 on a JAXA M-V-7 launch vehicle from USC (Uchinoura Space Center) at Uchinoura Kagoshima, Japan. - Secondary payloads on this flight are: SSSat (Solar-sail Sub-payload Satellite), a microsatellite of JAXA/ISAS to demonstrate some technologies required for the future solar power sail spacecraft, and HIT-Sat (Hokkaido Institute of Technology Satellite), a CubeSat of 3 kg.
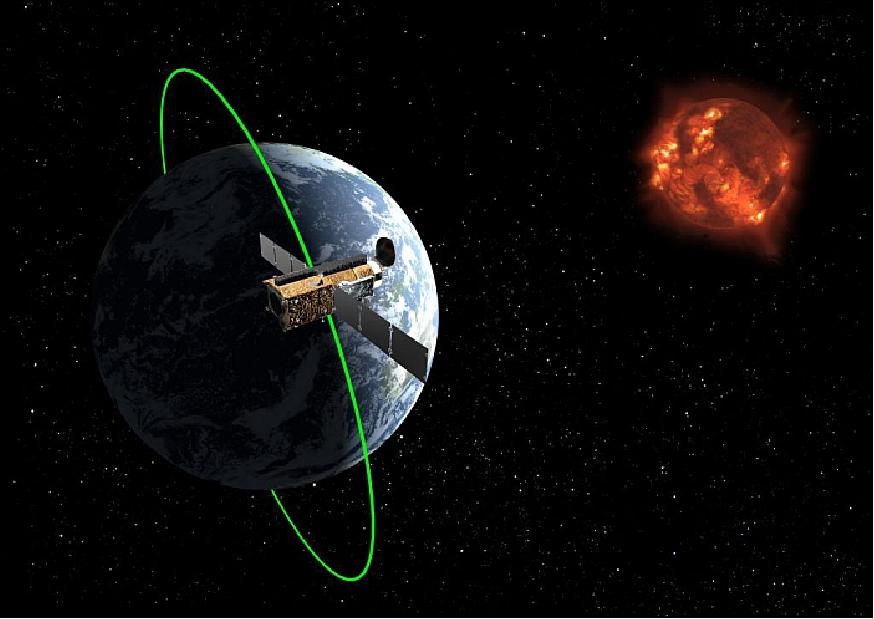
Orbit: Sun-synchronous circular orbit, altitude = 680 km, inclination = 98.1º, period = 98 minutes, a dawn/dusk orbit with a LTDN (Local Time of Descending Node) at about 18:00 hours. This orbit keeps the instruments in nearly continuous sunlight, with no day/night cycling for nine months each year.
RF communications are provided in X-band and in S-band (TT&C function). The downlink playback data rate is 4 Mbit/s (X-band). ESA and the Norwegian Space Center are providing ground station coverage for the Solar-B mission through the Svalbard Satellite Station (SvalSat), located on the Norwegian Svalbard islands (78.216º N, 20º E). - The SBSC (Solar-B Science Center) is located at NAOJ (National Astronomy Observatory Japan), Tokyo, while DARTS (Data Archive and Transfer System) is a web-based comprehensive data archive hosted at JAXA/ISAS.
Mission Status
• March 25, 2019: Ions move faster than atoms in the gas streams of a solar prominence. Scientists at the University of Göttingen, the Institut d'Astrophysique in Paris and the Istituto Ricerche Solari Locarno have observed this. The results of the study were published in The Astrophysical Journal. 13)
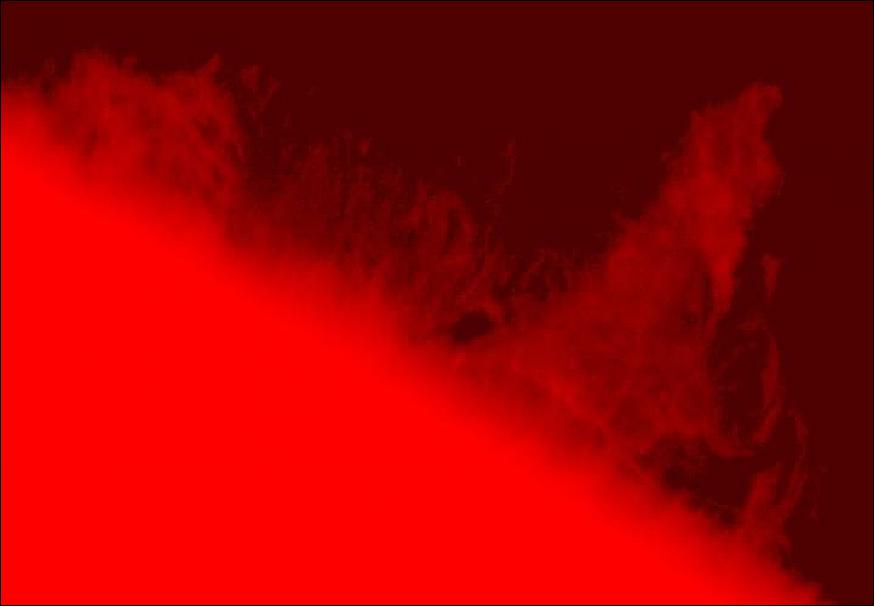
- In astrophysics, the "fourth state" of matter plays a crucial role. Apart from solid, liquid and gaseous states, there is also "plasma," which means an accumulation of atoms that have lost shell electrons through collisions or high-energy radiation and thus become ions. These ions are subject to magnetic forces that do not affect electrically neutral atoms. If there are not too many collisions in the plasma, both particle types can flow independently of each other. The researchers have now succeeded in observing the physics phenomena in just such a "partially ionized plasma without impact equilibrium" in gas streams of the Sun. The result: in clouds above the edge of the Sun, also known as prominences, ions of the element strontium move 22 per cent faster than sodium atoms.
- 16 hours later, the ions were only eleven percent faster. "Evidently, the neutral sodium atoms were more strongly carried along by the strontium ions," says Dr Eberhard Wiehr of the University of Göttingen, first author of the study. This could be caused by an increased particle density, which increases the probability of impact. "In addition, the flow behavior of the prominence could have changed in the 16 hours," says Wiehr. 14)
- The faster ions move in sync with the oscillation of the magnetic fields. This keeps the prominence in suspension despite the attraction of the Sun. Movements in deeper layers of the sun cause the magnetic lines of force to fluctuate. The ions immediately follow the reversal of the direction of oscillation, while the neutral atoms have to repeatedly reorient themselves with the ions.
- The researchers are now planning a systematic search for prominences with suitable oscillations that can be measured over a longer period of time.
Extended life for ESA's science missions: 15)
• November 14, 2018: The SPC (Science Program Committee) of ESA has confirmed the continued operations of ten scientific missions in the Agency's fleet up to 2022. After a comprehensive review of their scientific merits and technical status, the SPC has decided to extend the operation of the five missions led by ESA's Science Program: Cluster, Gaia, INTEGRAL, Mars Express, and XMM-Newton. The SPC also confirmed the Agency's contributions to the extended operations of Hinode, Hubble, IRIS, SOHO, and ExoMars TGO. 15)
- This includes the confirmation of operations for the 2019–2020 cycle for missions that had been given indicative extensions as part of the previous extension process, and indicative extensions for an additional two years, up to 2022.
Note: Every two years, all missions whose approved operations end within the following four years are subject to review by the advisory structure of the Science Directorate. Extensions are granted to missions that satisfy the established criteria for operational status and science return, subject to the level of financial resources available in the science program. These extensions are valid for the following four years, subject to a mid-term review and confirmation after two years.
- The decision was taken during the SPC meeting at ESA/ESAC (European Space Astronomy Center) near Madrid, Spain, on 14 November.
- ESA's science missions have unique capabilities and are prolific in their scientific output. Cluster, for example, is the only mission that, by varying the separation between its four spacecraft, allows multipoint measurements of the magnetosphere in different regions and at different scales, while Gaia is performing the most precise astrometric survey ever realized, enabling unprecedented studies of the distribution and motions of stars in the Milky Way and beyond.
- Many of the science missions are proving to be of great value to pursue investigations that were not foreseen at the time of their launch. Examples include the role of INTEGRAL and XMM-Newton in the follow-up of recent gravitational wave detections, paving the way for the future of multi-messenger astronomy, and the many discoveries of diverse exoplanets by Hubble.
- Collaboration between missions, including those led by partner agencies, is also of great importance. The interplay between solar missions like Hinode, IRIS and SOHO provides an extensive suite of complementary instruments to study our Sun; meanwhile, Mars Express and ExoMars TGO are at the forefront of the international fleet investigating the Red Planet.
- Another compelling factor to support the extension is the introduction of new modes of operation to accommodate the evolving needs of the scientific community, as well as new opportunities for scientists to get involved with the missions.
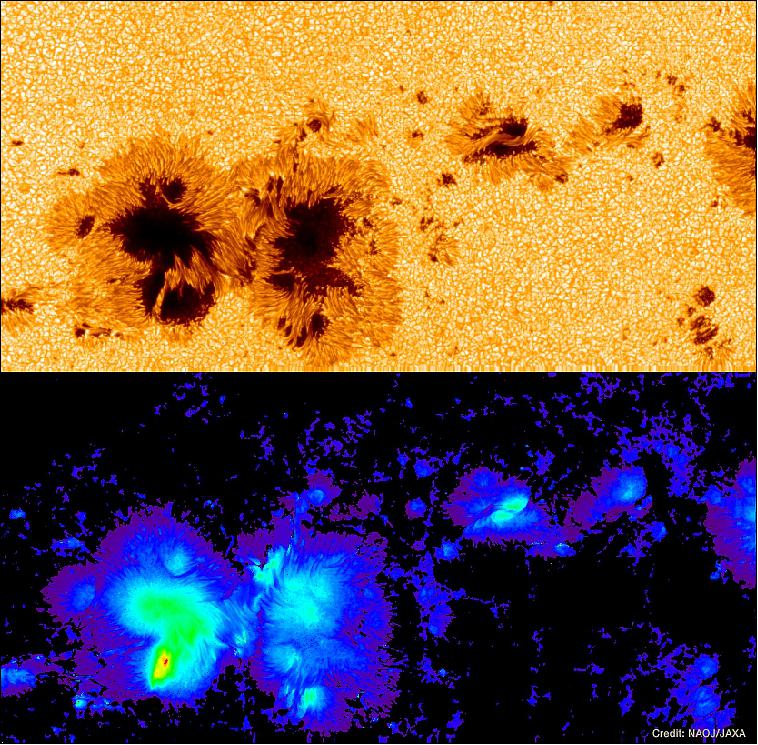
• February 6, 2018: Astronomers at NAOJ (National Astronomical Observatory of Japan) using the Solar-B/Hinode spacecraft observed the strongest magnetic field ever directly measured on the surface of the Sun. Analyzing data for 5 days around the appearance of this record breaking magnetic field, the astronomers determined that it was generated as a result of gas outflow from one sunspot pushing against another sunspot. 16)
- Magnetism plays a critical role in various solar phenomena such as flares, mass ejections, flux ropes, and coronal heating. Sunspots are areas of concentrated magnetic fields. A sunspot usually consists of a circular dark core (the umbra) with a vertical magnetic field and radially-elongated fine threads (the penumbra) with a horizontal field. The penumbra harbors an outward flow of gas along the horizontal threads. The darkness of the umbrae is generally correlated with the magnetic field strength. Hence, the strongest magnetic field in each sunspot is located in the umbra in most cases.
- Joten Okamoto (NAOJ Fellow) and Takashi Sakurai (Professor Emeritus of NAOJ) were analyzing data taken by the Solar Optical Telescope onboard Hinode, when they noticed the signature of strongly magnetized iron atoms in a sunspot. Surprisingly the data indicated a magnetic field strength of 6,250 gauss. This is more than double the 3,000 gauss field found around most sunspots. Previously, magnetic fields this strong on the Sun had only been inferred indirectly. More surprisingly, the strongest field was not in the dark part of the umbra, as would be expected, but was actually located at a bright region between two umbrae.
- Hinode continuously tracked the same sunspot with high spatial resolution for several days. This is impossible for ground-based telescopes because Earth's rotation causes the Sun to set and night to fall on the observatories. These continuous data showed that the strong field was always located at the boundary between the bright region and the umbra, and that the horizontal gas flows along the direction of the magnetic fields over the bright region turned down into the Sun when they reached the strong-field area. This indicates that the bright region with the strong field is a penumbra belonging to the southern umbra (S-pole). The horizontal gas flows from the southern umbra compressed the fields near the other umbra (N-pole) and enhanced the field strength to more than 6,000 gauss. 17)
- Okamoto explains, "Hinode's continuous high-resolution data allowed us to analyze the sunspots in detail to investigate the distribution and time evolution of the strong magnetic field and also the surrounding environment. Finally, the longtime mystery of the formation mechanism of a stronger field outside an umbra than in the umbra, has been solved."
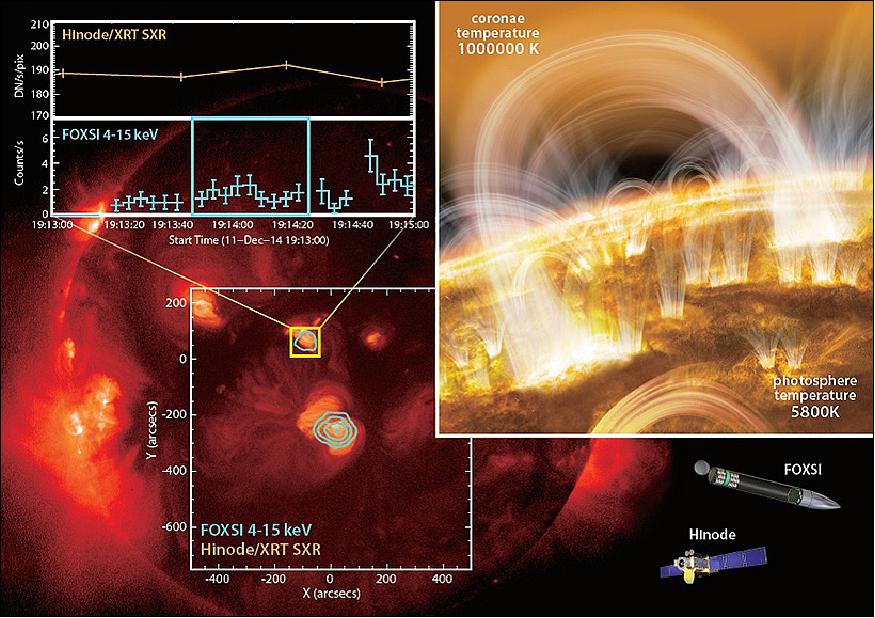
• October 10, 2017: An international research team led by Dr. Shin-nosuke Ishikawa (Project research fellow of JAXA) succeeded in detecting the subtle signs of nanoflares (tiny flares) in a region of the solar corona where no discernible flare activity was taking place. The finding was made by a combination of hard X-ray data from FOXSI (Focusing Optics X-ray Solar Imager) sounding rocket experiment and data from Hinode solar observatory. The frequent occurrence of nanoflares has been regarded as a promising agent for maintaining the solar corona at a high temperature of several million Kelvin. The result from the research group is expected to put strong constraints to theories accounting for the coronal heating. 18)
- Above the visible surface of the Sun, there extends hot and tenuous atmosphere called the corona. Why the corona is so hot (a few million Kelvin) above the cooler surface of the Sun (5,800 Kelvin), and how the corona is heated up to that temperature still remain unanswered. The apparent controversy of the higher temperature at a location in the solar atmosphere farther from the heat source has been known as the coronal heating problem. The problem has been a decades-long mystery in the field of solar physics.
- There are several hypotheses for possible mechanisms of coronal heating. One of them assumes heating by the frequent occurrence of very tiny flares, nanoflares. This hypothesis has been regarded as promising for explaining the hot corona. With the nanoflare hypothesis, numerical studies have suggested the creation of very hot plasmas exceeding ten-million Kelvin which is by far hotter than the typical temperature of the corona.
- However, so far there was no observation that conclusively showed the presence of such very hot plasmas.
- Dr. Shin-nosuke Ishikawa's international research group launched FOXSI sounding rocket for hard X-ray observation of the Sun and was successful in observing multiple coronal regions during its 6-minutes observation window during the rocket flight.
- FOXSI was realized under the international collaboration of state-of-the-art technologies; the X-ray optics for FOXSI was developed by U.S. colleagues of the team while Japanese members developed semi-conductor X-ray imaging detector of low-noise and fine pixel pitch.
- Thanks to the collaboration, FOXSI was able to observe weak X-ray signals from very hot (exceeded 10-million Kelvin) plasmas in the corona, with unprecedented high sensitivity. The XRT (X-Ray Telescope) aboard Hinode is sensitive to soft (several million Kelvin) X-ray emissions. Therefore, combining observations from these two instruments makes it possible to investigate in detail temperature structure of the region observed.
- By analyzing data from FOXSI and Hinode XRT, the research team was able to estimate, with high accuracy, the temperature structure of the corona for the region observed. It became clear that, albeit small in its amount, there certainly existed very hot plasmas. The hard X-ray emission detected by the FOXSI observation was emitted for a quiet solar active region which was not showing X-ray brightening nor flaring activity.
- This result strongly suggests the occurrence of nanoflares even in a region without apparent flaring activities. The finding is expected to pose a strong constraint on theoretical models explaining coronal heating. The research group succeeded in, not only confirming the persistent presence of very hot plasmas in the solar corona but also demonstrating the power of high sensitivity and high spatial resolution X-ray observations of the corona.
- Unfortunately, the duration of the observation with the FOXSI sounding rocket was only 6 minutes. One would argue that the result presented here is from only a single region in the corona. In order to reveal the mechanism of coronal heating with nanoflares, it is necessary to increase the number of regions to be observed as well as to conduct observations with a longer time span. The group is now working towards possible future satellite missions to be realized in Japan, or in U.S. together with U.S. colleagues.
- The results are published in Nature Astronomy, 9 October 2017 issue. 19)
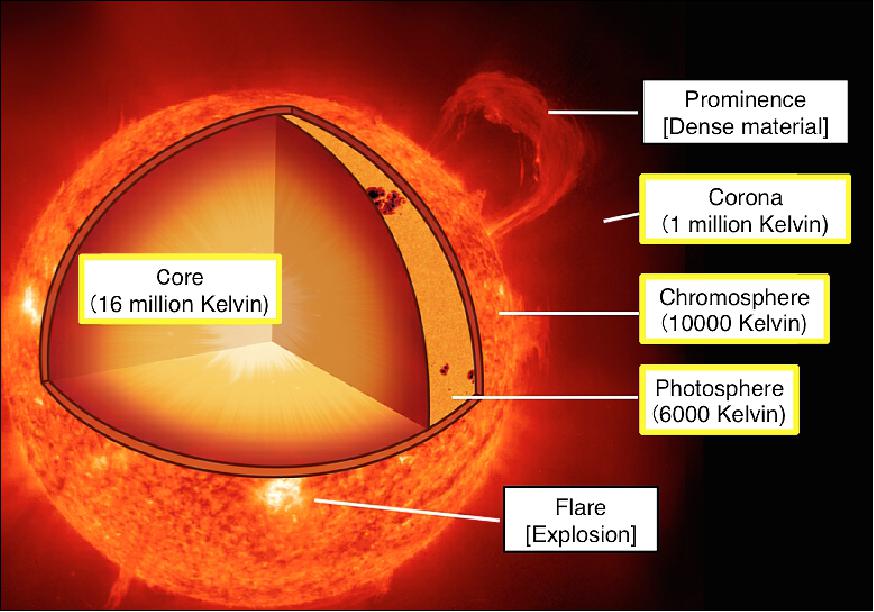
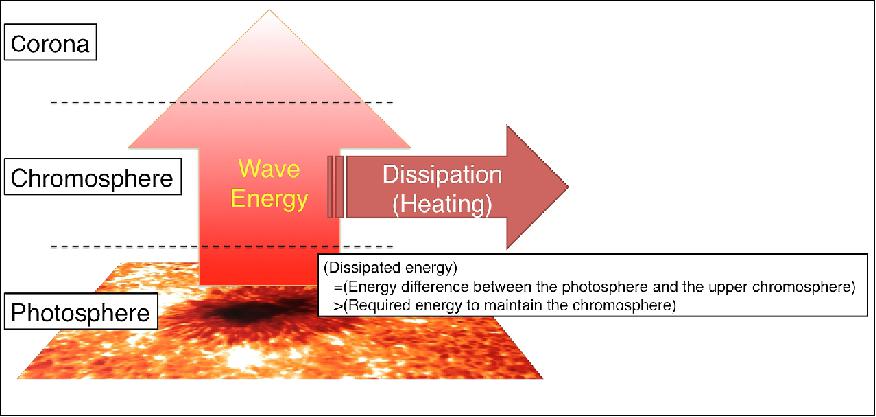
• October 31, 2016: Although the solar energy sources are located at the core of the Sun, the temperature of the upper part of the solar atmosphere (called the chromosphere and corona) is higher than that of the visible surface, i.e. photosphere. The mechanisms that produce such a peculiar behavior are still a mystery for solar researchers. Waves, which propagate upward along the magnetic field lines and dissipate (thermalize) the energy at the upper atmosphere, are one of the candidates that would transport the energy to the chromosphere and corona. In order to verify this idea, we need to check whether the amount of energy dissipated at the upper atmosphere is sufficient for maintaining the coronal temperature or not. 20)
A Japanese research team tried to tackle this for the first time evaluating how much energy is dissipated at the chromosphere through waves. The results show that the amount of dissipated energy is ten times larger than the required energy to maintain the chromosphere. Therefore, waves could be responsible to heat the upper chromosphere up to its present values, i.e. 10,000 Kelvin. 21)
This discovery was found thanks to an international collaboration between Japan-US solar observing satellites. The Hinode mission revealed photospheric tiny fluctuations of the physical parameters through spectropolarimetric observations. Moreover, the IRIS (Interface Region Imaging Spectrograph) performed spectroscopic observations to derive the physical information of the upper chromosphere. The combination of these satellites made possible to evaluate the dissipated energy by comparing the energy fluxes obtained at the two atmospheric layers.
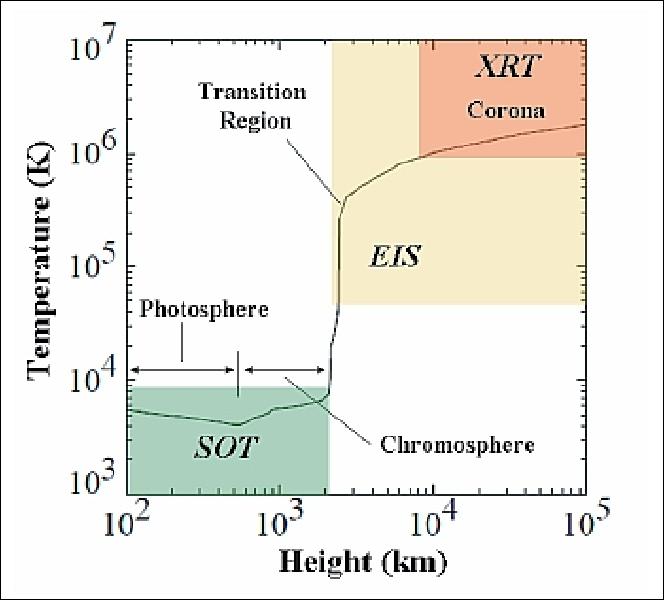
Figure 7 schematically illustrates the solar structure. The upper atmospheres called the chromosphere and corona exist above the solar surface, i.e., photosphere. A peculiar behavior can be easily recognized when we focus on the temperatures of each layer; the upper atmosphere is hotter than the bottom part. Since the solar energy is created at the core of the Sun through nuclear reactions, the temperature of the solar atmosphere should decrease as we move away from the core of the Sun. However, the temperature increases in the outer atmosphere above the photosphere showing a reversal on the expected behavior. The physical origin of this temperature reversal at the outer atmosphere is still unknown and it is one of the major mysteries in solar physics, known as the chromospheric and coronal heating problems. Especially, coronal heating is closely related to the acceleration of the solar wind and, thus, understanding its physical origin is important as well from the point of view of the Sun-Earth connection.
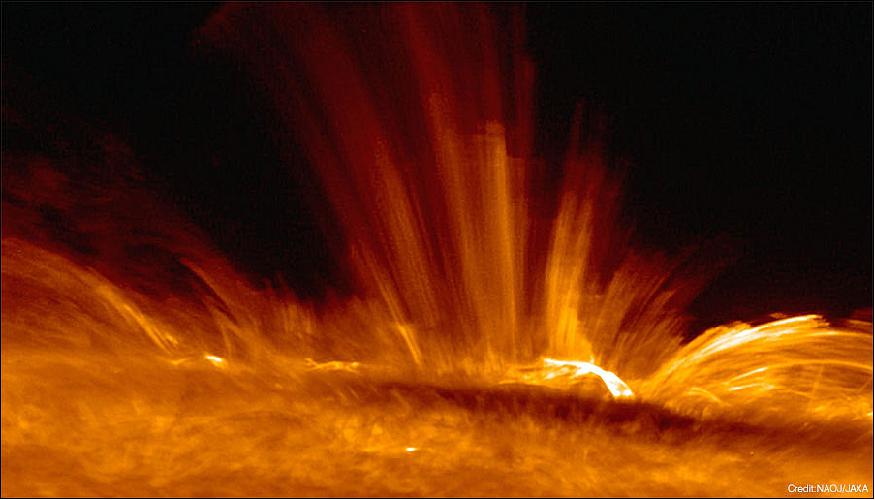
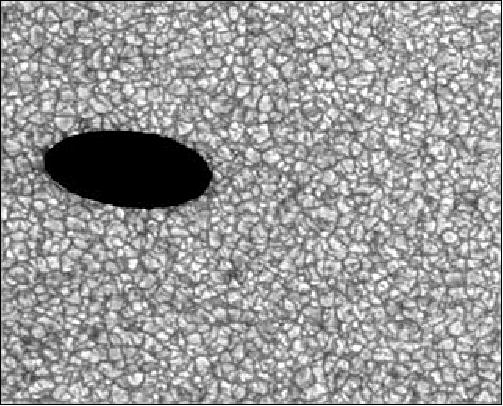
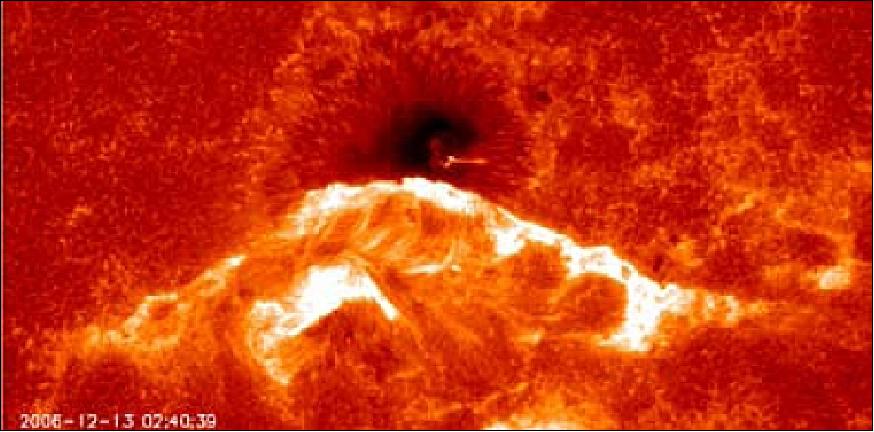
Although the chromospheric temperature (10,000 K) is much lower than that of the corona (>1 million K), the energy required for maintaining the chromosphere is ten times larger than that of the corona, because the density in the chromosphere is much higher than that in the corona. Hinode has discovered that the chromosphere is filled with dynamic phenomena (Figure 8), and solar researchers pay attention to these dynamic phenomena for trying to understand their implications to the heating of the corona. In other words, if we understand how the dynamic chromosphere is energized and formed, then we would be able to address the coronal heating mechanisms.
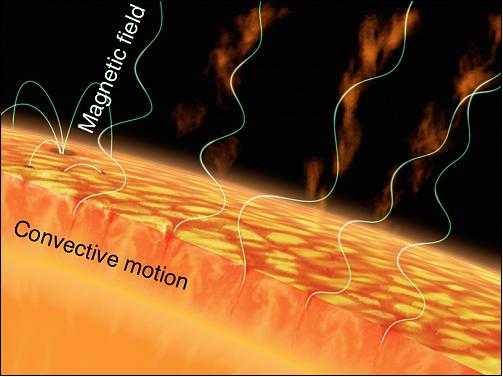
One of the most important ideas for heating the upper atmosphere is the wave heating hypothesis: after waves are excited by the convective motions at the photosphere, they propagate upwardly along the magnetic field lines and dissipate the energy at the upper atmosphere. Recent observations have provided some key findings (Figure 10), such as: 22)
1) magneto-hydrodynamic waves really exist in the solar atmosphere, and
2) the waves dissipate their energy in the corona.
Quantitative results are needed to verify that the amount of the dissipated energy is sufficient for the heating of the upper atmosphere.
Scientists at the University of Tokyo and ISAS/JAXA and collaborators analyzed a unique dataset of the joint Hinode-IRIS observations on the umbra of a sunspot, where periodic oscillations have been well observed at the photosphere and chromosphere. They investigated high-cadence time series of signals and determined the nature of the observed waves.
SOT (Solar Optical Telescope) onboard Hinode has a spectropolarimeter that provides time series of the low amplitude wave fluctuations at the photospheric layers. On the other hand, the IRIS satellite can measure spectral lines that form in the upper layers, i.e. chromosphere, helping the team to measure the physical properties of waves at these heights. By coordinating these observations, the team was able to trace the evolution of waves at two atmospheric layers, i.e., photosphere and upper chromosphere, simultaneously. As shown in Figure 9, the energy deposited in the atmosphere between the two layers can be evaluated with the upward energy fluxes estimated at the two layers.
• Since its launch on Sept. 22, 2006, Hinode, a joint mission of JAXA and NASA, has been watching the sun nearly non-stop, providing valuable insight into our star – and others throughout the universe. "The sun is terrifying and gorgeous, and it's also the best physics laboratory in our solar system," said Sabrina Savage, project scientist for Hinode at NASA/MSFC (Marshall Space Flight Center) in Huntsville, Alabama. "In the past 10 years, Hinode has focused on understanding our sun as a variable star." 23)
• May 2016: Mercury marched in front of the Sun from 11:11 to 18:44 UTC on May 9, 2016. Hinode, which is on a sun-synchronous orbit around the Earth, was able to observe this event without atmospheric distortion. 24)
• July 2015: The Solar-B/Hinode mission of JAXA/US/UK is approved to continue planning against the current budget guidelines. Any changes to the guidelines will be handled through the budget formulation process. The Hinode mission will be invited to the 2017 Heliophysics Senior Review. 25)
- The joint US/UK/Japanese Hinode mission was launched in 2006 and now enters its third extended mission phase. Hinode consists of three instruments which act as a comprehensive observatory. The EIS (Extreme-ultraviolet Imaging Spectrometer) obtains high spectral and spatial resolution images and spectra in two wavelength regimes: 17.0–21.0 nm and 25.0–29.0 nm, enabling sampling over temperatures 0.1–20 MK. An XRT (X-Ray Telescope) images the solar corona with good spatial resolution, high cadence (8 s) and with a wide dynamic range and temperature sensitivity that enables studies from coronal holes to flares. The SOT (Solar Optical Telescope) FPP (Focal Plane Package) includes a high-resolution (0.2 arcsec) high-cadence (< 2 s capable) multi-filter narrow- and broad-band imaging system (NFI, BFI) for photospheric and chromospheric data. The SOT also includes the SP (Spectro-Polarimeter), a scanning-slit instrument which obtains polarization spectra of magnetically sensitive photospheric spectral lines. XRT is a full-disk imager, while the EIS and SOT instruments have limited fields-of-view. Hinode is a complex mission in many aspects: the multiple instruments, the limited fields of view of two instruments, and the multi-national cooperation and coordination which is required for successful scientific return make the NASA necessary costs difficult to assess.
• June 2015: The 2015 Heliophysics Senior Review panel undertook a review of 15 missions currently in operation in April 2015. The panel found that all the missions continue to produce science that is highly valuable to the scientific community and that they are an excellent investment by the public that funds them. 26)
- Hinode science strengths: The Hinode instrument suite has enabled paradigm-defining science in a number of topics. An impressive summary was given in the proposal, of which only a few are noted here as examples. The solar polar magnetic field structure and dynamics has been intently studied, confirming the dominance of small but strong-field unipolar elements, in the context of coincident flux-balanced weak elements. Pre-eruption brightenings have been observed in the chromosphere which are consistent with small reconnection events; the seemingly benign emergence of a new active region has been seen in light of the energy transferred into the solar corona, now estimated as comparable to large flares but manifest as gradual small reconnection processes. Instrument coordination has led to the identification of the source of the slow solar wind during an active Sun, and the possibility of an activity-cycle-independent dynamo process has been identified, which generates the ever-present weak component of the photospheric magnetic field. With respect to a broad scientific impact beyond the heliophysics, the panel notes that a large fraction of the spectra lines observed in EIS/Hinode data are as of yet unidentified.
The unique ability of Hinode/SP to quantitatively study the polar magnetic fields for the next few years presents the opportunity to gather critical information relevant to understanding the driver(s) of the solar cycle during the transition to solar minimum and a period of stronger polar influences on heliospheric topology. The hints of pre-event reconnection phenomena, the energetics of emerging magnetic field, and quantitative DEM tests of flare Standard Models must be confirmed and statistically verified.
Extended observations by XRT will help quantify the behavior of the hottest component of the solar corona during the transitions between phases of the activity cycle. For an extended mission period, new improved numerical modeling capabilities are now producing new observationally testable predictions that will be especially constrained in the light of recent additions to the HSO (Heliophysics System Observatory) fleet.
- Hinode value to the HSO (Heliophysics System Observatory): Hinode instruments provide data in unique parts of parameter space that complement other solar missions. XRT presents a unique bridge between SDO/AIA and RHESSI, especially for studies of high-energy events that can severely impact the heliosphere with sudden energetic particle flux, and the influence of X-ray plasma on the more local considerations of the near-Earth environment. XRT presently represents the sole HSO capability for imaging the hottest coronal plasmas. EIS spectral coverage complements the IRIS observing capability, and is itself complemented by SDO/AIA for context. The SOT package, in particular the SP, provides a standard by which other magnetic field data are judged, and its high sensitivity enables an understanding of the "true" structure of the photospheric magnetic field which, for example, is viewed in only an averaged sense with SDO/HMI.
The Hinode mission has undertaken not only coordinated observations with other HSO missions, it is actively sought after for coordinated observations with ground-based facilities both in the US and internationally. New ground- and space-based facilities such as ALMA, NuSTAR, are beginning to coordinate observing plans.
- Hinode spacecraft / instrument health and status: The instruments and spacecraft continue to perform well. Spacecraft attitude systems are
functioning nominally, and available fuel is sufficient for orbit maintenance and debris avoidance maneuvers for approximately ten additional years in the present 680 km high orbit.
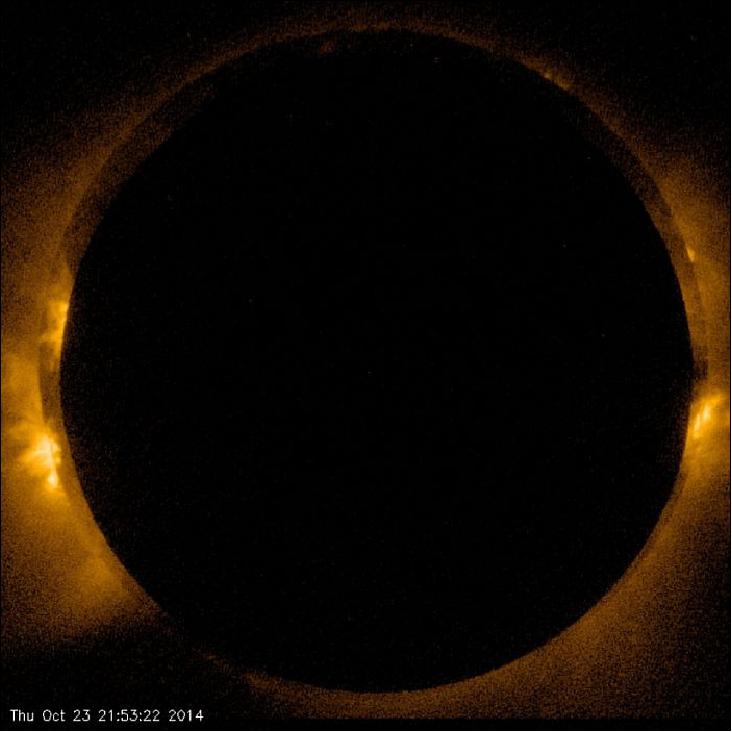
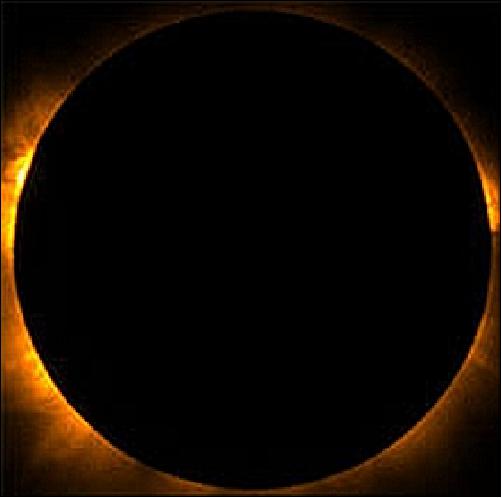
• On Oct. 23, 2014 (UTC), the Solar Physics Satellite Solar-B /Hinode was in a straight line with the sun and the moon on orbit to observe the annular solar eclipse. JAXA, the National Institutes of Natural Science, NAOJ ( National Astronomical Observatory of Japan), and NASA took images of the scene and published the X-ray solar photos and movies of the annular solar eclipse. The HINODE flew into the shadow of the moon (in the antumbra observed during the annular solar eclipse, the diameter of which is 187 km) while flying over the North American continent at an altitude of 680 km at around 21:53 UTC on Oct. 23. This annular solar eclipse was seen only in orbit, and it was observed as a partial solar eclipse from the North American continent (the U.S. and Canada) and other areas on the 23rd (UTC). 27)
- Photos and movies were taken by the XRT ( X-Ray Telescope) on HINODE. The moon appeared from the west of the sun (on the right side on the images) and moved across the disk of the sun toward the east. The XRT captured the black moon in the shape of a crescent in front of the solar corona brightened by X-rays.
- The HINODE is over eight years old since its launch on Sept. 23, 2006, and it had met a total eclipse only once before (on March 19, 2007) and an annular eclipse twice (Jan. 4, 2011, and this time) in orbit. It is quite unusual that a satellite encountered a central eclipse in orbit three times.
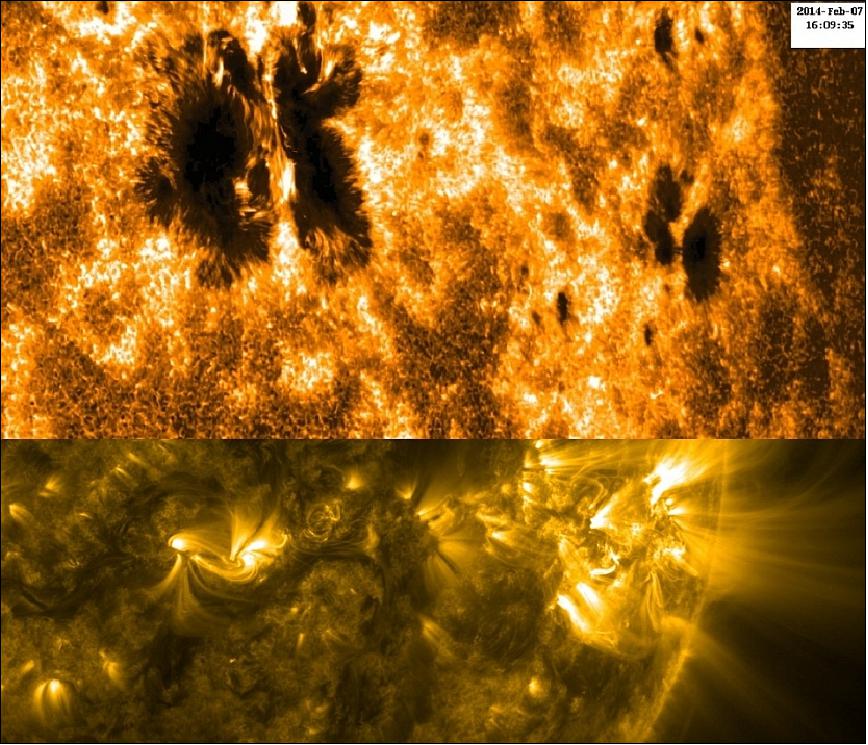
• 2014: The Hinode spacecraft and its payload are operating nominally. On Feb. 7, Hinode observed a major sunspot activity in the AR (Active Region) 11967 that released numerous solar flares (Figure 13). 29)
By studying the sun's magnetic field, scientists hope to shed new light on explosive solar activity that can interfere with satellite communications and electric power transmission grids on Earth and threaten astronauts on the way to or working on the surface of the moon. In particular, they want to learn if they can identify the magnetic field configurations that lead to these explosive energy releases and use this information to predict when these events may occur.
• 2013: The Hinode spacecraft and its payload are operating nominally. The current mission extension is up to the end of 2014 (proposal for extension up to 2016 in June 2013).
• In November 2012, Hinode captured the scene of the total solar eclipse while flying over northern Australia. Its onboard XRT (X-Ray Telescope) took images of the sun gradually being covered by the moon on Nov. 14, 2012. 30)
• April 2012: For the first time, an international research team, consisting mainly of researchers from the NAOJ (National Astronomical Observatory of Japan) and RIKEN, recently discovered the phenomenon of the polarity of the polar magnetic field in the solar polar region reversing faster than expected by using SOT (Solar Optical Telescope) mounted on the Solar Observation Satellite "Hinode." 31)
The research team found that between 2008 and 2012, the reversal from minus to plus polarity of the magnetic field was taking place only in the north polar region of the sun, while the magnetic field did not change much in the south polar region. The magnetic field of the solar polar region is known to reverse every 11 years. However, as the reversal occurred only on the north pole, and also with the development of a sunspot that was related to the polar magnetic field reversal, the condition is very similar to the "Mounder Minimum," which brought a cold period to Earth in the mid 17th century. This phenomenon and its further movement need more attention. 32)
• The Solar-B/Hinode spacecraft and its payloads are operating nominally in 2012.
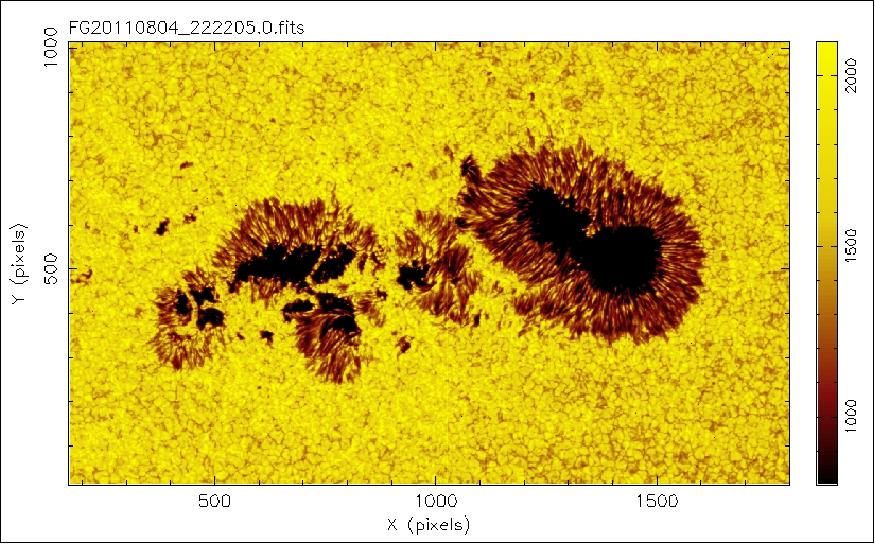
Legend to Figure 15: The SOT (Solar Optical Telescope) zoomed in on AR 11263 on August 4, 2011, five days before the active region produced the largest flare of this cycle, an X6.9.
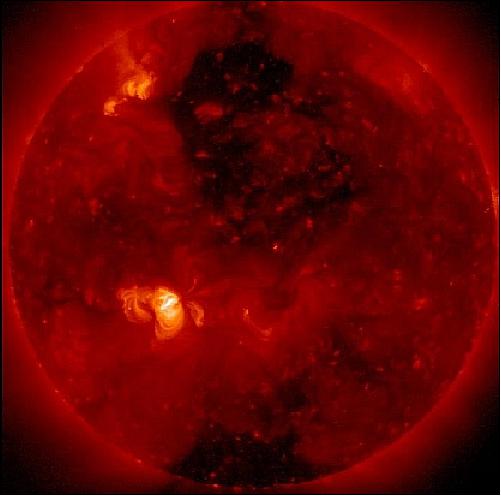
• On February 1, 2011, the Hinode satellite captured this breathtaking image of a coronal hole (Figure 16), seen in the top center of the image (a polar coronal hole can also be seen at the bottom of the image). A coronal hole is an opening in the sun's magnetic field through which gas can easily escape into space. 34)
• On January 4, 2011, the Hinode spacecraft observed an annular solar eclipse using its XRT (X-Ray Telescope). 35)
• The Hinode spacecraft and its instruments are operating nominally in 2010 (Ref. 10).
• Hinode clarifies the origin of low-speed solar winds: The origin of low-speed solar winds was found to be at the parting plane of the magnetic field that exists at the end of the active area of the winds. This finding was achieved by combining the observations of the Solar Physics Satellite "Hinode" and those of photosphere magnetic fields.
Such a parting plane of a magnetic field is found to be a boundary between the magnetic field of the active area and other magnetic fields, and the magnetic reconnection is easily triggered in the environment of the parting plane. This observation result suggests the possibility that magnetic reconnection may drive low-speed solar winds.
• Hinode has been providing ample new findings on magnetic activities in the solar atmosphere which are revolutionalizing our understanding on the Sun. These findings include frequent X-ray jets and magnetic field concentration in the polar regions, unexpectedly-high jet activities in the chromosphere, and transient horizontal magnetic field ubiquitously covering the photosphere. 36)
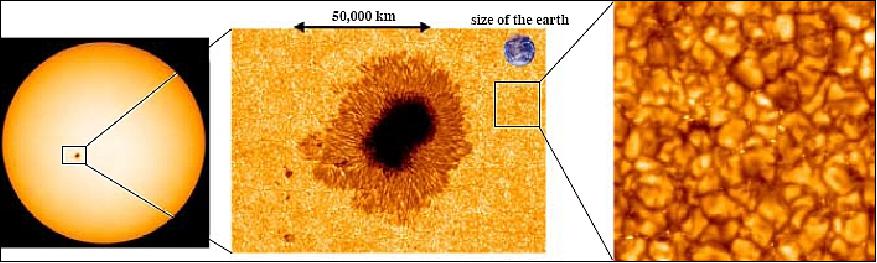
Legend to Figure 17: The observations were made at a wavelength of 460 nm (the colors in the image have been artificially enhanced and differ from the actual colors). Convection called granules can be seen in the photosphere (right). Small spots between the convection cells are magnetic elements (the minimum unit of a magnetic field) that have an exceptionally strong magnetic field.
• Since its first-light observation on 25 Oct. 2006, the image-stabilization system has been working with a performance of better than 0.01 arcsec rms and the SOT has been continuously providing unprecedented solar data of high spatial resolution (Ref. 47).
• So far, the data from Hinode have brought a new perspective of solar physics and a wealth of discoveries. For instance, data analysis shows that magnetic waves play a critical role in driving the solar wind into space. An international team at MSSL has found a source of the stream of particles that make up the slow solar wind using data from Hinode and SOHO. The solar wind can have low or high speeds. The low-speed or slow solar wind moves at only 1.5 million km/h. The high-speed wind is moving at speeds as high as 3 million km/h. 38)
• Starting in December 2007, Hinode's X-band transmitter signal began to experience irregularities in the latter half of each contact with the ground. The cause of the X-band anomaly is currently under investigation, and the status of the X-band will continue to be regularly monitored.
• Since May 27, 2007, European scientists have free access to the data of the Hinode mission through the Hinode Science Data Centre in Norway, developed and run by the Institute of Theoretical Astrophysics at the University of Oslo on behalf of ESA and the NSC (Norwegian Space Centre). It is part of ESA's and Norway's joint contribution to this solar mission. Norway provides also ground station coverage through the SvalSat downlink station at Svalbard (Spitzbergen), which nearly quadruples the data rate and thus significantly increases Hinode's science return. 39)
• As of Dec. 22, 2006, the Hinode instruments completed in-orbit testing and the mission became operational.
• First-light observation on Oct. 25, 2006 (top door deployed). Initial checkouts of the instrument were conducted and superior performance of SOT was confirmed. 40)
• After the deployment of the side door of OTA on 14th October 2006, electrical components of SOT were turned on and basic functional tests of moving mechanisms and cameras were carried out successfully. The period after opening the side door and before opening the top door was designated as the initial bakeout phase of the OTA prior to introducing the sun light into the telescope, and decontamination heaters of the primary and secondary mirrors of OTA were turned on to maintain the temperature of critical surfaces higher than other parts of the telescope.
Sensor Complement
Multidimensional observation of the sun with three telescopes: The sensor complement consists of a coordinated set of optical, EUV and X-ray instruments (high-resolution solar telescopes and spectrometers) to investigate the interaction between the sun's magnetic field and its corona [interaction between the sun's photospheric velocity and magnetic fields (SOT/FPP) and its extended atmosphere: chromosphere and corona (XRT/EIS)]. Co-alignment of SOT and EIS is realized through the XRT visible light telescope and the temperature overlap of EIS. - The MDP (Mission Data Processor) of Solar-B coordinates the observations of the sensor complement and handles the data from the various instruments. 41) 42)
The temperature of the solar atmosphere ranges from about 5500 K (corresponding to visible light) to millions of degrees (corresponding to x-ray radiation). For this reason it is necessary to study the sun using instruments sensitive to radiation over a broad range of wavelengths. Spectroscopic observations are particularly important because they allow detailed determinations of plasma parameters such as temperature, density, and element abundance from measurements of the absolute intensities and intensity ratios of spectral lines. Furthermore, using the Doppler effect, determination of line-of-sight bulk flows and nonthermal turbulent motions are also possible from measurements of the wavelength positions of spectral lines and the shapes of the line profiles, respectively. 43)
From the technology perspective, the sensor complement of Hinode is characterized by:
• Ultra-high spatial resolution optics and detectors
• Multi-layer gratings and coatings from SERTS; Ultra-high resolution X-ray imaging - heritage of TRACE
• Space-qualified linear polarimeters
• Enhanced large format detectors: 4 k x 2 k CCDs for SOT; 2 k x 2 k pixels for XRT; 2 k x 1 k pixels for EIS. The cadence of exposures is on the order of a few seconds to 10 seconds for the fastest case, so that large volumes of image data are produced by each telescope. A readout of a CCD partial area is possible to reduce the size of data to be downlinked, but the data volume is still fairly large.
• Solar pointing and tracking capability in the order of 0.1 arcseconds.
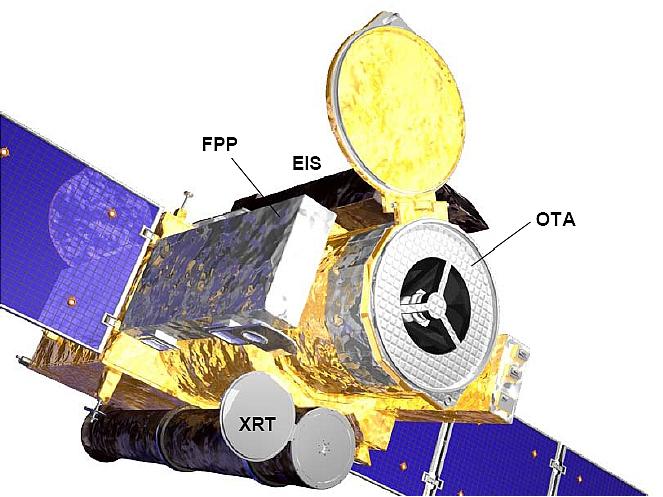
SOT (Solar Optical Telescope)
SOT represents a joint development between Japan and the USA, in which Japan provides the telescope optics and the USA the FPP (Focal Plane Package). The international collaboration consists of: NAOJ (National Astronomical Observatory of Japan), Lockheed Martin Advanced Technology Center (LMATC), Mitsubishi Electric Corporation (MELCO), NCAR High Altitude Observatory (HAO), NASA/MSFC, and JAXA. The objective is to obtain continuous high-resolution magnetic field imagery of the sun's surface. The telescope feeds a complex FPP designed for photospheric and chromospheric imaging and spectropolarimetry. SOT is designed to achieve a consistent 0.2 arcsec spatial resolution. 44) 45)
SOT is a diffraction-limited and aplanatic Gregorian telescope with an aperture of 0.5 m. It provides an angular resolution of 0.25 arcsec (175 km on the sun) over the field of view (FOV) of about 328 x 164 arcsec. The spectral range of SOT is 480-650 nm. The focal plane package of the optical telescope consists of broad- and narrow-band filtergraphs (filter vector magnetographs) and a spectro-polarimeter. This combination allows to obtain, for the first time, a continuous series of high-precision vector magnetograms, Dopplergrams, and filtergrams with sub-arcsec resolution. 46) 47) 48)
The SOT instrument is designed and developed by the international collaboration between NAOJ (National Astronomical Observatory of Japan), LMATC (Lockheed Martin Advanced Technology Center), Palo Alto, CA, MELCO (Mitsubishi Electric Corporation), HAO (High Altitude Observatory), Boulder, CO, NASA/MSFC, Huntsville, ALA, and JAXA, Tokyo. The PIs are: S. Tsuneta (NAOJ) and A. Title (LMATC).
SOT is so far the largest telescope with highest performance ever to observe the sun from space. The SOT telescope itself consists of two major components:
• OTA (Optical Telescope Assembly), consisting of a 50 cm aperture Gregorian telescope with a collimating lens unit and an active tip-tilt mirror for an image-stabilization
• FPP (Focal Plane Package), housing two filtergraphs and a spectro-polarimeter.
OTA and FPP are optimized for the measurement of the vector magnetic field and associated dynamics in the solar photosphere. SOT will obtain a continuous series of diffraction-limited images, achieved by 50 cm diameter aperture telescope.
The images are being acquired under very stable pointing conditions. The BFI (Broadband Filter Imager) produces photometric images with broad spectral resolution in 6 bands (CN band, Ca II H line, G band, 3 continuum bands) at the highest possible spatial resolution (0.0541 arcsec/pixel) and cadence (< 10 s typical) over the full field of view (218 × 109 arcsec). This will allow accurate measurements of the horizontal flows and temperature of the solar surface, and to identify sites of strong magnetic fields.
The NFI (Narrowband Filter Imager) measures very narrow spectral bands in the photosphere and chromosphere to derive line-of-sight velocities of solar plasma.
Optical Telescope Assembly (OTA) | |
Telescope type | Aplanatic Gregorian telescope with heat dump mirror |
Primary mirror | 50 cm aperture diameter, light weight glass composite |
Primary-secondary mirror length | 1.5 m |
Spectral range | 480 - 650 nm |
FOV | 328 arcsec x 164 arcsec |
Effective f ratio | 9.055 at secondary focus |
Polarization modulator (PMU) | Rotation speed: continuous, 1.6 s/rotation |
Angular resolution | Diffraction limited at 0.25 arcsec (175km on the sun) |
Polarimetric accuracy | 10-4 |
FPP (Focal Plane Package) Vector Magnetograph | |
Magnetic lines | Fe I 525.0 nm, Fe I 630.2 nm, continuum:524.6 nm, velocity: Fe I 532.4 nm |
FOV | 164 arcsec x 164 arcsec |
Magnetic sensitivity | B (longitudinal): 1 - 5 G (gauss) |
Temporal resolution | 5 minutes |
Data | Time series of photospheric vector magnetograms, Doppler velocity and photospheric intensity |
FPP Spectro-Polarimeter (SP) | |
Observations | - Spectra of two Fe lines at 630.15 and 630.25 nm and nearby continuum |
Instrument type | Littrow echelle |
FOV | 164 arcsec x 164 arcsec |
Spatial sampling (slit) | 0.16 arcsec |
Spectral coverage | 630.08 - 630.32 nm |
Spectral resolution/sampling | 30 mÅ / 21.5 mÅ |
Measurement of polarization | Stokes I, Q, U, V simultaneously with dual beam (orthogonal linear components) |
Polarization SNR | 103 (normal map) |
Data | Detailed Stokes line profiles of intensity and polarization |
FPP Correlation Tracker (CT) | |
CCD detector | 50 x 50 pixels, 0.22 arcsec/pixel |
Frame rate | 580 Hz |
Spectral range | 629-634 nm |
Displacement range | ± 5 pixels |
Error signal accuracy | ~ 0.01 arcsec |
|
|
SOT data rate (after compression) | ~300 kbit/s, assuming 15 downlink stations/day |
Allocated telemetry rate | ~1.3 Mbit/s (nominal for SOT) |
FOV | 218 arcsec × 109 arcsec (full FOV) | ||
CCD | 4k x 2k pixel (full FOV), shared with the NFI | ||
Spatial sampling | 0.0541 arcsec/pixel (full resolution) | ||
Spectral coverage | |||
Center (nm) | Width (nm) | Line of interest | Purpose |
388.35 | 0.7 | CN I | Magnetic network imaging |
396.85 | 0.3 | Ca II H | Chromospheric heating |
430.50 | 0.8 | CH I | Magnetic elements |
450.45 | 0.4 | Blue continuum | Temperature |
555.05 | 0.4 | Green continuum | Temperature |
668.40 | 0.4 | Red continuum | Temperature |
Exposure time | 0.03 - 0.8 s (typical) | ||
FOV | 328 arcsec x 164 arcsec (unvignetted 264 arcsec x 164 arcsec) | |||
CCD | 4k x 2k pixel (full FOV), shared with BFI | |||
Spatial sampling | 0.08 arcsec/pixel (full resolution) | |||
Spectral windows (nm) and lines of interest | ||||
Center (nm) | Width | Lines | geff | Purpose |
517.2 | 0.6 | Mg I b 517.27 | 1.75 | Chromospheric Dopplergrams and magnetgrams |
525.0 | 0.6 | Fe 524.71 | 2.00 |
|
557.6 | 0.6 | Fe I 557.61 | 0.00 | Photospheric Dopplergrams |
589.6 | 0.6 | Na I D 589.6 | - | Very weak fields (scattering polarization) Chromospheric fields |
630.0 | 0.6 | Fe I 630.15 | 1.67 |
|
656.3 | 0.6 | H I 656.28 | - | Chromospheric structure |
Exposure time | 0.1 - 1.6 s (typical) | |||
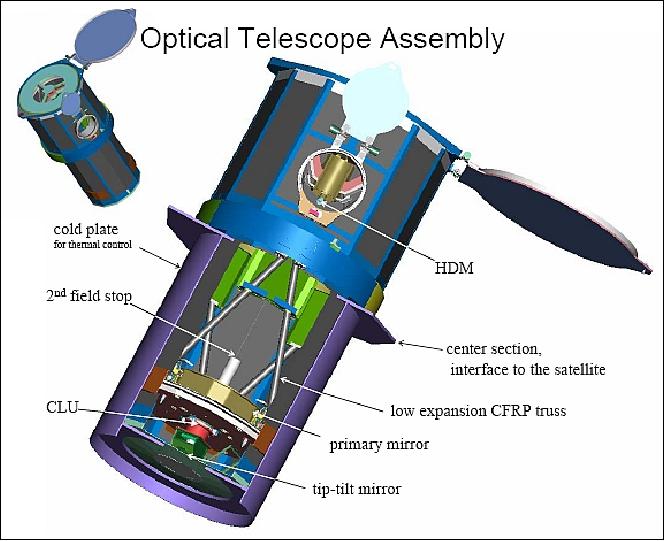
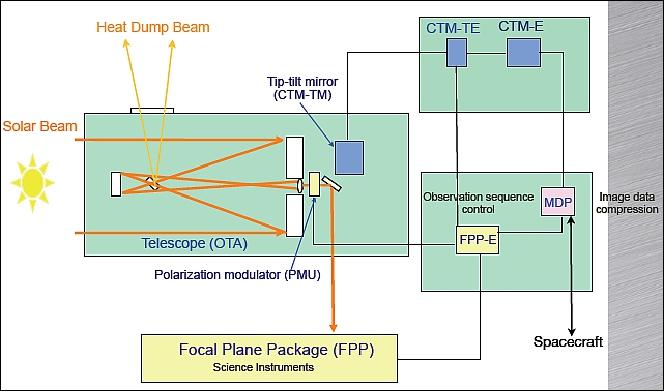
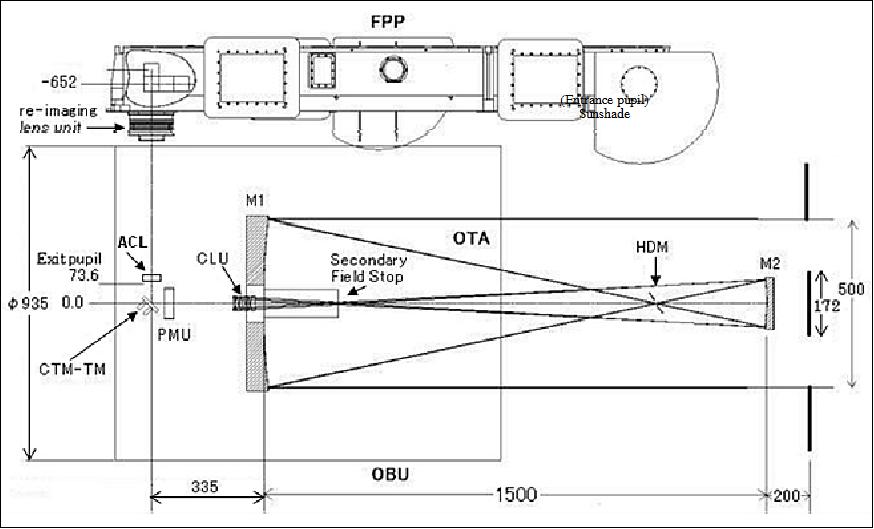
OTA (Optical Telescope Assembly): The OTA (Figure 30) consists of an aplanatic Gregorian; the primary mirror (M1) and the secondary mirror (M2) of effective aperture of 500 mm, a CLU (Collimating Lens Unit) near the center of the primary mirror, a PMU (Polarization Modulator Unit), an active Tip-Tilt Mirror (CTM-TM), and an ACL (Astigmatism Corrector Lens). In addition, the OTA has two field stops between the primary and secondary mirrors; one is a HDM (Heat Dump Mirror) at the focus of the primary mirror and the other is a secondary field stop (2FS) at the Gregorian focus (Ref. 47).
The OTA was designed to fulfill the following scientific and engineering requirements:
3) To resolve at least 0.2 arcsec solar features over a field view of 320 x 160 arcsec
4) To offer a negligible chromatic aberration with a wide coverage of observation wavelengths from 388 to 668 nm without focus adjustment and to give a well-defined optical interface with FPP
5) To provide negligible instrumental polarization before a polarization modulator for precise polarization measurements
6) To accommodate thermal design to reject unwanted solar light from the telescope components as early as possible.
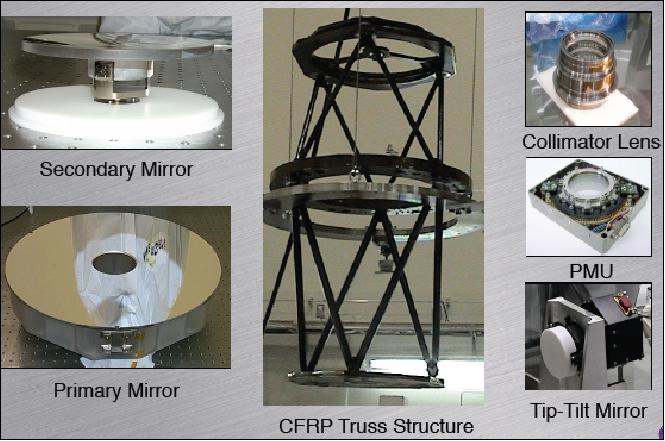
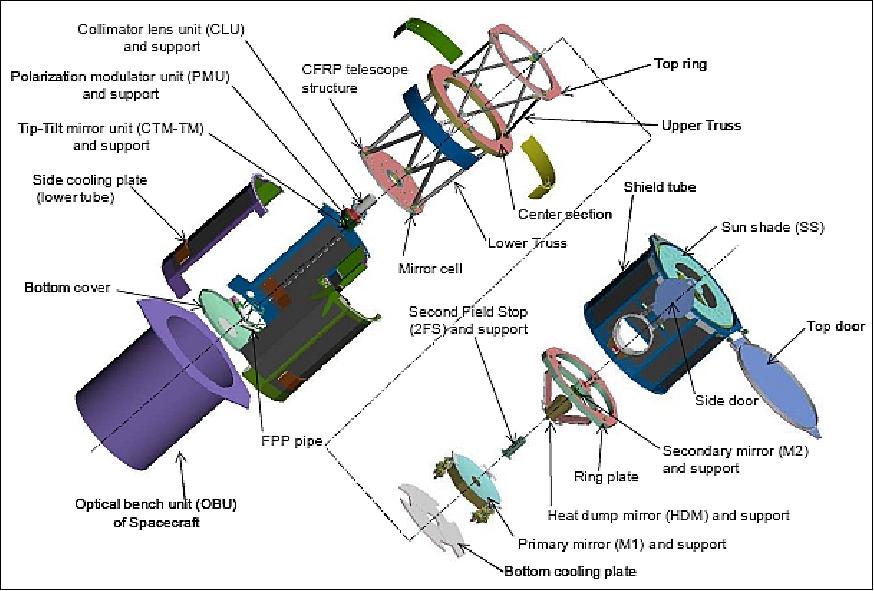
A layout of overall the OTA structural assembly is shown in Figure 31. The center panel ring (called center section) provides the mechanical interface to the spacecraft. OTA is mounted on the CFRP-made cylindrical optical bench unit (OBU) to the spacecraft with three quasi-kinematic titanium alloy mounting legs with stress-relief spring structures. The center section is equipped with alignment cubes at the top surface which represent the mechanical and optical axes of the OTA; they are used for co-alignment among other telescopes and spacecraft attitude control system sun sensors.
The primary mirror, made of light-weighted (70% removed and thus only 14 kg mass) ULE, is supported by three stress-free mounting mechanisms seated on the CFRP bottom panel (called mirror cell), interfaced with three superinvar pads bonded on the side of the mirror. The pad interface of the mounting mechanism is torque-free about three axes and also free in the radial direction, thus providing a kinematic mount for the primary mirror (Ref. 47).
Note: ULETM (Ultra-Low Expansion) is a glass material of Corning Glass that exhibits no dimensional changes over extreme temperature variations; it is generally considered to be one of best in the world for astronomical optics.
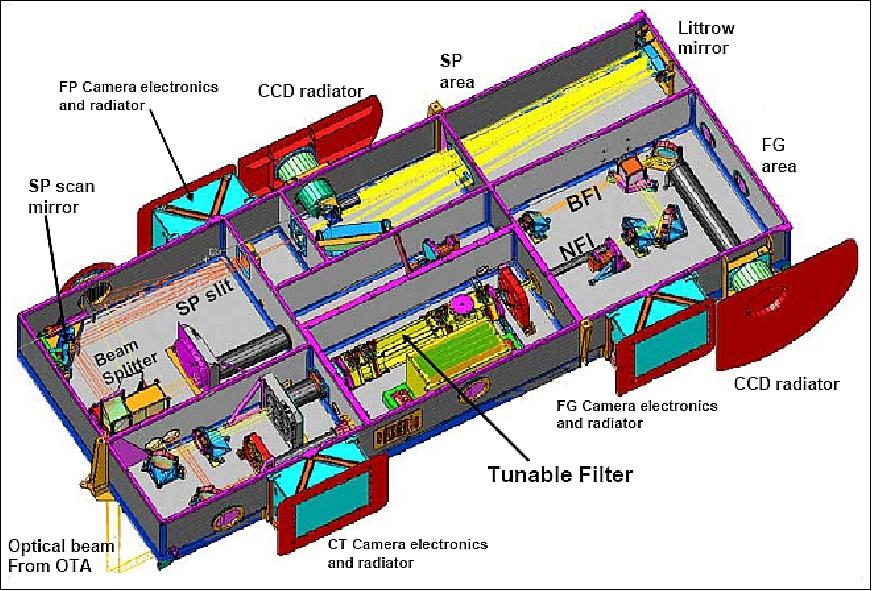
FPP (Focal Plane Package): The FPP structure consists of an aluminum honeycomb optical bench with side panels and a cover plate. Note that because of the large depth of focus, using aluminum with large CTE (Coefficient of Thermal Expansion) does not pose a problem. The FPP box is mounted on the OBU by a spacecraft-provided kinematic mount. The FPP is thermally isolated from the OBU. Each CCD detector is cooled by its own dedicated radiator. The FPP includes the NFI (Narrowband Filter Imager) and BFI (Broadband Filter Imager), plus the Stokes spectro-polarimeter (SP).
The FPP (Figure 27) has a re-imaging lens followed by the beam splitter. The effective combined focal length is 1550 cm (f/31), and the depth of focus in the FPP focal plane is about 400 µm. The focus is adjusted by moving the re-imaging lens through commands from the ground. The re-imaging lens has a stroke of ±25 mm to have a sufficient margin based on the focus budget breakdown table, which has numerous deterministic and statistical factors (Ref. 6).
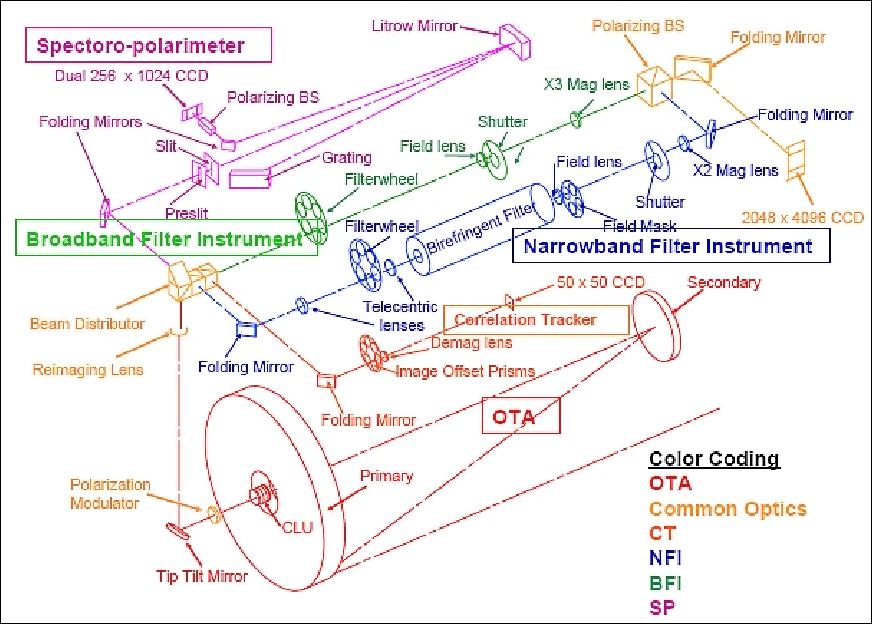
On the downstream side of the beam splitter are the broadband and narrow-band filter channels sharing a common CCD camera, the spectro-polarimeter, and the correlation tracker. A non-polarizing beam splitter divides the light between SP and the filtergraph (Filter Imager), and then the polarizing beam splitter in the filter channel transmits the p-polarized light to the NFI and the s-polarized light to the BFI.
The FPP electrical box (FPP-E) has the computer for controlling the FPP and performs onboard data-processing such as Stokes demodulation. The other electrical box (FPP-PWR) contains the power supply for the entire FPP subsystem. The MDP (Mission Data Processor) controls the FPP observations.
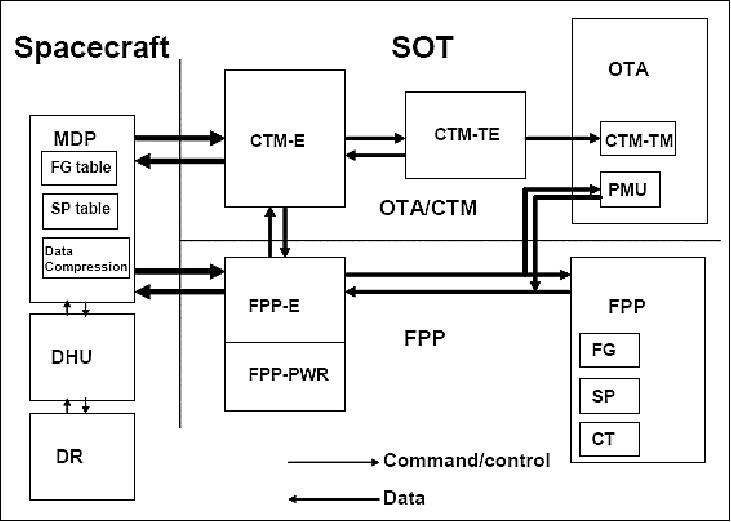
Legend to Figure 32: OTA (Optical telescope Assembly), FPP (Focal Plane Package), PMU (Polarization Modulation Unit), CTM-TM (Tip-Tilt fold Mirror), MDP (Mission Data Processor), FPP-E (main electronics box for FPP), FPP-PWR (power supply for FPP subsystem), CTM-E (main electronics box for OTA and TTM), CTM-TE(analog driver for the TTM), DHU (spacecraft Data handling Unit), DR (spacecraft central Data Recorder), CT (Correlation Tracker) a high speed CCD camera.
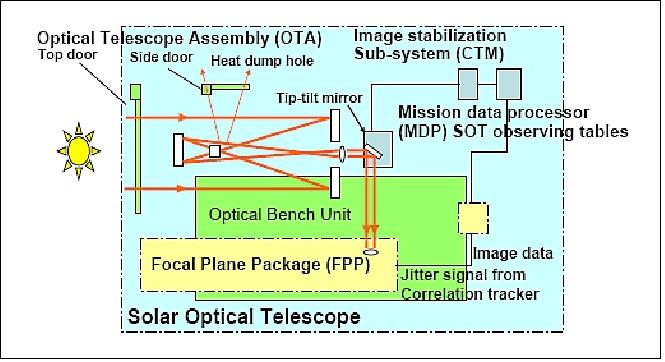
SOT observing modes: With the CLU (Collimator Lens Unit) and the tip-tilt fold mirror, the OTA delivers a pointing-stabilized parallel beam to the FPP. The FPP is configured with the re-imaging lens followed by the beam-splitter for the filtergraph, the spectro-polarimeter, and the correlation tracker channels. FPP performs both filter (FG) and spectral (SP) observations at high polarimetric precision, and both types of observation may be performed simultaneously yet independently in response to the macro-commands from MDP (Ref. 6).
In filter observation, a 4 k x 2 k CCD camera is shared by the broadband (BFI) and narrowband (NFI) filter imagers, and the NFI and BFI are selected by a common mechanical shutter. The SP and CT have their own CCD detectors. The NFI uses a tunable birefringent filter (Lyot filter) to record filtergrams, Dopplergrams, and longitudinal and vector magnetograms across the spectral range from 517.0 - 657.0 nm, including several spectral lines: Mg ib (517.3 nm; chromospheric Dopplergram and Magnetogram), Fe i (525.0, 524.7, 525.0 nm), Fe i (557.6 nm), Na i (589.6 nm; chromospheric Dopplergram and Magnetogram), Fe i (630.3, 630.2nm), and H i (656.32 nm; chromospheric structure). The BFI has interference filters to image the photosphere (CN i 388.3 nm, CH i 430.5 nm) and low chromosphere (Ca ii H 396.9 nm), and to make blue (450.5 nm), green (555.1 nm), and red (668.4 nm) continuum measurements for irradiance studies.
The SP is an off-axis Littrow-Echelle spectrograph that records dual-line (Fe i 630.25 nm and Fe i 630.15 nm) dual beam (with the polarization beam splitter, which is a polarization analyzer, in front of SP CCD) Stokes spectra for high precision Stokes polarimetry.
The time sequencing of the science data acquisition by SOT is controlled according to observation tables (one for FG and the other for SP) on the MDP.
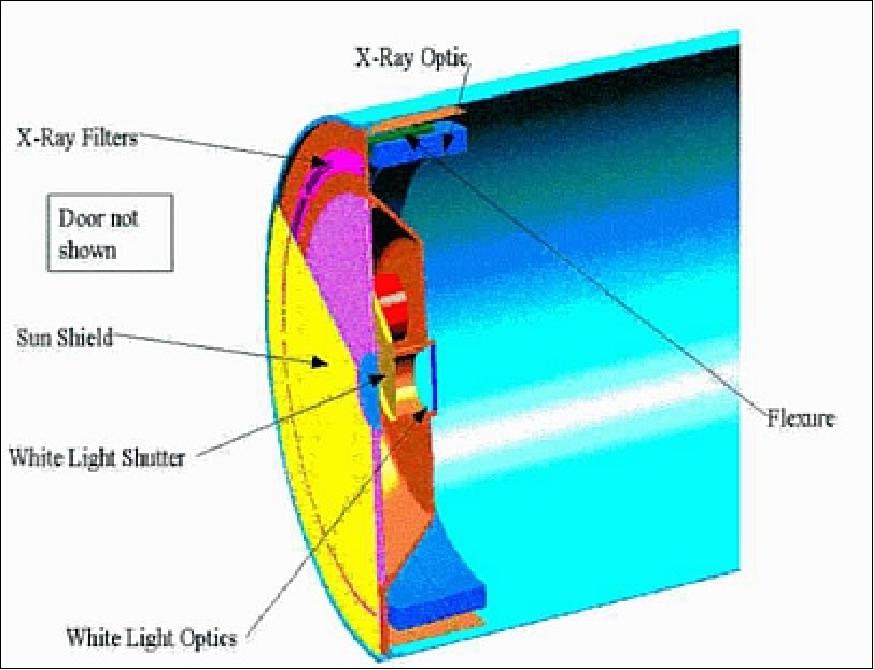
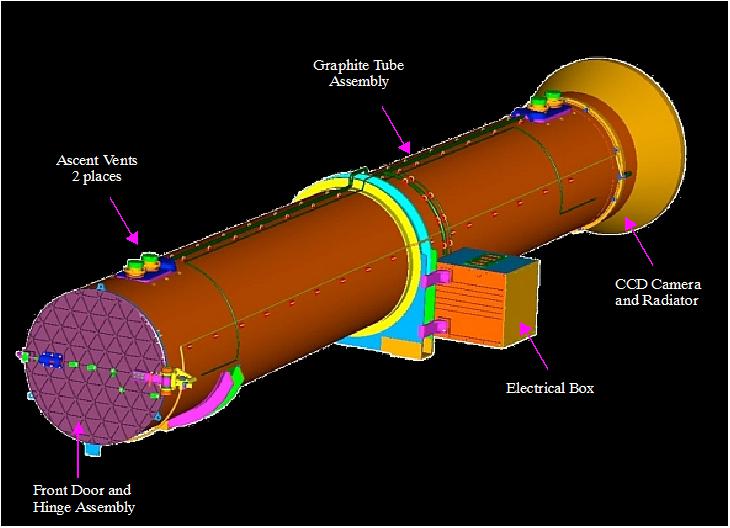
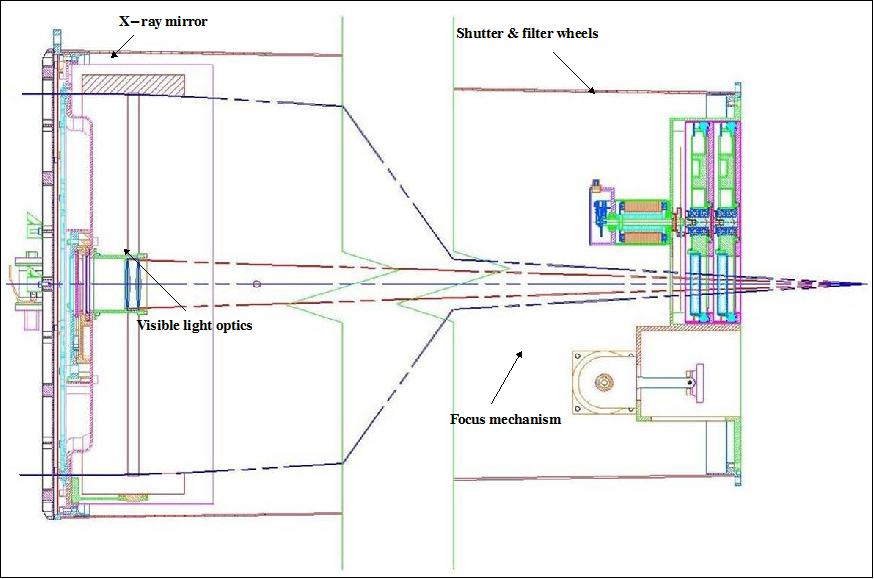
XRT (X-Ray Telescope)
XRT is of SXT (Soft X-ray Telescope) heritage flown on Yohkoh. XRT is a cooperative instrument between NASA and JAXA. NASA provides the grazing-incidence mirror optics, built by Goodrich Corporation and the SAO (Smithsonian Astrophysics Observatory) team, while JAXA/NAOJ provide the CCD camera. XRT images the high temperature plasma of the corona (0.5 to 20 MK) with an improved angular resolution - a few times better than Yohkoh's SXT. 49) 50)
The XRT has two optical systems. One is for X-ray and the other is for visible light (G-band). The optics layout is similar to Yohkoh/SXT and these optical systems make X-ray and G-band images on one CCD. - XRT has two filter wheels for X-ray analysis filters and a G-band filter. These filter wheels have in total 12 positions (6 position in each filter wheel), 9 positions are used for X-ray analysis filters and one for the visible-light filter. The X-ray analysis filters provide the capability of temperature analysis over the range 6.1 < log T < 7.5. 51) 52) 53)
To provide a high-resolution soft X-ray image with low noise and large dynamic range, the data acquisition system for XRT uses a single 2 k x 2 k pixel CCD array. The CCD is being operated at a temperature of -43º C on orbit. XRT can take partial frame images. The sizes of partial frame images are: 64, 128, 192, 256, 384, 512, 768, 1024, 1536, or 2048 pixels. XRT is equipped with a modified Wolter I grazing-incidence (GI) X-ray telescope to image the full sun disk at ~ 1.5 arcsec angular resolution onto a 2048 x 2048 back-illuminated CCD focal plane detector.
X-ray Optics (Optimized Wolter-I Grazing Incidence Optics) | |
Focal length | 2708 mm |
Aperture diameter | > 340 mm |
Spectral band width | 2 - 200 Å |
Effective area | 5.0 cm2 @ 0.56 keV & 1 keV |
FOV (Field of View) | Full disk or partial disk (> 30 arcmin) |
|
|
Temperature range | 6.1 < log T < 7.5 |
Temperature discrimination | log T = 0.2 |
Temporal resolution | Cadence = 2 s (reduced FOV), exposure time: min = 4 ms, max = 10 s |
Visible Optics | |
Focal length | 2708 mm |
Wavelength | 4305 Å (G-band) |
FOV | > 30 arcsec |
Camera CCD | |
CCD type | 2 k x 2 k back-illuminated CCD (E2C/CCD 42-40 of E2V Technologies Ltd.) |
Pixel size | 13.5 x 13.5 µm (corresponding to 1 arcsec x 1 arcsec resolution) |
Data | Coronal images at different temperatures |
The onboard instrument MDP (Mission Data Processor) controls the XRT observations providing the following functions:
• Observation controlled by observation tables (FOV, time cadence)
• Automatic Exposure Control (AEC). MDP achieves the proper exposure time by analyzing the intensity distribution of the observed X-ray images.
• Automatic Region Selector (ARS)
• Flare Detection (FLD). MDP can detect the occurrence of a flare using flare patrol images taken by XRT.
• Pre-Flare Buffer
• Image compression. MDP can compress the image data using either JPEG (lossy) or DPCM (lossless) method.
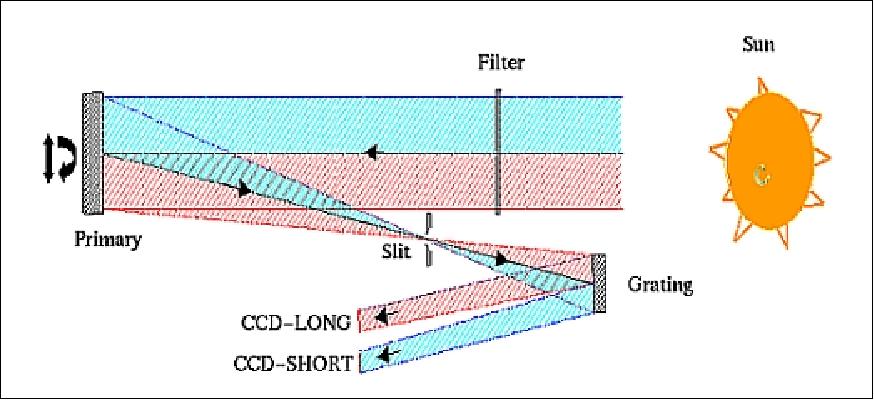
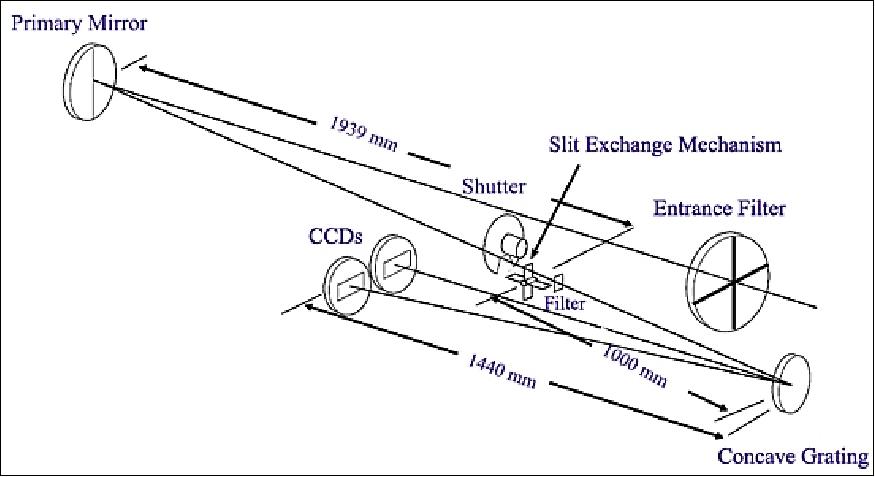
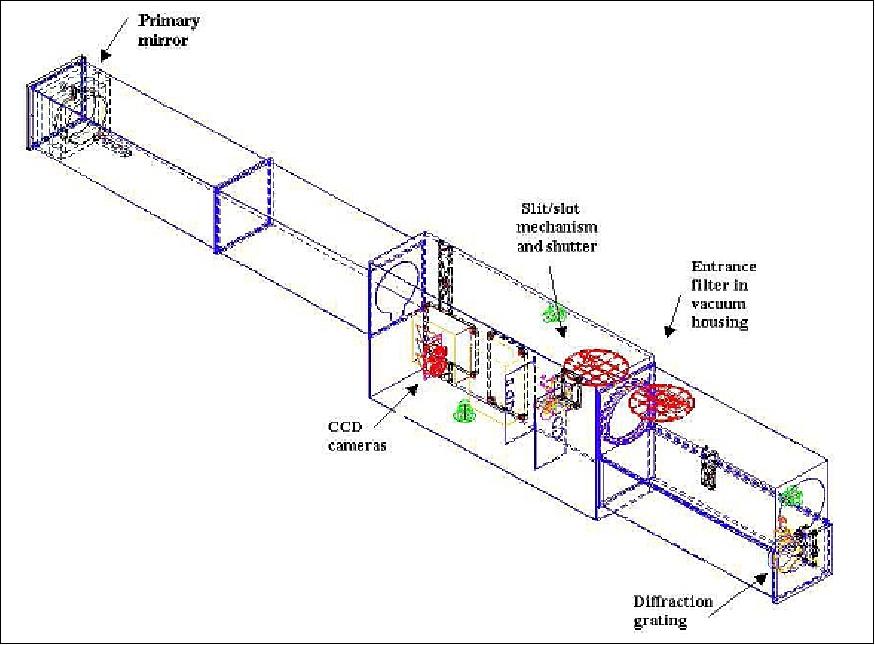
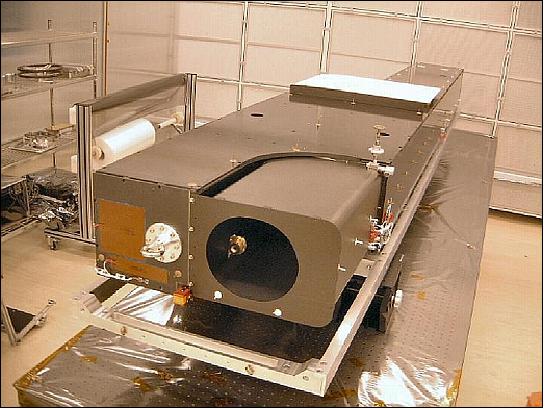
EIS (EUV Imaging Spectrometer)
PPARC provides the EIS instrument with NASA and JAXA/NAOJ participating with some hardware and software. EIS is primarily aimed at observing the dynamics of the solar corona. The objective of EIS is to determine velocity fields and other plasma parameters in the corona and the transition region, thus helping to relate coronal dynamic behavior, observed with the XRT, to the underlying photospheric magnetic field, observed with the optical telescope. The EIS instrument is also expected to unveil inflow and outflow of magnetic reconnection, and hence together with the two other telescopes, to finally solve long-standing controversies on coronal heating and dynamics. 54) 55) 56) 57) 58) 59)
EIS represents the next stage in the development of scanning imaging EUV spectrometers. The instrument consists of a multi-layer coated single mirror telescope, and a stigmatic imaging spectrometer incorporating a multilayer coated diffraction grating. The image produced by the primary mirror is imaged onto and entrance slit/slot and the light which passes through this spectrometer aperture is dispersed and re-imaged in the focal plane of the CCD detector. - The EIS instrument uses a panel construction to form the instrument box with all the optical subsystems mounted on a single 3.5 m long optical bench. The panels are made from thin CFRP (Carbon Fiber Reinforced Plastic) laminates with a sandwich core of aluminium honeycomb.
The telescope is an off-axis paraboloid design with a focal length of 1.9 m and a mirror diameter of 150 mm. EIS has a total length of 3 m. Multilayer toroidal gratings disperse the spectrum onto 2 detectors, each covering 40 Å.
Telescope | |
Aperture diameter | 150 mm (off-axis parabola) |
Focal length | 1934 mm |
Off-axis distance | 70 mm |
Plate scale at slit | 9.4 µm/arcsec |
Slit and slot | 1 arcsec, 2 arcsec, 40 arcsec, and 266 arcsec width at primary focus |
Fine mirror scan range | ±3 arcmin solar image motion |
Large FOV translation | ±800 arcsec shift of FOV center in East-West direction |
Spectrometer | |
Grating | Toroid; holographic laminar, uniform line spacing |
Wavelength ranges | 170-210 Å and 250-290 Å (the reflectivity of the mulitlayers restrict the performance below 180 Å and above 204 Å) |
Dispersion | 1.65 Å/mm or 0.0223 Å/CCD pixel |
Angular resolution | 2 arcsec; four slit/slot positions are available: 1 arcsec slit, 2 arcsec slit, 40 arcsec slot, and 266 arcsec |
Spectral/velocity resolution | 3 km/s for Doppler velocities, 20 km/s for line widths |
Temporal resolution |
|
Data | Doppler line widths and shifts and monochromatic images |
CCD Camera | |
Device | Marconi 42-20, MPP |
Format (spatial x spectral) | 1024 x 2048 pixels |
Pixel size | 13.5 µm |
Readout electronics |
|
EIS provides monochromatic images of the transition region and the corona at high cadence using a slot. High spectral resolution images can be obtained by rastering with a slit. EIS is able to response to XRT's trigger. In addition it uses internal triggers - a flare trigger and a brightpoint trigger. Furthermore, there is an ability for automatic exposure control of the slots. 60)
Some science goals of EIS are:
• Active region loops: spatial determination of physical conditions as functions of position and time in active region loops
• Coronal hole boundaries: measurements of physical parameters inside and outside of coronal holes
• Quiet sun brightenings: determination of the relationship between different categories of quiet sun events
• Solar flares: spatial determination of evaporation, location of turbulence, and detection and measurement of reconnection flows in flares
• CME (Coronal Mass Ejection) onset: spatial velocity and dimming measurements at high temporal resolution.
Effective area | 0.5 cm2 peak @ ~195 Å for 170-210 Å band | |
Expected line intensity from 1 arcsec x 1 arcsec area | Quiet sun | ~30 photon/s for Fe XII 195 |
Active region | ~9 x 10² photon/s for Fe XII 195 | |
M2 class flare | ~1 x 10⁵ photon/s for Fe XXIV 192 | |
Accuracy of measurement | Doppler velocity: delta v=1.0 km/s for ~1x10³ photons (Fe XV 284) | |
Data compression in MDP (Mission Data Processor) | Bit compression: 16 to 12 bit or 14 to 12 bit compression | |
Data rate | ~1/8 of total telemetry; ~40 kbit/s after compression | |
Control of EIS observation | Observing sequence in EIS ICU (Instrument Control Unit) | |
References
1) http://www.isas.jaxa.jp/e/enterp/missions/hinode/index.shtml
2) http://www.jaxa.jp/projects/sat/solar_b/index_e.html
3) T. Kosugi, K. Matsuzaki, T. Sakao, T. Shimizu, Y. Sone, S. Tachikawa, T. Hashimoto, K. Minesugi, A. Ohnishi, T. Yamada, S. Tsuneta, H. Hara, K. Ichimoto, Y. Suematsu, M. Shimojo, T. Watanabe, S. Shimada, J. M. Davis, L. D. Hill, J. K. Owens, A. M. Title, J. L. Culhane, L. K. Harra, G. A. Doschek, L. Golub, "The Hinode (Solar-B) Mission: An Overview," Solar Physics, Vol. 243, No 1, June 2007, pp. 3-17
4) http://www.isas.ac.jp/home/solar/
5) Takeo Kosugi, "International Collaboration to Study the Nature of Solar Activity," URL: http://www.jaxa.jp/article/special/solar-b/1/index_e.html
6) S. Tsuneta, K. Ichimoto, Y. Katsukawa, S. Nagata, M. Otsubo, T. Shimizu, Y. Suematsu, M. Nakagiri, M. Noguchi, T. Tarbell, A. Title, R. Shine, W. Rosenberg, C. Hoffmann, B. Jurcevich, G. Kushner, M. Levay, B. Lites, D. Elmore, T. Matsushita, N. Kawaguchi, H. Saito, I. Mikami, L. D. Hill, J. K. Owens, "The Solar Optical Telescope for the Hinode Mission: An Overview," Feb. 18, 2008, arXiv:0711.1715v3 [astro-ph], URL: http://arxiv.org/ftp/arxiv/papers/0711/0711.1715.pdf
7) Hirohisa Hara, "Hinode: A New Solar Observatory in Space," The Japan Society of Plasma and Nuclear Fusion Research, Vol. 2, 2007, p. 1008
8) Katsuhiko Tsuno, Takahisa Yamamoto, Masahito Kubo, Yoshifumi Shimizu, Eiji Hirokawa, Tatsuaki Hashimoto, "CCD sun sensors on board "Hinode" Solar Observatory," Proceedings of the 7th ICSO (International Conference on Space Optics) 2008, Toulouse, France, Oct. 14-17, 2008
9) Y. Katsukawa, Y. Masada, T. Shimizu, S. Sakai, K. Ichimoto, "Pointing Stability of Hinode and Requirements for the next Solar Mission Solar-C," ICSO 2010 (International Conference on Space Optics), Rhodes Island, Greece, Oct. 4-8, 2010, URL: http://congrex.nl/ICSO/Papers/Session%2011b/FCXNL-10A02
-1987998-1-icso_paper_katsukawa.pdf
10) http://solarb.msfc.nasa.gov/
11) S. Tsuneta, K. Ichimoto, Y. Suematsu, T. Shimizu, H. Hara, R. Kano, S. Nagata, T. Tamura, M. Nakagiri, M. Noguchi, Y. Kato, T. Watanabe, Y. Hanaoka, M. Sawa, M. Otsubo, T. Kosugi, T. Yamada, T. Sakao, K. Matsuzaki, K. Minesugi, A. Onishi, Y. Katsukawa, K. Kobayashi, M. Kubo, "Development of the Solar-B Spacecraft," 2001
12) http://www.esa.int/esaSC/SEM55CVHESE_index_0_m.html
13) University of Göttingen,"Race at the edge of the Sun: Ions are faster than atoms: Astrophysicists observe physics phenomena in gas streams," Science Daily, 25 March 2019, URL: https://www.sciencedaily.com/releases/2019/03/190325130522.htm
14) E. Wiehr, G. Stellmacher and M. Bianda, "Evidence for the Two-fluid Scenario in Solar Prominences," The Astrophysical Journal, Volume 873, Number 2, Published: 12 March 2019, https://doi.org/10.3847/1538-4357/ab04a4
15) "Extended life for ESA's science missions," ESA Science & Technology, 14 November 2018, URL: http://sci.esa.int/director-desk/60943-extended-life-for-esas-science-missions/
16) "HINODE captures record breaking solar magnetic field," Science Daily, 6 Feb. 2018, URL: https://www.sciencedaily.com/releases/2018/02/180206100302.htm
17) Takenori J. Okamoto, Takashi Sakurai, "Super-strong Magnetic Field in Sunspots," The Astrophysical Journal Letters, Volume 852, No 1, Jan. 4, 2018, L16 , DOI: 10.3847/2041-8213/aaa3d8, URL of abstract: http://iopscience.iop.org/article/10.3847/2041-8213/aaa3d8/meta
18) ""Invisible" Solar Nanoflares confirmed by ultra-high sensitivity observations," JAXA Press Release, 10 Oct. 2017, URL: http://global.jaxa.jp/press/2017/10/20171010_hinode.html
19) Shin-nosuke Ishikawa, Lindsay Glesener, Säm Krucker, Steven Christe, Juan Camilo Buitrago-Casas, Noriyuki Narukage, Juliana Vievering, "Detection of nanoflare-heated plasma in the solar corona by the FOXSI-2 sounding rocket," Nature Astronomy, Volume 1, pages771–774 (2017), https://www.nature.com/articles/s41550-017-0269-z Published online: 09 October 2017
20) "A joint observation by solar observing satellites Hinode and IRIS quantitatively explores the formation of the solar chromosphere," JAXA/ISIS, NAOJ, Nagoya University/ISEE, Oct. 31, 2016, URL: http://hinode.nao.ac.jp/en/news/results/formation-mechanisms-of-the-solar-chromosphere-revealed-by-hinode-and-iris/
21) Ryuichi Kanoh, Toshifumi Shimizu, Shinsuke Imada, "Hinode and IRIS Observations of the Magnetohydrodynamic Waves Propagating from the Photosphere to the Chromosphere in a Sunspot," The Astrophysical Journal, Vol. 831, published on October 24, 2016, URL of abstract: http://iopscience.iop.org/article/10.3847/0004-637X/831/1/24
22) "Hinode, IRIS, and ATERUI Cooperate on 70 year old Solar Mystery -Magnetically driven resonance helps heat the Sun's atmosphere!," NAOJ, Aug. 24, 2015, URL: http://hinode.nao.ac.jp/en/news/results/hinode-iris-and-aterui-cooperate-on-70-year-old-solar-mystery-magnetically-driven-resonance-helps-he/
23) "Highlights from a Decade of JAXA and NASA's Hinode Solar Observatory," NASA, Sept. 22, 2016, URL: https://www.nasa.gov/feature/goddard/2016/highlights-from-a-decade-of-jaxa-and-nasa-s-hinode-solar-observatory
24) "Hinode captured the transit of Mercury across the Sun," JAXA, May 11, 2016, URL: http://global.jaxa.jp/projects/sat/solar_b/topics.html#topics7606
25) "NASA Response to the 2015 Senior Review for Heliophysics Operating Missions," NASA, July 10, 2015, URL: http://science.nasa.gov/media/medialibrary/2015
/07/10/NASAResponse2015SeniorReview_FINAL.pdf
26) "The 2015 Senior Review of the Heliophysics Operating Missions, NASA, June 11, 2015, URL: http://science.nasa.gov/media/medialibrary/2015
/07/10/HeliophysicsSeniorReview2015_FINAL.pdf
27) "HINODE encountered annular solar eclipse," JAXA, Oct. 27, 2014, URL: http://global.jaxa.jp/projects/sat/solar_b/topics.html#topics3256
28) "Hinode Captures Images of Partial Solar Eclipse," NASA; Oct. 23, 2014, URL: http://www.nasa.gov/mission_pages/hinode/partial_eclips_2014.html#.VLKFC3vGX_V
29) "Hinode Views Sunspot Activity," NASA, March 5, 2014, URL: http://www.nasa.gov/mission_pages/hinode/multimedia/solar-flares-active-region-11967.html#.UxgNi87ihqN
30) "HINODE captured total solar eclipse over Australia," JAXA, Nov. 19, 2012, URL: http://www.jaxa.jp/projects/sat/solar_b/index_e.html
31) "Polar Field Reversal as observed with Hinode," NAOJ, April 19, 2012, URL: https://web.archive.org/web/20160326083720/http://hinode.nao.ac.jp/news/120419PressRelease/index_e.shtml
32) "Hinode observations revealed polar field reversal only at North Pole of the Sun!," April 20, 2012, URL: http://www.jaxa.jp/projects/sat/solar_b/topics_e.html
33) "Activity of Sunspot Cycle 24," August 9, 2001, URL: http://solarb.msfc.nasa.gov/
34) "Hinode Looks Into a Hole on the Sun," NASA, URL: http://www.nasa.gov/mission_pages/hinode/index.html
35) "Annular solar eclipse observed by HINODE," January 7, 2011, JAXA, URL: http://www.jaxa.jp/projects/sat/solar_b/topics_e.html
36) Saku Tsuneta, "Hinode: A New Solar Observatory in Space," AAPPS (Association of Asia Pacific Physical Sciences) Bulletin June 2009, Vol. 19, No. 3, URL: http://www.cospa.ntu.edu.tw/aappsbulletin/data/19-3/11Hinode.pdf
37) Saku Tsuneta, Hinode - A New Solar Observatory in Space," AAPPS Bulletin, June 2009, Vol. 19, No. 3, pp. 11-18, URL: http://www.cospa.ntu.edu.tw/aappsbulletin/data/19-3/11Hinode.pdf
38) "Hinode: source of the slow solar wind and superhot flares,", April 2, 2008, ESA, URL: http://www.esa.int/esaSC/SEMJQK5QGEF_index_0.html
39) http://www.esa.int/esaSC/SEMKPG9RR1F_index_0.html
40) Kiyoshi Ichimoto and the Hinode/SOT team, "Solar Optical Telescope onboard Hinode for Diagnosing the Solar Magnetic Fields," The Japan Society of Plasma Science and Nuclear Fusion Research, Volume 2, 2007, S1009 -1 to S1009-6
41) T. Watanabe and the Solar-B Team, "Solar-B Scientific Operation and its Observation Modes," 35th COSPAR Scientific Assembly, Paris, France, July 18-25, 2004
42) T. Kosugi and the Solar-B Team, "Solar-B: A New Challenge to the Magnetic Sun," 35th COSPAR Scientific Assembly, Paris, France, July 18-25, 2004
43) C. Korendyke, C. Brown, J. Seely, S. Myers, "International collaboration yields a high-performance EUV spectrometer for Solar-B spacecraft," SPIE's oe magazine (Optical Engineering), Aug. 2002, pp. 23-26
44) S. Tsuneta, A. Title, "Science with Solar-B Solar Optical Telescope," 5th COSPAR Scientific Assembly, Paris, France, July 18-25, 2004
45) S. Tsuneta, "Solar-B Mission and Optical Telescope Assembly,"URL: http://hinode.nao.ac.jp/en/for-researchers/meeting-archive/sot17/files/1-01/SOLAR-B%20Mission%20and%20Optical%20Telescope%20Assembly%20(Tsuneta).pdf
46) Solar Optical Telescope (SOT), URL: http://solarwww.mtk.nao.ac.jp/SBmeetings/SB_Sci05SOT.pdf
47) Yoshinori Suematsu, Kiyoshi Ichimoto, Yukio Katsukawa, Saku Tsuneta, Toshifumi Shimizu, "Instrument design and on-orbit performance of the Solar Optical Telescope aboard Hinode (SOLAR-B)," Proceedings of the 7th ICSO (International Conference on Space Optics) 2008, Toulouse, France, Oct. 14-17, 2008
48) Kiyoshi Ichimoto, Saku Tsuneta, Yoshinori Suematsu, Toshifumi Shimizu, Masashi Otsubo, Yoshihiro Kato, Motokazu Noguchi, Masao Nakagiri, Tomonori Tamura, Yukio Katsukawa, Masahito Kubo, Yasushi Sakamoto, Hirohisa Hara, Kenji Minesugi, Akira Ohnishi, Hideo Saito, Noboru Kawaguchi, Tadashi Matsushita, Toshitaka Nakaoji, Kazuhiro Nagae, Joji Sakamoto, Yoshihiro Hasuyama, Izumi Mikami, Keizo Miyawaki, Yasushi Sakurai, Nobuaki Kaido, Toshihide Horiuchi, Sadanori Shimada, Toshio Inoue, Masaaki Mitsutake, Norimasa Yoshida, Osamu Takahara, Hidenori Takeyama, Masaharu Suzuki, Shun-ichi Abe, "The Solar Optical Telescope onboard the Solar-B," Sept. 8, 2004
49) L. Golub, "New Dimensions in Coronal Studies from the XRT on Solar-B," 35th COSPAR Scientific Assembly, Paris, France, July 18-25, 2004
50) R. Kano, T. Sakao, H. Hara, S. Tsuneta, K. Matsuzaki, K. Kumagai, M. Shimojo, K. Minesugi, K. Shibasaki, E. E. DeLuca, L. Golub, J. Bookbinder, D. Caldwell, P. Cheimets, J. Cirtain, E. Dennis, T. Kent, M. Weber, "The Hinode X-Ray Telescope (XRT): Camera Design, Performance and Operations," Solar Physics, ISSN: 0038-0938 (Print) 1573-093X (Online), DOI: 10.1007/s11207-007-9058-7, SpringerLink Date: Dec. 25, 2007, URL: http://xrt.cfa.harvard.edu/resources/pubs/XRT2.pdf
51) E. DeLuca, "The X-Ray Telescope for Solar-B," 37th AAS/SPD (Solar Physics Division) Meeting, UNH, Durham, NH, USA, June 25-30, 2006
52) X-ray Telescope (XRT), URL: http://solarwww.mtk.nao.ac.jp/SBmeetings/SB_Sci05XRT.pdf
53) T. Sakao, R. Kano, H. Hara, K. Matsuzaki, M. Shimojo, S. Tsuneta, T. Kosugi, K. Shibasaki, K. Kumagai, M. Sawa, T. Tamura, S. Iwamura, M. Nakano, Z. Du, K. Hiyoshi, M. Horii, L. Golub, J. A. Bookbinder, P. C. Cheimets, L. D. Hill, J. K. Owens, "Focal Plane CCD Camera for the X-Ray Telescope (XRT) aboard SOLAR-B," Sept. 8, 2004
54) J. L. Culhane, G. A. Doschek, T. Watanabe, "Solar-B EIS and its Scientific Goals," 35th COSPAR Scientific Assembly, Paris, France, July 18-25, 2004
55) J. Len. Culhane, George A. Doschek, Tetsuya Watanabe, James Lang,, "The EUV Imaging Spectrometer and its Role in the Solar-B Mission," URL: http://msslxr.mssl.ucl.ac.uk:8080/SolarB/docs/solarb.pdf
56) G. A. Doschek, C. M. Brown, C. M. Korendyke, J. T. Mariska, S. H. Myers, J. F. Seely, K. P. Dere, J. Lang, J. L. Culhane, T. Watanabe, "The Extreme Ultraviolet Imaging Spectrometer (EIS) on Solar-B," Summer 2006 Solar Physics Division/AAS meeting, University of New Hampshire, Durham, New Hampshire, USA, June 25-26, 2006
57) J. L. Culhane, L. K. Harra, G. A. Doschek, J. T. Mariska, T. Watanabe, H. Hara, "The Solar-B EUV imaging spectrometer and its science goals," Advances in Space Research, Vol. 36, Issue 8, 2005, pp. 1494-1502
58) J. L. Culhane, L. K. Harra, A. M. James, K. Al-Janabi, L. J. Bradley, R. A. Chaudry, K. Rees, J. A. Tandy, P. Thomas, M. C. R. Whillock, B. Winter, G. A. Doschek, C. M. Korendyke, C. M. Brown, S. Myers, J. Mariska, J. Seely, J. Lang, B. J. Kent, B. M. Shaughnessy, P. R. Young, G. M. Simnett, C. M. Castelli, S. Mahmoud, H. Mapson-Menard, B. J. Probyn, R. J. Thomas, J. Davila, K. Dere, D. Windt, J. Shea, R. Hagood, R. Moye, H. Hara, T. Watanabe, K. Matsuzaki, T. Kosugi, V. Hansteen, and O. Wikstol, "The EUV Imaging Spectrometer for Hinode," Solar Physics, Vol. 243, No 1, June 2007, pp. 19-61
59) H. Hara, "EUV Imaging Spectrometer," 2005, URL: http://stereo-ssc.nascom.nasa.gov/meetings/STEREO_SolarB_Hawaii
_2005/Hara/Solar-B_EIS_2005Nov_Hawaii.pdf
60) http://msslxr.mssl.ucl.ac.uk:8080/SolarB/
The information compiled and edited in this article was provided by Herbert J. Kramer from his documentation of: "Observation of the Earth and Its Environment: Survey of Missions and Sensors" (Springer Verlag) as well as many other sources after the publication of the 4th edition in 2002. Comments and corrections to this article are always welcome for further updates (eoportal@symbios.space).
Spacecraft Launch Mission Status Sensor Complement References Back to Top