SIR-C (Shuttle Imaging Radar with payload C)
EO
NASA
Mission complete
SIR-C/X-SAR (Spaceborne Imaging Radar C/X-band Synthetic Aperture Radar) was an imaging radar system developed by the National Aeronautics and Space Administration (NASA), the German Space Agency (DLR), and the Italian Space Agency (ASI). It was used to obtain SAR (Synthetic Aperture Radar) imagery with many applications including scientific research, calibration, and technological experiments. SIR-C/X-SAR was a payload on the SRL-1 (Space Radar Laboratory-1) shuttle which operated over April 1994, and the SRL-2 (Space Radar Laboratory-2) shuttle which operated from September to October in 1994.
Quick facts
Overview
| Mission type | EO |
| Agency | NASA |
| Mission status | Mission complete |
| Launch date | 09 Apr 1994 |
| End of life date | 11 Oct 1994 |
| CEOS EO Handbook | See SIR-C (Shuttle Imaging Radar with payload C) summary |

Summary
Mission Capabilities
The SLR-1 and SLR-2 missions both flew with the same SIR-C/X-SAR payload. SIR-C comprised of a multipolarisation distributed L-band system and a multipolarization distributed C-band system, allowing for two-frequency observation capability. SIR-C/X-SAR also hosted an X-band payload making it the first spaceborne radar system to obtain simultaneous, multifrequency, fully polarized, repeat-pass interferometric SAR imagery.
Data obtained by SIR-C/X-SAR had applications across many areas of scientific research, including ecology, hydrology, geology, and oceanography. The SIR-C/X-SAR instrument also provided interferometric data for topographic mapping and surface-change monitoring.
Performance Specifications
Imagery obtained by the SIR-C/X-SAR instrument had a spatial resolution of 13 m in L-band, 26 m in C-band, and 10 m and 20 m in X-band. Swath width across L-band and C-band frequencies varied from 15 km to 90 km, while swath width in X-band varied from 15 km to 40 km.
The SLR-1 and SLR-2 shuttles followed a circular Earth orbit with a mean altitude of 225 km and an inclination of 57°.
Space and Hardware Components
The total mass of the SIR-C/X-SAR payload was 11,000 kg, filling the entire cargo bay of the SLR-1 and SLR-2 shuttles. The overall SIR-C/X-SAR antenna measured 12.0 m x 3.7 m and was comprised of three individual antennas operating at L-Band, C-Band, and X-Band frequencies. The L-band and C-band antennas were built by the Jet Propulsion Laboratory (JPL) and Ball Communication Systems Division for NASA and were constructed from separate panels allowing measurements of both horizontal and vertical polarizations. The X-SAR instrument was built by the manufacturers Dornier and Alenia Spazio for DLR and ASI. The X-SAR antenna was a slotted waveguide type and used a mechanical tilt to change the beam-pointing direction.
SIR-C/X-SAR Payload on STS-59 and STS-68 Missions
SLR Sensor Complement Sample SAR Data Collection Underflight Campaigns of SLR-1/-2 Missions
A Retrospective References
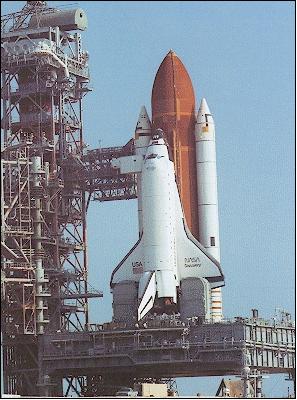
The SIR-C/X-SAR (Shuttle Imaging Radar with Payload C / X-SAR) payload was a cooperative NASA/JPL, DARA/DLR, and ASI (Agenzia Spaziale Italiana) project flown on Space Shuttle Endeavour. The SIR-C/X-SAR project was part of NASA's Mission to Planet Earth. The experiment is the next evolutionary step in NASA's SIR (Spaceborne Imaging Radar) program that began with the Seasat Synthetic Aperture Radar (SAR) in l978, and continued with SIR-A in l98l and SIR-B in l984. It also represents a continuation of Germany's imaging radar program which started with the MRSE (Microwave Remote Sensing Experiment) flown aboard the Shuttle on the first SPACELAB mission in l983.
This payload/mission is also known under the name of SRL (Space Radar Laboratory). It consisted of a radar antenna structure and associated radar system hardware designed to fit inside the Space Shuttle's cargo bay. The total payload mass was 11,000 kg with a power consumption of payload sensors of 3 - 9.0 kW. Two Shuttle missions were conducted, each of 10 days duration. 1) 2) 3) 4) 5) 6) 7) 8) 9) 10) 11) 12)
Launch
Launch of the SRL-1 (STS-59) mission on April 9, 1994. The mission lasted until April 20, 1994.
Launch of the SRL-2 (STS-68) mission on Sept. 30, 1994. The mission lasted until Oct. 11, 1994. During the second flight, the orbiter was able to fly nearly the same orbit as in the first flight. This permitted to collect a significant amount of data at all frequencies for use in repeat-pass interferometric SAR processing - resulting in elevation and change detection studies.
Objectives:
• Conduct geoscience investigations that require the observational capabilities of orbiting radar sensors, alone or in conjunction with other sensors, that will lead to a better understanding of the surface conditions and processes on the Earth.
• Explore regions of the Earth's surface that are not well characterized because of vegetation, cloud, or sediment cover in order to better understand land and ocean surface conditions and processes on a global scale.
• Incorporate this new knowledge into global models of surface and subsurface processes.
Application: Land use, geology, hydrology, oceanography, snow and ice, vegetation, calibration, and technological experiments.
Orbit: Shuttle circular Earth orbit, mean altitude of 225 km, inclination of 57º.
SAR antennas
The SIR-C design built upon the heritage of the SIR-A and SIR-B missions in the use of SAR technology to study Earth science. A multipolarization, distributed C-band system was added to the SIR-B payload, along with a more powerful multipolarization distributed L-band system. Instead of using a single, high-power transmitter, the distributed SIR-C radars consisted of numerous low-power solid-state transmitters distributed across the antenna aperture (phased array). Large power losses were avoided and as much as an eight-fold improvement in efficiency was possible. The distributed C- and L-band SIR-C radars (distributed amplification) allowed electronic beam steering in the range direction (123º) from a fixed antenna position of 38º (look angle), thus making it possible to acquire multi-incidence angle data without tilting the entire antenna.
The SIR-C payload implementation provided a two-frequency observation capability, a greatly increased improvement over the SIR-A and SIR-B missions. This was supplemented with a third payload in X-band (DLR/ASI instrument). Hence, the SIR-C/X-SAR payload was the first spaceborne radar system capable of obtaining simultaneously multifrequency (3) and multipolarization radar imagery.
The first introduction/demonstration of the following new technologies in the SIR-C/X-SAR missions represented major milestones in the field of spaceborne SAR observations.
• Fully polarimetric spaceborne SAR (for SIR-C payload)
• Multi-frequency (3), first use of spaceborne X-band
• Active phased array, electronically steered antenna (for SIR-C payload)
• Demonstration of ScanSAR operating mode for wide swath data acquisition
In addition, SIR-C/X-SAR provided the opportunity to identify the optimum wavelengths, polarizations, and illumination geometries for SAR imagery.
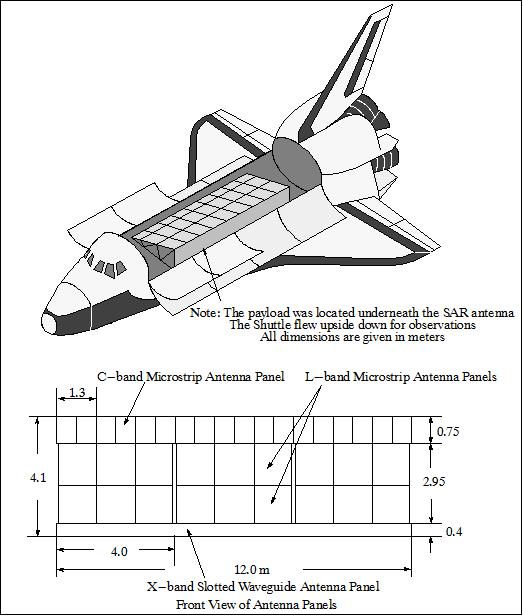
The overall size of the SIR-C antenna was 12.0 m x 3.7 m. The C-band antenna consisted of 18 panels, 28 T/R (Transmit/Receive) modules per panel (total: 504 T/Rs). The L-band antenna consisted of 18 panels, 14 T/R modules per panel (total: 252 T/Rs).
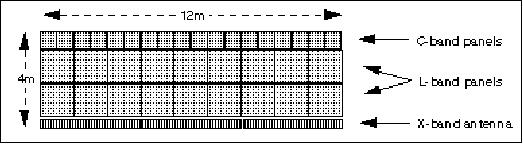
Figure 3: The SIR-C/X-SAR antenna system (image credit: JPL)
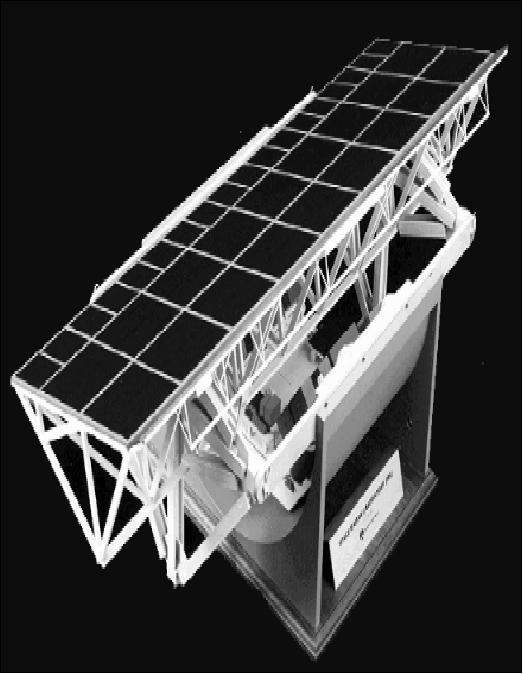
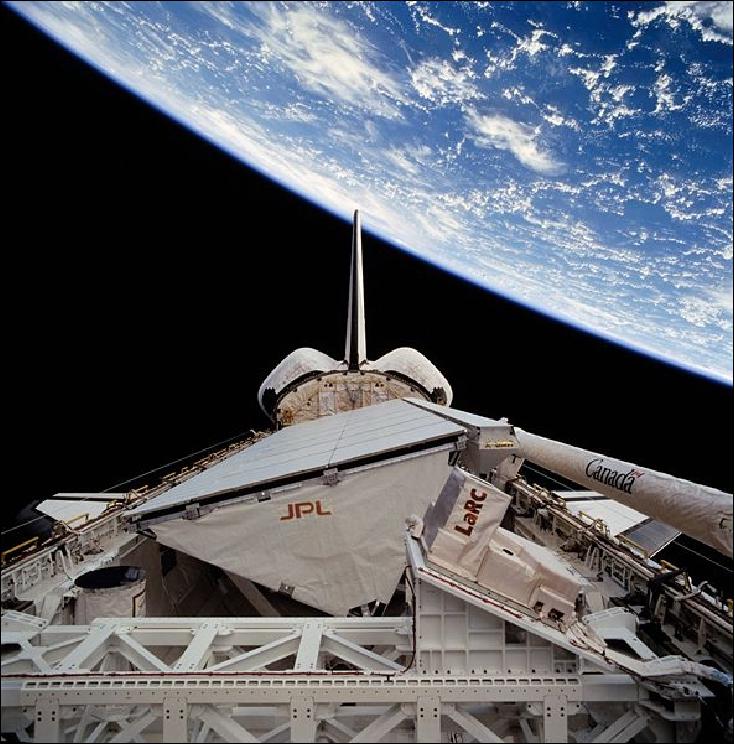
The photograph was taken with a hand-held 70-millimeter camera through the space shuttle's aft flight deck windows. SIR-C/X-SAR's antenna, with its large triangular support structure and flat antenna panels, almost fills the payload bay. Embedded in the antenna are hundreds of small transmitters and receivers. The antenna panels gather data simultaneously at three frequencies: C-Band, L-Band and X-Band. Six NASA astronauts spent a week and a half in Earth orbit in support of the radar mission.
Sensor Complement
All three SAR instruments were flown on each mission. Active microwave sensor observations are independent of the day/night cycle and mostly independent of the weather. - The SRL-2 orbit was nearly identical to that of SRL-1 permitting repeat cross-track interferometric SAR processing for measuring elevation as well as to detect change in the radar direction (a significant amount of data was collected at all three frequencies).
The dedicated payload filled the entire Shuttle cargo bay. The antenna was mounted in a tilted position and the Shuttle rolled to a nominal 38º look angle. In order to acquire data at look angles other than 38º with the conventional X-band system, the X-band antenna, which was mounted along the upper portion of the array, was mechanically tilted. 13)
Unlike the previous SIR-A and SIR-B missions, the SIR-C radar beam was formed from hundreds of small transmitters embedded in the surface of the radar antenna (phased array). By properly phasing the energy from these transmitters, the beam could be steered electronically without physically moving the large radar C-band antenna. This feature allowed imagery to be acquired from 15º to 55º angles of incidence.
Frequencies | L, C, and X-band |
Polarization | Polarimetric for L and C-band (i.e., HH,HV, VH, and VV for each band); X-band in VV |
Cross polarization isolation | 25 dB or greater |
System noise equivalent zero | L-band: -40 dB; C-band: -35 dB; X-band: -22 dB |
Spatial resolution - slant range direction | L-band and C-band:: 13 m and 26 m |
Spatial resolution - azimuth direction | 30 m |
Impulse response sidelobe ratio | -12 dB |
System ambiguity ration | -20 dB total |
Data acquisition | 50 hours/channel of observations |
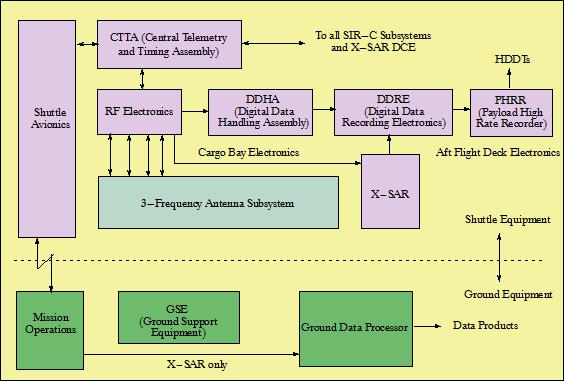
L-band SAR
L-band SAR (1.250 GHz, wavelength = 23.5 cm). The L-band antenna is a planar array (12 m x 2.95 m in size) composed of a uniform grid of dual-polarized microstrip antenna radiators, active phased arrays. Further details are given in Table 2. The SIR-C instrumentation was developed and built by JPL and the Ball Communication Systems Division for NASA and provided the L-band and C-band systems/measurements at different polarizations.
C-band SAR
C-band SAR (5.3 GHz, wavelength = 5.8 cm). The SIR-C payload comprised the L-band and C-band SAR antenna plus instrumentation. The SIR-C antenna boresights were steered electronically to provide coverage at varying distances from the Shuttle ground track. The SIR-C phased array also provided for broadening of the beam in the elevation direction from its minimum value of 5º to 16º (selection of seven values).
The SIR-C phased array enabled the operational modes of ScanSAR and Spotlight (first implementation of ScanSAR anywhere, developed by JPL). In ScanSAR, the antenna pattern coverage on the ground was stepped in the cross-track direction during the synthetic aperture period to allow coverage over a wider swath; however, at the expense of azimuth resolution. The swath width ranged from 15 to 65 km for calibrated images and 40 to 90 km for mapping mode (ScanSAR) images. For the Spotlight mode, the boresight was positioned in azimuth to dwell on a particular area as the Shuttle flew by. This permitted an increase in azimuth resolution to a value of 7 m for the selected area, at the expense of the along-track swath. The typical image size of the SIR-C payload was 100 km (azimuth, flight direction) x 50 km (swath).
For the SIR-C payload, the digital data handling subsystem had a mass of 145 kg and consumed about 800 W of power.
X-SAR
X-SAR (SAR for X-band Measurement (9.6 GHz, wavelength = 3.1 cm), provided by DARA/DLR and ASI, built by Dornier and Alenia Spazio). The X-SAR payload was of Germany's MRSE (Microwave Remote Sensing Experiment) heritage, flown aboard the Shuttle on the first Spacelab mission in l983. The program evolved eventually into the development of the X-SAR system at DLR with cooperation provided by ASI of Italy.
The X-SAR design used only vertical polarization (VV). The X-SAR instrument used a passive slotted-waveguide antenna (12 m x 0.4 m) which was tilted mechanically to align the X-band beam with the SIR-C C-band and L-band beams. The X-SAR antenna had a fixed beamwidth of 5.5º in elevation and 0.14º in azimuth as opposed to the phased array and multi-polarization antenna capabilities of SIR-C (the X-SAR antenna used metalized CFRP waveguide technology). The instantaneous area illuminated by the X-band antenna on the ground (footprint) was an ellipse of size 60 km x 0.8 km from an orbital altitude of 225 km. The electronics part of X-SAR was mounted on a cold plate structure and positioned underneath the antenna structure. A TWT (Travelling Wave Tube) amplifier was transmitting up to 1736 pulses/s at a peak transmit power of 3.35 kW. The pulses were frequency-modulated with a pulse length of 40 µs and a programmable bandwidth of 10 or 20 MHz.
Parameter | L-band system | C-band system | X-band system |
Frequency, wavelength | 1.25 GHz, 23.5 cm | 5.3 GHz, 5.8 cm | 9.6 GHz, 3.1 cm |
Antenna aperture length | 12.0 m | 12.0 m | 12.0 m |
Architecture of antenna | Active Phased Array | Slotted waveguide | |
Phase control | 4 bit | 4 bit | N/A |
Polarization | HH, HV, VH, VV | HH, HV, VH, VV | VV |
Polarization isolation | 25 dB | 25 dB | 39 dB |
Antenna gain | 36.4 dB | 42.7 dB | 44.5 dB |
Mechanical steering range | N/A | N/A | ±23º |
Electronic steering range | ±20º | ±20º | N/A |
Elevation beamwidth | 5-16º | 5-16º | 5.5º |
Azimuth beamwidth | 1.0º | 0.25º | 0.14º |
Transmit pulse length (µs) | 33.17, or 8.5 | 33.17, or 8.5 | 40 |
Radiometric resolution | 1.5 dB | 1.5 dB | 2.5 dB |
Peak radiated power | 4400 W | 1200 W | 1400 W |
System noise temperature | 450 K | 550 K | 551 K |
Mass of antenna structure | 3300 kg | 49 kg | |
Look angle (adjustable off-nadir angle) | 20º - 55º | 20º - 55º | 15º - 55º |
Swath width | 15 km - 90 km | 15 km - 90 km | 15 km - 60 km |
Azimuth resolution (4 look) | 30 m | 30 m | 25 m |
Range resolution with 10/20 MHz bandwidth | 25 m/13 m | 25 m/13 m | 20 m/10 m |
Data format | 8,4 bits/word | 8,4 bits/word | 8,4 bits/word |
Data rate per channel (total of 5 channels) | 45 Mbit/s per channel | 45 Mbit/s per channel | 45 Mbit/s |
Ground Segment
The science source data were digitally coded and formatted in DDHA - using BFPQ (Block Floating Point Quantization) a form of data compression from 8 bits/sample to 4 bits/sample - and recorded onboard by the PHRR (Payload High Rate Recorder), a system of several recorders which generated High Density Digital Tapes (HDDT). There were 180 HDDTs onboard to record the data (total volume of 32 Tbit). Portions of the science data were downlinked via TDRS (Ku-band, 50 Mbit/s) to permit quicklooks for the investigators (only one SAR data stream at a time could be transmitted). After the return of each mission, the HDDTs were taken and sent to JPL, DLR and ASI for processing and analysis.
Nominally, 50 hours of SIR-C data (on each of the four channels) and 50 hours of X-SAR data were recorded by onboard tape recorders. Data “takes” were largely over experiment sites selected prior to launch, with some in-flight “targets of opportunity.” The orbital altitude was trimmed for the last days of the second flight (SRL-2) to provide a repeat-track interferometric observation geometry. - The intent was to provide data calibrated in such a way as to allow comparisons with other spaceborne SAR data (eg., ERS-1, JERS-1, Radarsat, etc.) so that a time-series view of key geophysical parameters may be realized.
The SIR-C/X-SAR mission provided for the first time spaceborne polarimetric SAR data of the SIR-C payload. This provided the derivation of the complete scattering matrix of a scene on a pixel by pixel basis.
The SIR-C/X-SAR Science Team had selected nineteen “supersites” for intensive coverage during the mission. In addition, fifteen backup supersites had been selected for added redundancy should operating parameters change during the mission. This arrangement permitted interdisciplinary studies for each supersite. In all, the two SIR-C/X-SAR missions observed more than 400 sites.
Both payloads, SIR-C and X-SAR, could be operated as either stand-alone radars or together. Roll and yaw maneuvers of the Shuttle permitted to acquire data from either side of the Shuttle nadir track.
During each SLR mission, a SIR-C/X-SAR POCC (Payload Operations Control Center) was operated at NASA/JSC (Houston, TX). POCC personnel were responsible for operating the radar antenna and ensuring that radar data were recorded onboard the Shuttle. The POCC received also the mission science data that were downlinked via TDRS for processing and analysis.
During both missions, the SIR-C/X-SAT system operation exceeded all its performance requirements (in spite of some anomalies in C-band panel performance). The SIR-C/X-SAR science team, consisting of 52 investigator teams from more than a dozen countries, were using the SIR-C/X-SAR data in studies of ecology, hydrology, geology, and oceanography. Interferometric data were used for topographic mapping and surface change monitoring. In addition, observations of rainstorms demonstrated for the first time the capability of a multifrequency, multipolarization spaceborne radar system to quantify precipitation rates and to classify rain type. 14) 15) 16)
Parameter | SEASAT (1978) | SIR-A (1981) | SIR-B (1984) | SIR-C/X-SAR (1994) |
Frequency (GHz) | 1.275 | 1.275 | 1.275 | 1.25, 5.3, 9.6 |
Polarization | HH | HH | HH | HH, HV, VH, VV |
Look angle | 20º (fixed) | 50º (fixed) | 20-55º (variable) | 20-55º(variable) |
Antenna beam pointing capability | Fixed antenna beam | Fixed antenna beam | First mechanical beam steering system | First electronic beam steering system |
Transmitter/receiver approach | Central transmitter/receiver | Central transmitter/receiver | Central transmitter/receiver | Distributed T/R modules |
Source data | Analog recording | Analog recording | Digital recording | Digital recording |
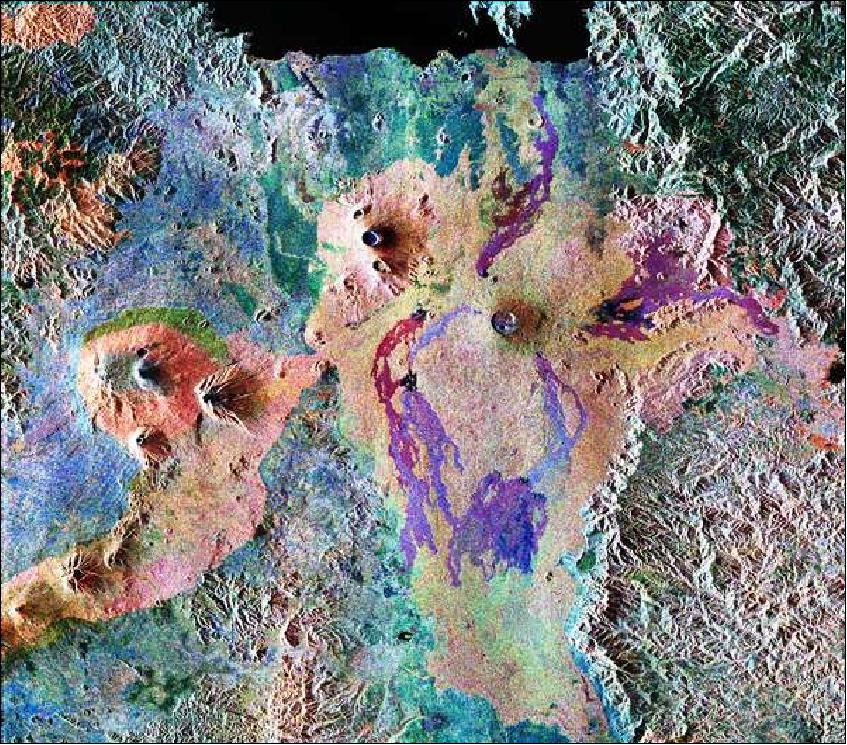
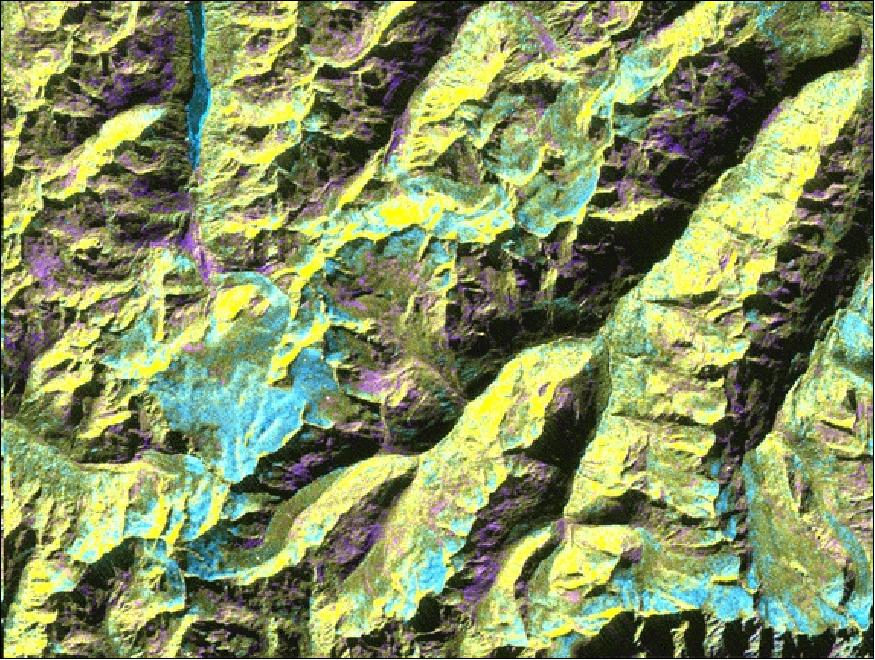
Figure 7 shows the Virunga volcano chain along the borders of Rwanda, Zaire and Uganda. In this image red is the L-band (horizontally transmitted, vertically received) polarization; green is the C-band (horizontally transmitted and received) polarization; and blue is the C-band (horizontally transmitted and received) polarization. The area is centered at about 2.4º south latitude and 30.8º east longitude. The image covers an area 56 km x 70 km. 17) 18)
The dark area at the top of the image is Lake Kivu, which forms the border between Zaire (to the right) and Rwanda (to the left). In the center of the image is the steep cone of Nyiragongo volcano, rising 3,465 m high, with its central crater now occupied by a lava lake. To the left are three volcanoes, Mount Karisimbi, rising 4,500 m high; Mount Sabinyo, rising 3,600 m high; and Mount Muhavura, rising 4,100 m high. To their right is Nyamuragira volcano, which is 3,053 m tall, with radiating lava flows dating from the 1950s to the late 1980s. These active volcanoes constitute a hazard to the towns of Goma, Zaire and the nearby Rwandan refugee camps, located on the shore of Lake Kivu at the top left.
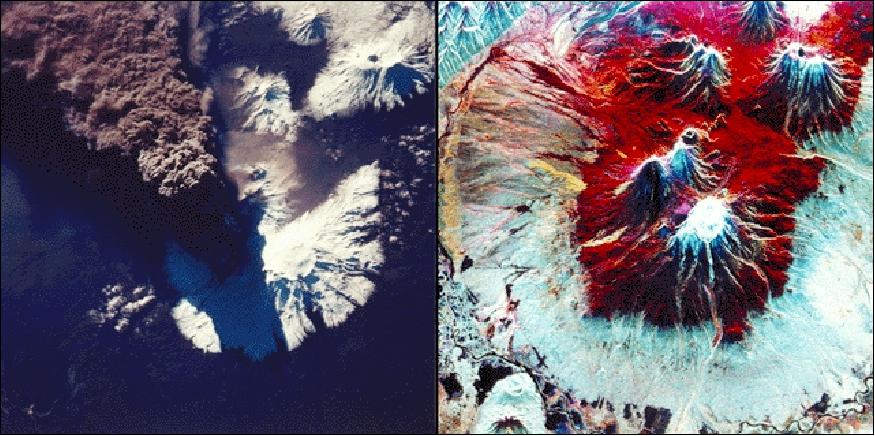
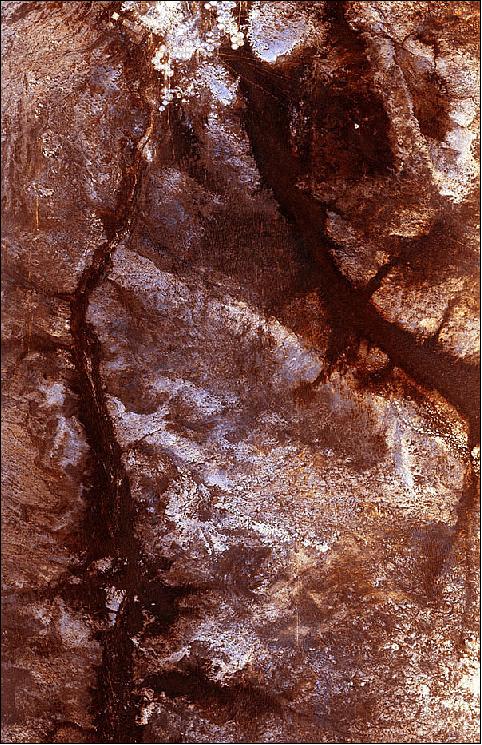
Figure 8 shows two pictures of the Kliuchevshoi volcano on Kamchatka island, Russia, using optical and SAR imaging technologies. The optical photo at left was taken by Shuttle astronauts on the STS-68 mission during the early hours of the eruption on September 30, 1994. The radar image at right was acquired by SIR-C/X-SAR aboard the space shuttle Endeavour on its 88th orbit on October 5, 1994. The radar image shows an area of about 75 km x 100 km centered at 58.16º N latitude and 160.78º E longitude.
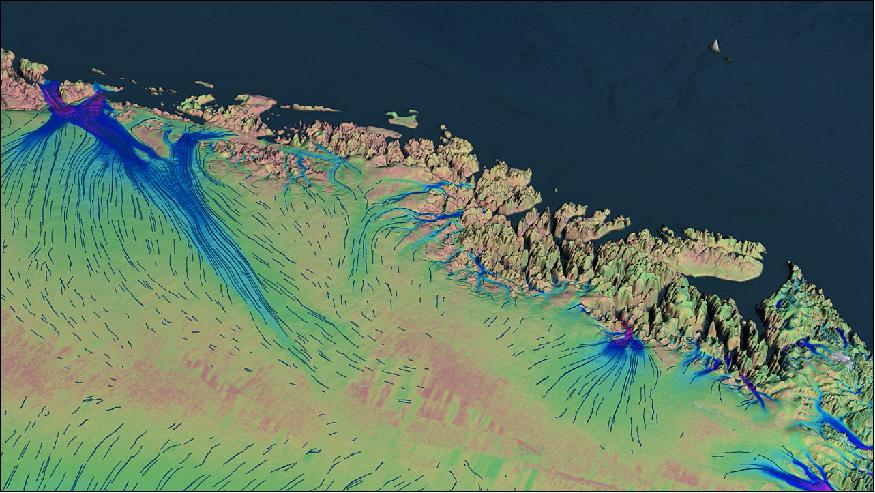
The image of Figure 9 is centered at 46.82º north latitude and 10.79º east longitude. This image is located in the Central Alps at the border between Switzerland, Italy and Austria, about 50 km southwest of Innsbruck. It was acquired on April 14, 1994 and on October 5, 1994. It was produced by combining data from these two different data sets. Data obtained in April is green; data obtained in October appears in red and blue, and was used as an enhancement based on the ratio of the two data sets. Areas with a decrease in backscatter from April to October appear in light blue (cyan), such as the large Gepatschferner glacier seen at the left of the image center, and most of the other glaciers in this view. A light blue hue is also visible at the east border of the dark blue Lake Reschensee at the upper left side. This shows a significant rise in the water level. Magenta represents areas with an increase of backscatter from April 10 to October 5. Yellow indicates areas with high radar signal response during both passes, such as the mountain slopes facing the radar.
MAPS (Measurement of Air Pollution from Satellites) of NASA/LaRC, see description under the sensor complement of mission SIR-A.
Some underflight campaigns of SLR-1/-2 missions
A total of 19 supersites were selected (Table 4) for specific interdisciplinary research projects. All of these supersite investigations were (at the minimum) accompanied by field measurements in parallel to the Shuttle observations. In addition several `underflight campaigns' were conducted (in parallel with the SIR-C/X-SAR overflights) at various supersites and with spaceborne, airborne, and ground-based instruments by a worldwide research community. Some campaign activity is reported here: 19)
• Gulfstream supersite. A major multi-organizational series of experiments was conducted off the US East Coast (located within: 42º N, 75º W; 36º N, 65º W; 30º N, 73º W) with the objective to investigate oceanographic phenomena (emphasis on current-wave and air-sea interactions) in the Gulf Stream. Participant organizations: JPL, U. of Hamburg, NOAA, NAWC, NRL, U. of Miami, Navy ONR, USGS, NASA, etc. Extensive ground/sea/air truthing data were collected and eventually compared with the SRL data. NRL-P-3 aircraft with RAR, P-3/SAR (ERIM/NAWC), ROWS; DC-8 with AIRSAR/TOPSAR, ERS-1 SAR imagery, AVHRR, NOAA/NDBC offshore buoys, RV Cape Hatteras, and stations. Specific objectives were: 1) to understand the dependence of SAR signatures of the supersite boundary on radar and environmental parameters; 2) to investigate the relationship between subsurface thermohaline circulation and near-surface atmospheric structure on the wave field responsible for the radar imagery signatures; 3) to optimize SAR sensor performance (polarimetric and interferometric radar collection modes) for detecting currents; 4) to understand imagery of the perturbation of Kelvin wakes by current and thermal fronts; and 5) to investigate the role of the hydrodynamic structure in the origin of “slick-like” features observed in near coastal regions by SAR imagery. 20)
• The NASA/JPL AIRSAR/TOPSAR system (DC-8) was used in extensive underflight campaigns during both SRL missions. Observation sites during SRL-1 were: Stovepipe Wells (Death Valley), CA; Mammoth, CA; Chickasha, OK; Gulf of Mexico; Gulf stream; Duke Forest, NC; Mahantango, PA; Howland, ME; Raco, MI; Altona (Manitoba), Canada; Prince Albert, Canada; Bighorn Basin, WY. - Observation sites during SRL-2: Chickasha, OK; Gulf of Mexico; Duck Pier, NC; Duke Forest, NC; Howland, ME; Mahantango, PA; Raco, MI; Altona, Canada; Prince Albert, Canada; Yellowstone, MT; Bighorn Basin, WY; Davis, CA. 21) 22)
• Beijing test site (G85). During SRL-1 a concurrent airborne underflight campaign was conducted by the Chinese Academy of Sciences (CAS) with its CASSAR instrument, operated by IRSA-CAS (Institute of Remote Sensing Applications of CAS). Objective: comparison with SRL-1 imagery. 23)
• Supersite Raco (Michigan, at 46.5º N and 84º 30' W).24) The University of Michigan was involved in the development of calibration procedures and precision calibration devices to quantify the complex radar images with an accuracy of 0.5 dB in magnitude and 5º in phase. A calibration campaign took place at Raco during the SRL-1, and -2 Shuttle overflights utilizing the following equipment: an array of point calibration targets including trihedral corner reflectors and PARCs (Polarimetric Active Radar Calibrators); distributed uniform target (for characterizing radiometric calibration) consisting of a field of grass, sometimes covered with snow; parallel measurements with ground-based polarimetric scatterometers.
• Supersite Oberpfaffenhofen. The DLR E-SAR instrument was flown on a DO-228 during each of the SRL-1 and -2 Shuttle missions (five times for each SRL flight) addressing such topics as calibration, agriculture, forestry and hydrology. Researchers from seven German institutes collected in parallel ground truth data during the two missions. In between the two SRL missions E-SAR participated in the EMAC (see EMAC) campaign, establishing a multitemporal and multifrequency SAR-dataset from the beginning of April to the end of October 1994 for the Oberpfaffenhofen supersite. 25)
• Supersite Altona, Manitoba, Canada (CRSS site at 49º 4.9' N, 97º 39.6' W). Underflights were conducted with C/X-SAR in a Convair-580 aircraft (CRSS) and AIRSAR/TOPSAR on a DC-8. In addition acquisition of SIR-C/X-SAR data. Collection of ground truth data. The objectives were to evaluate the multitemporal and multifrequency SAR data and to estimate soil moisture for a variety of soil types. 26) 27)
Disciplines supported | Supersites | Backup Supersites |
Calibration | Flevoland (Netherlands), | Matera (Italy), |
Ecology | Manaus (Brazil), | Amazon Survey (Brazil), |
Electromagnetic Theory | Safsaf (Sudan) |
|
Geology | Galapagos Islands, | Kilauea volcano (Hawaii), |
Hydrology | Chickasha (Oklahoma, The Little Washita River Watershed), | Mahantango (Pennsilvania), |
Oceanography | US East Coast, | Equatorial Pacific, |
A retrospective after 25 years of the last SIR-C/X-SAR flight
October 11, 2019, marks the 25th anniversary of the end of a space mission that transformed the way we use radar to observe large-scale environmental processes on our home planet. The Spaceborne Imaging Radar-C and X-Band Synthetic Aperture Radar (SIR-C/X-SAR) mission made available to people worldwide the scientific data used to this day to inform decisions to slow and mitigate climate change. 28) 29)
The SIR-C instrument, built by NASA'S Jet Propulsion Laboratory in Pasadena, California, and the X-SAR instrument, built by the German Aerospace Center (DLR), constituted the most advanced imaging radar system ever used in air or space. During hundreds of orbits on two flights aboard the Space Shuttle Endeavour, in April and October 1994, the radar system made multiple passes over 19 "supersites" - areas of scientific interest in such locations as the Sahara, Brazil, the Alps and the Gulf Stream. It also imaged events occurring during the flights, such as as a volcano erupting in Russia.
"The many innovations of SIR-C/X-SAR have been used in virtually every air- and spaceborne radar mission since, starting with NASA's Shuttle Radar Topography Mission, which mapped 80% of the Earth in 2000," said Tony Freeman, now manager of JPL's Innovation Foundry, who led end-to-end calibration of SIR-C. "DLR's TerraSAR-X and TanDEM-X missions have since filled remaining gaps."
Radar imaging of Earth has never been the same since SIR-C/X-SAR's demonstration of what's known as simultaneous multifrequency, fully polarized, repeat-pass interferometric SAR. To unpack that sizable trunk of terminology, let's start with "synthetic aperture radar": Since the late 1970s, NASA has been imaging Earth with radar - in darkness, under cloud cover or vegetation, even underground - using the movements of a host airplane or spacecraft to "synthesize" an "aperture" much larger than the antenna itself. The larger the aperture, the greater the image resolution. Indeed, SIR-C's predecessors, SIR-A and SIR-B, were synthetic aperture radar missions.
However, unlike SIR-C/X-SAR, neither predecessor made radar observations simultaneously in three frequencies - C-, L- and X-band - using three adjacent antennas combined into a massive, 12-by-4-meter, 11.5-ton structure. That advance, analogous to the leap from black-and-white to color film, allowed the mission to collect data in different scales, providing a crisp snapshot of each targeted feature, unmuddied by possible changes over time.
Blazing a Trail
In addition to multiple frequencies, some observations were made in multiple "polarizations." Radio frequency waves can be either horizontal (in a wavy plane parallel to the ground) or vertical (in a plane perpendicular to the ground). The C- and L-band antennas could send and receive waves of both horizontal and vertical polarization. Using this "fully polarized" data, scientists can separate out the scattering of radar waves to distinguish, for example, vegetated from unvegetated terrain.
SIR-C/X-SAR wanted to capture changes over time; that's why it flew on shuttle flights six months apart. To observe the same supersites during both flights and to make consistent daily passes over them, the shuttle crew used sophisticated algorithms to navigate the spacecraft in precise orbits as close as 10 meters apart. And they did this flying upside down, since the cargo bay holding the instruments was on top of the shuttle. While the X-band antenna had a hinge, the C- and L-band antennas were fixed at a particular angle, but they had "electronic steering" that allowed them to "see" to either side of what was right in front of them.
Those repeated, slightly offset passes over the same terrain were essential for the data-processing technique of interferometry. Combining views, interferometry creates detailed, 3D topographical images of a target at the moment of simultaneous observations. And it can reveal even minute changes in the target between successive observations - like the gradual creep of an earthquake fault or the movement of an ice sheet.
The SIR-C/X-SAR dataset proved immediately useful, revealing, for instance, ancient riverbeds beneath the Sahara - an artifact of pre-industrial climate change - and remains in high demand.
"SIR-C/X-SAR was the path opener for multiple U.S. and international missions that followed," said Charles Elachi, the mission's principal investigator before he became director of JPL. "Imaging of subsurface river channels in the Eastern Sahara enabled new understanding of the environmental history of that and other arid regions. Using multiple frequencies enabled for the first time 'color' radar images that have been used extensively to map vegetation and forests and extract their vegetation content. Using repeat-pass interferometry enabled us for the first time to map surface motion at the centimeter level. This technique is now commonly used to map motions resulting from earthquakes, volcanic eruptions and other natural disasters."
Freeman agrees: "SIR-C/X-SAR was innovative on so many fronts: We knew what we were working on was something special, but we didn't know at the time how many firsts the mission would rack up".
The NASA Image and Video Library makes mission data available to researchers worldwide. The University of Michigan hosts a search tool for accessing its own vast SIR-C/X-SAR database. And in its MapReady tool the University of Alaska Satellite Facility has processed the data for compatibility with multiple computer platforms.
Missions using technologies pioneered by SIR-C/X-SAR have revealed changes in Earth's natural features over increasingly meaningful periods, informing long-term policy to prevent and mitigate climate change. At the same time, they reveal the immediate effects of natural disasters rapidly enough to advise first responders.
SIR-C/X-SAR was a collaboration of NASA, DLR and the Italian Space Agency (ASI), which contributed to the ground segment for X-SAR observations. JPL managed the mission for NASA. DLR was responsible for calibration, operations and data processing for X-SAR.
This 'multi-frequency' Synthetic Aperture Radar (SAR) proved its performance during two 10-day spaceflights. The radar data acquired during these missions became the basis for more than 5000 scientific publications in the years that followed.
References
1) J. Way, D. Evans, C. Elachi, “The SIR-C/X-SAR mission,” Proceedings of IGARSS'93 (International Geoscience and Remote Sensing Symposium), Tokyo, Japan, Aug. 18-21, 1993, Vol. 2
2) “X-band Synthetic Aperture Radar (X-SAR) and its Shuttle-Borne Application for Experiments,” paper by Herwig Öttl and Francesco Valdoni
3) R.L. Jordan, B. L. Huneycutt, M. Werner, “The SIR-C/X-SAR Synthetic Aperture Radar System,” Proceedings of the IEEE, Vol. 33, No. 4, July 1995, pp. 829-839
4) Special Issue on SIR-C/X-SAR, IEEE Transactions on Geoscience and Remote Sensing, Vol. 33, No. 4, July 1995
5) R.L. Jordan, B. L. Huneycutt, M. Werner, “The SIR-C/X-SAR Synthetic Aperture Radar System,” Proceedings of the IEEE, Vol. 79, No. 6, June 1991, pp. 827-838
6) E. R. Stofan, D. L. Evans, C. Schmullius, B. Holt, J. J. Plaut, J. von Zyl, S. D. Wall, J. Way, “Overview of Results of Spaceborne Imaging Radar-C, X-Band Synthetic Aperture Radar (SIR-C/X-SAR),” IEEE Transactions on Geoscience and Remote Sensing, Vol. 33, No. 4, July 1995, pp. 817-828, URL: ftp://iacftp.ethz.ch/pub_read/nnadine/Stofan_1995_IEEE_GR.pdf
7) R. L. Jordan, B. L. Huneycutt, M. Werner, “The SIR-C/X-SAR Synthetic Aperture Radar System,” Proceedings of the IEEE, Vol. 79, No 6, June 1991, pp. 827-838
8) M. Zink, R. Bamler, “X-SAR Radiometric Calibration and Data Quality,” IEEE Transactions on Geoscience and Remote Sensing, Vol. 33, No. 4, July 1995, pp. 840-847
9) D. L. Evans, J. J. Plaut, E. R. Stofan, “Overview of the Spaceborne Imaging Radar-C/X-Band Synthetic-Aperture Radar (SIR-C/X-SAR) Missions, Remote Sensing of Environment, Vol. 59, No 2, 1997, pp. 135-140
10) “SIR-C/X-SAR Fact Sheet, Jan. 28, 1994, URL: http://fogarty.org/tim/sir-c_fact_sheet_jan94.html
11) E. T. Engman, “SIR-C/X-SAR;” URL: http://hydrolab.arsusda.gov/washita94/chptr19.pdf
12) H. Öttl, “ The SIR-C/X-SAR missions-overview and some results,” Acta Astronautica, Vol. 41, No 3, Aug. 1997, pp. 155-163
13) F. V. Stuhr, R. L. Jordan, M. U. Werner, “SIR-C/X-SAR A Multifaceted Radar,” IEEE Aerospace and Electronic Systems Magazine, Vol. 10, No. 10, Oct. 1995, pp. 15-25
14) A. Jameson, F. Li, S. Durden, et al., “SIR-C/XSAR Observations of rain storms,” Remote Sensing of Environment, Vol. 59, No 2, 1996, pp. 267-279
15) M. Coltelli, G. Fornaro, G. Franceschetti, R. Lanari, M. Migliaccio, J. R. Moreira, K. P. Papathanassiou, G. Puglisi, D. Riccio, M. Schwäbisch, “SIR C/X SAR multifrequency multipass interferometry: A new tool for geological interpretation,” Journal of Geophysical Research, Vol. 101, Issue E10, 1996, pp. 23127-23148
16) W. Alpers, C. Melsheimer, “Chapter 17: Rainfall,” URL: http://sarusersmanual.com/ManualPDF/NOAASARManual_CH17_pg355-372.pdf
17) http://www.jpl.nasa.gov/radar/sircxsar/
18) M. Keil, E. Akgoz, S. Carl, B. Forster, T. Hausler, A. Johlige, M. Lautner, K. Martin, “Use of SIR-C/X-SAR and Landsat TM data for vegetation mapping inthe Bavarian Forest national park and in the Ore Mountains,” Proceedings of IGARSS'99, Vol. 1, 1999, Hamburg, Germany, June 28-July 2, 1999, pp. 293-295
19) Special Issue on SIR-C/X-SAR, IEEE Transactions on Geoscience and Remote Sensing, Vol. 33, No. 4, July 1995, pp. 817-950
20) S. A. Mango, et al., “Remote Sensing of Current-Wave Interactions with SIR-C/X-SAR during SRL-1 and SRL-2 at the Gulfstream Supersite,” Proceedings of IGARSS'95, Volume II, pp. 1325-1327
21) Information provided by J. Plaut, JPL, Pasadena, CA
22) K. J. Ranson,S. Guoqing, “ An Evaluation of AIRSAR and SIR-C/X-SAR Images for Mapping Northern Forest Attributes in Maine, USA,” Remote Sensing of Environment, Vol. 59, No 2, February 1997 , pp. 203-222
23) W. Chao, G. Huadong, L. Lin, “SRL-1 CASSAR Ground Campaign and its Results,” Proceedings IGARSS '95, Vol. II, pp. 970-972
24) K. Sarabandi, et al., “Polarimetric Calibration of SIR-C using Point and Distributed Targets,” IGARSS '95, Vol. I, pp. 593-595
25) Information provided by J. Nithack and by Ch. Schmullius of DLR, Oberpfaffenhofen
26) T. J. Pultz, et al., “SIR-C/X-SAR Observations of Soil Moisture over the CCRS Altona, Manitoba Test Site,” IGARSS '95, Vol. II, pp. 990-993
27) “SIR-C/X-SAR Mission Overview,” JPL Publication 93-29, Dec. 15, 1993
28) Matthew Segal, Claire Marie-Peterson, ”Celebrating a Mission That Changed How We Use Radar,” NASA/JPL News, 11 October 2019, URL: https://www.jpl.nasa.gov/news/news.php?feature=7517&utm_source=iContact&
utm_medium=email&utm_campaign=nasajpl&utm_content=weekly20191010-4
29) Philipp Burtscheidt, Manfred Zink, Rolf Werninghaus, ”25th Anniversary of the Space Shuttle Missions SIR-C/X-SAR,” DLR, 7 October 2019, URL: https://www.dlr.de/content/en/articles/news/2019/04
/20191008_25th-anniversary-of-sir-c-x-sar-mission.html
The information compiled and edited in this article was provided by Herbert J. Kramer from his documentation of: ”Observation of the Earth and Its Environment: Survey of Missions and Sensors” (Springer Verlag) as well as many other sources after the publication of the 4th edition in 2002. - Comments and corrections to this article are always welcome for further updates (eoportal@symbios.space).
SLR Sensor Complement Sample SAR Data Collection Underflight Campaigns of SLR-1/-2 Missions
A Retrospective References Back to top