SIR-A (Shuttle Imaging Radar)
Earth Observation
SIR-A (Shuttle Imaging Radar) / OSTA-1 Payload on STS-2 Mission
The early Shuttle flights (in fact the first four missions) were regarded as demonstration flights. This statement pertained not only to the Shuttle as a new manned and reusable transport vehicle, but also to its payloads in all fields of observations.
In the time frame of the early 1980s and early 1990s, NASA/JPL developed and launched a total of four SAR technology demonstration missions in the aftermath of SEASAT, designated as SIR (Shuttle Imaging Radar) missions. These were: SIR-A (1981), SIR-B (1984), and two SIR-C/X-SAR missions in 1994.
The success of the SEASAT L-band SAR mission (1978) prompted the first flight of a side-looking SAR on the Shuttle. The Shuttle was seen as an opportunity to progressively develop and fly increasingly more complex radar systems for short missions, allowing the hardware to be returned to Earth for reuse on follow-on missions.
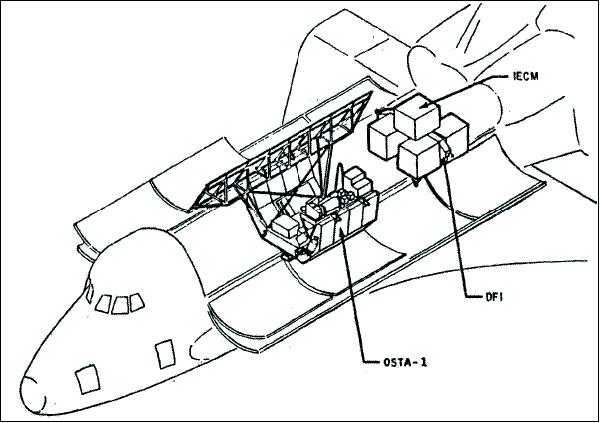
SIR-A (Shuttle Imaging Radar-A), the prime payload of the mission with an L-band SAR (Synthetic Aperture Radar) assembly (of SEASAT spare parts), was developed by NASA/JPL and flown on the 2nd Shuttle mission. However, at the time of flight, the SIR-A designation wasn't used yet, the L-band SAR assembly was simply part of the so-called OSTA-1 (Office of Space and Terrestrial Applications) payload with a total mass of 2460 kg. The objectives of OSTA-1 were to: 1) 2) 3) 4) 5) 6) 7)
• Demonstrate the Shuttle for scientific and applications research in the attached mode
• Operate the OSTA-1 payload to facilitate the acquisition of Earth's resources, environmental, technology, and life science data
• Provide data products to principal investigators within the constraints of the STS-2 mission (to use the SAR data for such applications as land use, geology, hydrology, forestry, and mapping to obtain a better understanding of the radar signatures).
• A secondary goal was to assess the Shuttle performance as a scientific platform for Earth observations.
Other payloads (outside of OSTA-1) on STS-2 were: DFI (Development Flight Instrumentation) with a mass of 4750 kg, ACIP (Aerodynamic Coefficient Identification Package), and IECM (Induced Environment Contamination Monitor). Note: The payloads of DFI ACIP and IECM are not described here. However, some information about these payloads can be found in reference 2).
Background
From 1971 onwards, NASA managed applications missions independently from science missions, first through the Office of Applications and then, from 1977, through the Office of Space and Terrestrial Applications (OSTA). In November 1981, OSTA and the Office of Space Science merged into the Office of Space Science and Applications (OSSA).
OSTA's objective was to “conduct research and development activities that demonstrate and transfer space-related technology, systems and other capabilities which can be effectively used for down-to-earth practical benefits.” It was divided into divisions for materials processing in space, communications and information systems, environmental observation, research observation, and technology transfer.
Launch
Nov. 12, 1981 [duration: 3 days, this was actually the second orbital test flight of the Shuttle Columbia, STS-2 from KSC (Kennedey Space Center); landing at Edwards AFB, CA on Nov. 14, 1981]. Orbiter liftoff mass of 104,647 kg, total payload mass of 8,517 kg.
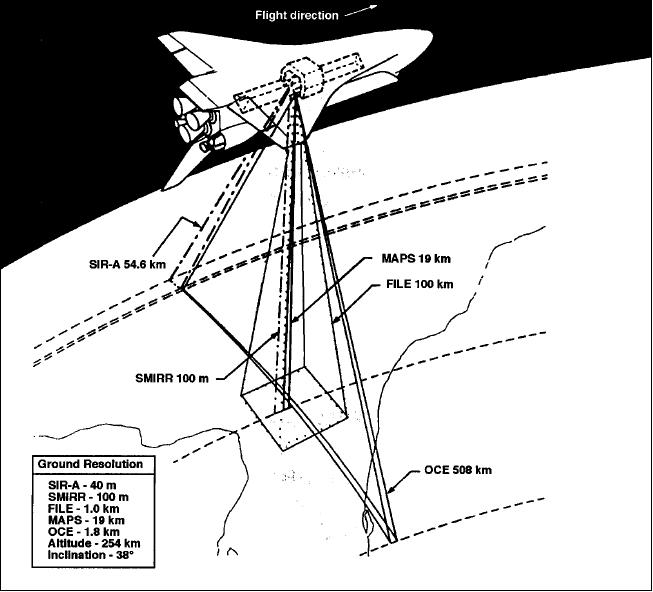
In orbit, the spacecraft assumed an Earth-viewing orientation (Figure 3), thus accommodating the experiments of the OSTA-1 payload in this attitude, called ZLV (Z-axis Local Vertical), the spacecraft's payload bay faces Earth on a line perpendicular to Earth's surface.
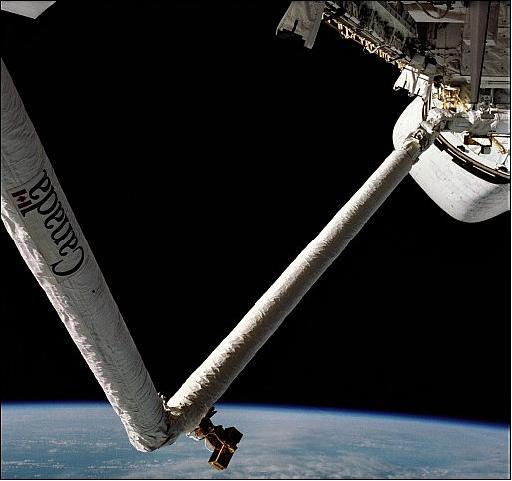
Note: The original planned five-day mission was cut nearly by three days due to a failure of one of three fuel cells that produce electricity and drinking water onboard the Shuttle (fuels cells had been in use since the Gemini 5 flight of early 1965). - However, about 90% of the mission objectives were achieved, including first time remote manipulator system tests. The mission scientists were satisfied with data from the OSTA-1 (Office of Space and Terrestrial Applications-1) Earth observation experiments mounted on Spacelab pallet in payload bay.
Orbit: Shuttle orbit, altitude of 222 km x 231 km, inclination of 38º, period of 89 min, eccentricity of 0.000757 (a total of 37 orbits were flown).
RMS (Remote Manipulator System), also referred to as Canadarm. The Canadian-built RMS arm was successfully demonstrated and operated in all its various operating modes for the first time. The arm, built of a light-weight carbon composite tubing 38 cm in diameter, is 15.3 m long, with a mass of 408 kg.
Sensor Complement
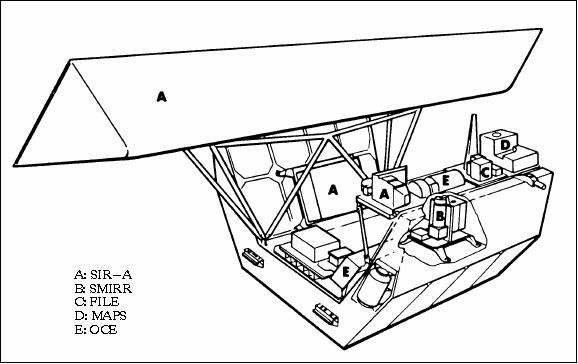
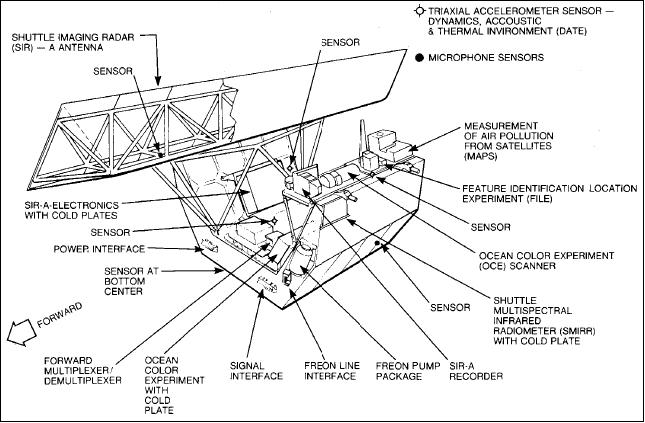
The OSTA-1 payload, sponsored by NASA's Office of Space and Terrestrial Applications (OSTA), represented the first science and applications payload flown on Space Transportation System (STS). Five of the experiments were located on a so-called “Spacelab pallet” in the payload bay, a reusable modular structure (Al frame) of size 4 m x 3 m. The pallet was provided by ESA (European Space Agency) and built by EADS Astrium (former ERNO VFW-Fokker) of Bremen, Germany. The Spacelab Program Office at the NASA/MSFC was responsible for the design, development, and integration of the overall orbital flight test pallet system.
The Spacelab pallet provided a platform for experiment mounting and was also used to cool equipment. It provided electrical power and furnished connections for command and data acquisition from the experiments.
The experiments selected for the OSTA-1 payload concern remote sensing of land resources, environmental quality, ocean conditions, and meteorological phenomena.
SAR (Synthetic Aperture Radar)
The SIR-A payload was a SAR instrument assembly in L-band and HH polarization; fixed antenna look angle of 47º; pixel size = 40 x 40 m; the SAR data was recorded onto an optical medium (film). The PI (Principal Investigator) of SIR-A was Charles Elachi of NASA/JPL.
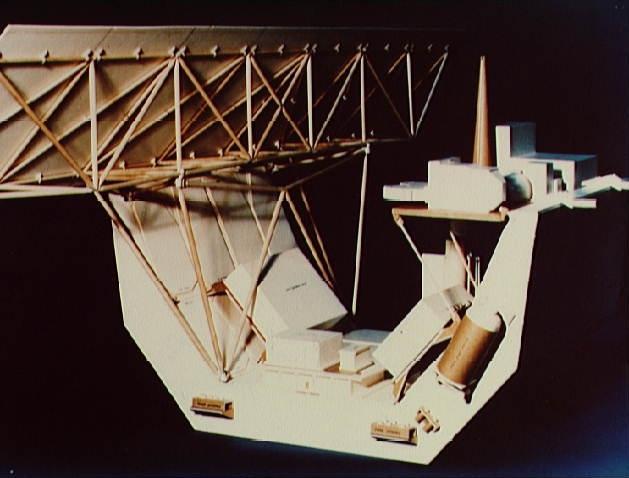
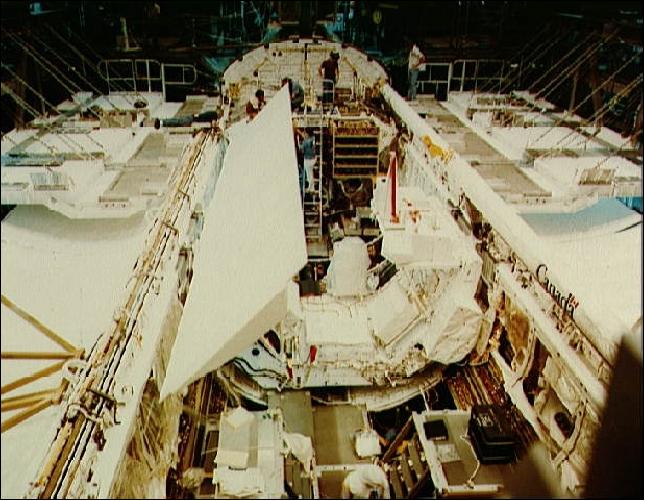
The SIR-A L-band antenna was the most dominant piece of equipment on the pallet with a size of 9.35 m in length, 2.6 m wide, and 15 cm in thickness. Its mass was 181 kg. The seven epoxy-fiberglass honeycomb panels are supported by an aluminum tubular truss hardware mounted to the pallet so that the viewing angle is 47º from nadir.
The system characteristics for SIR-A, were defined primarily by the spare parts available from the Seasat SAR. SIR-A, therefore, had essentially the same design as Seasat: L-band wavelength and HH polarization. The antenna look angle was fixed at 47º in order to optimize geologic mapping in topographically rough terrain. An array-based antenna, namely passive microstrip based arrays - linearly polarized - did fly on Seasat and the Shuttle radar missions SIR-A and SIR-B.
From the Shuttle altitude, the antenna (spare Seasat SAR antenna panels were used) provided a swath of about 50 km. The antenna was mounted in a fixed open position on the starboard side of the payload bay, with the long axis parallel to the velocity vector when the Shuttle was flying nose-forward. This allowed imaging only on the northern side of the Shuttle nadir track. Because simplicity was a requirement for SIR-A, the data were recorded optically in the payload bay and were not accessed until the film was off-loaded after landing. The optical recorder on which the data for SIR-A were recorded was a spare from the Apollo 17 Lunar Sounder Experiment and was 14 years old when flown on SIR-A. 8)
Parameter | Value | Parameter | Value |
SAR center frequency | 1.275 GHz (L-band) | SAR wavelength | 23.5 cm |
System bandwidth | 6 MHz | Surface resolution | 40 m (azimuth) x 40 m (range) |
Swath width | 50 km | SAR antenna size | 9.4 m x 2.16 m |
Antenna look angle | 47º | Incidence angle | 50º ± 3º |
Polarization | HH (horizontal transmit and receive) | Transmitted pulse length | 30.4 µs |
PRF (Pulse Repetition Frequency) | 1464 - 1824 Hz | Transmitted peak power | 1.0 kW |
Onboard data recording: The SIR-A optical recorder was a modified spare from the cloud cover of Venus which provided maplike images of that 9 Apollo 17 mission. It is mounted on the pallet shelf. Its size was 60 cm x 60 cm x 50 cm with a mass of 68 kg. Its provided a film capacity of 8 hours (1,097 m in length)).
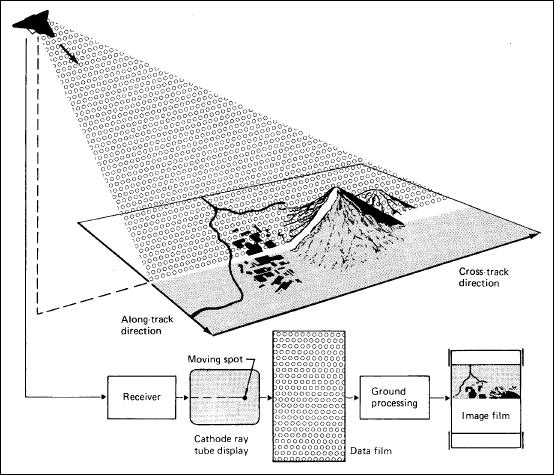
The intensity of the echoes from the target surface controlled the brightness of a spot tracing a line across a CRT (Cathode Ray Tube). An overlapping succession of these lines was recorded on the strip of photographic film moving past the CRT. The film moved past the CRT at a rate proportional to the speed of the orbiter. Thus the terrain echo was recorded on the film with the cross-track dimension across the width of the film and the along-track dimension along the length of the film.
SIR-A data: Image size: 50 km x length of active orbit. Optical image correlation, transparencies and photos available. Transmission: no transmission, optical recording on-board.
The SIR-A mission provided much improved SAR imagery (about 8 hours of SAR observations were recorded) for geologic analyses, since they were relatively free of the layover distortion that accompanied Seasat images of high-relief regions. SIR-A SAR data also led to the discovery of buried and previously uncharted dry river beds beneath the Sahara Desert in Sudan and Egypt. This demonstrated the ability of a L-band radar to penetrate up to several meters in hyper-arid sand sheets.
The SIR-A L-band SAR imagery collected during the mission covered a total area of 107 km2, about 6 x 10⁶ km2 of which were over land. One of the most exciting aspects of the experiment was the demonstration of the radar's ability to penetrate extremely dry surfaces which resulted in the discovery of ancient river channels buried beneath the Sahara desert.
SIR-A electronics: The SIR-A electronics were coupled to cold plates and mounted on the pallet. The electronics module had a size of 1.5 m x 1 m x 25 cm and a mass of 136 kg. The electronics module consisted of a transmitter, receiver, calibrator, and control computer.
• The transmitter generated the frequency-modulated radio frequency (RF) pulse. The PRF (Pulse Repetition Frequency) could be changed to accommodate the varying range and thus prevent the instrument from transmitting while signals were being received.
• The receiver contained a variable gain amplifier to control the instrument's sensitivity in the return signal and a video amplifier to maintain a relatively constant amplitude in the signal output to the optical recorder.
• The calibrator generated a controlled-amplitude signal which was fed to the receiver and used to measure the intensity of the echo. The control computer controlled all operating modes for the radar. It contained a sequencer.
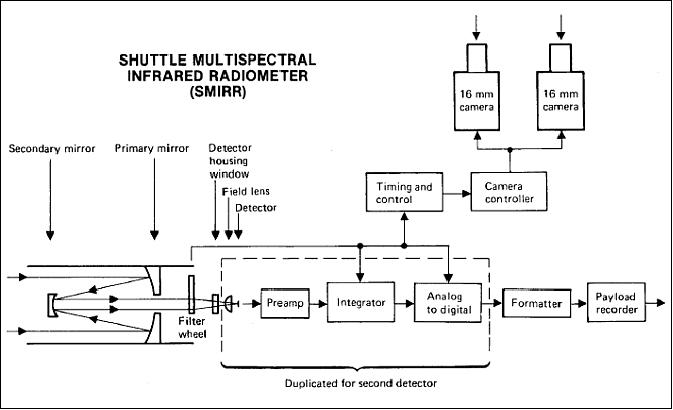
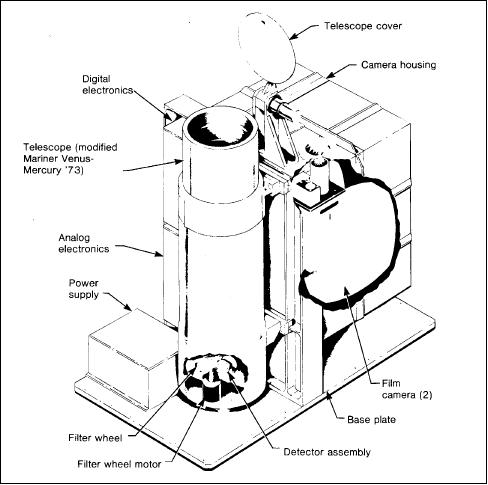
SMIRR (Shuttle Multispectral Infrared Reflectance Radiometer)
SMIRR is a non-imaging NASA/JPL experimental instrument (spectroradiometer). Objectives of SMIRR: 9) 10)
• obtain radiometric measurements from orbit of land surfaces in 10 wavelength channels (rock and mineral identification)
• determine the spectral response of known rock types under different climatic conditions worldwide
• establish the utility of orbital narrow-band radiometry (10 nm) in the 0.5 to 2.4 µm region
• establish the requirements for future narrow-band imaging systems.
The SMIRR instrument consisted of a telescope with an aperture of 17.8 cm diameter (a modified version of the telescope used on the Mariner l0 mission to Venus and Mercury in l973), a filter wheel, two detectors (MCT), two film cameras and supporting electronics. The filter wheel contained 15 evenly spaced positions to sample the spectral bands of interest (only 10 bands were used). Instrument mass of 99 kg, size of 56 cm x 94 cm x 117 cm.
Two 16 mm cameras are aligned with the telescope. Since SMIRR is not an imaging device, photographs are necessary to locate the 100 m resolution radiometer reading within the cameras' instantaneous ground view of 20 km x 25 km in size. One camera is taking black and white pictures; the other color. Both cameras are being triggered during each 1.28 s cycle, half a cycle or 0.64 s apart.
SMIRR was able to identify the mineral kaolite and limestone unambiguously, proving that direct mineral identification from orbit was possible.
OCE (Ocean Color Experiment)
OCE is a NASA/GSFC instrument with Hongsuk H. Kim as PI. The main objective was to detect “ocean color” (algae are considered the basic link in the marine food chain - concentrations of algae are expected to sustain sealife - and the dominant pigment in these algae is chlorophyll α). The goal was to detect the green color reflected by the chlorophyll α with the OCE instrument. The requirements called for OCE observations during the sunlit passes in two test areas, namely the deepwater areas of the Atlantic and the Pacific Ocean: a) the friction area between the Canary Island current and the equatorial counter-current, and b) the upwelling area off the coast of Peru. The argument was that in nutrient-rich water-upwelling zones, there is low sediment suspension and negligible seafloor reflectance. The signal was expected to be rather noisy ( only 10-20 % of the signal was considered to contain the useful information while the rest would be scattered data from air molecules, aerosols and reflections). Hence, much of the effort involved in this experiment required scientific analysis of the data to account for the atmospheric effects. 11) 12) 13)
The OCE instrument on OSTA-1 was a modified version of the airborne OCE device flown on the U-2 aircraft. The experiment consisted of a multispectral imaging scanner of high sensitivity, dedicated to the measurements of water color and its interpretation in terms of major water constituents (chlorophyll, sediments, pollutants, algae, etc.). The instrument employed an 8-channel optomechanical imaging scanner design. Total wavelength range from 464 - 773 nm. FOV = ±45º. IFOV = 3.5 milliradian. The instrument mass was 34 kg.
OCE consisted of two elements: the scanner and the electronics modules. The scanner module was a cylinder of 75 cm in length consisting of a telescope, optics, a scanner with all associated equipment. The rotating mirror featured a FOV of ±45º in the cross-track direction. The telescope imaged a scene through a field stop (1mm x 2 mm) onto a diffraction grating and was detected by 8 silicon photodiode detectors.
Prior to and during the Shuttle mission with the OSTA-1 payload, various OCE-related experiments took place. The main objective of these activities was to perform comparative measurements from aircraft, ship and ground for correlation and verification of the Shuttle OCE test data. A duplicate instrument, referred to as OCS (Ocean Color Scanner) was shipped from GSFC to DLR and installed in aircraft for pre-Shuttle test flights in various regions of Europe.
The following organizations participated in OSTA-1/OCE related activities: GSFC (USA), DLR (Germany), University of Lisbon (Portugal), Hydrologic Institute of the Navy (Portugal), University of Lille (France), GKSS (Germany), INTA Madrid (Spain), IIP Barcelona (Spain).
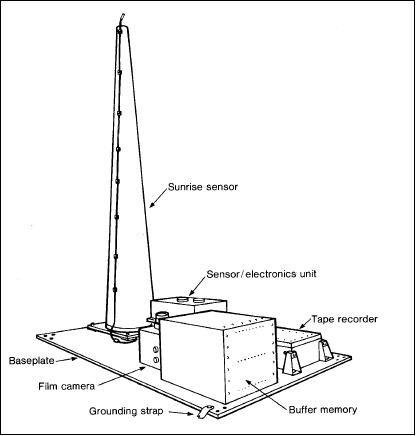
FILE (Feature Identification and Location Experiment)
The FILE instrument was managed by NASA/LaRC. The objective was to develop techniques to make data gathering by Earth resource satellites more efficient. Using the ratio between visual red reflectance and near infrared reflectance, this experiment attempted to characterize scene types as either vegetation, water, snow or clouds, or bare ground. For this purpose the imagery of FILE was compared (a posteriori) with the imagery of other missions such as Landsat and Skylab. 14) 15) 16)
The FILE device consisted of a sunrise sensor, two television cameras, a decision-making electronics unit, a buffer memory, a tape recorder, and a 70 mm camera (Hasselblad). The sunrise sensor activated the experiment whenever the sun was 60º from the Space Shuttle's zenith (30º above the horizon).
One of the two TV cameras was equipped with an optical filter for visual red; the other, with a filter for near infrared. The output of the cameras was sent to the decision-making electronics unit, where the ratio of the TV camera measurements for each pixel was determined. FILE contained also scene class counters to determine when the instrument had recorded an adequate number of scenes of each type - and to suppress further data acquisition from such scenes.
The Hasselblad camera was used to take color imagery for each of the TV camera scenes.
MAPS (Measurement of Air Pollution from Satellites)
The objective of the NASA/LaRC instrument was to measure the amount of carbon monoxide (CO) distribution in the middle and upper troposphere (12-18 km) to evaluate the CO sources and chemistry, and to determine the seasonal variations of this key atmospheric trace gas. 17)
The MAPS instrument was a gas filter correlation radiometer consisting of an electro-optical sensor, an electronics module, a digital tape data recorder, and an aerial camera. MAPS was mounted onto MPESS (Multi-Purpose Experiment Support Structure) in the forward end of the Shuttle cargo bay. The instrument made nadir-viewing measurements from Shuttle orbits. 18)
The electro-optical sensor consisted of two gas cells, one containing 350 hPa of CO and another containing 149 hPa of N2O; their corresponding detectors; a direct radiation detector; an external balance and gain check system, and an internal balance system.
MAPS sensor | Gas filter correlation radiometer |
Spectral band | 2080 to 2220 cm-1 (4.5 - 4.8 µm) |
Resolution | 1.7 x 10⁻⁷ W cm-2 sr-1 noise-equivalent radiance in the radiometer channel |
Swath width | Footprint is 20 km at ground surface (corresponds to spatial resolution) |
Data rate | 43 bit/s (on-board recorded and downlinked during flight) |
MAPS measured the absorption lines of CO and N2O of incoming radiation. The spectrum was split into three beams; one beam passed through a cell containing CO and fell onto a detector - the CO gas cell acted as a filter. A second beam fell directly onto a detector. The observed signal differences were used for CO determination in the altitude range of 0-18 km. The third beam of the incident radiation passed through a cell containing N2O and was measured by another detector. Again, the N2O gas cell acted as a filter for the effects of N2O present in the atmosphere. Since the global distribution of N2O was known, the measured values of N2O were used as an indicator for the presence of clouds in the field of view and to correct the simultaneous CO measurement for systematic errors.
The aerial camera mounted next to the MAPS electro-optical head provided information on cloud cover and terrain over which the sensor data were gathered.
MAPS was first flown on STS-2 (November 12.-14, 1981) as part of the OSTS-1 payload, then on STS-41G (October 5 -13, 1984) as part of the OSTA-3 payload. These flights revealed longitudinal variations in CO distributions and identified biomass burning in the Southern Hemisphere as a major global CO source (equal in magnitude to the amount of CO generated in the Northern Hemisphere by fossil fuel combustion).
MAPS flew subsequently also on STS-59 (April 1994) and STS-68 (October 1994).
References
1) J. W. Moore, “OSTA-1: The Space Shuttle's first scientific payload,” Proceedings of 33rd IAF/IAC Congress, Paris, France, Sept. 27-Oct. 2, 1982, 9 p.
2) “STS-2 Press Information,” October 1981, URL: http://www.jsc.nasa.gov/history/shuttle_pk/mrk/FLIGHT_002_STS-002_MRK.pdf
3) http://southport.jpl.nasa.gov/scienceapps/sira.html
4) “STS-2, Second Space Shuttle Mission,” NASA Press Kit, Sept. 1981, http://www.jsc.nasa.gov/history/shuttle_pk/pk/Flight_002_STS-002_Press_Kit.pdf
5) “20 Years of Shuttle Imaging Radar,” Nov. 12, 2001, URL: http://www.jpl.nasa.gov/news/features.cfm?feature=422
6) Space Applications, Vol. 6, Chapter 2, “NASA Historical Data Book,” URL: http://history.nasa.gov/SP-4012/vol6/vol_vi_ch_2.pdf
7) C. Elachi, W. E. Brown, J. B. Cimino, T. Dixon, D. L. Evans, J. P. Ford, R. S. Saunders, C. Breed, H. Masursky, J. F. McCauley, G. Schaber, L. Dellwig, A. England, H. MacDonald, P. Martin-Kaye, F. Sabins, “Shuttle Imaging Radar Experiment,” Science, 3 December 1982, Vol. 218,No. 4576, pp: 996-1003, DOI: 10.1126/science.218.4576.996
8) J. Way, “Spaceborne Imaging Radar - From Remote Sensing Science to Earth Science Questions,” Launchspace Magazine, Volume 3.04, Aug/Sep 1998
9) R. S. Saunders, G. Schaber, “Shuutle Multispectral Infrared Radiometer (SMIRR),” see reference
10) Manual of Remote Sensing, Second Edition, American Society of Photogrammetry, 1983, pp. 1707-1710
11) H. H. Kim, H. v.d. Piepen, “OSTA-1 j Ocean Color Experiment,,” AIAA 21st Aerospace Sciences Meeting,, Reno, NV, USA, Jan. 10-13, 1983
12) H. v.d. Piepen, V. Amann, H. Helbig, H. H. Kim, W. Hart, et al. “The Promise of Remote Sensing,” IEEE paper presented at IGARSS `82, June 1-4, 1982, Munich, Germany
13) H. H. Kim, R. S. Fraser, L. L. Thompson, Om Bahethi, “A design study for an advanced ocean color scanner system,” Boundary-Layer Meteorology, Volume 18, No 3 , May 1980, pp. 315-327
14) W. E. Silvertson, R. G. Wilson, G. F. Bullock, R. T. Schappell, “Feature Identification and Location Experiment,” Science, Vol. 218, No 4576, Dec. 3, 1982, pp. 1031-1033
15) R. G. Wilson, R. E. Davis, R. E. Wright, W. E. Siovertson, G. F. Bullock, “Radiometric Responsivity Determination for Feature Identification and Location Experiment (FILE) Flown on Space Shuttle Mission 41-G,” NASA Technical Memorandum 89017, Dec. 1986, URL: http://ntrs.nasa.gov/archive/nasa/casi.ntrs.nasa.gov/19870004299_1987004299.pdf
16) H. v.d. Piepen, H. H. Kim, W. D. Hart, V. Amann, H. F. G. Helbig, A. Fiuza,, M. Viollier, R. Doerffer, “The Ocean Color Experiment (OCE) on the Second Orbital Flight Test of the Space Shuttle (OSTA-I),” IEEE Transactions on Geoscience and Remote Sensing, Volume GE-21, Issue 3, July 1983, pp. 350 - 357
17) “Measurement of Air Pollution from Satellites (MAPS) - understanding the chemistry of the atmosphere,” FS-1996-09-19-LaRC, September 19, 1996, URL: http://www.nasa.gov/centers/langley/news/factsheets/MAPS.html
18) Information provided by V. Connors and D. O. Neil of NASA/LaRC
The information compiled and edited in this article was provided by Herbert J. Kramer from his documentation of: ”Observation of the Earth and Its Environment: Survey of Missions and Sensors” (Springer Verlag) as well as many other sources after the publication of the 4th edition in 2002. - Comments and corrections to this article are always welcome for further updates (eoportal@symbios.space).