SDO 2018-2010
SDO mission status and imagery for the period 2018-2010
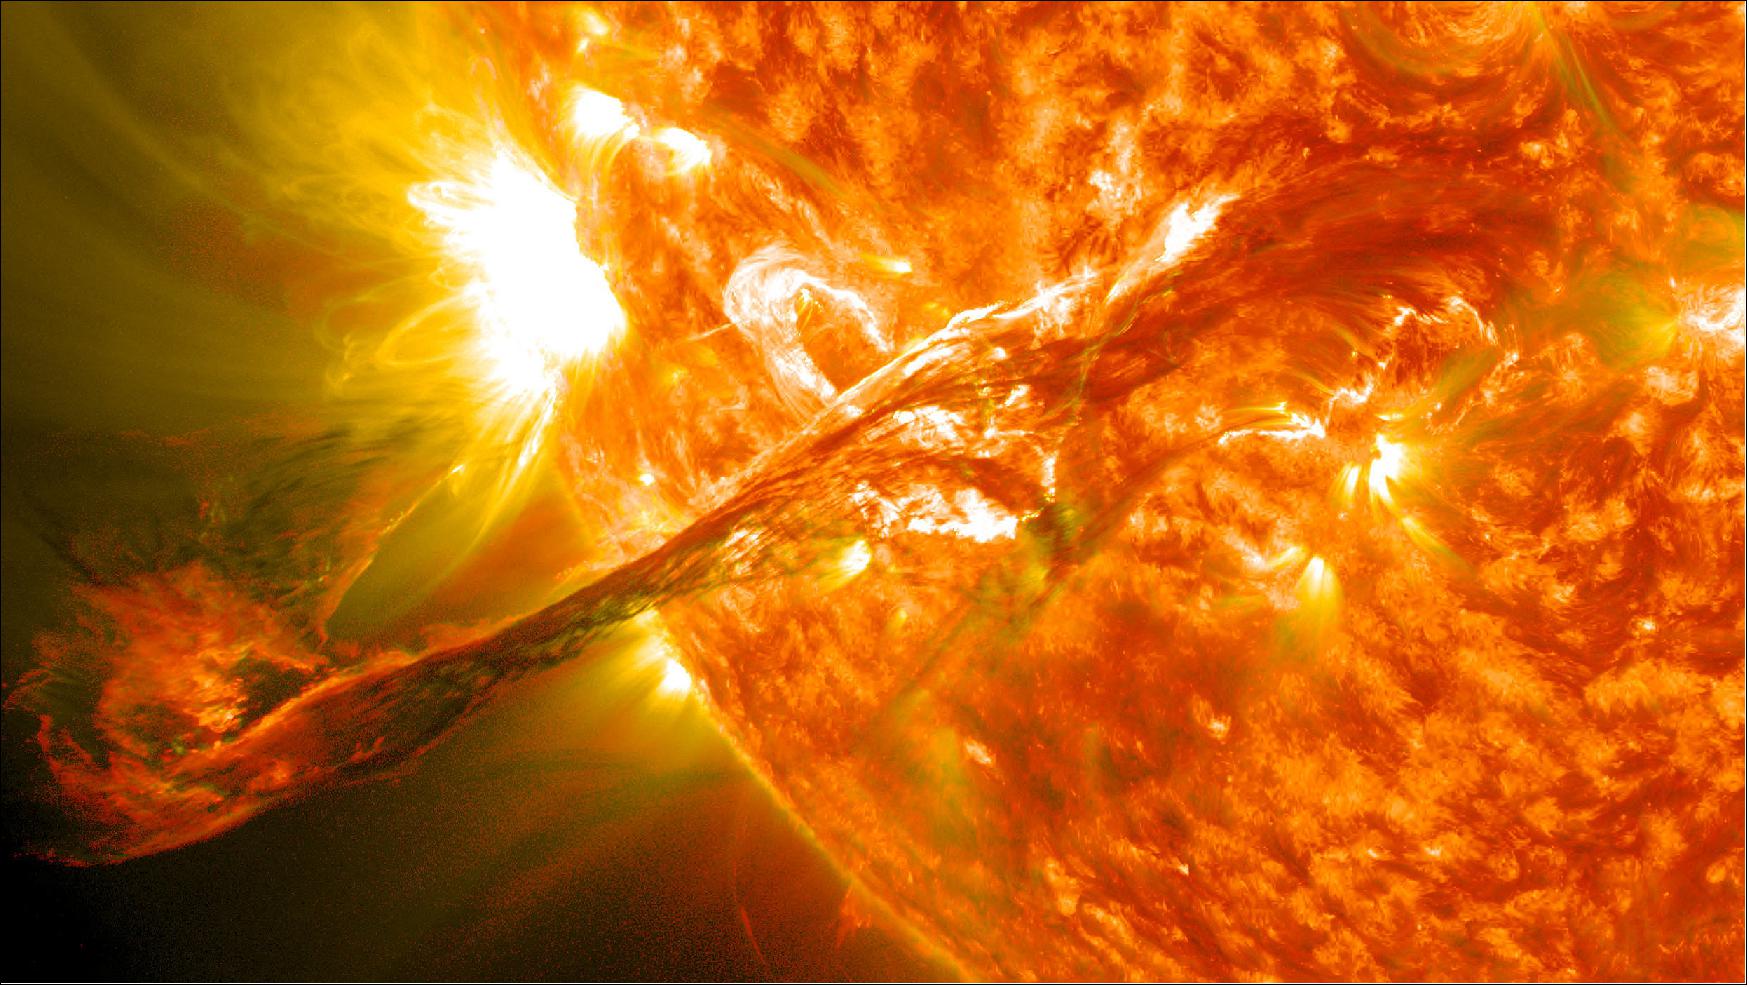
• April 9, 2018: Despite their appearance solar tornadoes are not rotating after all, according to a European team of scientists. A new analysis of these gigantic structures, each one several times the size of the Earth, indicates that they may have been misnamed because scientists have so far only been able to observe them using 2-dimensional images. Dr. Nicolas Labrosse will present the work, carried out by researchers at the University of Glasgow, Paris Observatory, University of Toulouse, and Czech Academy of Sciences, at the European Week of Astronomy and Space Science (EWASS) in Liverpool on Friday 6 April. 1)
- Solar tornadoes were first observed in the early 20th century, and the term was re-popularized a few years ago when scientists looked at movies obtained by the AIA instrument on the NASA SDO (Solar Dynamics Observatory). These show hot plasma in extreme ultraviolet light apparently rotating to form a giant structure taking the shape of a tornado (as we know them on Earth).
- Now, using the Doppler effect to add a third dimension to their data, the scientists have been able to measure the speed of the moving plasma, as well as its direction, temperature and density. Using several years' worth of observations, they were able to build up a more complete picture of the magnetic field structure that supports the plasma, in structures known as prominences.
- Nicolas Labrosse, lead scientist in the study, explains: “We found that despite how prominences and tornadoes appear in images, the magnetic field is not vertical, and the plasma mostly moves horizontally along magnetic field lines. However we see tornado-like shapes in the images because of projection effects, where the line of sight information is compressed onto the plane of the sky.”
- Dr. Arturo López Ariste, another member of the team, adds: “The overall effect is similar to the trail of an airplane in our skies: the airplane travels horizontally at a fixed height, but we see that the trail starts above our heads and ends up on the horizon. This doesn’t mean that it has crashed!”
- Giant solar tornadoes – formally called tornado prominences – have been observed on the Sun for around a hundred years. They are so called because of their striking shape and apparent resemblance to tornadoes on Earth, but that is where the comparison ends.
- Whereas terrestrial tornadoes are formed from intense winds and are very mobile, solar tornadoes are instead magnetized gas. They seem to be rooted somewhere further down the solar surface, and so stay fixed in place.
- “They are associated with the legs of solar prominences – these are beautiful concentrations of cool plasma in the very hot solar corona that can easily be seen as pink structures during total solar eclipses,” adds Lacrosse.
- “Perhaps for once the reality is less complicated than what we see!” comments Dr. Brigitte Schneider, another scientist involved in the work. She continues: “Solar tornadoes sound scary but in fact they normally have no noticeable consequences for us. However, when a tornado prominence erupts, it can cause what’s known as space weather, potentially damaging power, satellite and communication networks on Earth.”
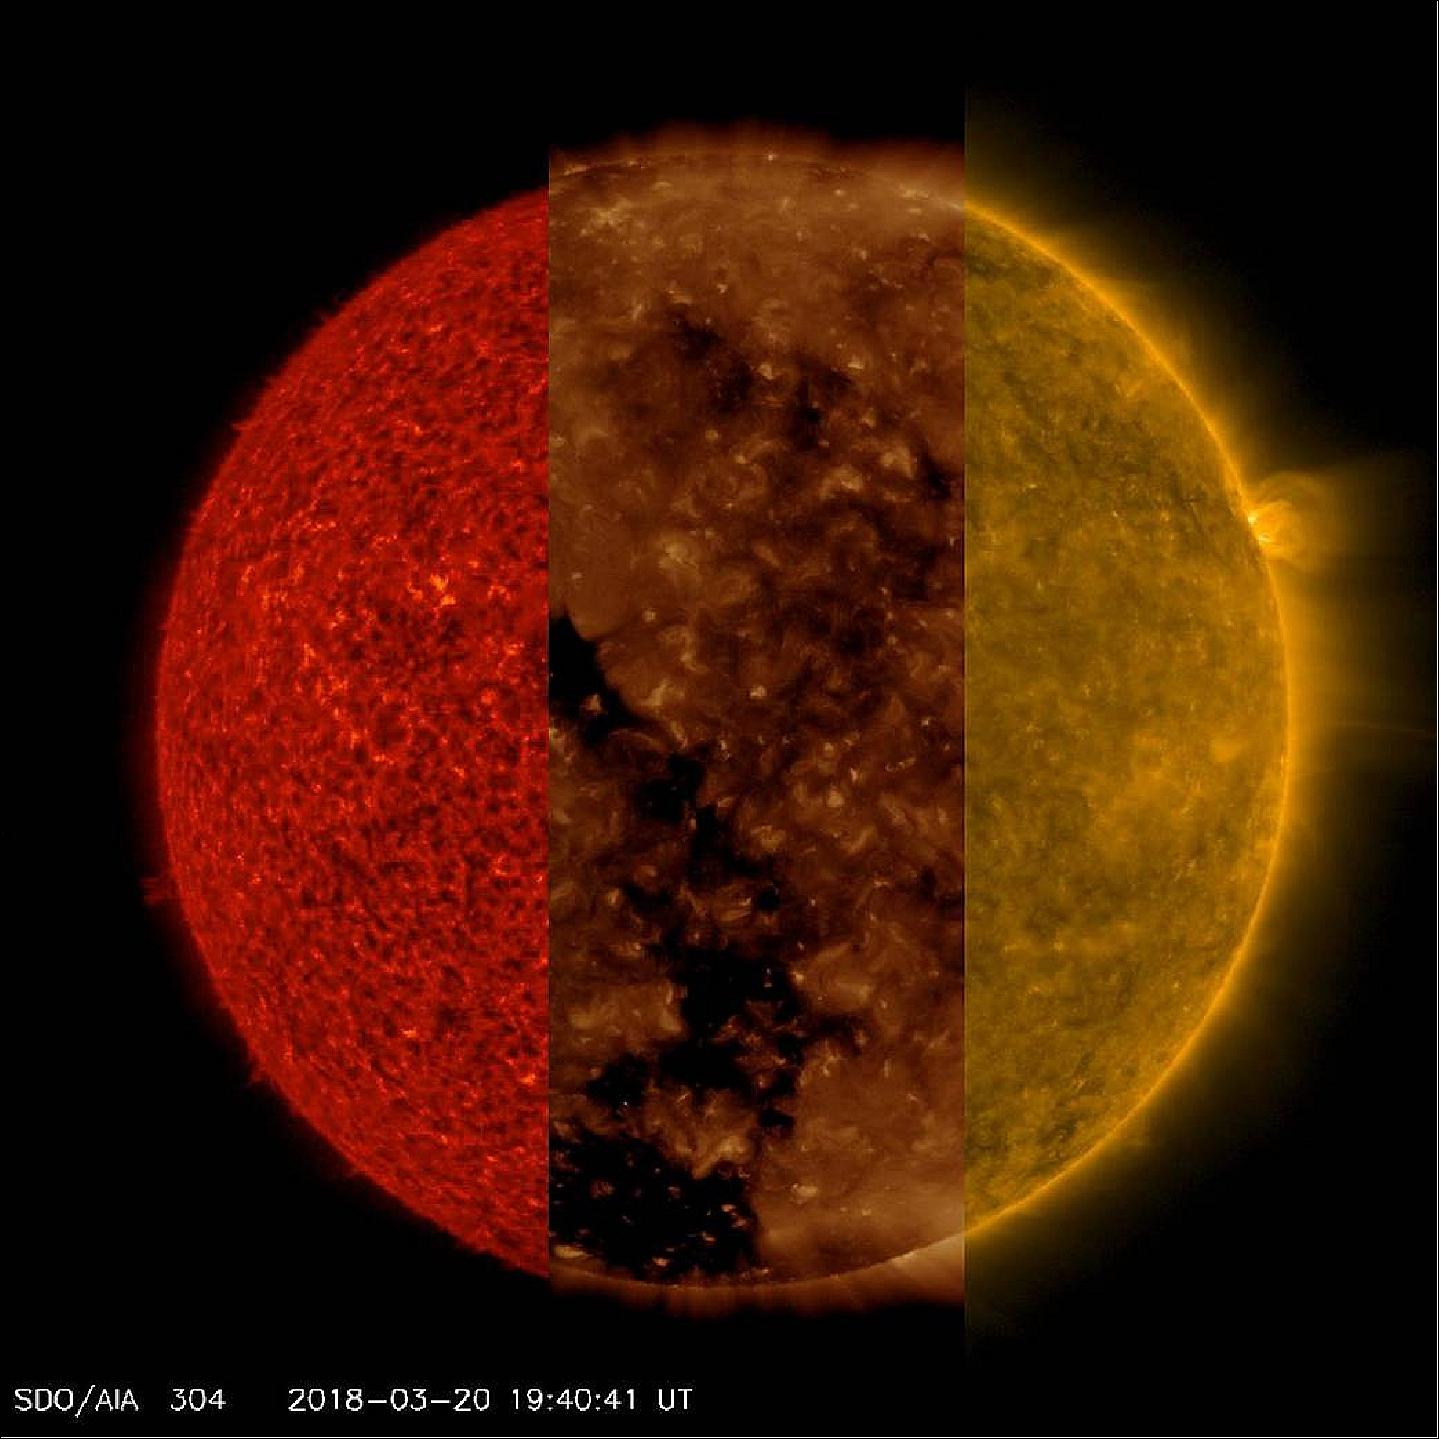
• From March 20-23, 2018, NASA's SDO (Solar Dynamics Observatory) captured three sequences of our Sun in three different extreme ultraviolet wavelengths. The resulting images illustrate how different features that appear in one sequence are difficult, if not impossible, to see in the others. 2)
- In the red sequence (304 Å), we can see very small spicules - jets of solar material - and some small prominences at the Sun's edge, which are not easy to see in the other two sequences. In the second sequence (193 Å), we can readily observe the large and dark coronal hole, though it is difficult to make out in the others. In the third (171 wavelengths), we can see strands of plasma waving above the surface, especially above the one small, but bright, active region near the right edge. These are just three of the ten extreme ultraviolet wavelengths in which SDO images the Sun every 12 seconds, every day.
• March 5, 2018: Magnetohydrodynamic (MHD) Alfvén waves have been a focus of laboratory plasma physics and astrophysics for over half a century. Their unique nature makes them ideal energy transporters, and while the solar atmosphere provides preferential conditions for their existence, direct detection has proved difficult as a result of their evolving and dynamic observational signatures. 3)
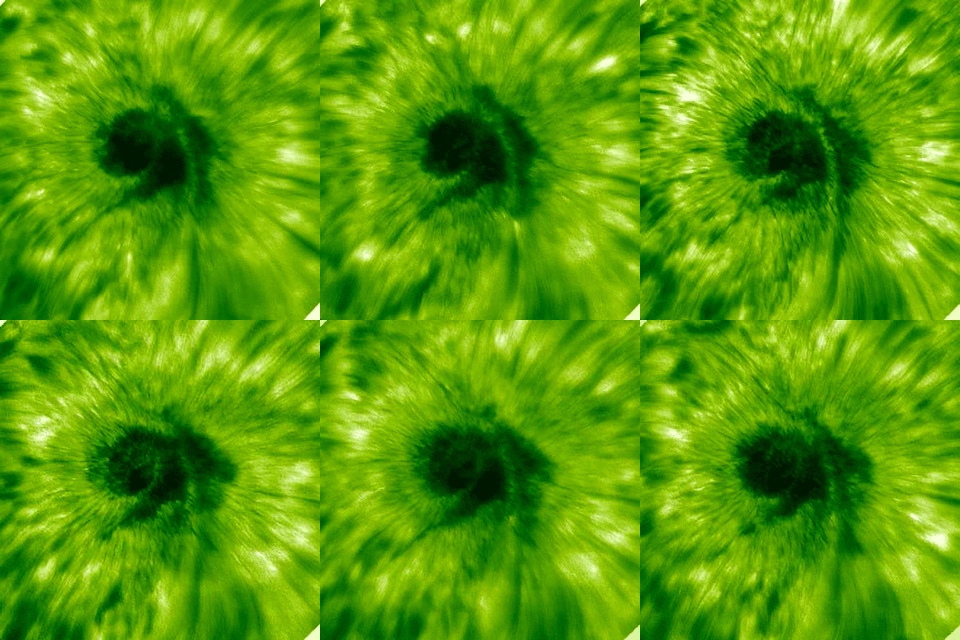
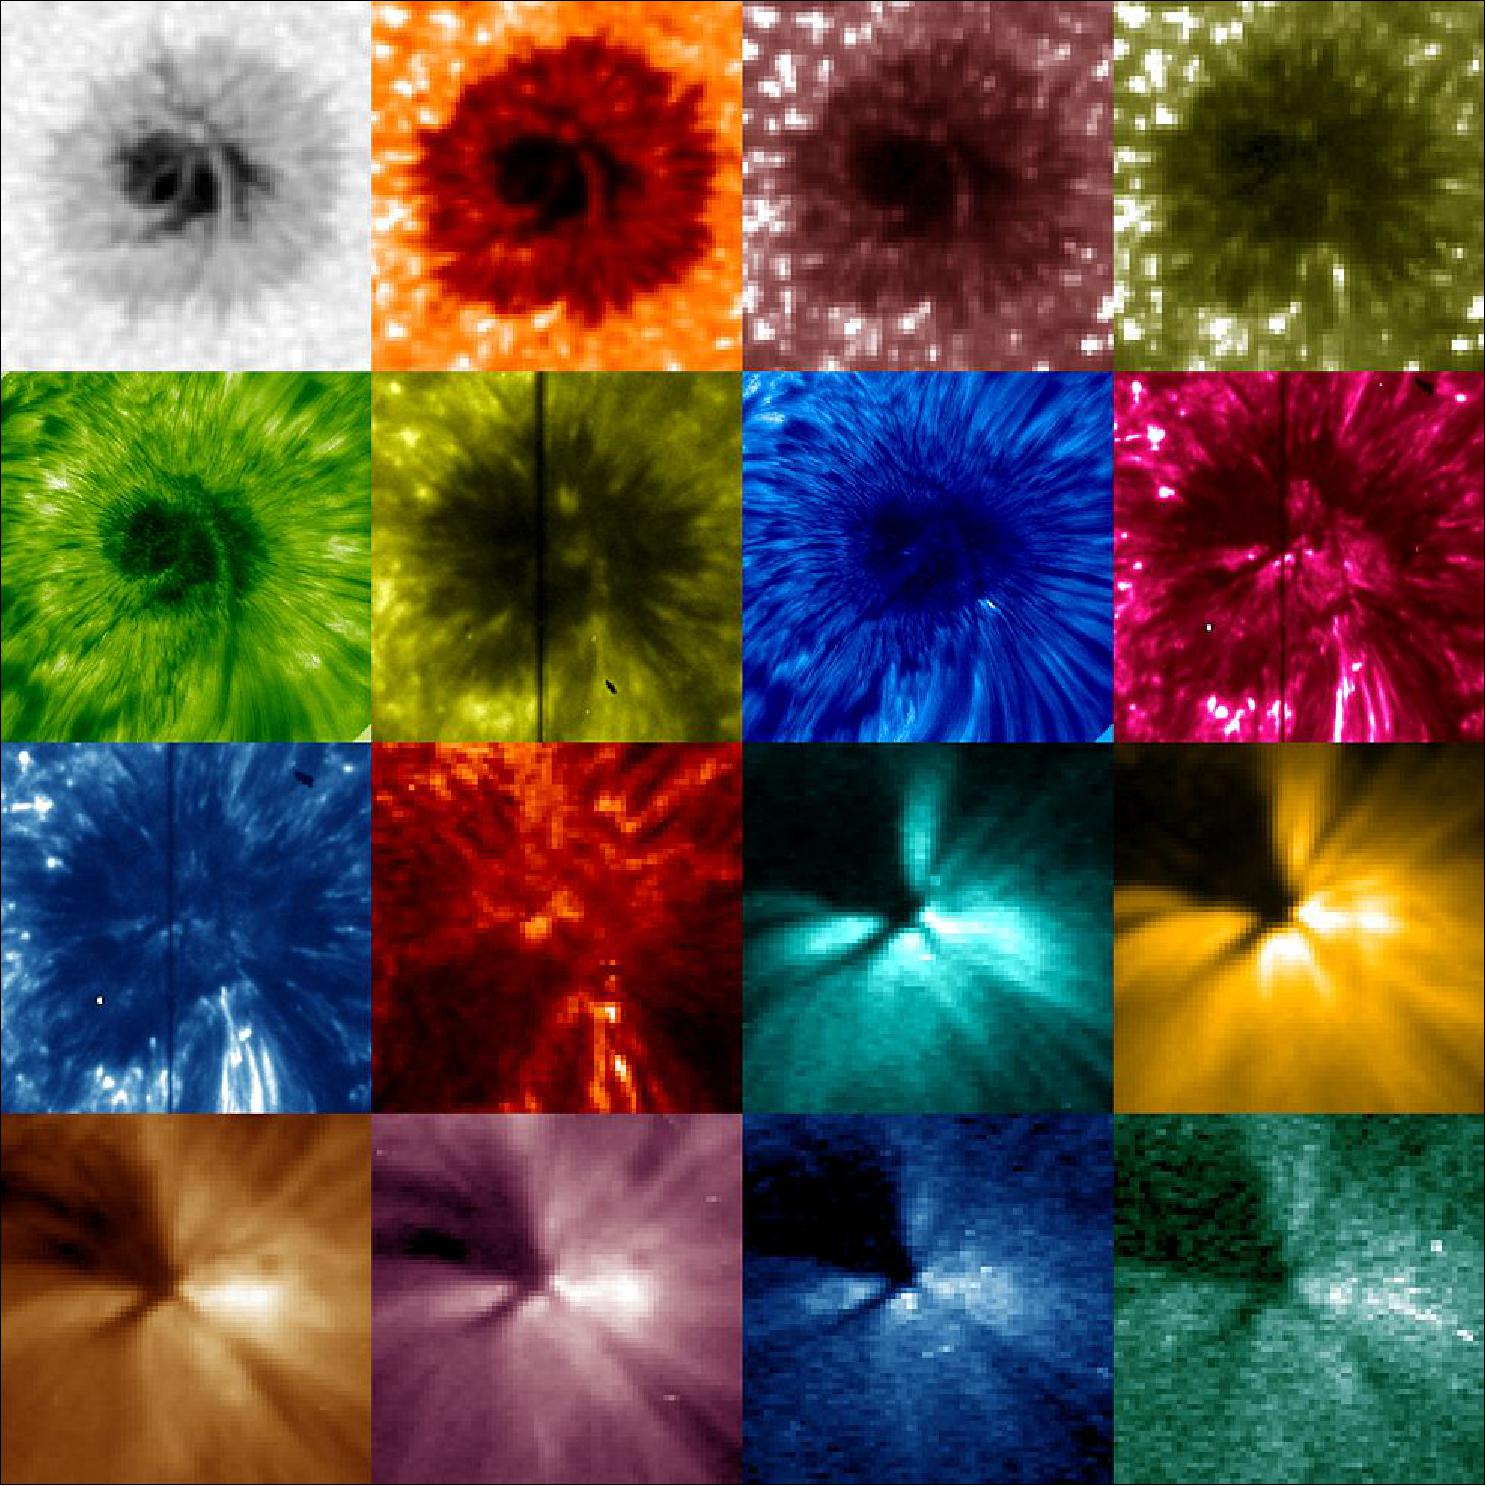
- The study used advanced high-resolution observations from the Dunn Solar Telescope in New Mexico (USA) alongside complementary observations from NASA's SDO (Solar Dynamics Observatory), to analyze the strongest magnetic fields that appear in sunspots. These sunspots have intense fields similar to modern MRI (Magnetic Resonance Imaging) machines in hospitals and are much bigger than our own planet.
- Scientists at Queen's University Belfast have led an international team to the ground-breaking discovery that magnetic waves crashing through the Sun may be the key to heating its atmosphere and propelling the solar wind. The international team included Queen's University Belfast, Belfast, UK; the Space Research Institute, AAS (Austrian Academy of Sciences), Graz, Austria; Abastumani Astrophysical Observatory at Ilia State University, Tbilisi, Georgia; NSO (National Solar Observatory), Boulder, CO, USA; IAC (Instituto de Astrofisica de Canarias), Spain; Lockheed Martin, Solar and Astrophysics Laboratory, Palo Alto, CA, USA, and the California State University Northridge, USA. 4)
- In 1942, a Swedish engineer and physicist by the name of Hannes Alfvén predicted the existence of a new type of wave – one that could exist purely as a result of magnetism acting on plasma. The important nature of these revolutionary waves earned Hannes Alfvén the Nobel Prize for Physics in 1970. Since his prediction, Alfvén waves have been associated with a variety of sources, including nuclear reactors, the coma of comets, laboratory experiments, medical MRI imaging, and in the atmosphere of our nearest star – the Sun. It is here, in the turbulent multi-million-degree atmosphere of the Sun, that Alfvén waves have been hypothesized to play an important role in maintaining such elevated temperatures.
- The solar surface hosts a web of diverse magnetic fields, from sunspots exhibiting sizes that dwarf the Earth, to dynamic bright grains only a few hundred kilometers across. The magnetic nature of the Sun’s atmosphere supports the plethora of MHD wave activity observed in recent years. Such wave motion is predominantly generated near the surface of the Sun, with the creation of upwardly propagating MHD waves providing a conduit for the transportation of heat, from the vast energy reservoir of the solar photosphere, to the outermost extremities of the multimillion-degree corona.
- In comparison to other MHD modes, Alfvén waves are the preferred candidates for energy transport since they do not reflect or dissipate energy freely. Observational studies have been limited by the challenging requirements on instrumentation needed to identify the Doppler line-of-sight (LOS) velocity perturbations and non-thermal broadening associated with Alfvén waves, thus there is only tentative evidence of their existence within the Sun’s magnetized plasma. Given the difficulties associated with resolving the intrinsic wave signatures, to date there has been no observational evidence brought forward to verify the dissipative processes associated with Alfvén waves.
Intensity scans of the chromospheric Ca II 8,542 Å spectral line at high spatial (71 km per pixel) and temporal (5.8 s) resolution were conducted for a 70 x 70 Mm2 region centered around a large sunspot on 24 August 2014 using the IBIS (Interferometric BIdimensional Spectrometer) at the Dunn Solar Telescope. Three-dimensional values for the vector magnetic field are derived through nonlinear force-free extrapolations applied to simultaneous magnetograms obtained by the HMI (Helioseismic and Magnetic Imager) aboard the SDO ( Solar Dynamics Observatory) spacecraft. The resulting images (Figure 3) highlight the connectivity between the magnetic fields and the structuring of the sunspot atmosphere. Intensity thresholding of running-mean-subtracted images of the chromospheric umbra allowed for the identification of 554,792 individual shock signals across the 135 minute duration of the dataset.
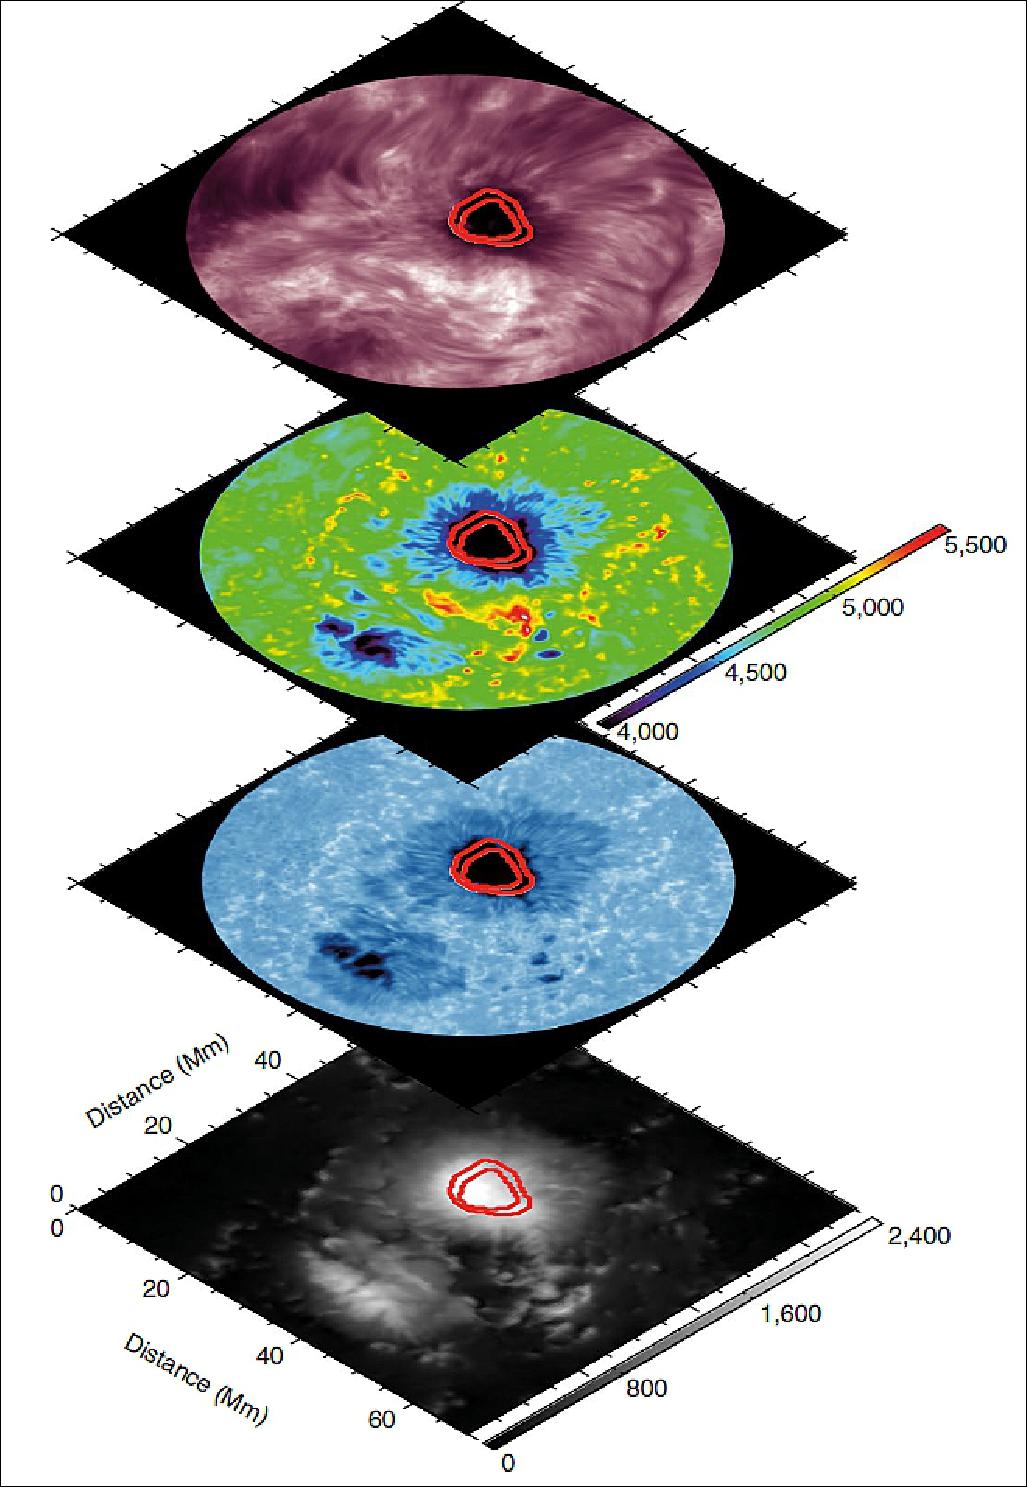
Legend to Figure 3: Co-spatial images revealing the structure of the sunspot at 13:00 UT on 24 August 2014. The lower image shows the magnitude of the photospheric magnetic field from HMI, revealing high umbral field strengths (color bar relates to the field strengths in gauss). The image above is taken from the blue wing of the Ca II 8,542 Å spectral line, displaying the photospheric representation of the sunspot. Above this is the photospheric plasma temperature of the region derived from CAISAR (CAlcium Inversion using a Spectral ARchive) at log(τ 500 nm) ~-2 (or ~ 250 km above the photosphere), showing the clear temperature distinction between the umbra, penumbra and surrounding quiet Sun (color bar in units of Kelvin). The upper image shows the chromospheric core of the Ca II 8,542 Å spectral line, highlighting the strong intensity gradient between the umbra and penumbra at these heights. In each of these images, the red contours represent the inner and outer boundaries of the plasma-β = 1 region at the height where shocks first begin to manifest (~ 250 km), where magneto-acoustic and Alfvén waves can readily convert.
- The sunspot displays a classical structure, providing two preferential locations for plasma shock formation in the umbra: first, in the vicinity of strong, vertical magnetic fields near the umbral center of mass, and second, in the presence of weaker, inclined fields towards the outer boundary of the umbra (Figure 4). The first population is attributed to UFs (Umbral Flashes), whereby the near-vertical propagation of magneto-acoustic waves across multiple density scale heights promotes their efficient steepening into shocks. The second population, whose intensity excursions are formed along inclined magnetic fields that channel waves almost horizontally (inclinations of approximately 70–80 degrees), provides the first indication of Alfvén wave shock formation. Alfvén shocks are predicted to form in regions with high negative Alfvén speed gradients, which is fulfilled by the volume expansion of the magnetic field lines and the highly inclined environment in which they exist, hence minimizing the effects of density stratification and promoting a negative gradient in the associated Alfvén speed.
- The extrapolated vector magnetic fields are employed with the complementary CAISAR code, producing maps of magnetic and thermal pressure that are used to establish the physical locations where the ratio of these parameters, the plasma-β, equals unity (Figure 3). Here, the plasma-β = 1 region is analogous to the locations where the characteristic velocities of slow and fast waves are equal. Thus, ubiquitous magneto-acoustic waves throughout the umbra are capable of converting into Alfvén modes through the process of mode conversion. This provides a bulk generation of Alfvén waves that can form both Alfvén and resonantly driven shocks under the correct atmospheric conditions. The magnetic topologies representative of the outermost boundary of the sunspot umbra provide such an environment where a steep negative Alfvén speed gradient is encountered by the propagating waves. UF shock formation in this regime is drastically suppressed due to the heavily inclined magnetic field lines providing substantially reduced density stratification along the paths of wave propagation.
- Examination of the Doppler LOS velocities of the shocked plasma further distinguishes between UFs near the sunspot core and the Alfvén shocks at the periphery of the umbra. The LOS plasma velocities associated with the UF population are blue-shifted and display characteristic ‘sawtooth’ spectral profiles throughout their temporal evolution, consistent with the established morphology of UFs (Umbral Flashes). The second population, which dominates the outer umbral perimeter where the plasma-β equals unity, displays an intermingling of red- and blue-shifted plasma moving perpendicularly to the wavevector (Figure 4) during the onset of plasma shock events. This is in stark contrast to conventional UFs, and provides further direct evidence of Alfvén shocks, since large velocity excursions perpendicular to the vector magnetic field are representative of Alfvén waves undergoing nonlinear processes during the creation of shocks (Figure 5). Furthermore, the observed red-shifts indicate that approximately 70% of the observed shocks are due to the direct steepening of Alfvén waves, which is depicted in the right-hand side of Figure 5.
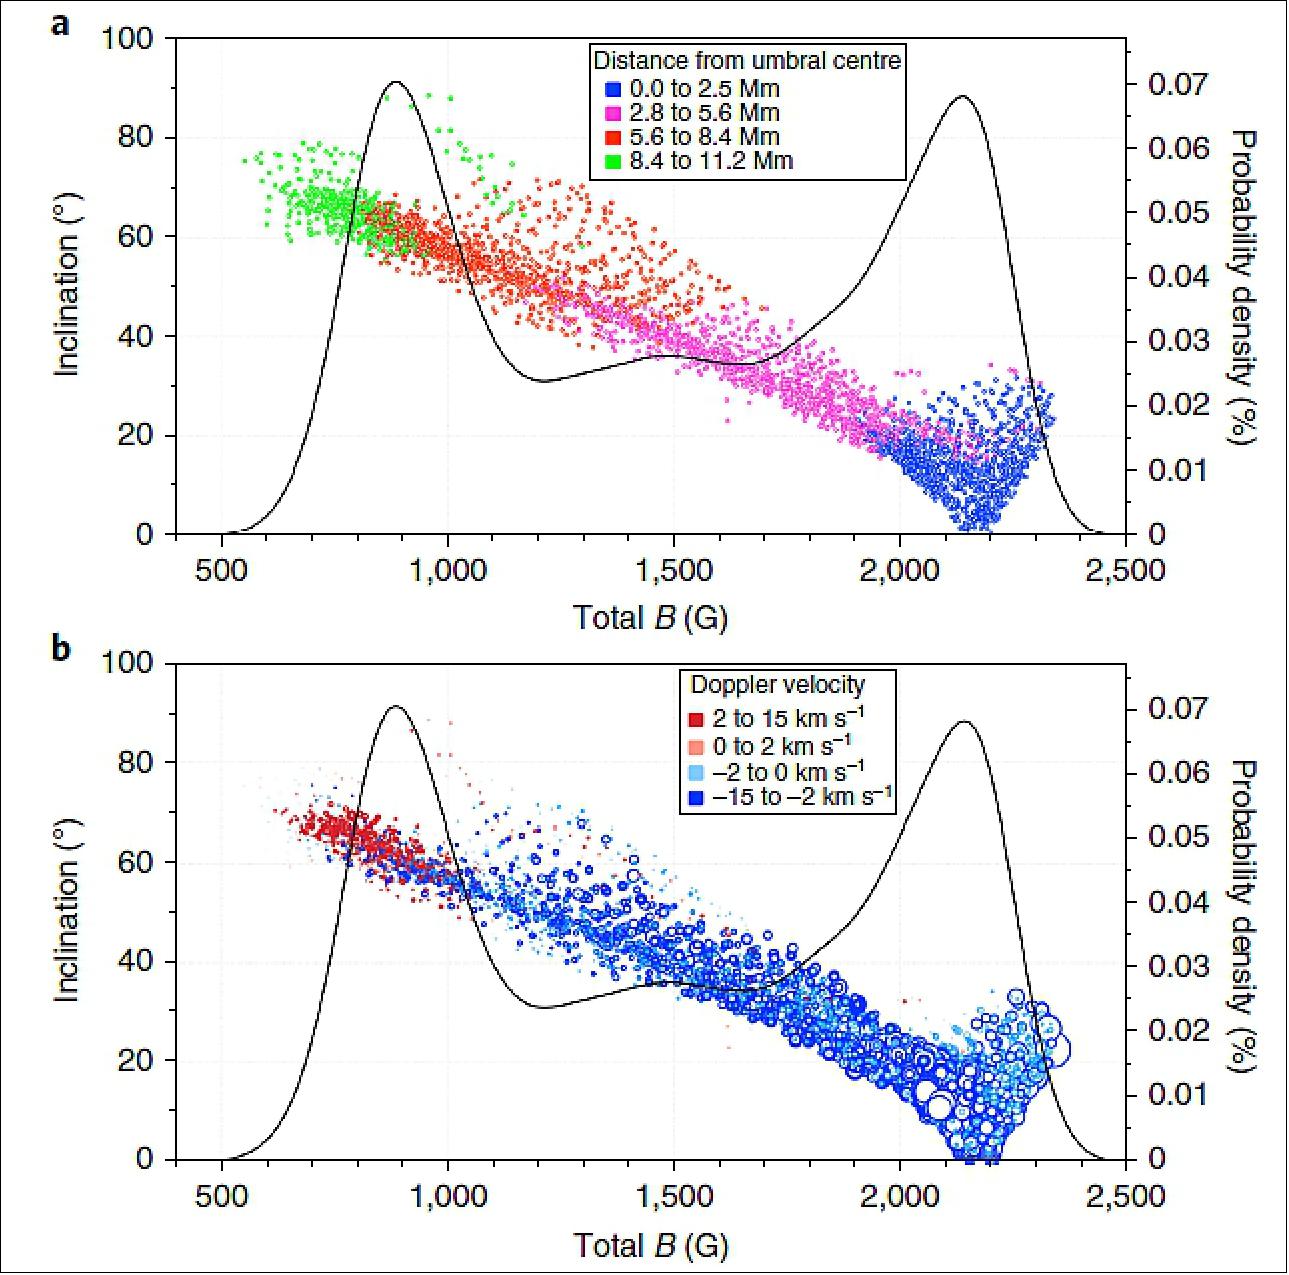
Legend to Figure 4: The inclination of the magnetic field as a function of the total magnetic field strength for shock pixels at their point of formation, where an inclination of 0° represents an upwardly orientated vertical field. The color scheme of the data points denotes their distance from the center of the umbral core in Mm (a) and the LOS velocities of the resultant shock emission profiles, where positive values represent red-shifted plasma motion away from the observer, while negative values indicate blue-shifted plasma towards the observer (b). The diameters of the data points in b represent a visualization of the relative temperature increases of shocked plasma above their local quiescent background temperatures, where the largest circles represent significant temperature enhancements (up to a maximum of ~ 20%) that are synonymous with higher magnetic field strengths when compared to the smaller temperature enhancements associated with lower magnetic field strengths. The data points are over-plotted with the probability density function of shock occurrence as a function of the total magnetic field strength.
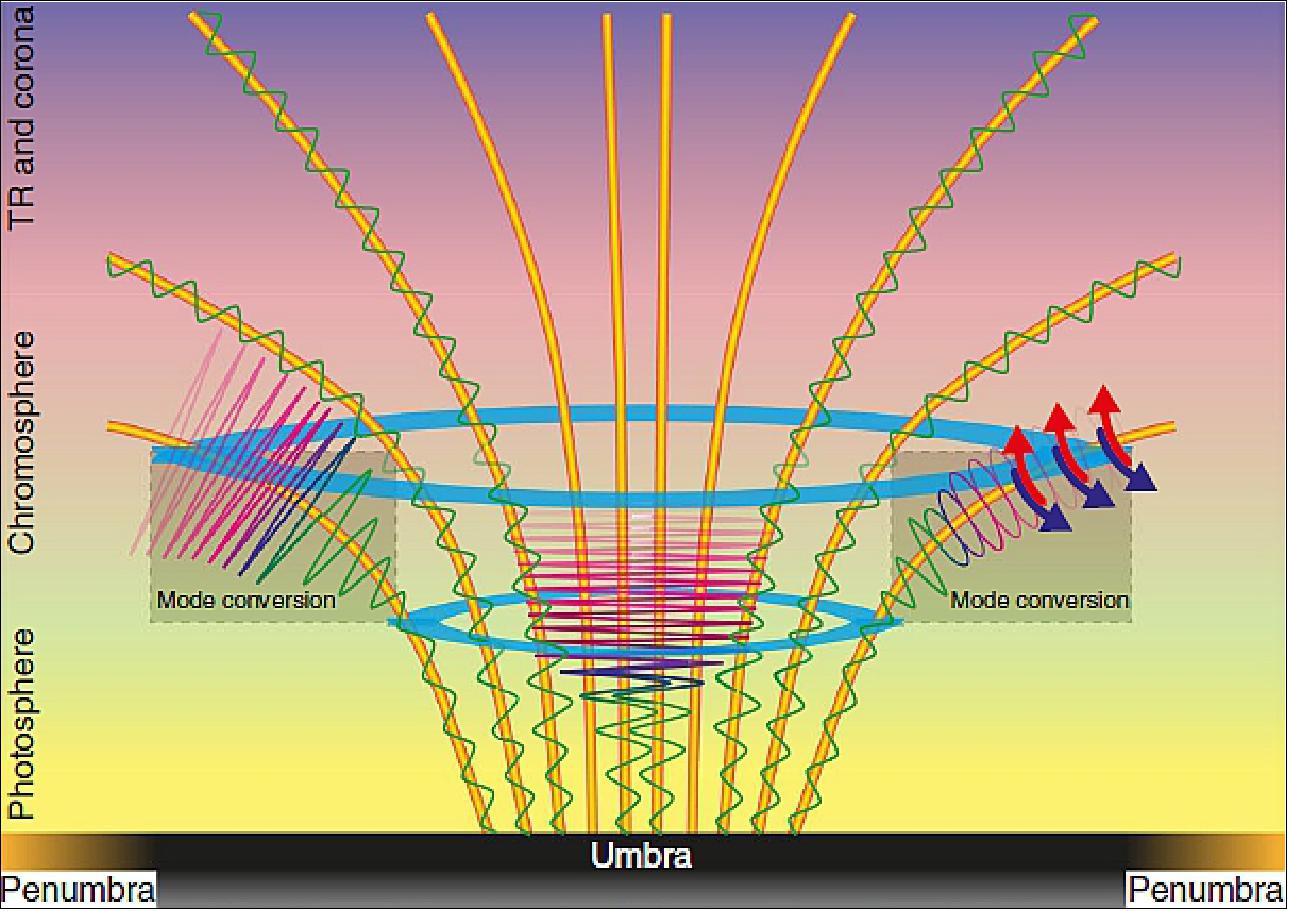
Legend to Figure 5: A side-on perspective of a typical sunspot atmosphere, showing magnetic field lines (orange cylinders) anchored into the photospheric umbra (bottom of image) and expanding laterally as a function of atmospheric height, into the upper atmospheric regions of the TR (Transition Region) and corona. The light blue annuli highlight the lower and upper extents of the mode-conversion region for the atmospheric heights of interest. The mode-conversion region on the left-hand side shows a schematic of nonlinear Alfvén waves resonantly amplifying magneto-acoustic waves, increasing the shock formation efficiency in this location. The mode-conversion region on the right-hand side demonstrates the coupling of upwardly propagating magneto-acoustic oscillations (the sinusoidal motions) into Alfvén waves (the elliptical structures), which subsequently develop tangential blue- and red-shifted plasma during the creation of Alfvén shocks. The central portion represents the traditional creation of UFs that result from the steepening of magnetoacoustic waves as they traverse multiple density scale heights in the lower solar atmosphere. Image not to scale.
• February 26, 2018: A dramatic magnetic power struggle at the Sun’s surface lies at the heart of solar eruptions, new research using NASA data shows. The work highlights the role of the Sun’s magnetic landscape, or topology, in the development of solar eruptions that can trigger space weather events around Earth. 5)
- The scientists, led by Tahar Amari, an astrophysicist at the Center for Theoretical Physics at the École Polytechnique in Palaiseau Cedex, France, considered solar flares, which are intense bursts of radiation and light. Many strong solar flares are followed by a coronal mass ejection, or CME, a massive, bubble-shaped eruption of solar material and magnetic field, but some are not — what differentiates the two situations is not clearly understood.
- Using data from NASA’s SDO (Solar Dynamics Observatory), the scientists examined an October 2014 Jupiter-sized sunspot group, an area of complex magnetic fields, often the site of solar activity. This was the biggest group in the past two solar cycles and a highly active region. Though conditions seemed ripe for an eruption, the region never produced a major CME on its journey across the Sun. It did, however, emit a powerful X-class flare, the most intense class of flares. What determines, the scientists wondered, whether a flare is associated with a CME?

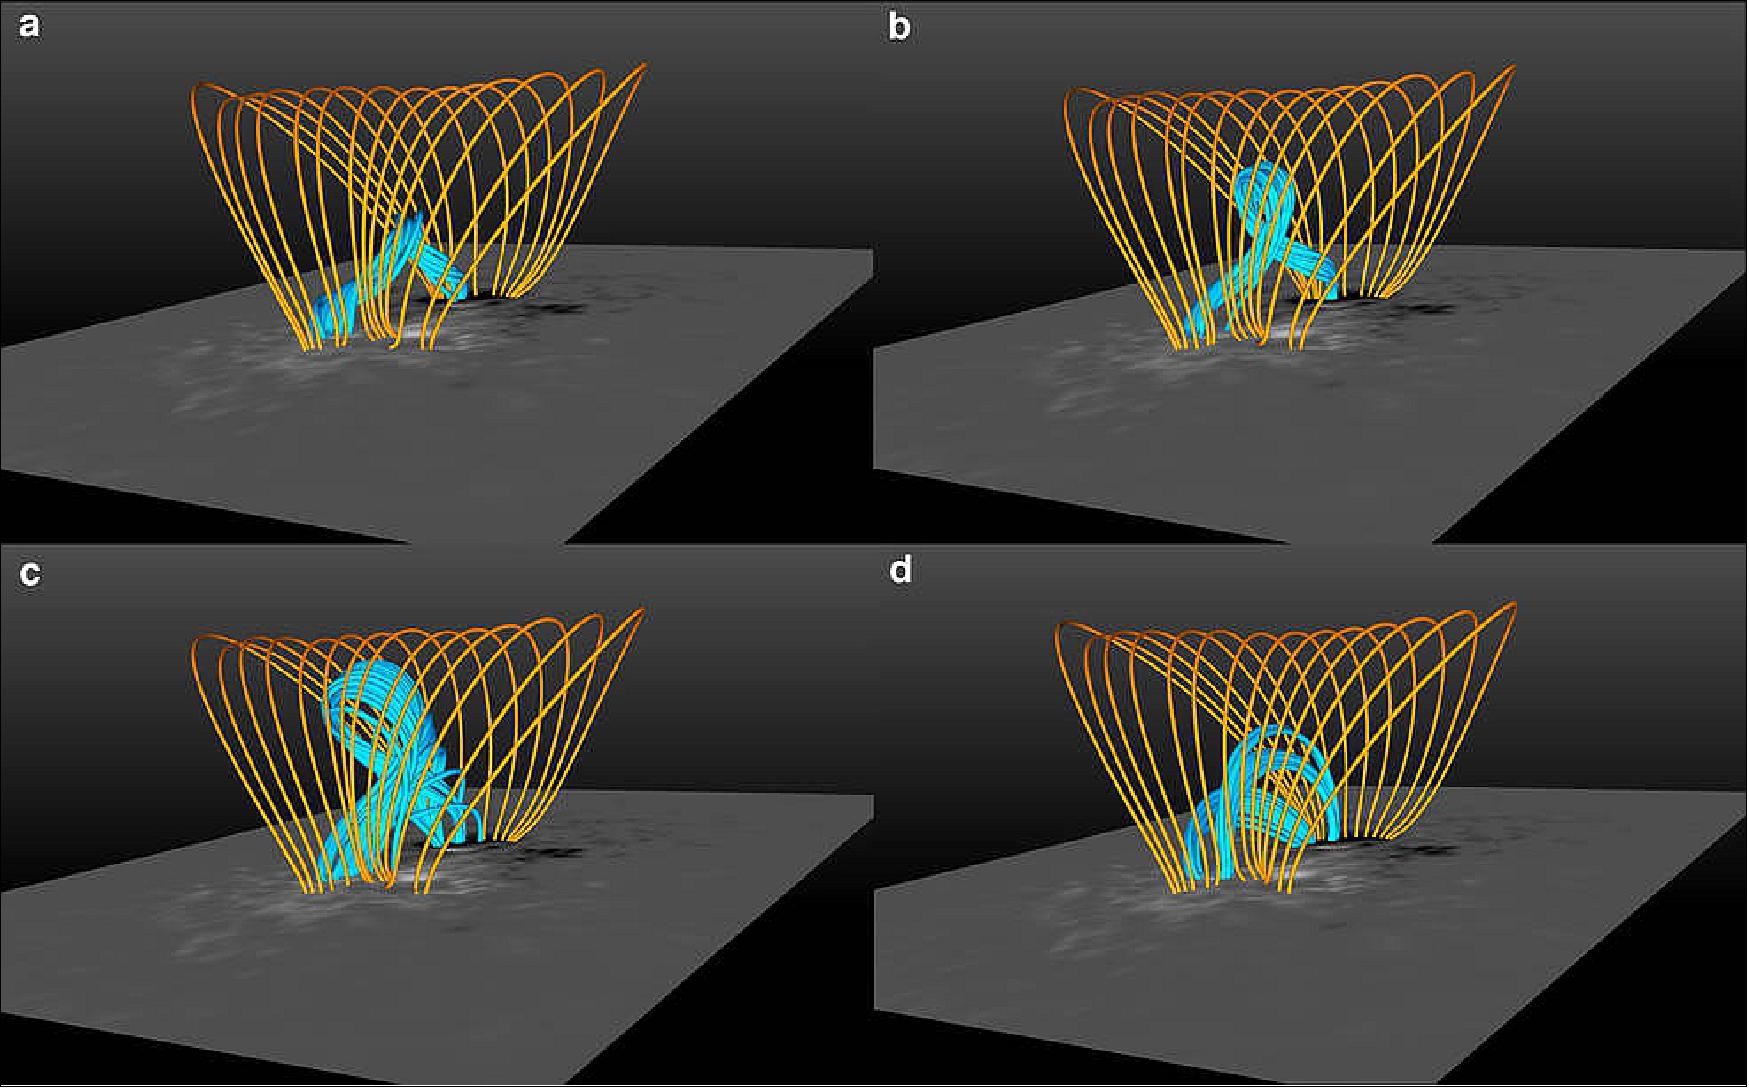
- The team of scientists included SDO’s observations of magnetic fields at the Sun’s surface in powerful models that calculate the magnetic field of the Sun’s corona, or upper atmosphere, and examined how it evolved in the time just before the flare. The model reveals a battle between two key magnetic structures: a twisted magnetic rope — known to be associated with the onset of CMEs — and a dense cage of magnetic fields overlying the rope.
- The scientists found that this magnetic cage physically prevented a CME from erupting that day. Just hours before the flare, the sunspot’s natural rotation contorted the magnetic rope and it grew increasingly twisted and unstable, like a tightly coiled rubber band. But the rope never erupted from the surface: Their model demonstrates it didn’t have enough energy to break through the cage. It was, however, volatile enough that it lashed through part of the cage, triggering the strong solar flare.
- By changing the conditions of the cage in their model, the scientists found that if the cage was weaker that day, a major CME would have erupted on Oct. 24, 2014. The group is interested in further developing their model to study how the conflict between the magnetic cage and rope plays out in other eruptions. Their findings are summarized in a paper published in Nature on Feb. 8, 2018. 6)
- “We were able to follow the evolution of an active region, predict how likely it was to erupt, and calculate the maximum amount of energy the eruption can release,” Amari said. “This is a practical method that could become important in space weather forecasting as computational capabilities increase.”
• On 11 February 2018, the SDO spacecraft was 8 years on orbit.
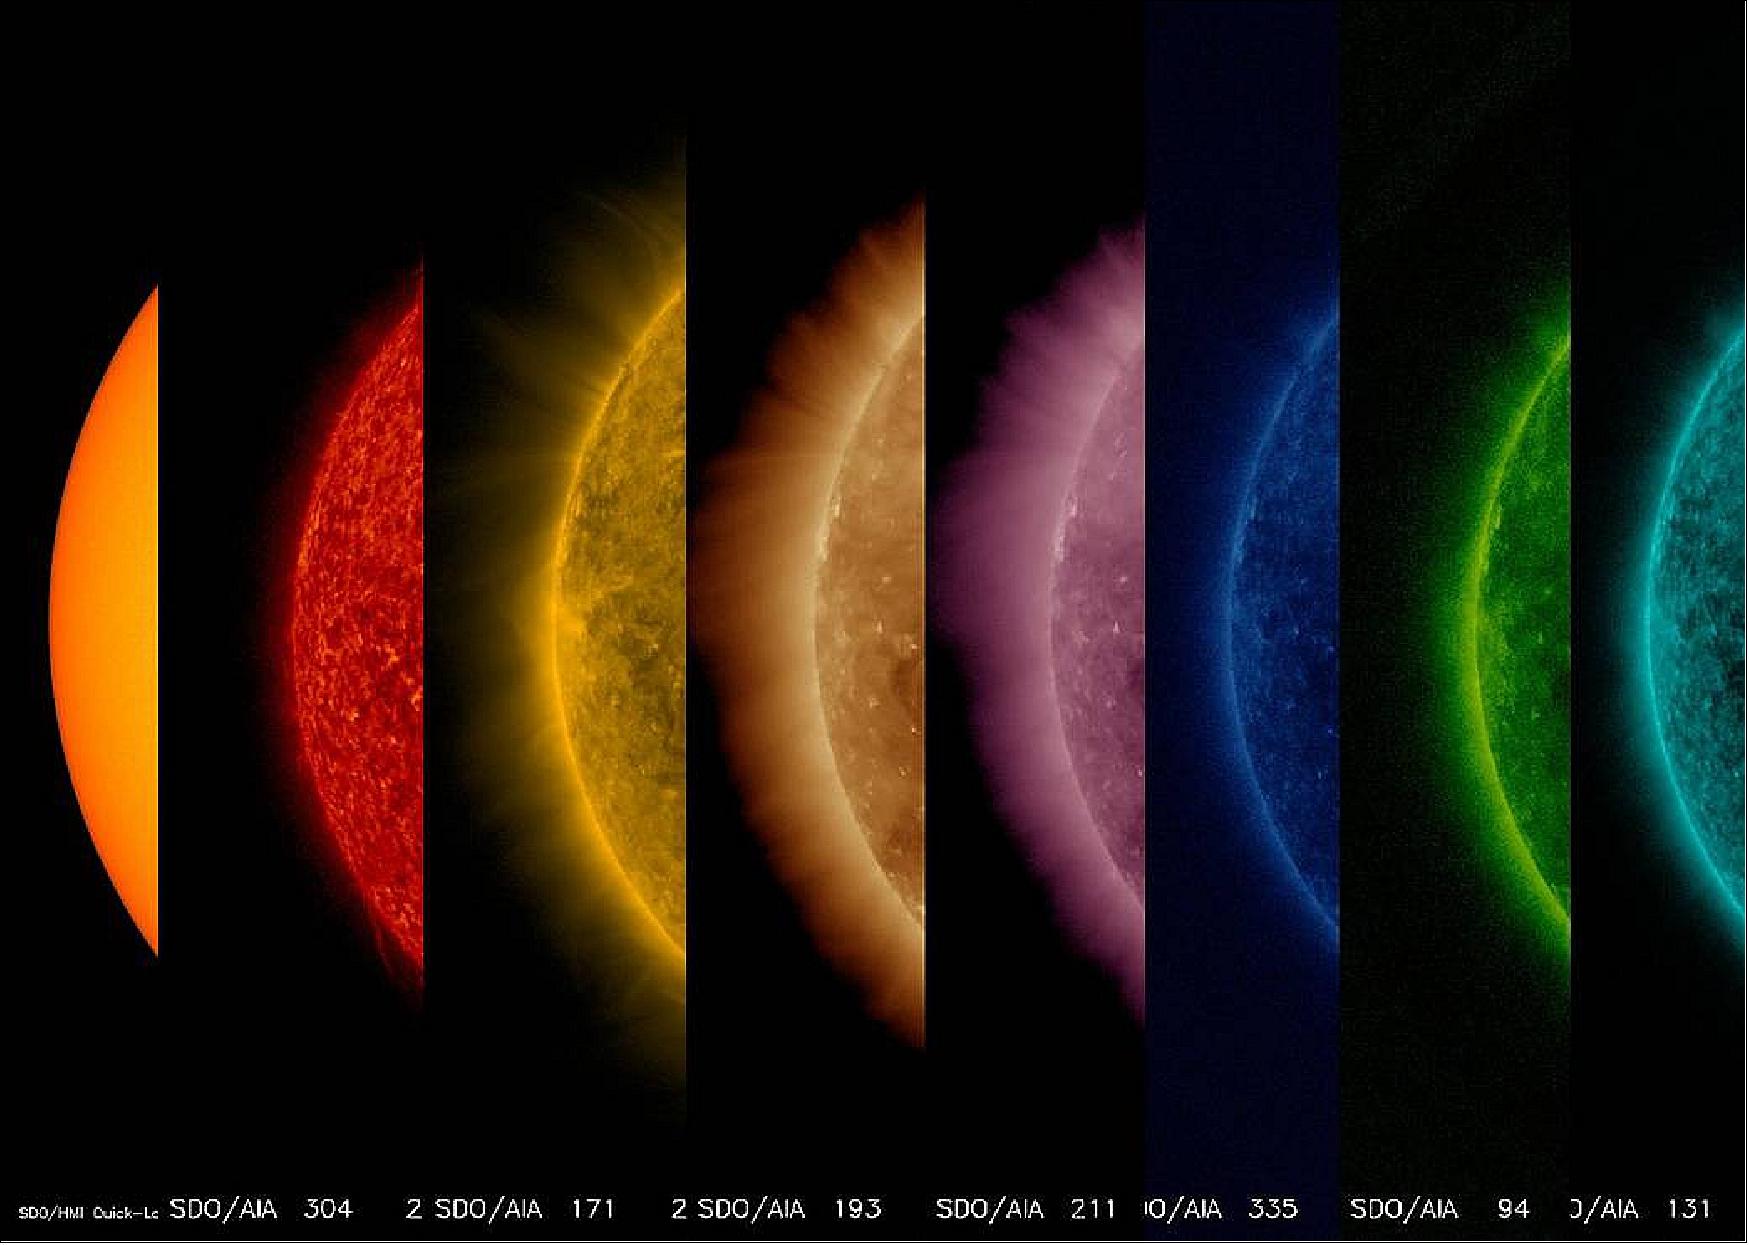
• November 1, 2017: This sequence of images of Figure 8 shows the Sun from its surface to its upper atmosphere, all taken at about the same time on Oct. 27, 2017. The first shows the surface of the Sun in filtered white light; the other seven images were taken in different wavelengths of extreme ultraviolet light. Note that each wavelength reveals somewhat different features. They are shown in order of temperature from the first one at 6,000 degree C. surface, out to about 10 million degrees C. in the upper atmosphere. Yes, the Sun's outer atmosphere is much, much hotter than the surface. Scientists are getting closer to solving the processes that generate this phenomenon. 7)
• September 6, 2017: The sun emitted two significant solar flares on the morning of Sept. 6, 2017. The first peaked at 9:10 UTC and the second, larger flare, peaked at 12:02 UTC. NASA’s SDO (Solar Dynamics Observatory), which watches the sun constantly, captured images of both events. Solar flares are powerful bursts of radiation. Harmful radiation from a flare cannot pass through Earth's atmosphere to physically affect humans on the ground, however — when intense enough — they can disturb the atmosphere in the layer where GPS and communications signals travel.
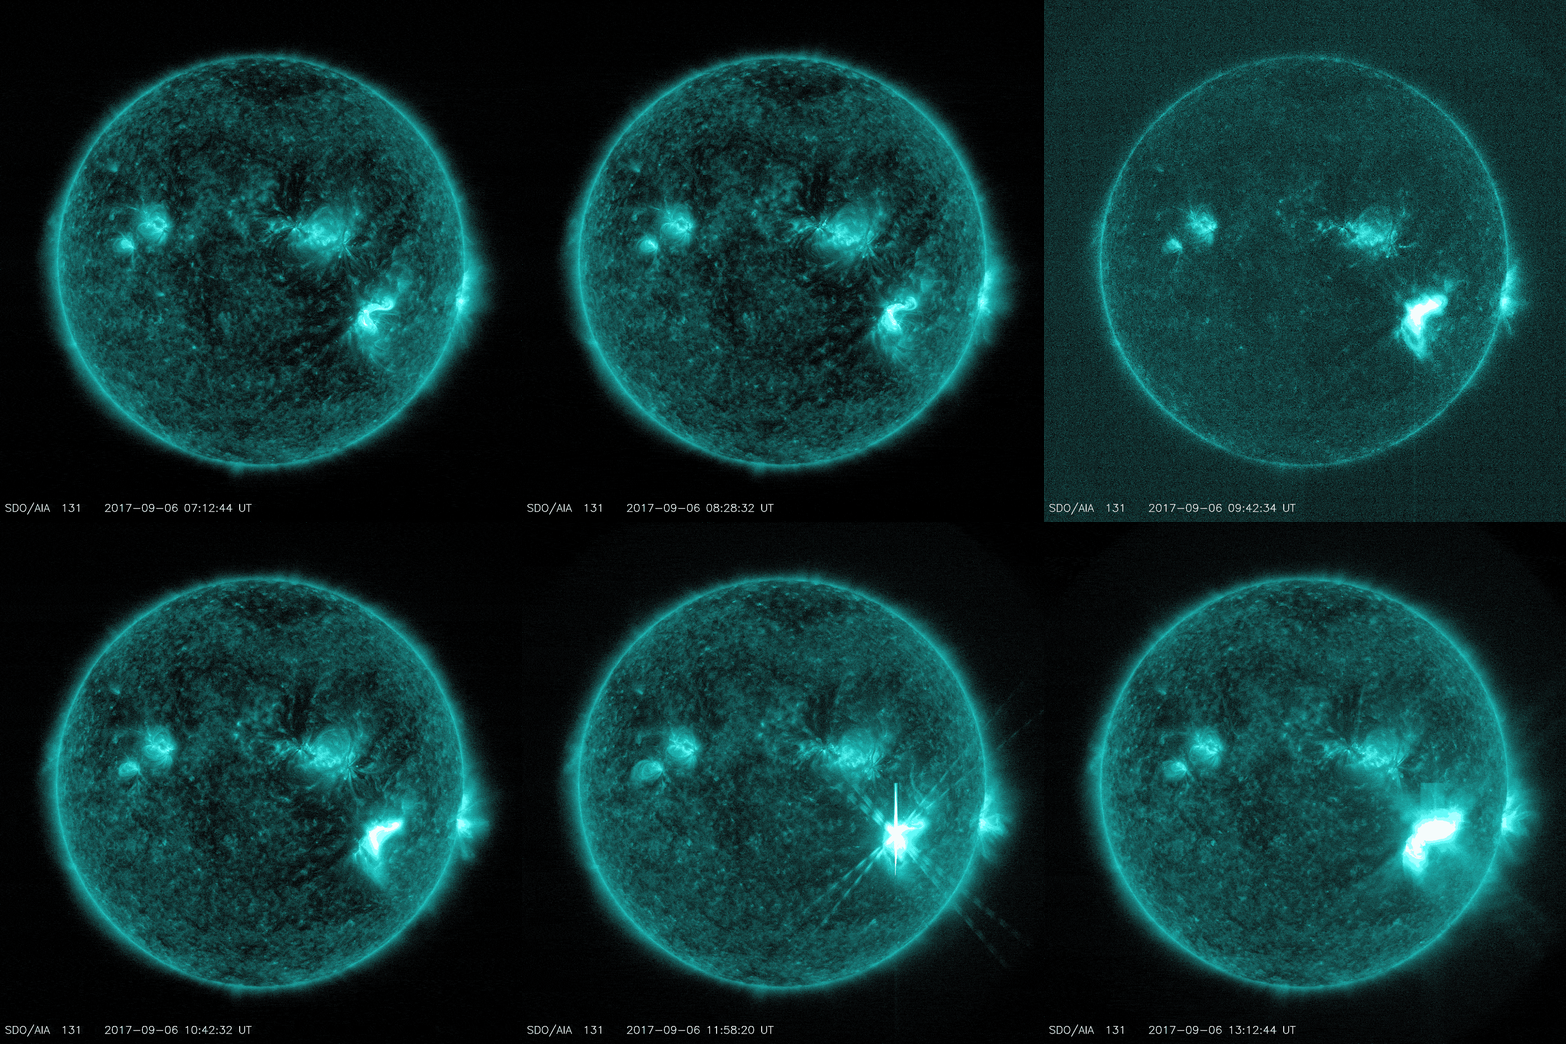
- The first flare is classified as an X2.2 flare and the second is an X9.3 flare. X-class denotes the most intense flares, while the number provides more information about its strength. An X2 is twice as intense as an X1, an X3 is three times as intense, etc.
- Both flares erupted from an active region labeled AR 2673, which also produced a mid-level solar flare on Sept. 4, 2017. The X9.3 flare was the largest flare so far in the current solar cycle, the approximately 11-year-cycle during which the sun’s activity waxes and wanes. The current solar cycle began in December 2008, and is now decreasing in intensity and heading toward solar minimum. This is a phase when such eruptions on the sun are increasingly rare, but history has shown that they can nonetheless be intense. The radio black out from this particular flare is already passed.
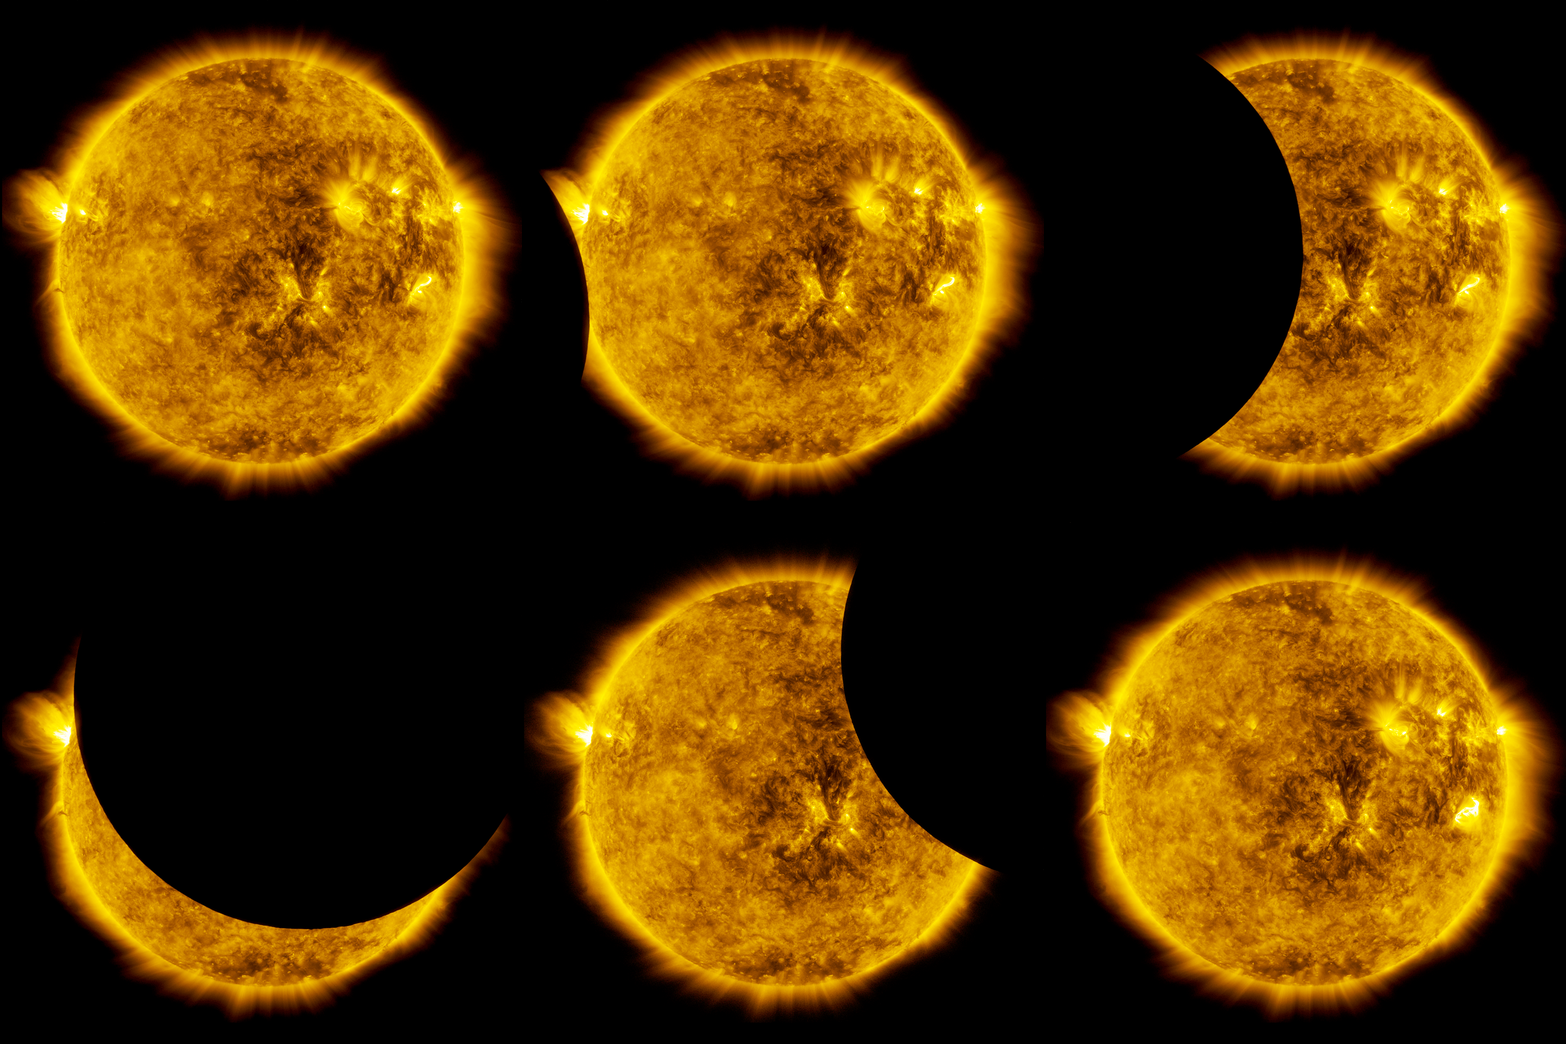
• On May 25 2017, NASA's SDO mission saw a partial solar eclipse in space when it caught the moon passing in front of the sun. The lunar transit lasted almost an hour, between 6:24 and 7:17 UTC, with the moon covering about 89 percent of the sun at the peak of its journey across the sun's face. The moon's crisp horizon can be seen from this view because the moon has no atmosphere to distort the sunlight. 8)
- While the moon’s edge appears smooth in these images, it’s actually quite uneven. The surface of the moon is rugged, sprinkled with craters, valleys and mountains. Peer closely at the image, and you may notice the subtle, bumpy outline of these topographical features.
- Later this summer on Aug. 21, 2017, SDO will witness another lunar transit, but the moon will only barely hide part of the sun. However, on the same day, a total eclipse will be observable from the ground. A total solar eclipse — in which the moon completely obscures the sun — will cross the United States on a 110 km wide ribbon of land stretching from Oregon to South Carolina. Throughout the rest of North America — and even in parts of South America, Africa, Europe and Asia — a partial eclipse will be visible.
- The moon’s rough, craggy terrain influences what we see on Earth during a total solar eclipse. Light rays stream through lunar valleys along the moon’s horizon and form Baily’s beads, bright points of light that signal the beginning and end of totality.
- The moon’s surface also shapes the shadow, called the umbra, that races across the path of totality: Sunlight peeks through valleys and around mountains, adding edges to the umbra. These edges warp even more as they pass over Earth’s own mountain ranges. Visualizers used data from NASA’s LRO (Lunar Reconnaissance Orbiter), coupled with NASA topographical data of Earth, to precisely map the upcoming eclipse in unprecedented detail. This work shows the umbral shape varies with time, and is not simply an ellipse, but an irregular polygon with slightly curved edges.
• April 10, 2017: New research on solar storms finds that they not only can cause regions of excessive electrical charge in the upper atmosphere above Earth's poles, they also can do the exact opposite: cause regions that are nearly depleted of electrically charged particles. The finding adds to our knowledge of how solar storms affect Earth and could possibly lead to improved radio communication and navigation systems for the Arctic. 9)
- A team of researchers from Denmark, the United States and Canada made the discovery while studying a solar storm that reached Earth on Feb. 19, 2014. The storm was observed to affect the ionosphere in all of Earth's northern latitudes. Its effects on Greenland were documented by a network of global navigation satellite system, or GNSS, stations as well as geomagnetic observatories and other resources. Attila Komjathy of NASA/JPL (Jet Propulsion Laboratory), Pasadena, California, developed software to process the GNSS data and helped with the data processing. The results were published in the journal Radio Science. 10)
- Solar storms often include an eruption on the sun called a CME (Coronal Mass Ejection). This is a vast cloud of electrically charged particles hurled into space that disturbs the interplanetary magnetic field in our solar system. When these particles and the magnetic disturbances encounter Earth's magnetic field, they interact in a series of complex physical processes, and trigger perturbations in the Earth's magnetic field. Those perturbations are called geomagnetic storms. The interactions may cause unstable patches of excess electrons in the ionosphere, an atmospheric region starting about 80 km above Earth's surface that already contains ions and electrons.
- The 2014 geomagnetic storm was a result of two powerful Earth-directed CMEs. The storm initially produced patches of extra electrons in the ionosphere over northern Greenland, as usual. But just south of these patches, the scientists were surprised to find broad areas extending 500 to 1,000 km where the electrons were "almost vacuumed out," in the words of Per Høeg of the National Space Research Institute at the Technical University of Denmark, Lyngby. These areas remained depleted of electrons for several days.
- The electrons in the ionosphere normally reflect radio waves back to ground level, enabling long-distance radio communications. Both electron depletion and electron increases in this layer can possibly cause radio communications to fail, reduce the accuracy of GPS systems, damage satellites and harm electrical grids.
- "We don't know exactly what causes the depletion," Komjathy said. "One possible explanation is that electrons are recombining with positively charged ions until there are no excess electrons. There could also be redistribution — electrons being displaced and pushed away from the region, not only horizontally but vertically."
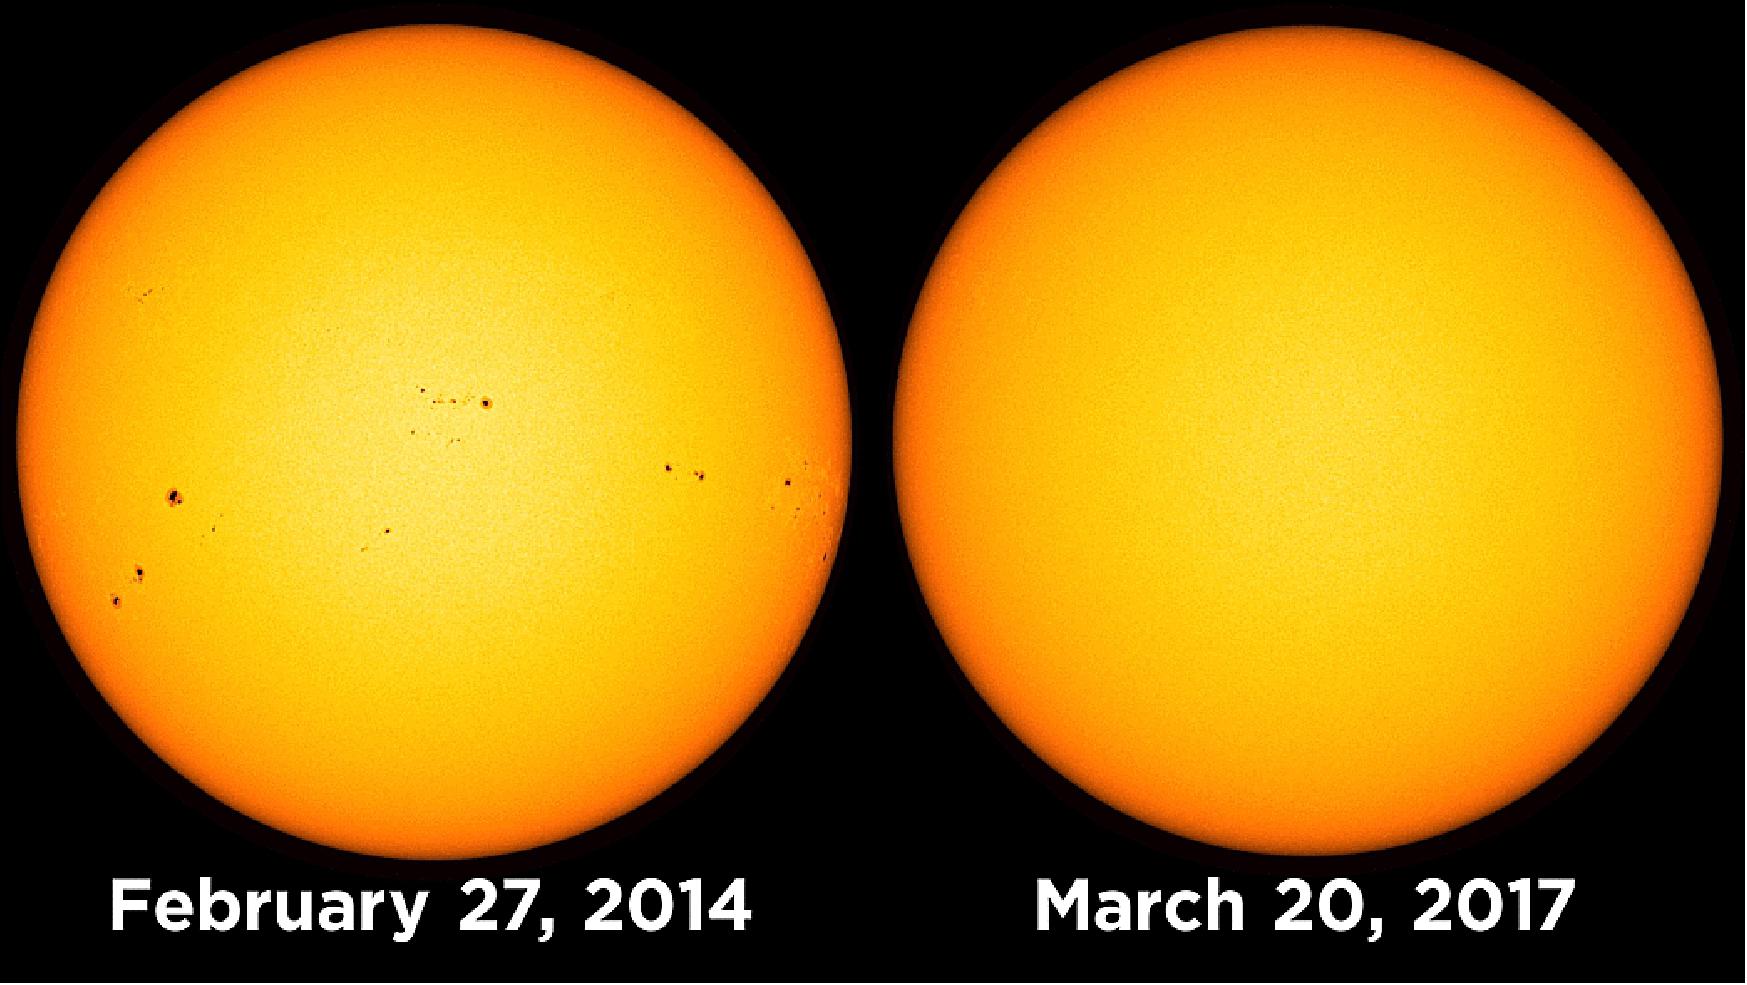
• March 22, 2017: For 15 days starting on March 7, 2017, NASA’s SDO (Solar Dynamics Observatory) returned visible light images of a yolk-like spotless sun. This is the longest stretch of spotlessness since the last solar minimum in April 2010, indicating the solar cycle is marching on toward the next minimum, which scientists predict will occur between 2019—2020. 11)
- The sun goes through a natural 11-year cycle marked by two extremes: solar maximum and solar minimum. Sunspots are dark regions of complex magnetic activity on the sun’s surface, so the number of sunspots at any given time is used as an index for solar activity. Solar maximum is characterized by intense solar activity and the greatest sunspot number. Conversely, during solar minimum, the sun is least active and sunspot number is at its lowest. Solar activity, however, does not end as sunspot number decreases toward minimum. There are other sources of solar activity such as high-speed streams of solar material from coronal holes, which spark aurora and other space weather effects.
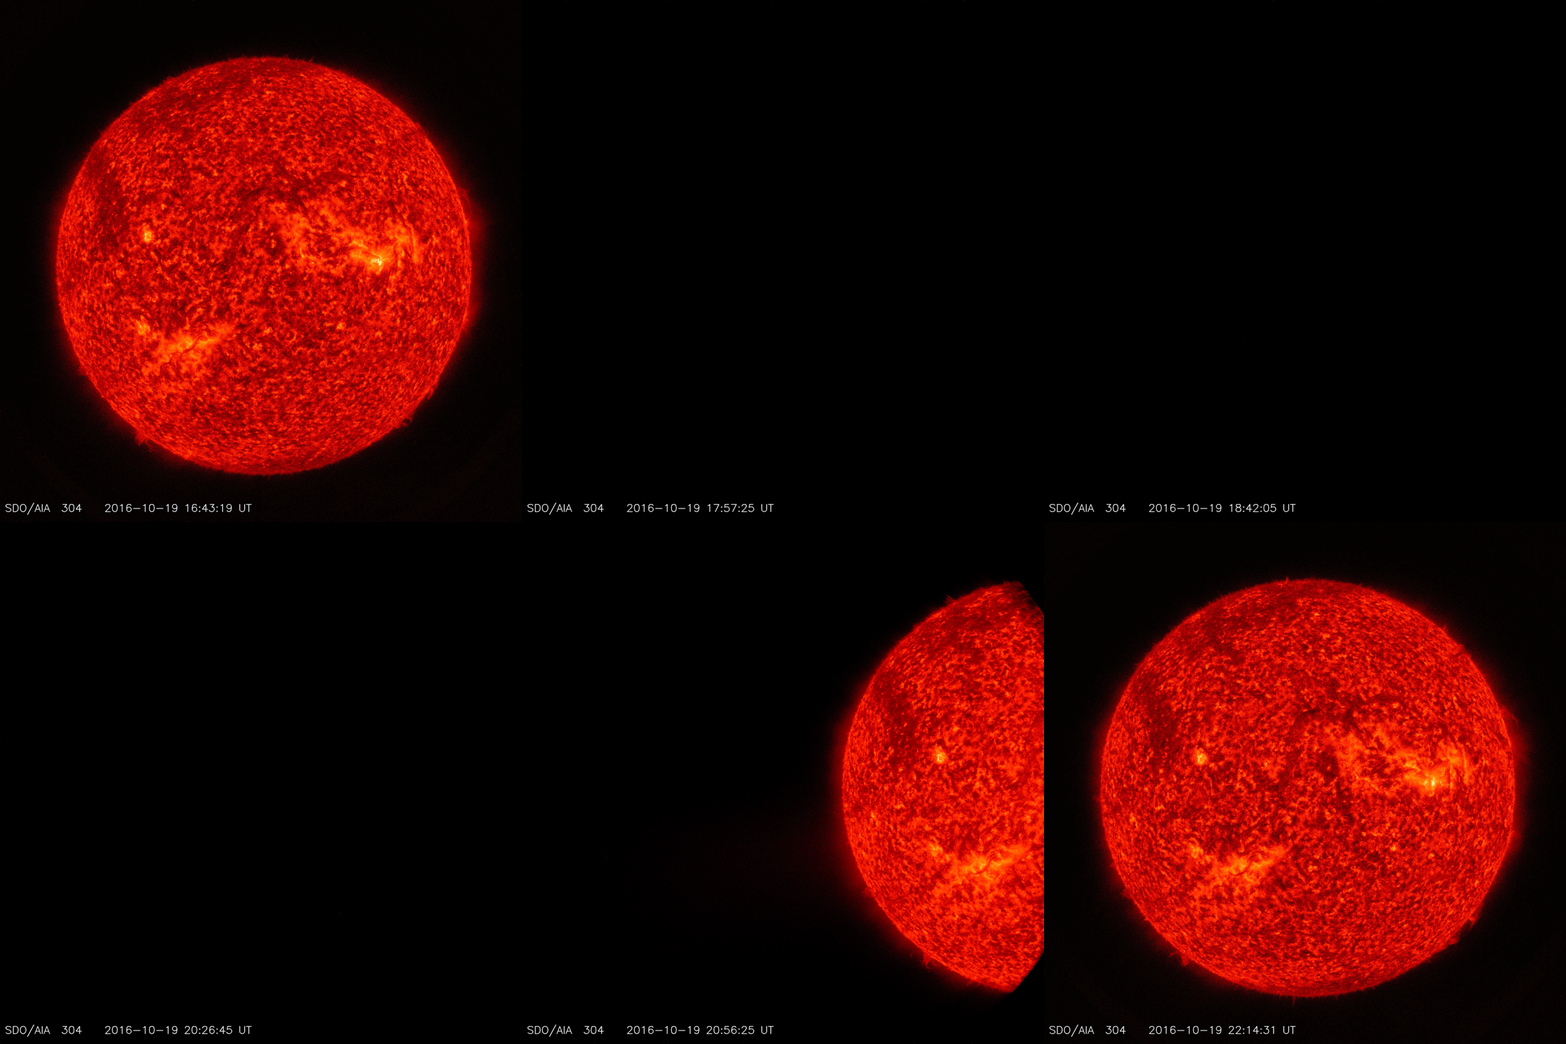
• November 3, 2016: On Oct. 19, 2016, operators instructed NASA’s SDO spacecraft to look up and down and then side to side over the course of six hours, as if tracing a great plus sign in space. During this time, SDO produced some unusual data. Taken every 12 seconds, SDO images show the sun dodging in and out of the frame. SDO captured these images in extreme ultraviolet light, a type of light that is invisible to our eyes. Here, they are colorized in red. 12)
- SDO operators schedule this maneuver, one of a series of maneuvers that SDO completed on Oct. 27, 2016, twice a year to calibrate the spacecraft’s instruments. Veering motions allow scientists to assess how light travels through SDO’s instruments – whether light is reflected inside the instrument, for example – and how these instruments are changing over time.
- This particular maneuver is the EVE cruciform maneuver, designed to help SDO’s Extreme ultraviolet Variability Experiment, or EVE, take accurate measurements of the sun’s extreme UV emissions. EVE studies these emissions over time, so that we may better understand their role in influencing Earth’s climate and local space environment.
• October 20, 2016: While it often seems unvarying from our viewpoint on Earth, the sun is constantly changing. Material courses through not only the star itself, but throughout its expansive atmosphere. Understanding the dance of this charged gas is a key part of better understanding our sun – how it heats up its atmosphere, how it creates a steady flow of solar wind streaming outward in all directions, and how magnetic fields twist and turn to create regions that can explode in giant eruptions. Now, for the first time, researchers have tracked a particular kind of solar wave as it swept upward from the sun's surface through its atmosphere, adding to our understanding of how solar material travels throughout the sun. 13)
- Tracking solar waves like this provides a novel tool for scientists to study the atmosphere of the sun. The imagery of the journey also confirms existing ideas, helping to nail down the existence of a mechanism that moves energy – and therefore heat – into the sun’s mysteriously-hot upper atmosphere, called the corona. A study on these results was published Oct. 11, 2016, in The Astrophysical Journal Letters. 14)
- “We see certain kinds of solar seismic waves channeling upwards into the lower atmosphere, called the chromosphere, and from there, into the corona,” said Junwei Zhao, a solar scientist at Stanford University in Stanford, California, and lead author on the study. “This research gives us a new viewpoint to look at waves that can contribute to the energy of the atmosphere.”
- The study makes use of the wealth of data captured by NASA’s SDO (Solar Dynamics Observatory), NASA’s IRIS (Interface Region Imaging Spectrograph), and the BBSO (Big Bear Solar Observatory) in Big Bear Lake, California. Together, these observatories watch the sun in 16 wavelengths of light that show the sun’s surface and lower atmosphere. SDO alone captures 11 of these.
- “SDO takes images of the sun in many different wavelengths at a high time resolution,” said Dean Pesnell, SDO project scientist at NASA’s Goddard Space Flight Center in Greenbelt, Maryland. “That lets you see the frequencies of these waves – if you didn’t have such rapid-fire images, you’d lose track of the waves from one image to the next.”
- Though scientists have long suspected that the waves they spot in the sun’s surface, called the photosphere, are linked to those seen in the lowest reaches of the sun’s atmosphere, called the chromosphere, this new analysis is the first time that scientists have managed to actually watch the wave travel up through the various layers into the sun’s atmosphere.
- When material is heated to high temperatures, it releases energy in the form of light. The type, or wavelength, of that light is determined by what the material is, as well as its temperature. That means different wavelengths from the sun can be mapped to different temperatures of solar material. Since we know how the sun’s temperature changes throughout the layers of its atmosphere, we can then order these wavelengths according to their height above the surface – and essentially watch solar waves as they travel upwards.
- The implications of this study are twofold – first, this technique for watching the waves itself gives scientists a new tool to understand the sun’s lower atmosphere. “Watching the waves move upwards tells us a lot about the properties of the atmosphere above sunspots – like temperature, pressure, and density,” said Ruizhu Chen, a graduate student scientist at Stanford who is an author on the study. “More importantly, we can figure out the magnetic field strength and direction.”
- The effect of the magnetic field on these waves is pronounced. Instead of traveling straight upwards through the sun, the waves veer off, taking a curved path through the atmosphere. “The magnetic field is acting like railroad tracks, guiding the waves as they move up through the atmosphere,” said Pesnell, who was not involved in this study.
- The second implication of this new research is for a long-standing question in solar physics – the coronal heating problem. -The sun produces energy by fusing hydrogen at its core, so the simplest models suggest that each layer of the sun should be cooler as you move outward. However, the sun’s atmosphere, called the corona, is about a hundred times hotter than the region below – counter to what you would expect.
- No one has as-yet been able to definitively pinpoint the source of all the extra heat in the corona, but these waves may play a small role. “When a wave travels upwards, a number of different things can happen,” said Zhao. “Some may reflect back downwards, or contribute to heating – but by how much, we don’t yet know.”
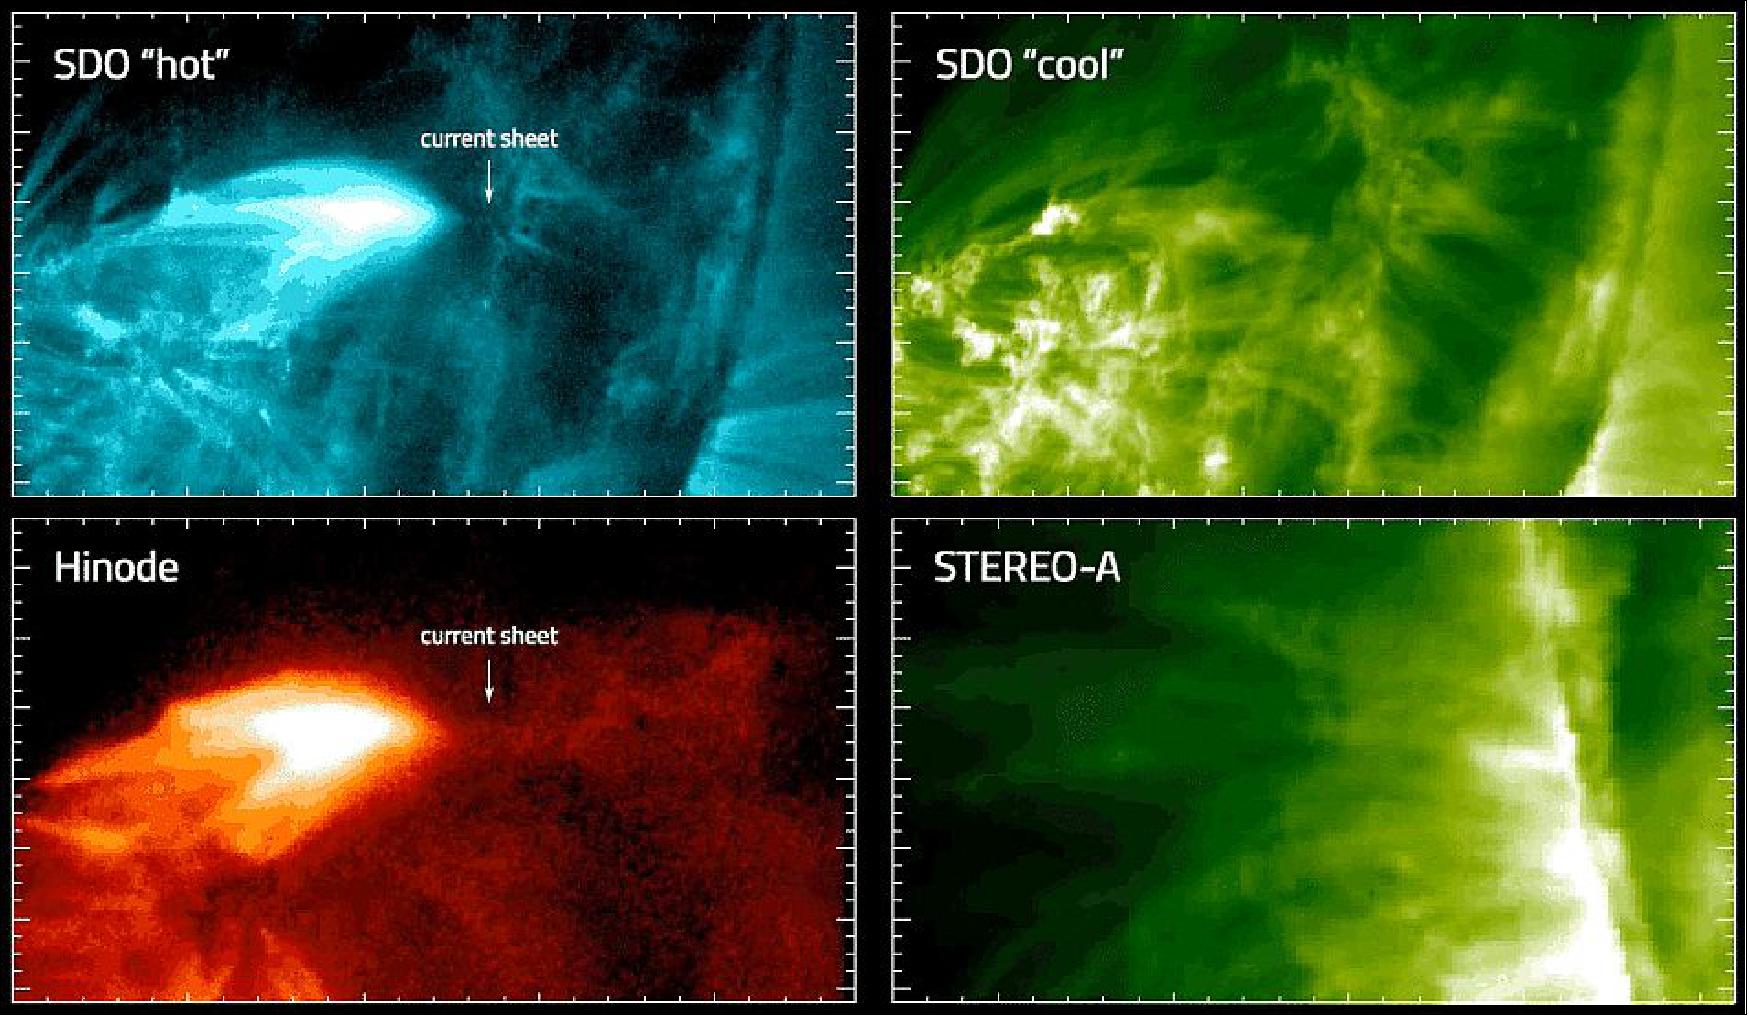
• April 19, 2016: Solar flares are intense bursts of light from the sun. They are created when complicated magnetic fields suddenly and explosively rearrange themselves, converting magnetic energy into light through a process called magnetic reconnection – at least, that’s the theory, because the signatures of this process are hard to detect. But during a December 2013 solar flare, three solar observatories captured the most comprehensive observations of an electromagnetic phenomenon called a current sheet, strengthening the evidence that this understanding of solar flares is correct. 15)
- These eruptions on the sun eject radiation in all directions. The strongest solar flares can impact the ionized part of Earth’s atmosphere – the ionosphere – and interfere with our communications systems, like radio and GPS, and also disrupt onboard satellite electronics. Additionally, high-energy particles – including electrons, protons and heavier ions – are accelerated by solar flares.
- Unlike other space weather events, solar flares travel at the speed of light, meaning we get no warning that they’re coming. So scientists want to pin down the processes that create solar flares – and even some day predict them before our communications can be interrupted.
- “The existence of a current sheet is crucial in all our models of solar flares,” said James McAteer, an astrophysicist at New Mexico State University in Las Cruces and an author of a study on the December 2013 event, published on April 19, 2016, in the Astrophysical Journal Letters. “So these observations make us much more comfortable that our models are good.”
- And better models lead to better forecasting, said Michael Kirk, a space scientist at NASA’s Goddard Space Flight Center in Greenbelt, Maryland, who was not involved in the study. “These complementary observations allowed unprecedented measurements of magnetic reconnection in three dimensions,” Kirk said. “This will help refine how we model and predict the evolution of solar flares."
Looking at Current Sheets:
- A current sheet is a very fast, very flat flow of electrically-charged material, defined in part by its extreme thinness compared to its length and width. Current sheets form when two oppositely-aligned magnetic fields come in close contact, creating very high magnetic pressure. Electric current flowing through this high-pressure area is squeezed, compressing it down to a very fast and thin sheet. It’s a bit like putting your thumb over the opening of a water hose – the water, or, in this case, the electrical current, is forced out of a tiny opening much, much faster. This configuration of magnetic fields is unstable, meaning that the same conditions that create current sheets are also ripe for magnetic reconnection.
- “Magnetic reconnection happens at the interface of oppositely-aligned magnetic fields,” said Chunming Zhu, a space scientist at New Mexico State University and lead author on the study. “The magnetic fields break and reconnect, leading to a transformation of the magnetic energy into heat and light, producing a solar flare.”
- Because current sheets are so closely associated with magnetic reconnection, observing a current sheet in such detail backs up the idea that magnetic reconnection is the force behind solar flares. “You have to be watching at the right time, at the right angle, with the right instruments to see a current sheet,” said McAteer. “It’s hard to get all those ducks in a row.”
- This isn’t the first time scientists have observed a current sheet during a solar flare, but this study is unique in that several measurements of the current sheet – such as speed, temperature, density and size – were observed from more than one angle or derived from more than method.
- The multi-faceted view of the December 2013 flare was made possible by three solar-watching missions: NASA's SDO (Solar Dynamics Observatory) and STEREO (Solar and Terrestrial Relations Observatory) and Hinode (Solar-B), a collaboration between JAXA, NASA, UKSA and ESA.
- Even when scientists think they’ve spotted something that might be a current sheet in solar data, they can’t be certain without ticking off a long list of attributes. Since this current sheet was so well-observed, the team was able to confirm that its temperature, density, and size over the course of the event were consistent with a current sheet.
• Nov. 18, 2015: An international team of researchers, led by Queen's University Belfast (Northern Ireland), has devised a high-precision method of examining magnetic fields in the Sun's atmosphere, representing a significant leap forward in the investigation of solar flares and potentially catastrophic 'space weather'. 16)
- The technique pioneered by the Queen's-led team, published in the journal Nature Physics, will feed into the DKIST (Daniel K Inouye Solar Telescope) project (which will be the largest solar telescope in the world when construction is finished in 2019 on the Pacific island of Maui), as well as allowing greater advance warning of potentially devastating space storms. The new technique allows changes in the Sun's magnetic fields, which drive the initiation of solar flares, to be monitored up to ten times faster than previous methods. 17)
- The Queen's-led team, who span universities in Europe, the Asia-Pacific region and the USA, harnessed data from both NASA's premier space-based telescope, SDO (Solar Dynamics Observatory), and the ROSA (Rapid Oscillations in the Solar Atmosphere) multi-camera system (ground-based), which was designed at Queen's University Belfast, using detectors made by Northern Ireland company Andor Technology.
- Lead researcher David Jess from Queen’s Astrophysics Research Center said: “Continual outbursts from our Sun, in the form of solar flares and associated space weather, represent the potentially destructive nature of our nearest star. Our new techniques demonstrate a novel way of probing the Sun’s outermost magnetic fields, providing scientists worldwide with a new approach to examine, and ultimately understand, the precursors responsible for destructive space weather.
Specific research results include:
1) The datasets used provided unprecedented images of all layers of the Sun’s tenuous atmosphere, allowing the team to piece the jigsaw puzzle together of how magnetic fields permeate the dynamic atmosphere. Images captured by NASA’s SDO and STEREO spacecrafts provided million-degree vantage points of how these magnetic fields stretch far out into the Sun’s corona (the region of the Sun’s atmosphere visible during total solar eclipses).
2) Waves propagated along magnetic fields, similar to how sound waves travel through the air on Earth. The speed at which these waves can travel is governed by the characteristics of the Sun’s atmosphere, including its temperature and the strength of its magnetic field. The waves were found to propagate with speeds approaching half a million (500,000) mph, and when coupled with temperatures of around 1,000,000 degrees in the Sun’s outer atmosphere, the researchers were able to determine the magnetic field strengths to a high degree of precision.
3) The strength of the magnetic fields decreases by a factor of 100 as they travel from the surface of the Sun out into the tenuous, hot corona. While the magnetic fields have decreased in strength, they still possess immense energy that can twist and shear, ultimately releasing huge blasts towards Earth in the form of solar flares. The team’s methods provide a much faster way of examining magnetic field changes in the lead up to solar flares, which can ultimately be used to provide advanced warning against such violent space weather.
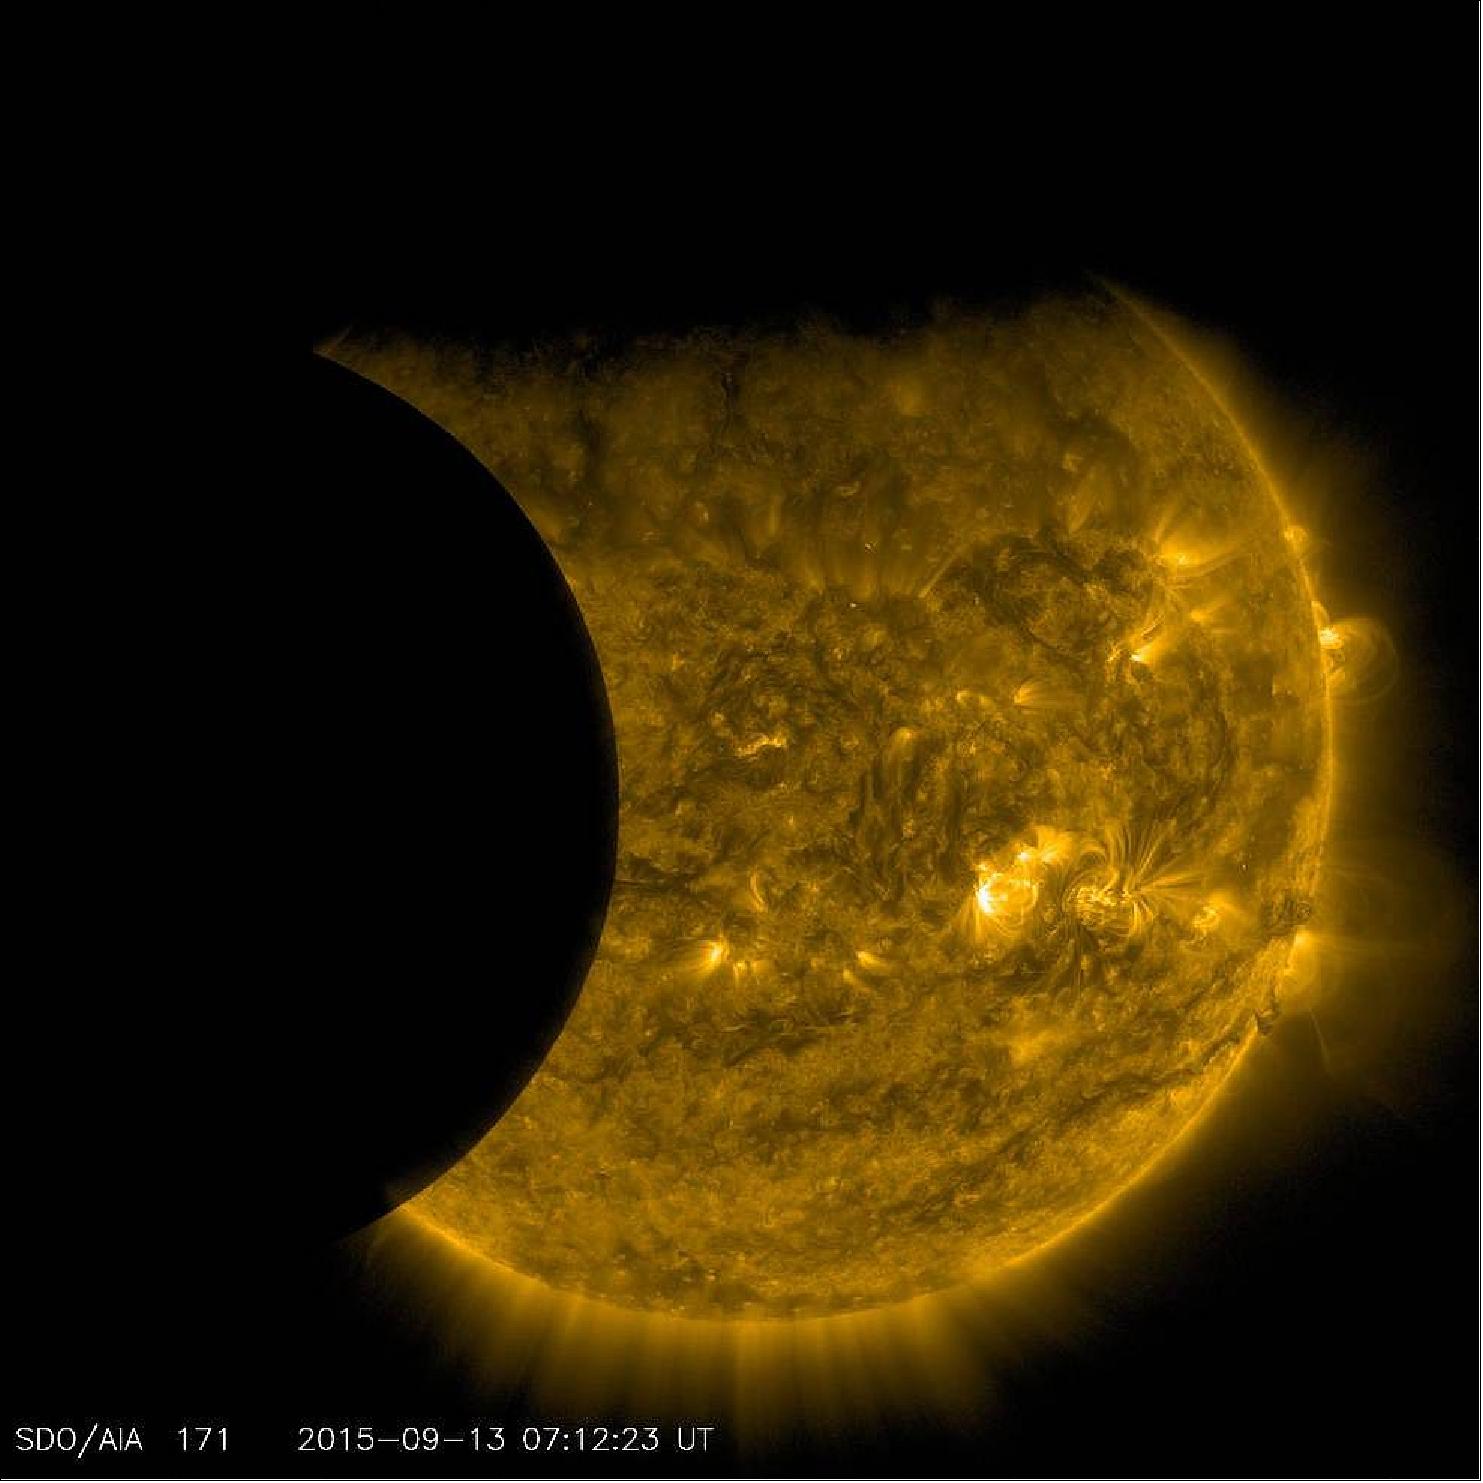
• On Sept. 13, 2015, as NASA’s SDO kept up its constant watch on the sun, its view was photobombed not once, but twice (Figure 18). Just as the moon came into SDO’s field of view on a path to cross the sun, Earth entered the picture, blocking SDO’s view completely. When SDO's view of the sun emerged from Earth’s shadow, the moon was just completing its journey across the sun’s face. 18)
- Though SDO sees dozens of Earth eclipses and several lunar transits each year, this is the first time ever that the two have coincided. This alignment of the sun, moon and Earth also resulted in a partial solar eclipse on Sept. 13, visible only from parts of Africa and Antarctica.
- SDO’s orbit usually gives us unobstructed views of the sun, but Earth’s revolution around the sun means that SDO’s orbit passes behind Earth twice each year, for two to three weeks at a time. During these phases, Earth blocks SDO’s view of the sun for anywhere from a few minutes to over an hour once each day.
• August 31, 2015: As navigators know, Earth's magnetic axis is tilted with respect to its rotation axis. Such misalignment had not been expected in the Sun — but now it's been seen. NASA's SDO (Solar Dynamics Observatory) has been trained on the Sun for half of the current 11-year cycle of solar activity. Using SDO's HMI (Helioseismic and Magnetic Imager), Adur Pastor Yabar of the Institute of Astrophysics of the Canary Islands and his colleagues created daily maps of the line-of-sight strength and polarity of the Sun's magnetic field for each of the mission's first 1700 days. The Sun's rotation period varies with latitude. It's 25.5 days at the equator and 34.4 days at the poles. 19) 20)
- To look for variations not associated with differential rotation, Pastor Yabar and his colleagues averaged each map over all longitudes in 1º-wide latitudinal belts. When the researchers Fourier-transformed the entire sequence of binned maps, they discovered that a more-or-less monthly oscillation showed up at every latitude on every day. Random sprouting of active regions that rotate in and out of view could conceivably account for the oscillation, but when the researchers excluded active regions, the oscillation persisted. Their latitudinal belts did not sample the same parts of the Sun, as they had assumed, but wobbled up and down over the solar disk—hence the oscillation. Based on that and other lines of evidence, Pastor Yabar and his colleagues concluded that the Sun’s magnetic and rotational axes must be misaligned. Dynamo models that presume alignment will require modification.
• July 2015: The SDO (Solar Dynamics Observatory) mission is approved by NASA for its first extended mission. NASA will work with the mission to address the findings that were raised by the Senior Review panel, to allow the mission to continue its successful operations. The SDO mission will be invited to the 2017 Heliophysics Senior Review. 21)
• June 2015: The SDO instruments provide a combination of imaging and spectral data that sample the Sun from its interior to the outer corona. These instruments provide a cadence and uniform quality of data that well characterize the photospheric magnetic fields (both longitudinal and vector), represent the thermal structure in the chromosphere and corona, allow the probing of different depths in the solar convection zone and summarize the broad UV spectral irradiance changes due to both long-term and very short-term solar activity variation. High data quality and uniformity combined with physically-appropriate time cadence and full disk coverage make the SDO data indispensable for studies of large-scale connectivity in the solar atmosphere. The general availability of many SDO data products with minimal latency allows for complementary usage in the context of space weather situational awareness and forecasting efforts. Some SDO data will also be used to develop important synergy between solar and stellar astrophysics. The science impact from this complex mission has been major. Recent science results cited from the SDO prime mission phase include breakthroughs in coronal seismology, developing a better understanding of evolution of magnetic fields in solar upper atmosphere decoding the importance of helicity and global connectivity to the eruption of magnetic systems, and establishing the hierarchy of organized flows in the convection zone. 22)
- SDO spacecraft / instrument health and status: With one exception, all instruments are in a good health and expected continue taking a good quality of data. EVE/MEGS-A has failed, and there are no expectations for this instrument to provide further solar irradiance data in the 5–38 nm band. HMI (Helioseismic Magnetic Imager) reboots of the flight software and anomalous upsets have not affected the science data significantly due to their low occurrence rate. All SDO spacecraft subsystems are operating nominally with two exceptions, neither of which interferes with SDO’s ability to continue normal operations for at least five more years.
- SDO is a valuable asset to the HSO (Heliophysics System Observatory). It provides a breadth of observational information that will enable cutting-edge investigations; the data are presently used by many NASA Heliophysics missions, as well as for near-real-time space-weather forecasting by US and international agencies.
• May 6, 2015: The sun emitted a significant solar flare, an X2.7 class flare, peaking at 22:11 UTC on May 5, 2015. NASA’s SDO (Solar Dynamics Observatory), which watches the sun constantly, captured an image of the event. This flare was also accompanied by a coronal mass ejection that blasted a mass of plasma into space. Both are triggered by disruptions of areas of intense magnetic fields. Solar flares are powerful bursts of radiation. Harmful radiation from a flare cannot pass through Earth's atmosphere to physically affect humans on the ground, however — when intense enough — they can disturb the atmosphere in the layer where GPS and communications signals travel. 23)
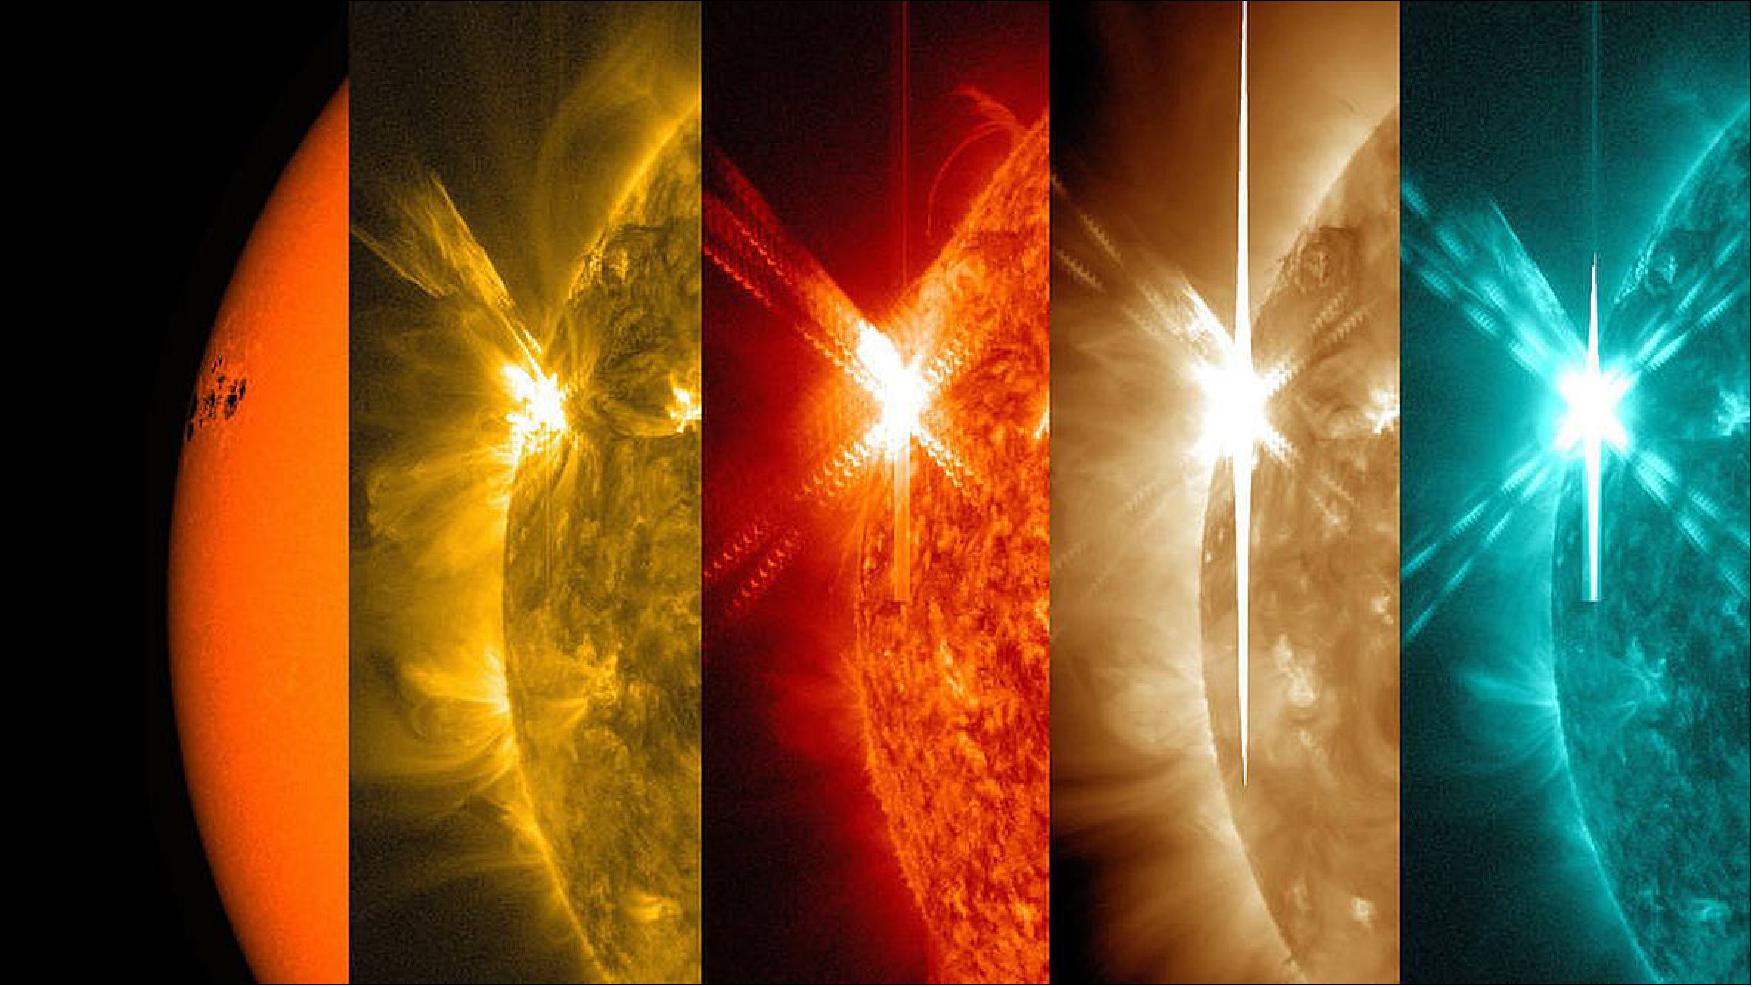
Legend to Figure 19: Each image shows a different wavelength of extreme ultraviolet light that highlights a different temperature of material on the sun. By comparing different images, scientists can better understand the movement of solar matter and energy during a flare. From left to right, the wavelengths are: visible light, 171 Å, 304 Å, 193 Å and 131 Å. Each wavelength has been colorized.
• In early May 2015, the SDO mission is providing 5 years of science data to the scientists and the public. The project has been watching Solar Cycle 24 rise to solar maximum, storing about 7 PByte of data, releasing almost 200 million images, and having about 1900 scientific papers published. 24)
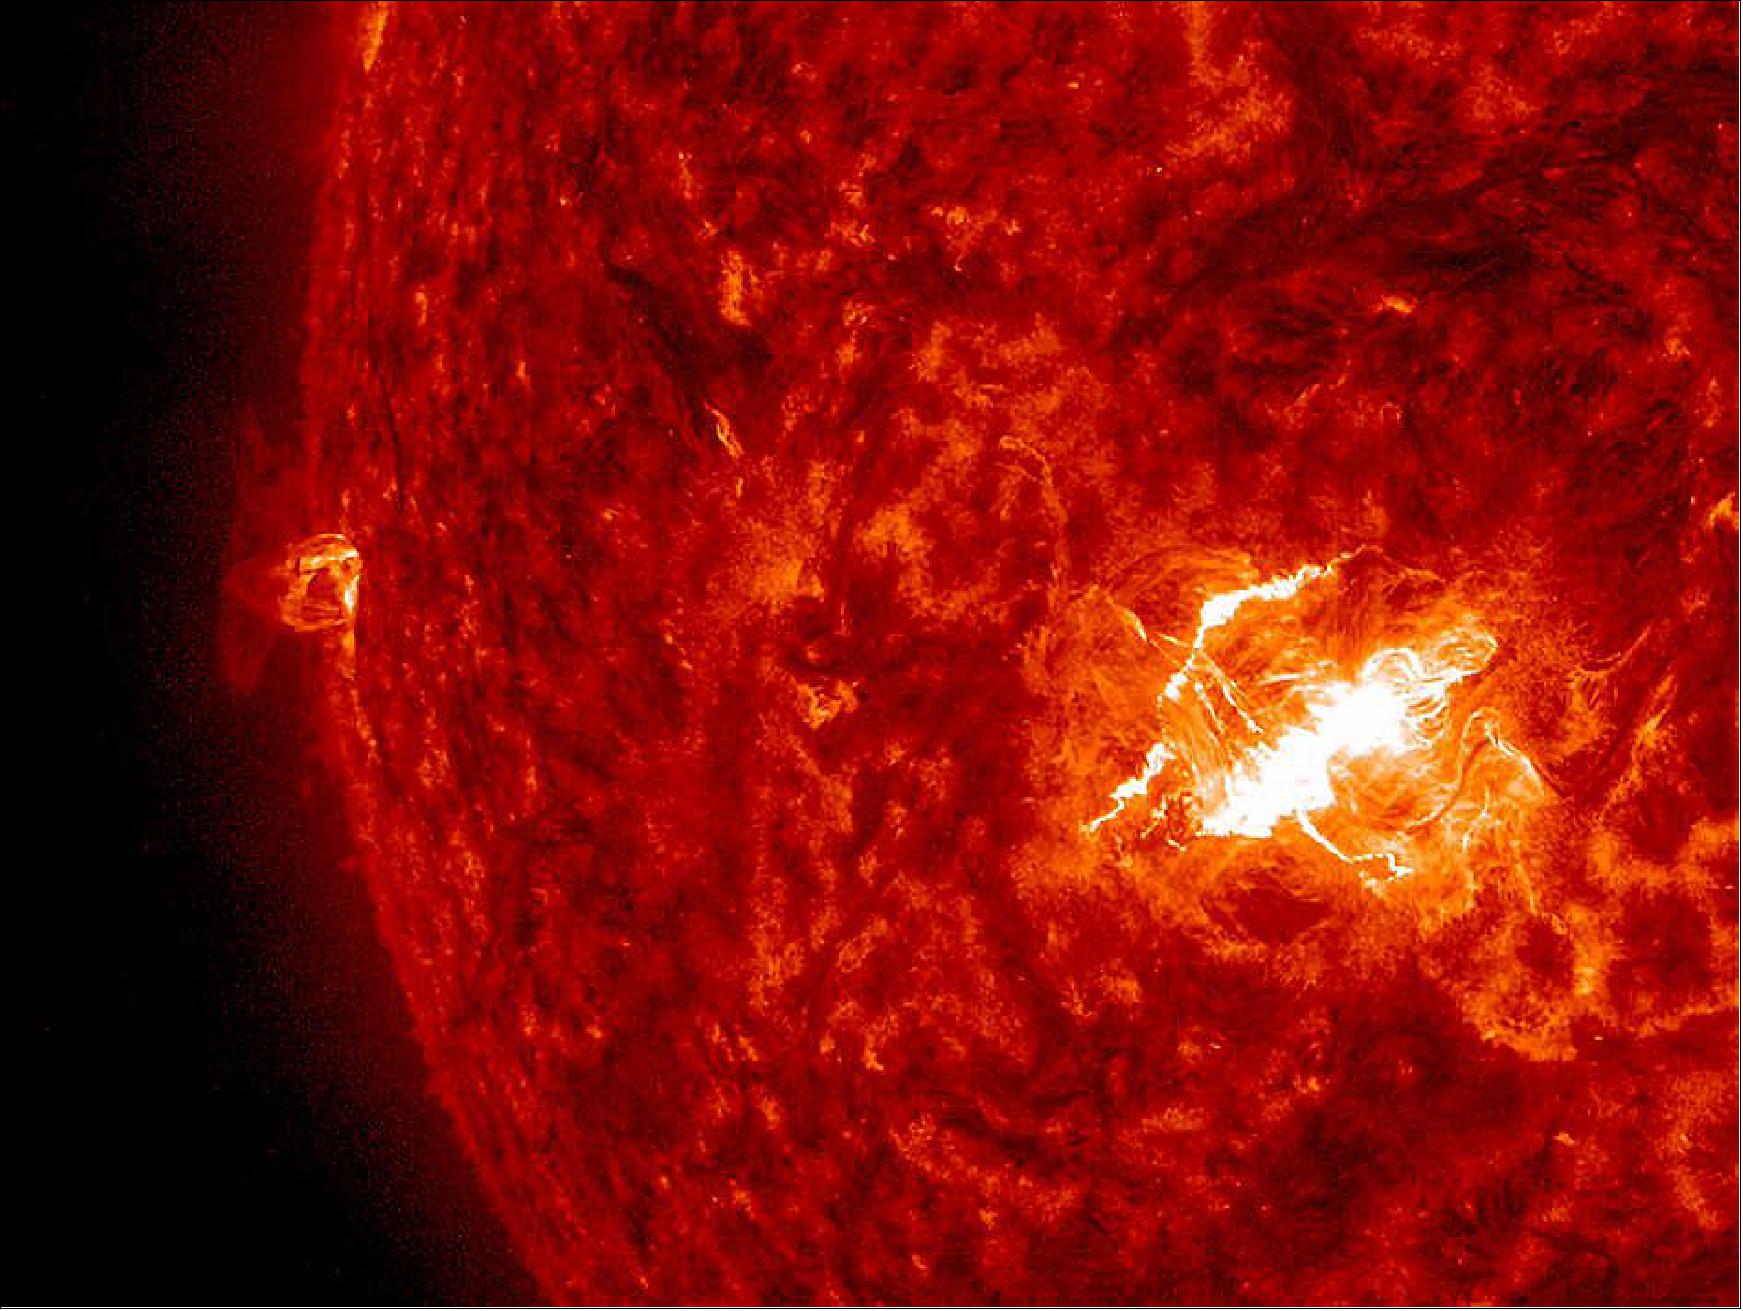
• On March 11, 2015, an X2-class fare erupted. The bright flash of the flare was followed by streams of dark ejecta that move across the sun to the left. The flare did cause some radio blackouts on Earth when it disturbed our ionosphere. The flare was also associated with a coronal mass ejection. The images were taken in extreme ultraviolet light. 25)
• February 11, 2015 marked the 5th anniversary of SDO on orbit. The mission is providing very detailed images of the Earth-facing side of the sun 24 hours a day. NASA released two videos on this occasion (links in Ref. 26) showcasing highlights from the last five years of sun watching. The first is a time lapse of the past five years. Different colors represent different wavelengths of extreme ultraviolet light, ultraviolet light, and visible light, which in turn correspond to solar material at different temperatures. Additionally SDO returns solar magnetic field data that helps scientists study solar activity. 26)
- The second video showcases highlights from the last five years. Watch the movie to see giant clouds of solar material hurled out into space, the dance of giant loops hovering in the corona, and huge sunspots growing and shrinking on the sun's surface.
The imagery in both videos is an example of the kind of data that SDO provides to scientists. By watching the sun in different wavelengths – and therefore different temperatures – scientists can watch how material courses through the corona, which holds clues to what causes eruptions on the sun, what heats the sun's atmosphere up to 1,000 times hotter than its surface, and why the sun's magnetic fields are constantly on the move. SDO also measures fluctuations in the sun’s extreme ultraviolet output, which provides the majority of energy for heating Earth’s upper atmosphere.
- Five years into its mission, SDO continues to send back tantalizing imagery to incite scientists' curiosity. For example, in late 2014, SDO captured imagery of the largest sun spots seen since 1995 as well as a torrent of intense solar flares. Solar flares are bursts of light, energy and X-rays. They can occur by themselves or can be accompanied by what's called a coronal mass ejection, or CME, in which a giant cloud of solar material erupts off the sun, achieves escape velocity and heads off into space. In this case, the sun produced only flares and no CMEs, which, while not unheard of, is somewhat unusual for flares of that size. Scientists are looking at that data now to see if they can determine what circumstances might have led to flares eruptions alone.
• On January 19, 2015, the AIA (Atmospheric Imaging Assembly) instrument on SDO captured its 100 millionth image of the sun. AIA uses four telescopes working in parallel to gather eight images of the sun – cycling through 10 different wavelengths — every 12 seconds. The SDO downloads ~1.5 TB of data per day. AIA is responsible for about half of that. Every day it provides 57,600 detailed images of the sun that show the dance of how solar material sways and sometimes erupts in the solar atmosphere, the corona. 27)
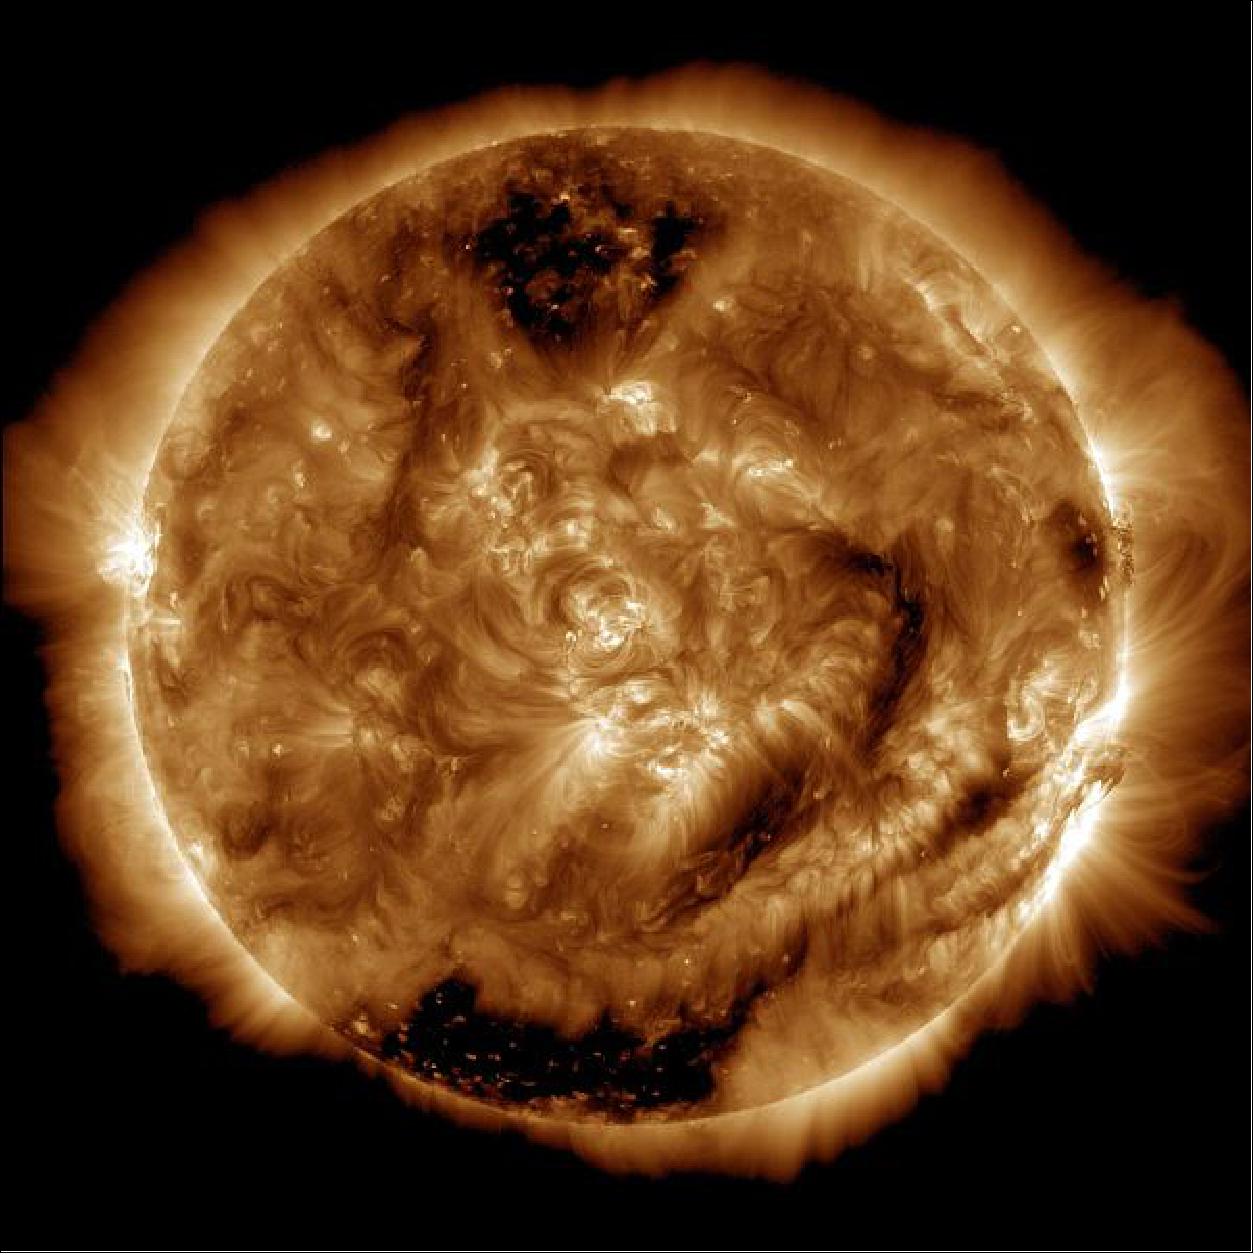
Legend to Figure 21: The dark areas at the bottom and the top of the image are coronal holes — areas of less dense gas, where solar material has flowed away from the sun.
• June 10, 2014: The sun emitted a significant solar flare, peaking at 11:42 UTC on June 10, 2014 (X 2.2 flare). NASA's SDO (Solar Dynamics Observatory) – which typically observes the entire sun 24 hours a day - captured images of the flare. The sun released a second X-class flare (X 1.5), peaking at 12:52 UTC. 28) On June 11, 2014, the active region (AR2087) blazed again with a third flare at 9:05 UTC (X 1.0 class flare).
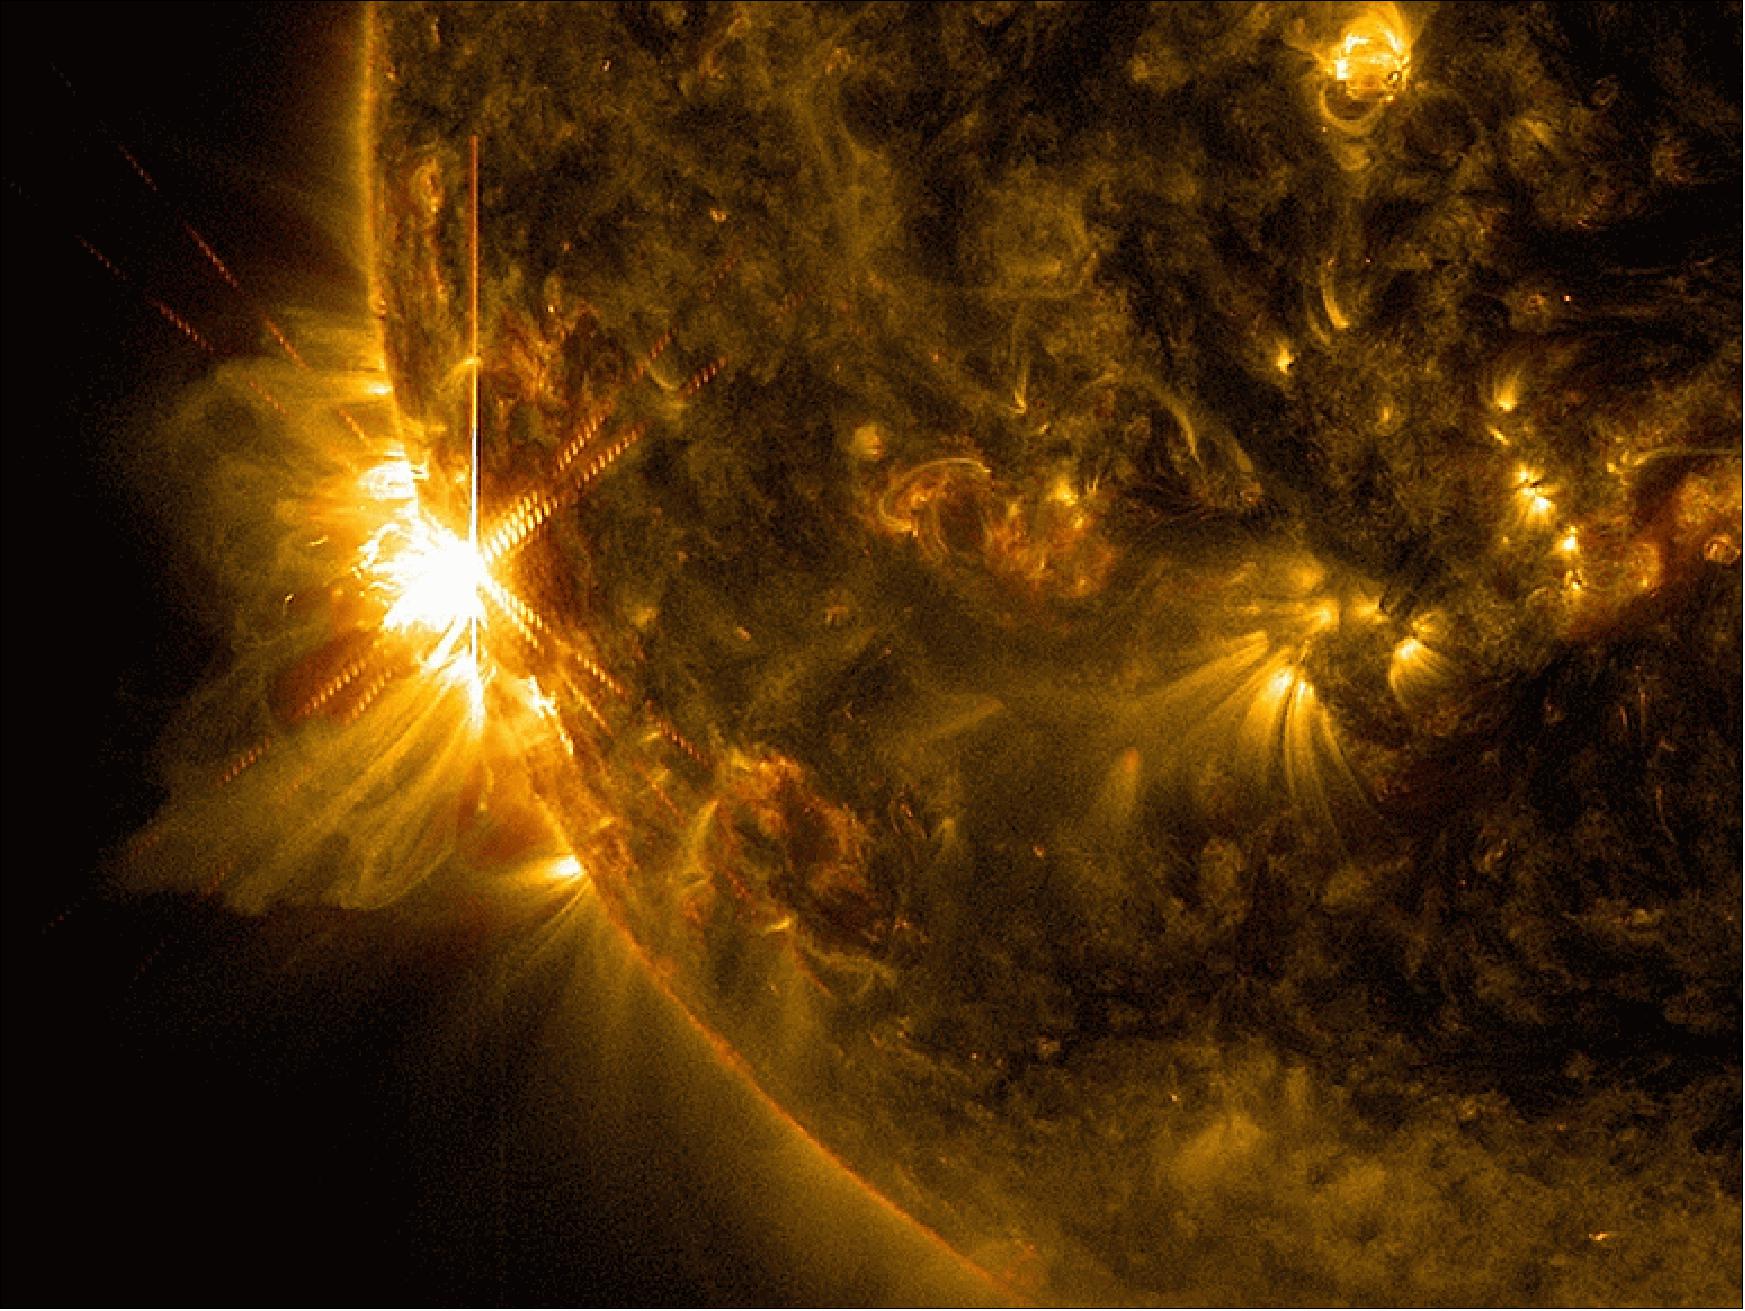
• April 2014: New research that uses data from SDO, to track bright points in the solar atmosphere and magnetic signatures on the sun's surface, offers a way to probe the star's depths faster than ever before. The technique opens the door for near real-time mapping of the sun's roiling interior – movement that affects a wide range of events on the sun from its 22-year sunspot cycle to its frequent bursts of X-ray radiation called solar flares. 29) 30)
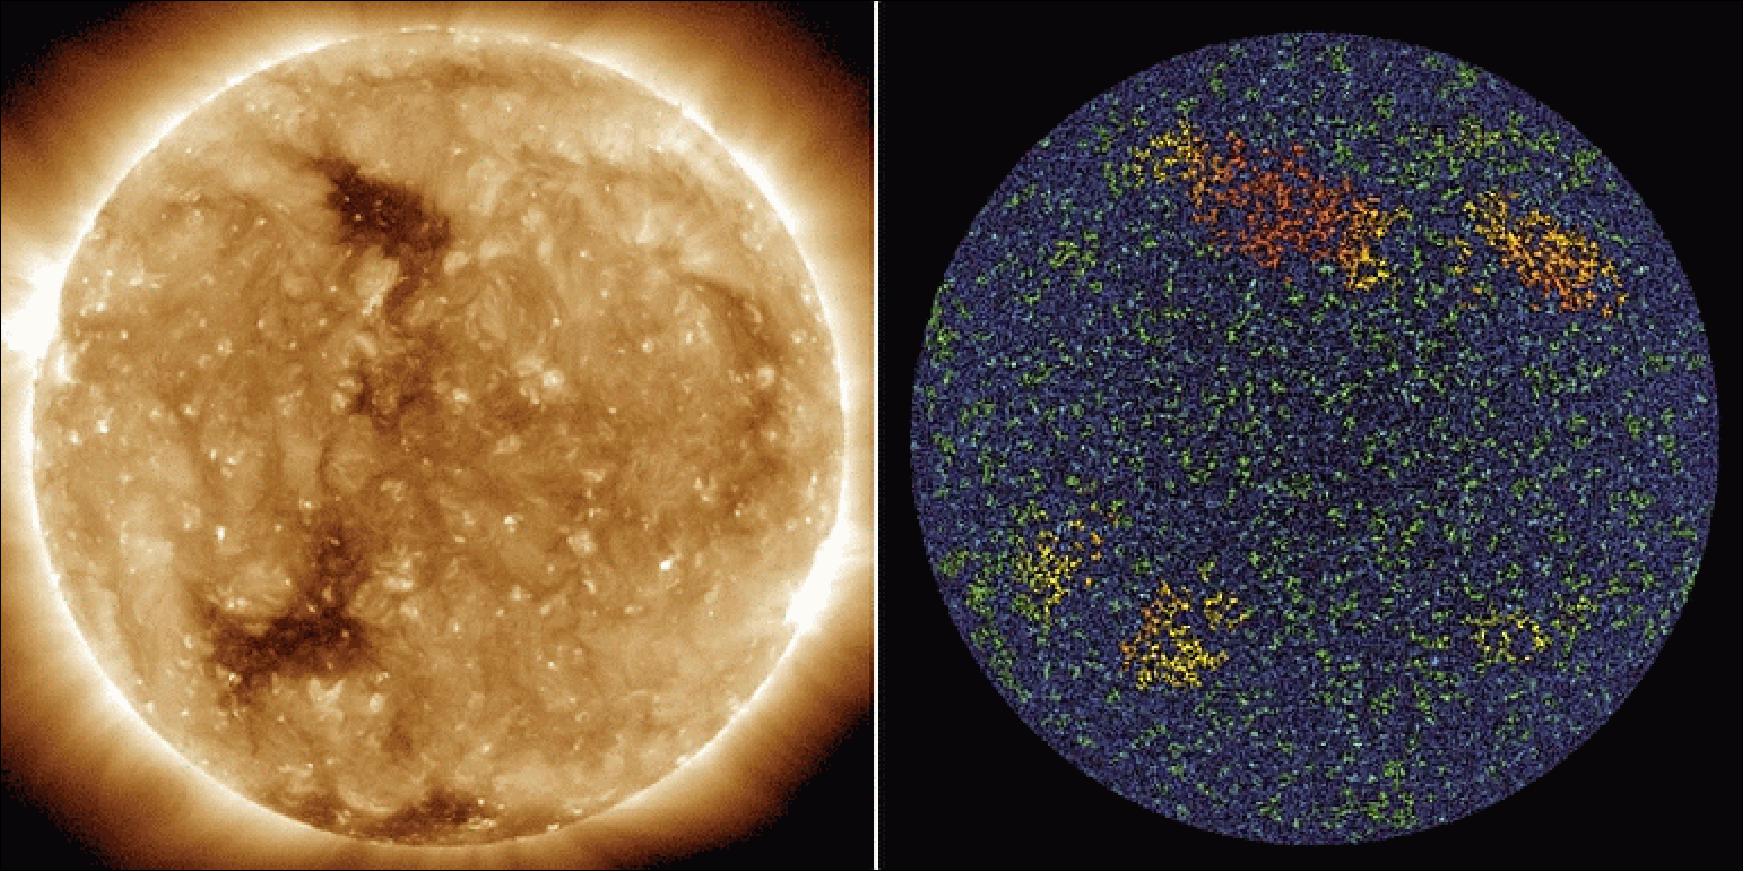
- One of the most common ways to probe the sun's interior is through a technique called helioseismology in which scientists track the time it takes for waves – not unlike seismic waves on Earth — to travel from one side of the sun to the other. From helioseismology solar scientists have some sense of what's happening inside the sun, which they believe to be made up of granules and super-granules of moving solar material. The material is constantly overturning like boiling water in a pot, but on a much grander scale: A granule is approximately the distance from Los Angeles to New York City; a super-granule is about twice the diameter of Earth.
- Instead of tracking seismic waves, the new research probes the solar interior using the HMI (Helioseismic Magnetic Imager) on SDO, which can map the dynamic magnetic fields that thread through and around the sun. Since 2010, Scott McIntosh has tracked the size of different magnetically-balanced areas on the sun, that is, areas where there are an even number of magnetic fields pointing down in toward the sun as pointing out. Think of it like looking down at a city from above with a technology that observed people, but not walls, and recording areas that have an even number of men and women. Even without seeing the buildings, you'd naturally get a sense for the size of rooms, houses, buildings, and whole city blocks – the structures in which people naturally group.
- The team found that the magnetic parcels they mapped corresponded to the size of granules and supergranules, but they also spotted areas much larger than those previously noted — about the diameter of Jupiter. It's as if when searching for those pairs of men and women, one suddenly realized that the city itself and the sprawling suburbs was another scale worth paying attention to. The scientists believe these areas correlate to even larger cells of flowing material inside the sun.
- The researchers also looked at these regions in SDO imagery of the sun's atmosphere, the corona, using the AIA (Atmospheric Imaging Assembly) instrument. They noticed that ubiquitous spots of extreme ultraviolet and X-ray light, known as brightpoints, prefer to hover around the vertices of these large areas, dubbed g-nodes.
- By opening up a way to peer inside the sun quickly, these techniques could provide a straightforward way to map the sun's interior and perhaps even improve our ability to forecast changes in magnetic fields that can lead to solar eruptions.
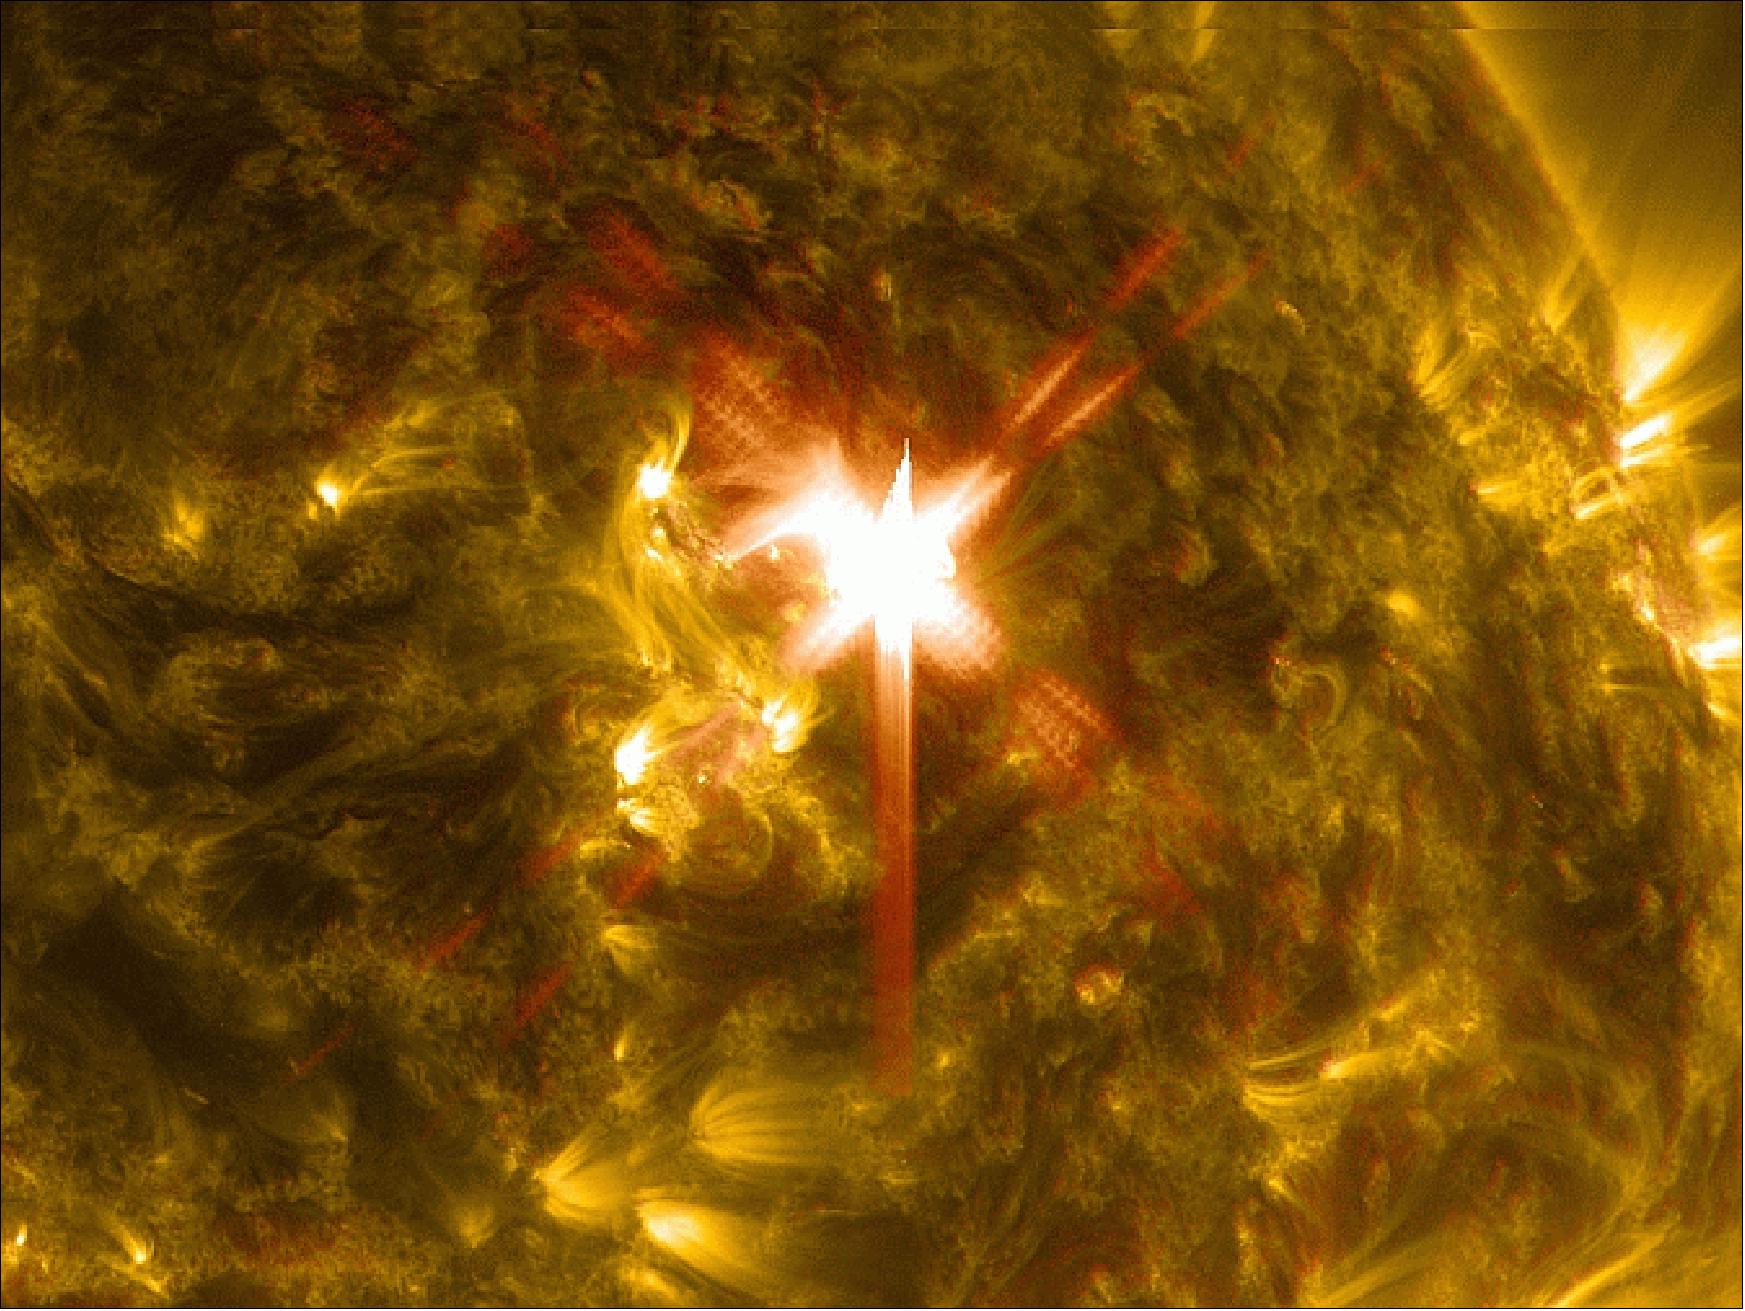
• On March 29, 2014, an X-class flare (CME) erupted from the right side of the sun... and vaulted into history as the best-observed flare of all time. The flare was witnessed by four different NASA spacecraft and one ground-based observatory — three of which had been fortuitously focused in on the correct spot as programmed into their viewing schedule a full day in advance. 31) 32)
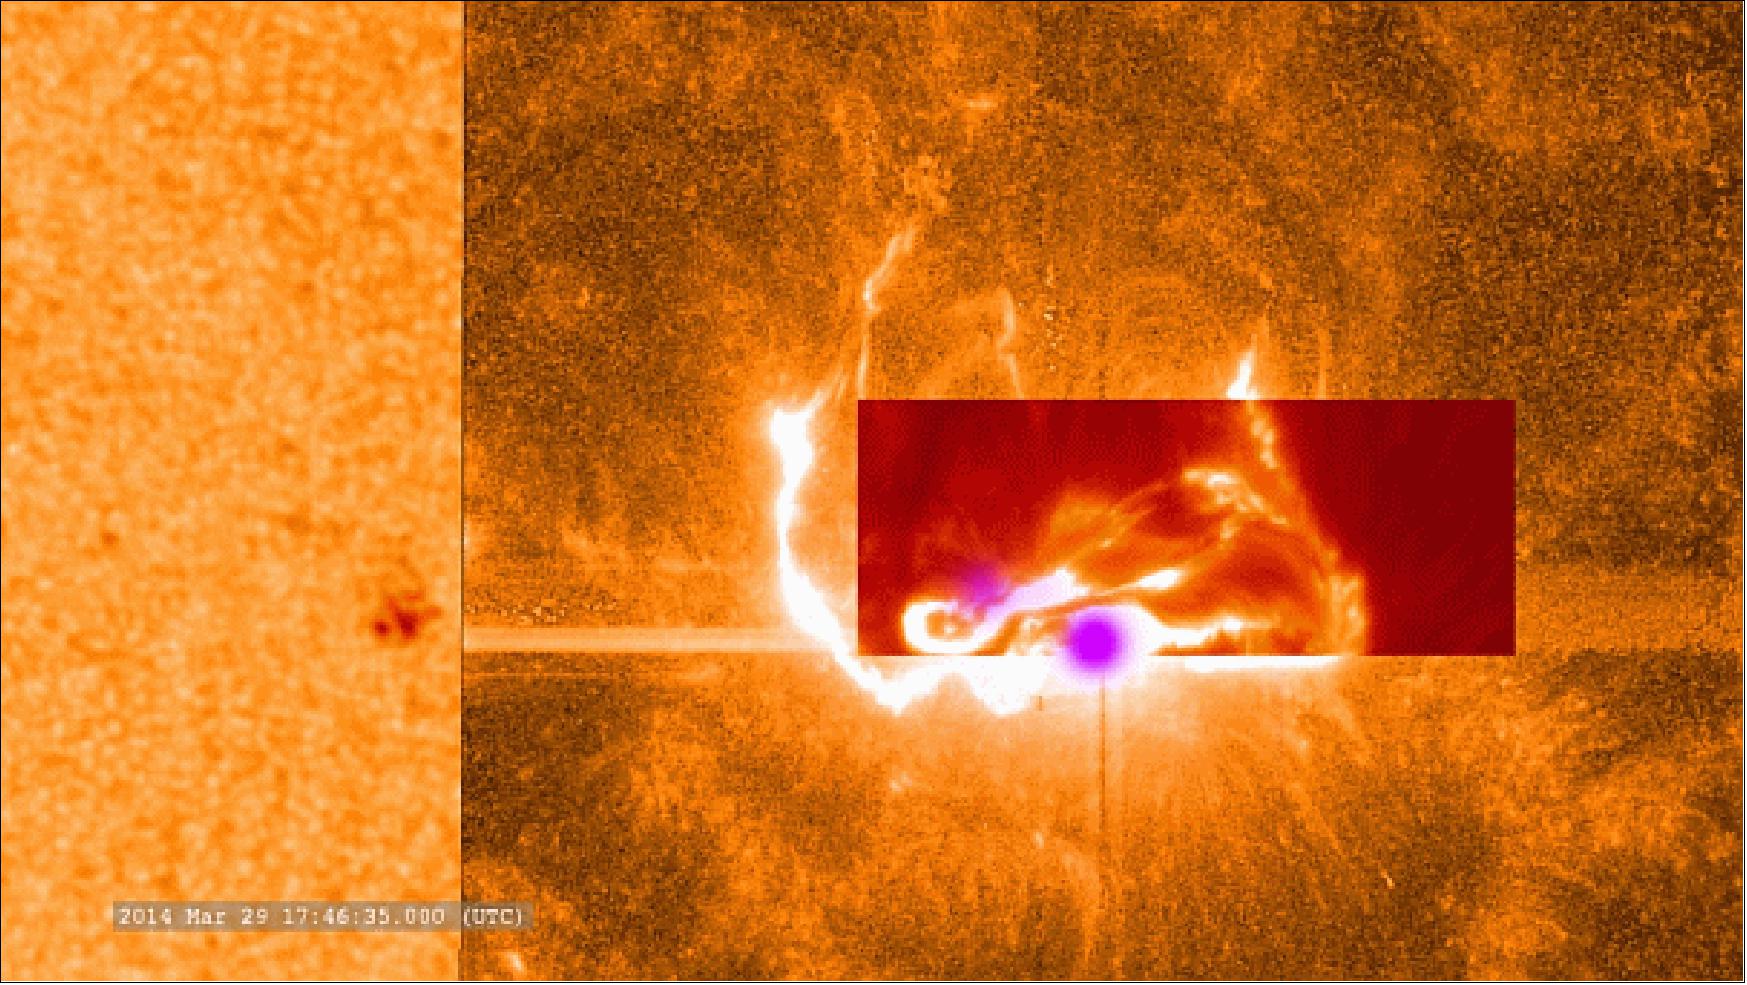
The telescopes involved were:
- NASA's IRIS (Interface Region Imaging Spectrograph)
- NASA's SDO (Solar Dynamics Observatory)
- NASA's RHESSI (Reuven Ramaty High Energy Solar Spectroscopic Imager)
- JAXA's Solar-B/Hinode Observatory
- National Solar Observatory's Dunn Solar Telescope located at Sacramento Peak in New Mexico.
Numerous other spacecraft provided additional data about what was happening on the sun during the event and what the effects were at Earth.
- NASA's STEREO mission and the SOHO mission of ESA and NASA both watched the great cloud of solar material that erupted off the sun with the flare.
- NOAA's GOES satellite tracked X-rays from the flare, and other spacecraft measured the effects of the flare as it came toward Earth.
This event was particularly exciting for the IRIS team, as this was the first X-class flare ever observed by IRIS (launched on June 28, 2013). IRIS provided scientists with the first detailed view of what happens in this region during a flare.
• On January 30, 2014, the SDO got its own private solar eclipse showing from its geosynchronous orbital perch. Twice a year during new phase, the moon glides in front of the sun from the observatory’s perspective. The events are called lunar transits rather than eclipses since they’re seen from outer space. Transits typically last about a half hour, but at 2.5 hours, today’s was one of the longest ever recorded. The next one occurs on July 26, 2014. 33)
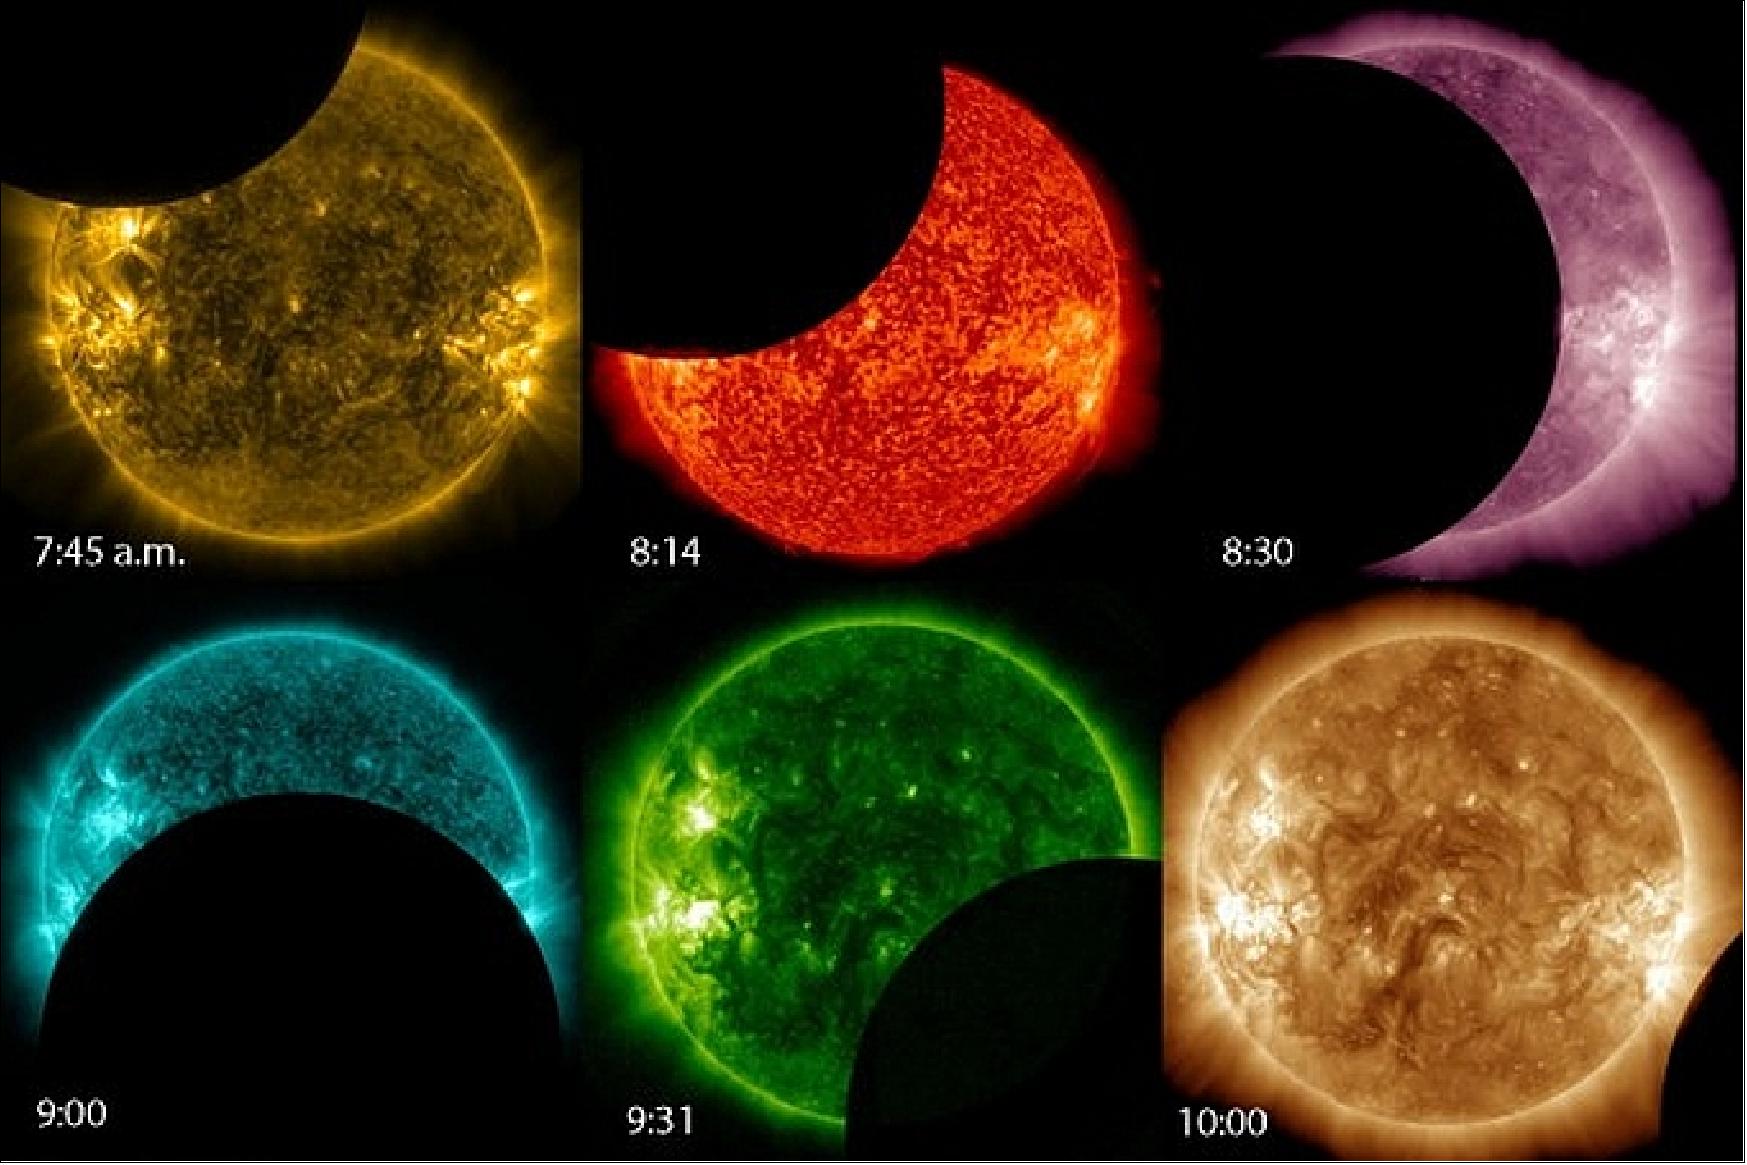
Legend to Figure 27: The times of each photo are given in CST (Central Standard Time). In the last frame, the moon is silhouetted against the solar corona. At maximum about 90% of the sun was covered.
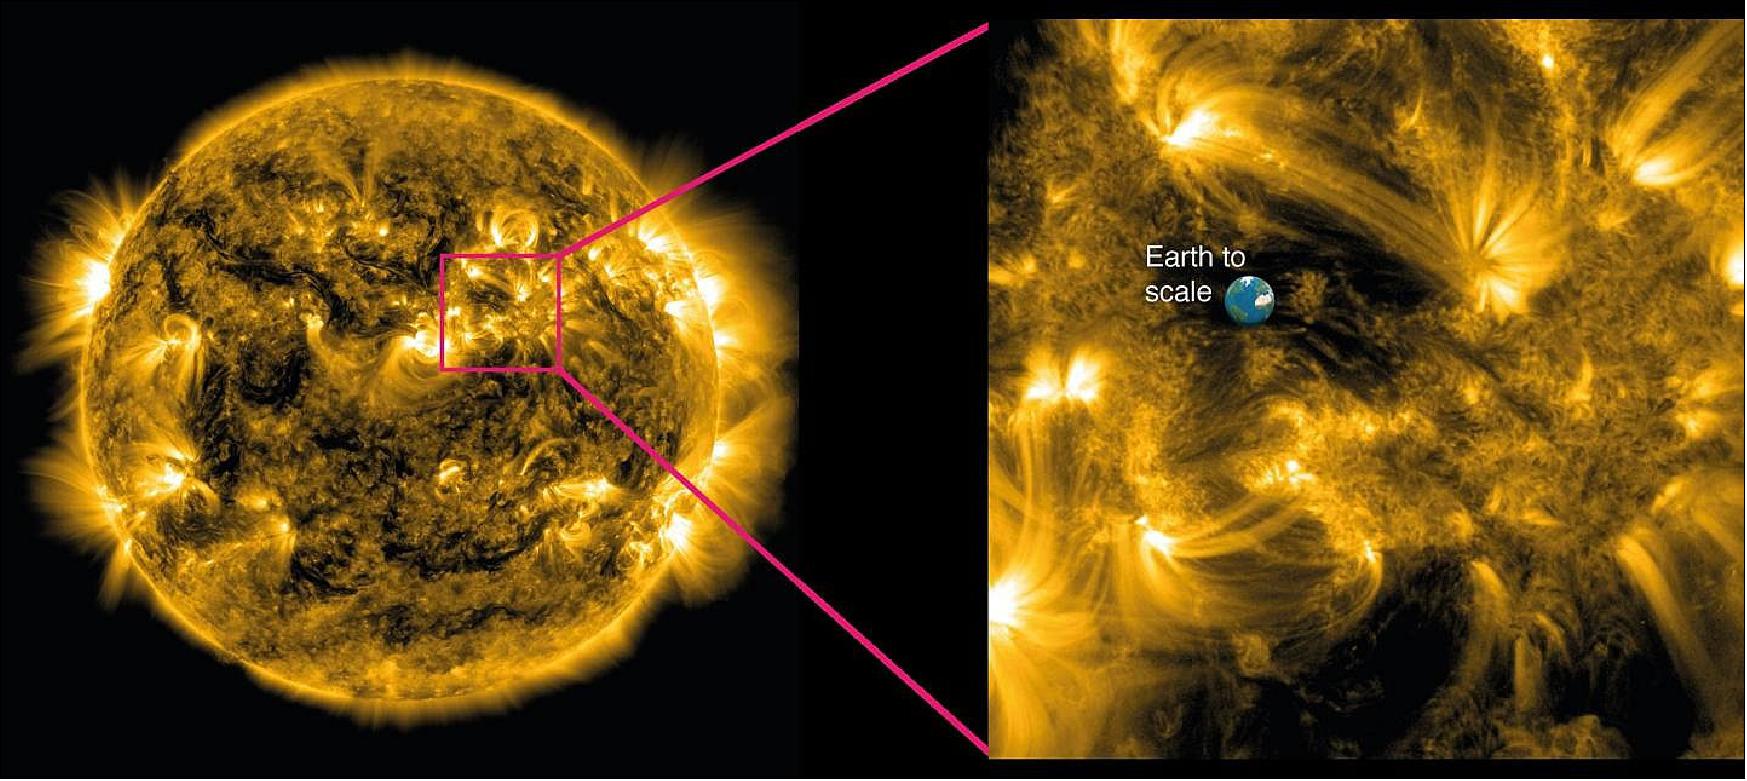
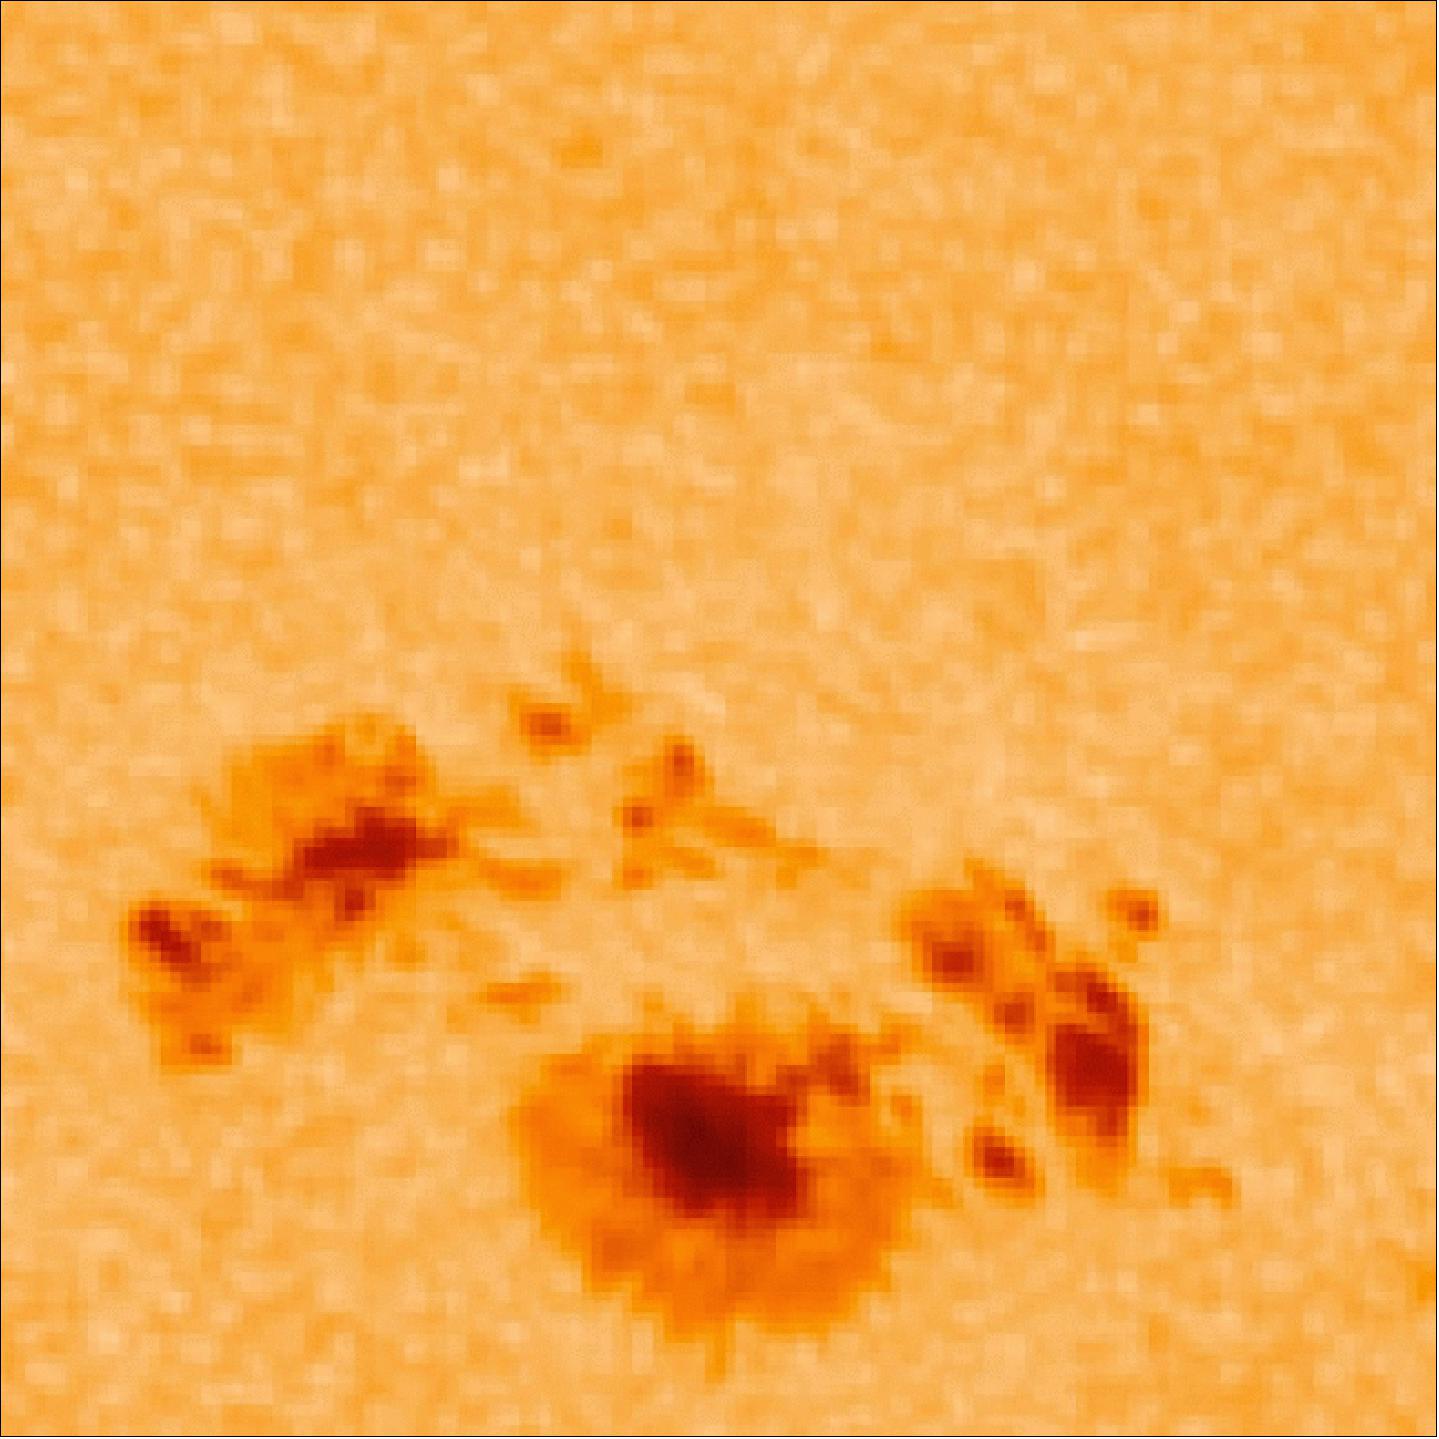
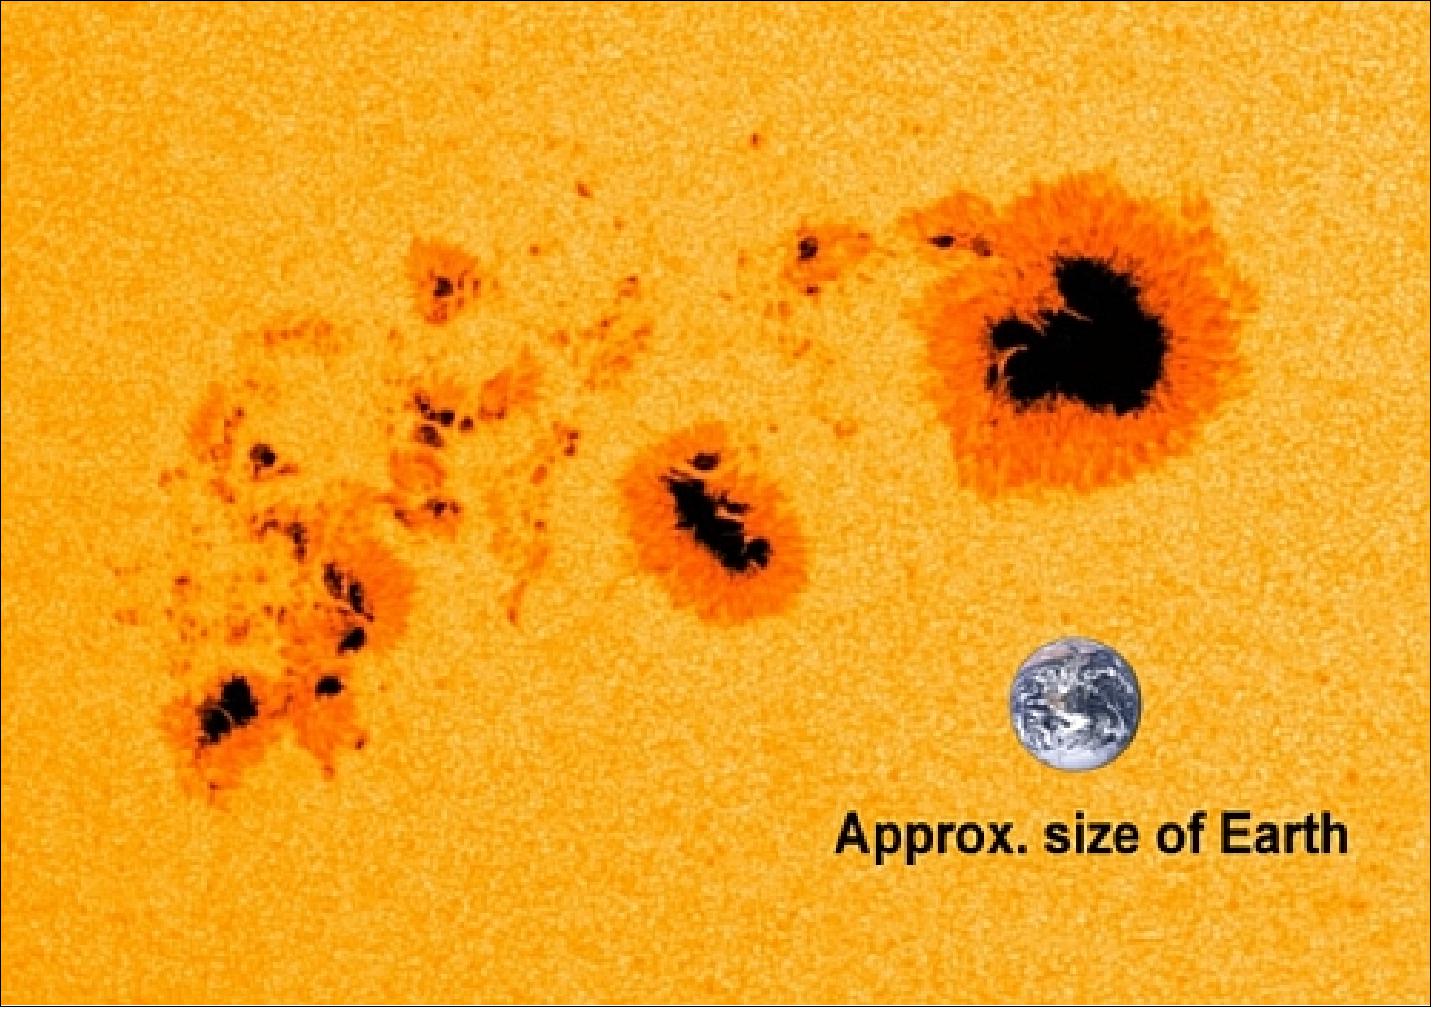
• January 07, 2014: An enormous sunspot, labeled AR1944 (Active Region 1944), slipped into view over the sun's left horizon late on Jan. 1, 2014. The sunspot steadily moved toward the right, along with the rotation of the sun, and now sits almost dead center, as seen in the image (Figure 28) from NASA's Solar Dynamics Observatory.
Sunspots are dark areas on the sun's surface that contain complex arrangements of strong magnetic fields that are constantly shifting. The largest dark spot in this configuration is approximately two Earths wide, and the entire sunspot group is some seven Earths across. 34)
Sunspots are part of what's known as active regions, which also include regions of the sun's atmosphere, the corona, hovering above the sunspots. Active regions can be the source of some of the sun's great explosions: solar flares that send out giant bursts of light and radiation due to the release of magnetic energy, or coronal mass ejections that send huge clouds of solar material out into space. As the sunspot group continues its journey across the face of the sun, scientists will watch how it changes and evolves to learn more about how these convoluted magnetic fields can cause space weather events that can affect spaceborne systems and technological infrastructure on Earth.
- On January 7, 2014 (18:18:34 UTC), as the giant AR1944 sunspot turned toward Earth, it erupted with a powerful X1.2-class flare.
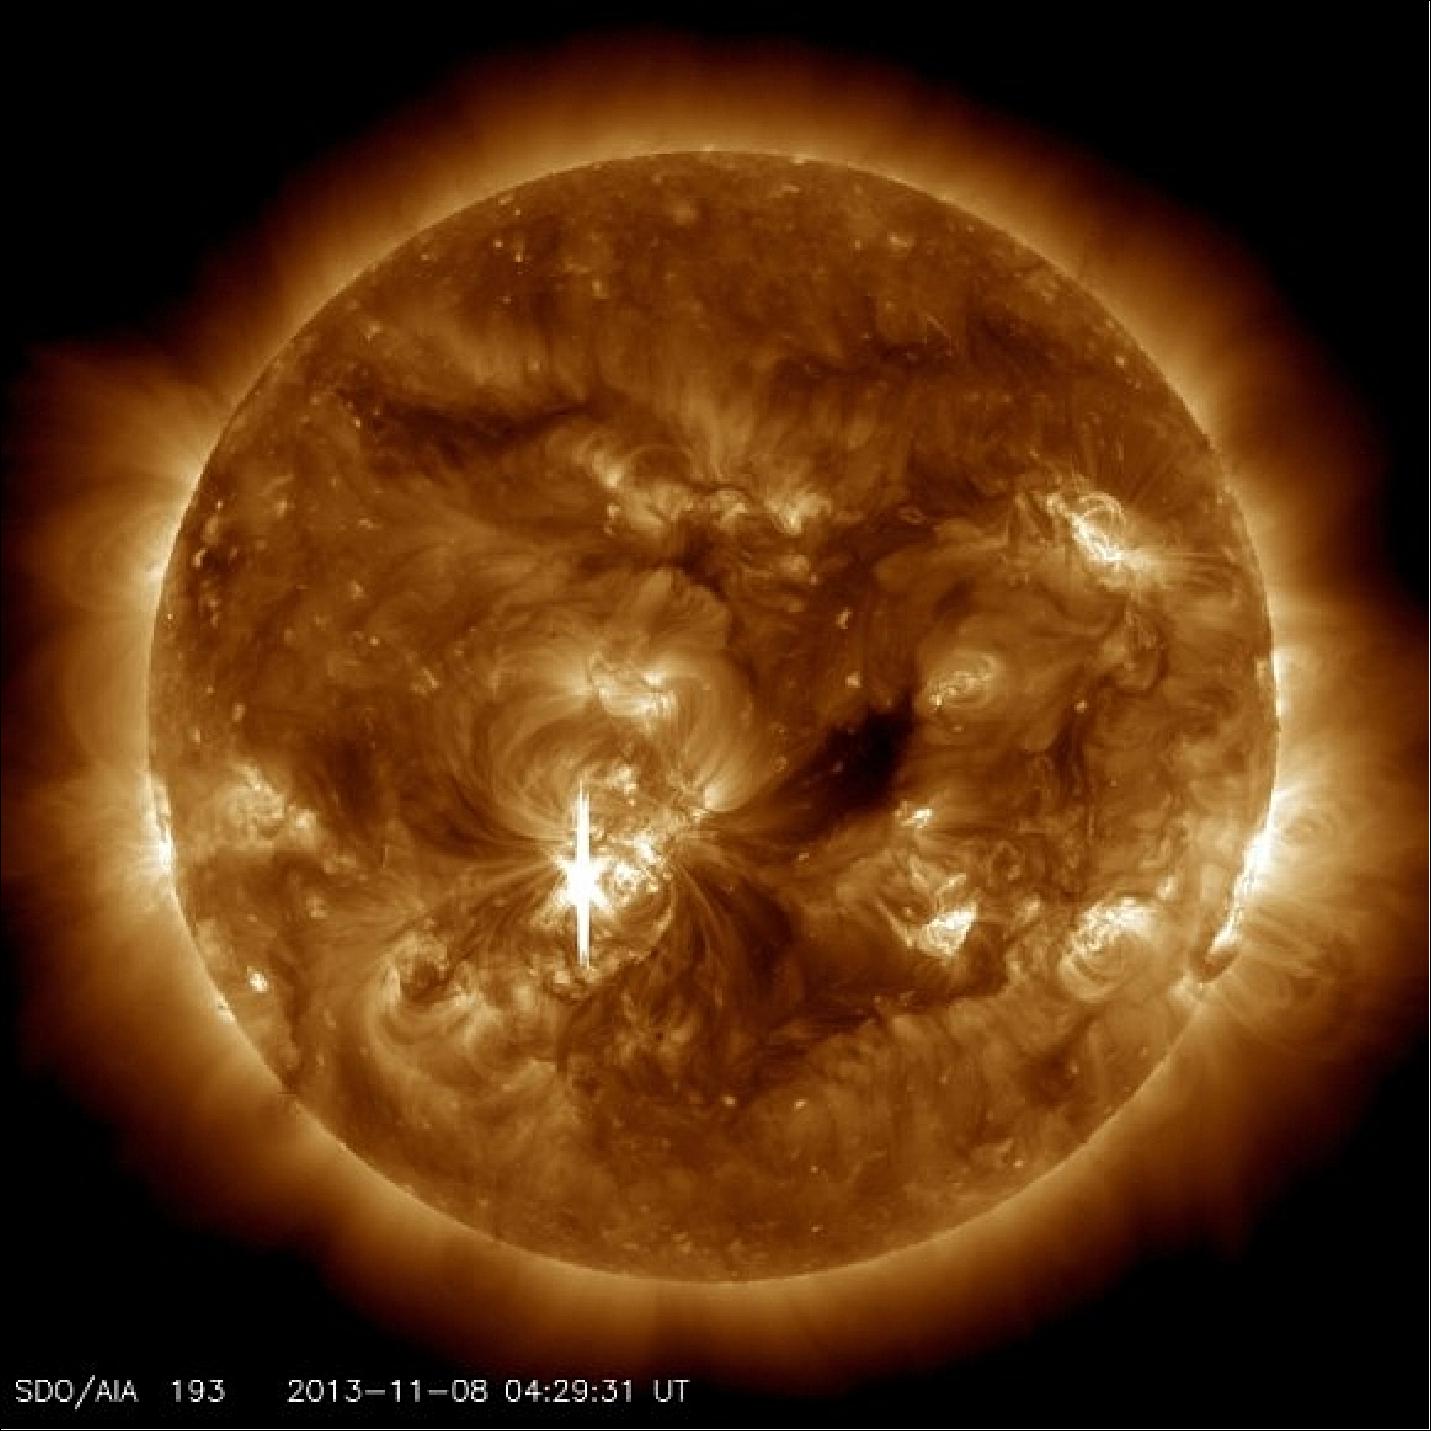
• Nov. 9, 2013: The Sun is currently acting like it’s in solar maximum. Our Sun has emitted dozens of solar flares in since Oct. 23, 2013, with at least six big X-class flares.
• On October 21, 2013, NASA successfully launched a Black Brant IX sounding rocket at 10:00 hours UTC from the White Sands Missile Range, N.M., carrying instrumentation to support the calibration of the EVE (EUV Variability Experiment) aboard SDO. EVE measures the total extreme ultraviolet output of the sun, called its irradiance. 35)
As part of the planned SDO/EVE program, the rocket calibration flight occurs about once a year to accurately determine the long-term variations of the solar extreme ultraviolet irradiance. This kind of calibration is known as an under-flight. It uses a near-replica of the SDO/EVE instrument to gather a calibrated sounding rocket observation in coordination with the orbital satellite's observations.
Comparison of the two data sets then validates the accuracy of the SDO/EVE data, providing crucial calibration of any long-term changes in the orbital instrumentation. This was the fourth under-flight calibration for the EVE instrument. The previous flight was successfully conducted on June 23, 2012.
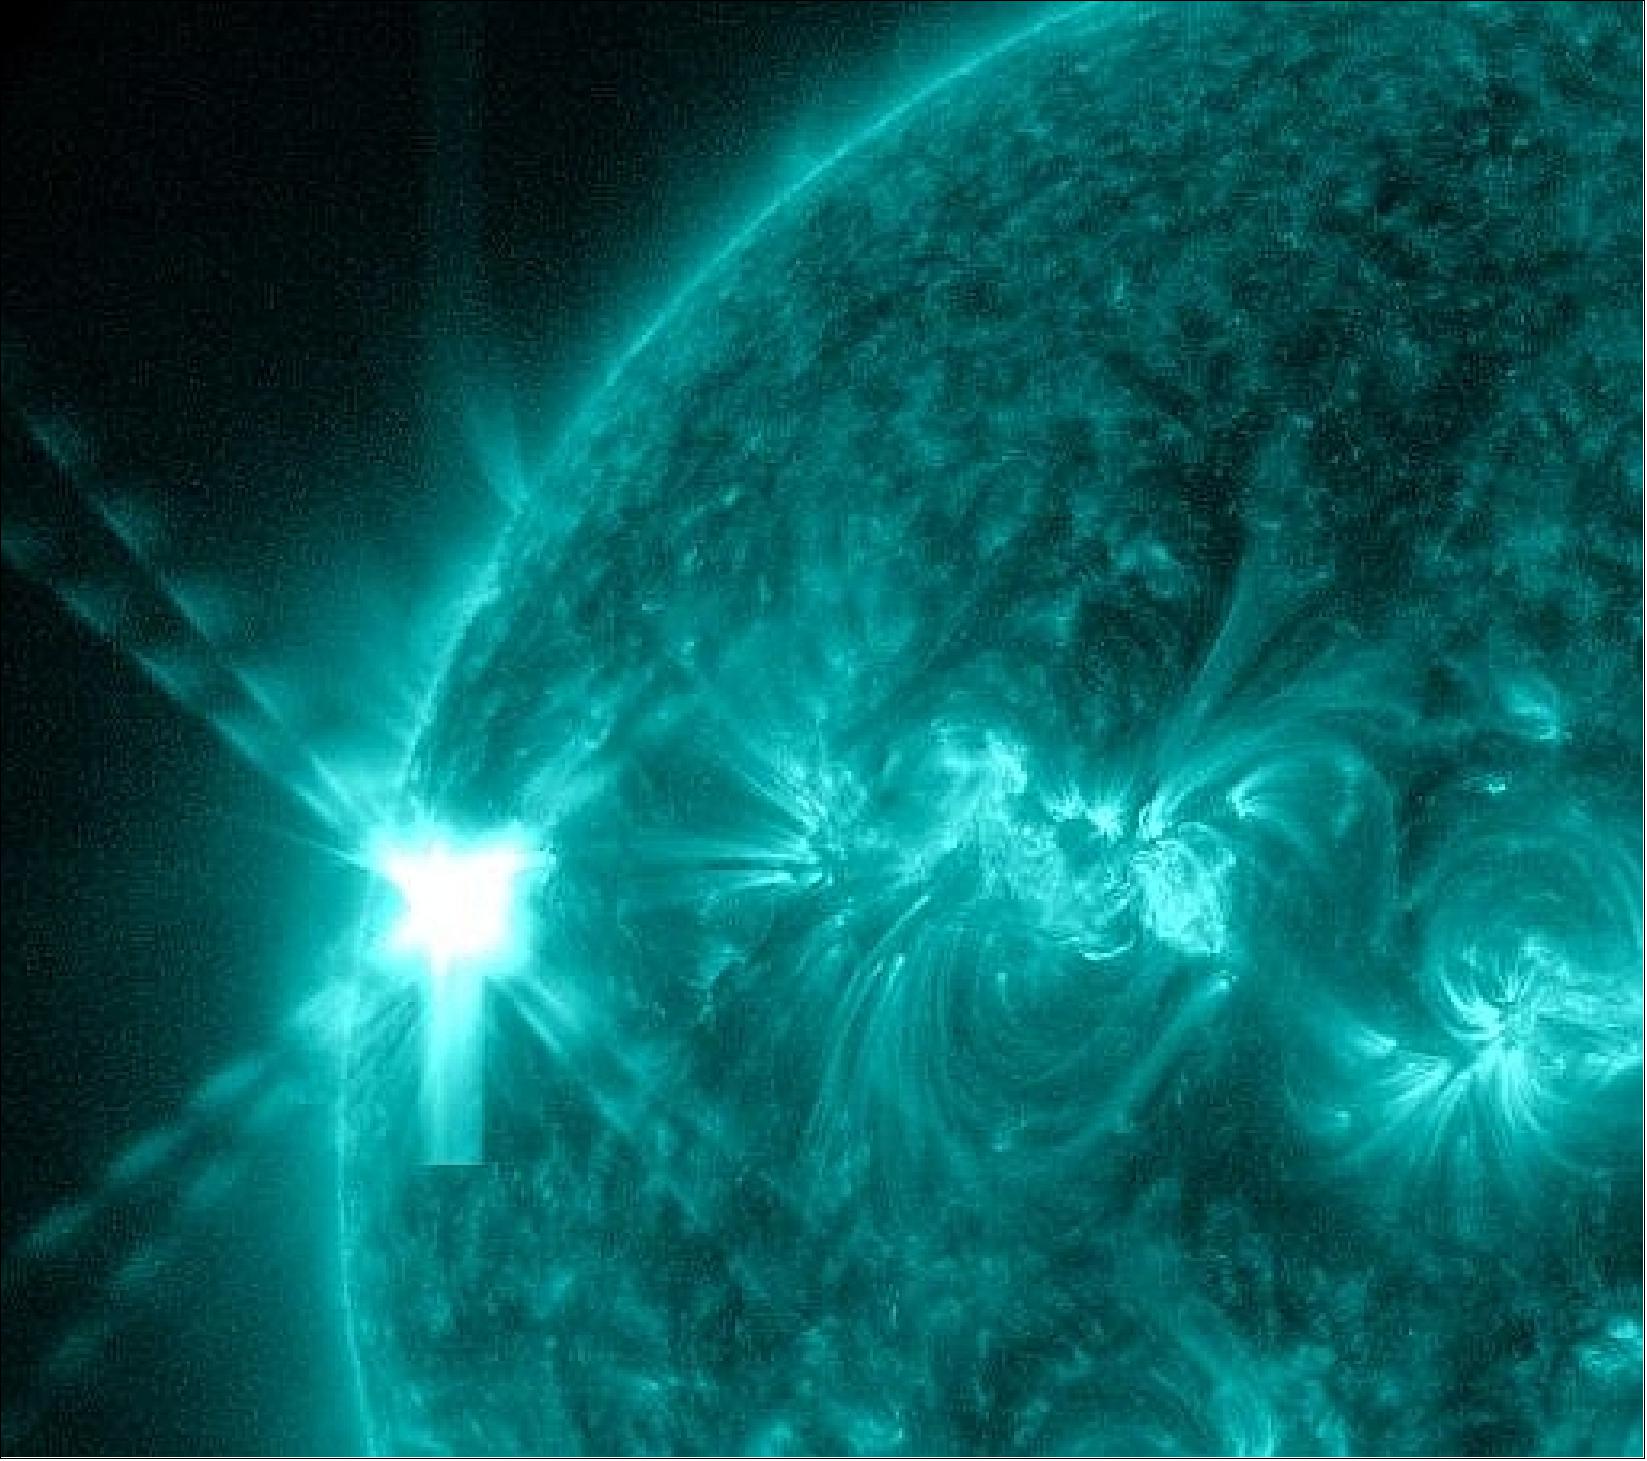
• May 15, 2013: According to “SpaceWeather.com,” AR1748 (sunspot active region 1748) has produced ”the strongest flares of the year so far, and they signal a significant increase in solar activity.” In only two days, sunspot AR1748 has produced four X-flares. The latest X-flare from this active sunspot occured on May 15th at 0152 UT. NASA's SDO (Solar Dynamics Observatory) captured the extreme ultraviolet flash. 36)
The AR1748 has produced an X1.7-class flare (0217 UT on May 13), an X2.8-class flare (1609 UT on May 13), an X3.2-class flare (0117 UT on May 14), and an X1-class flare (0152 on May 15). These are the strongest flares of the year, and they signal a significant increase in solar activity. 37)
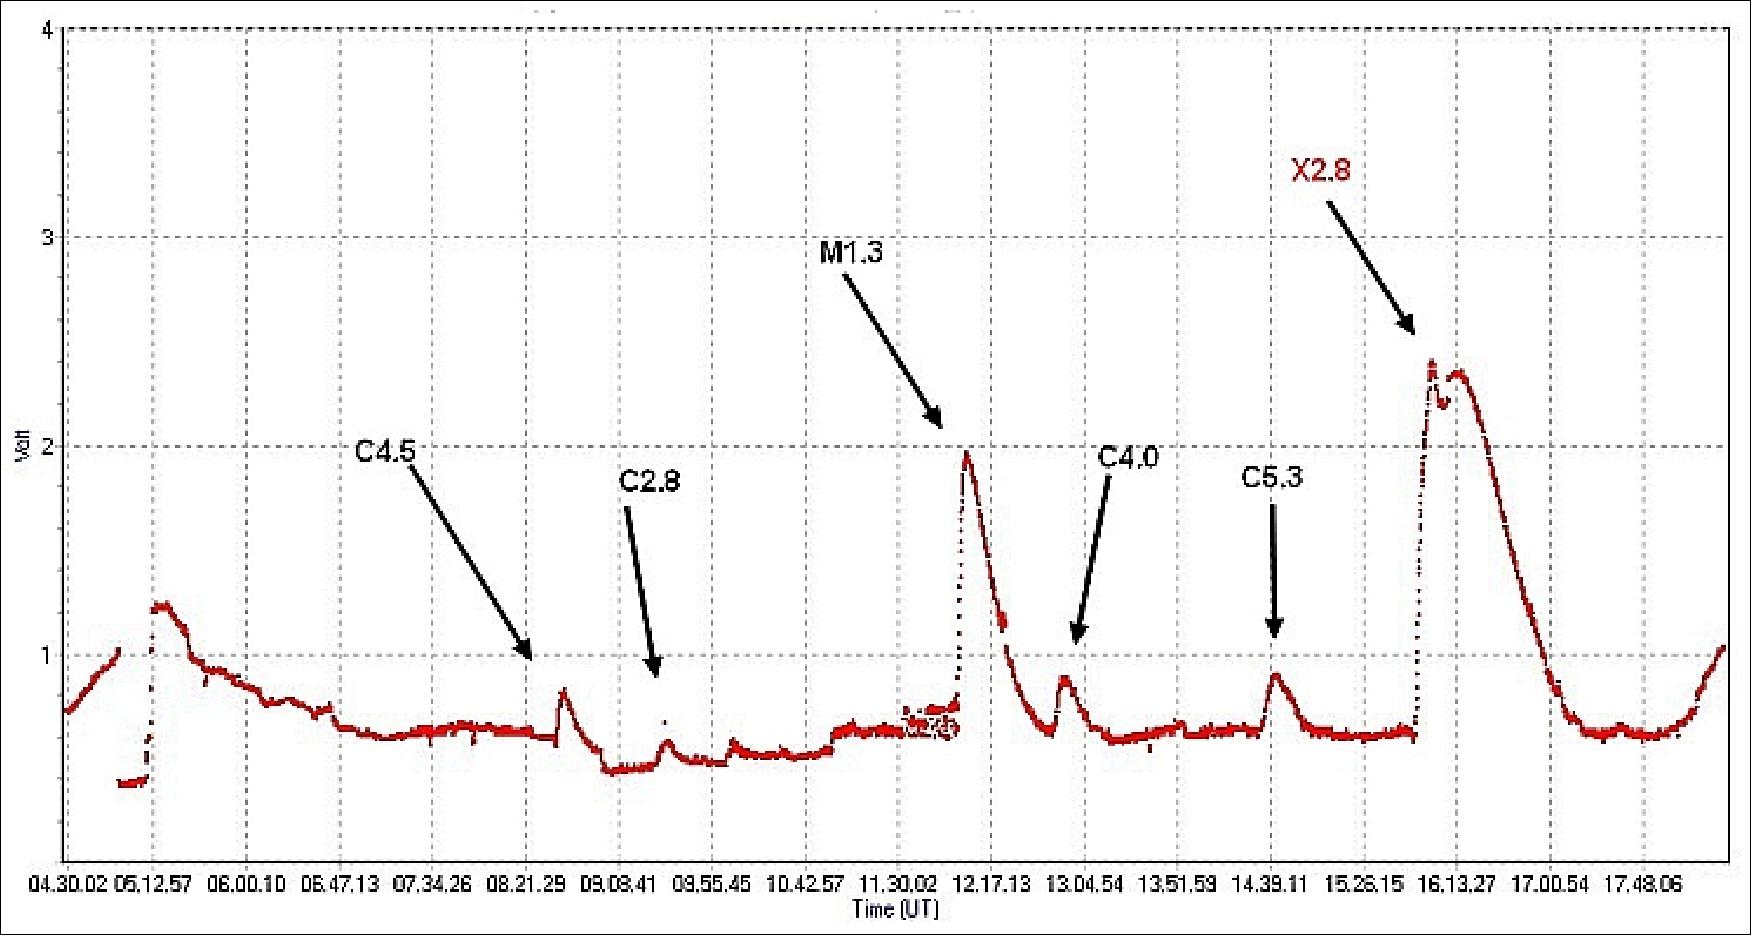
Legend to Figure 31: SID events make themselves known by the effect they have on low-frequency radio signals. When a SID passes by, the atmosphere overhead becomes a good reflector for radio waves, allowing signals to be received from distant transmitters. Battaiola monitored a faraway 21.75 kHz radio station to receive the SIDs over his location.
• On April 3, 2013 the SDO project performed an HMI roll maneuver. The entire SDO spacecraft is spun around so that HMI can verify its operation and measure some calibration data. 38)
- Twice a year, SDO performs a 360º roll maneuver about the axis on which it points toward the Sun. This produces some unique views; the rolls are necessary to help calibrate the instruments, particularly the HMI instrument, which is making precise measurements of the solar limb to study the shape of the Sun. The rolls also help the science teams to know how accurately the images are aligned with solar north. 39)
• The SDO mission and its payload are operating nominally in 2013. On Feb. 11, 2013, SDO was 3 years on orbit providing an enornous amount of information. 40)
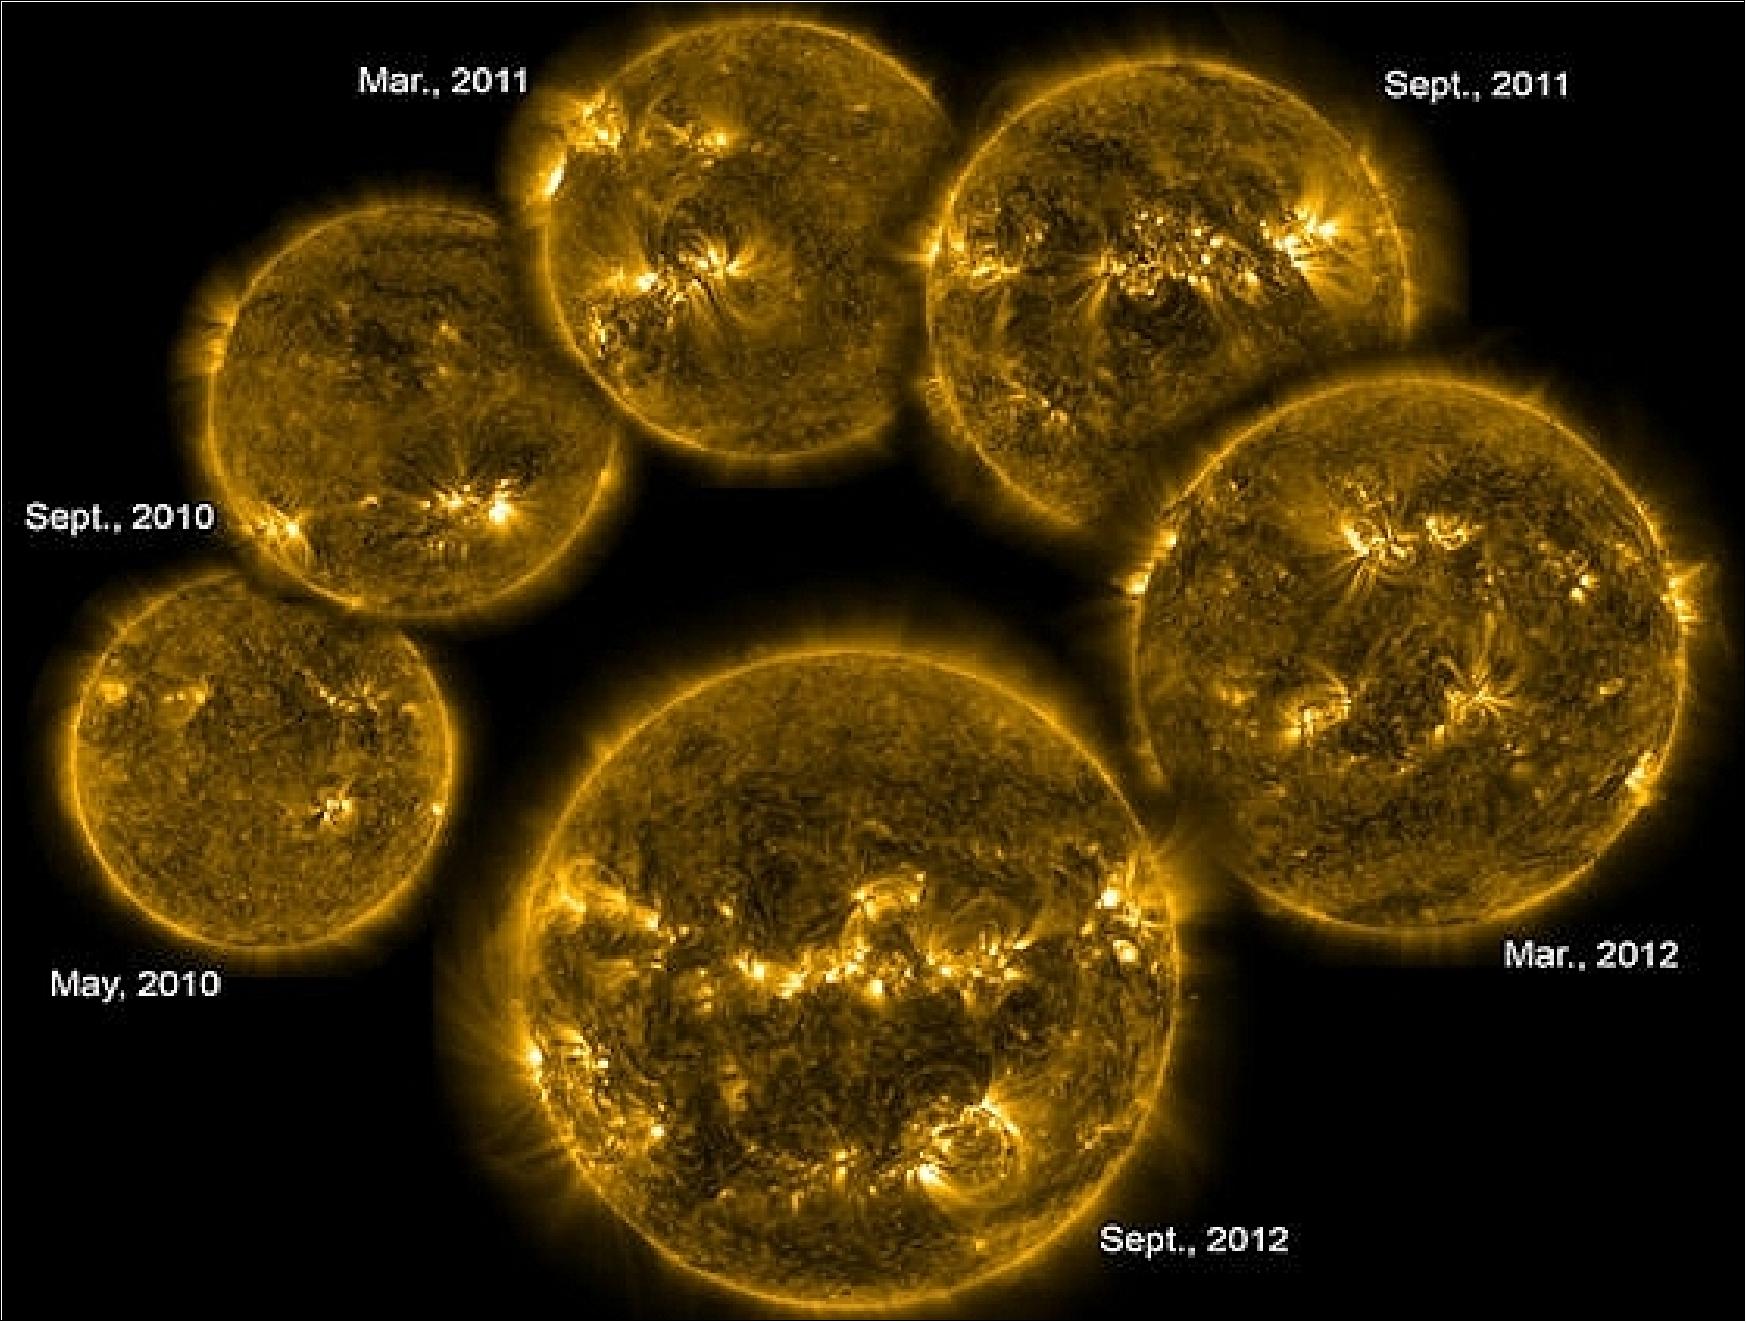
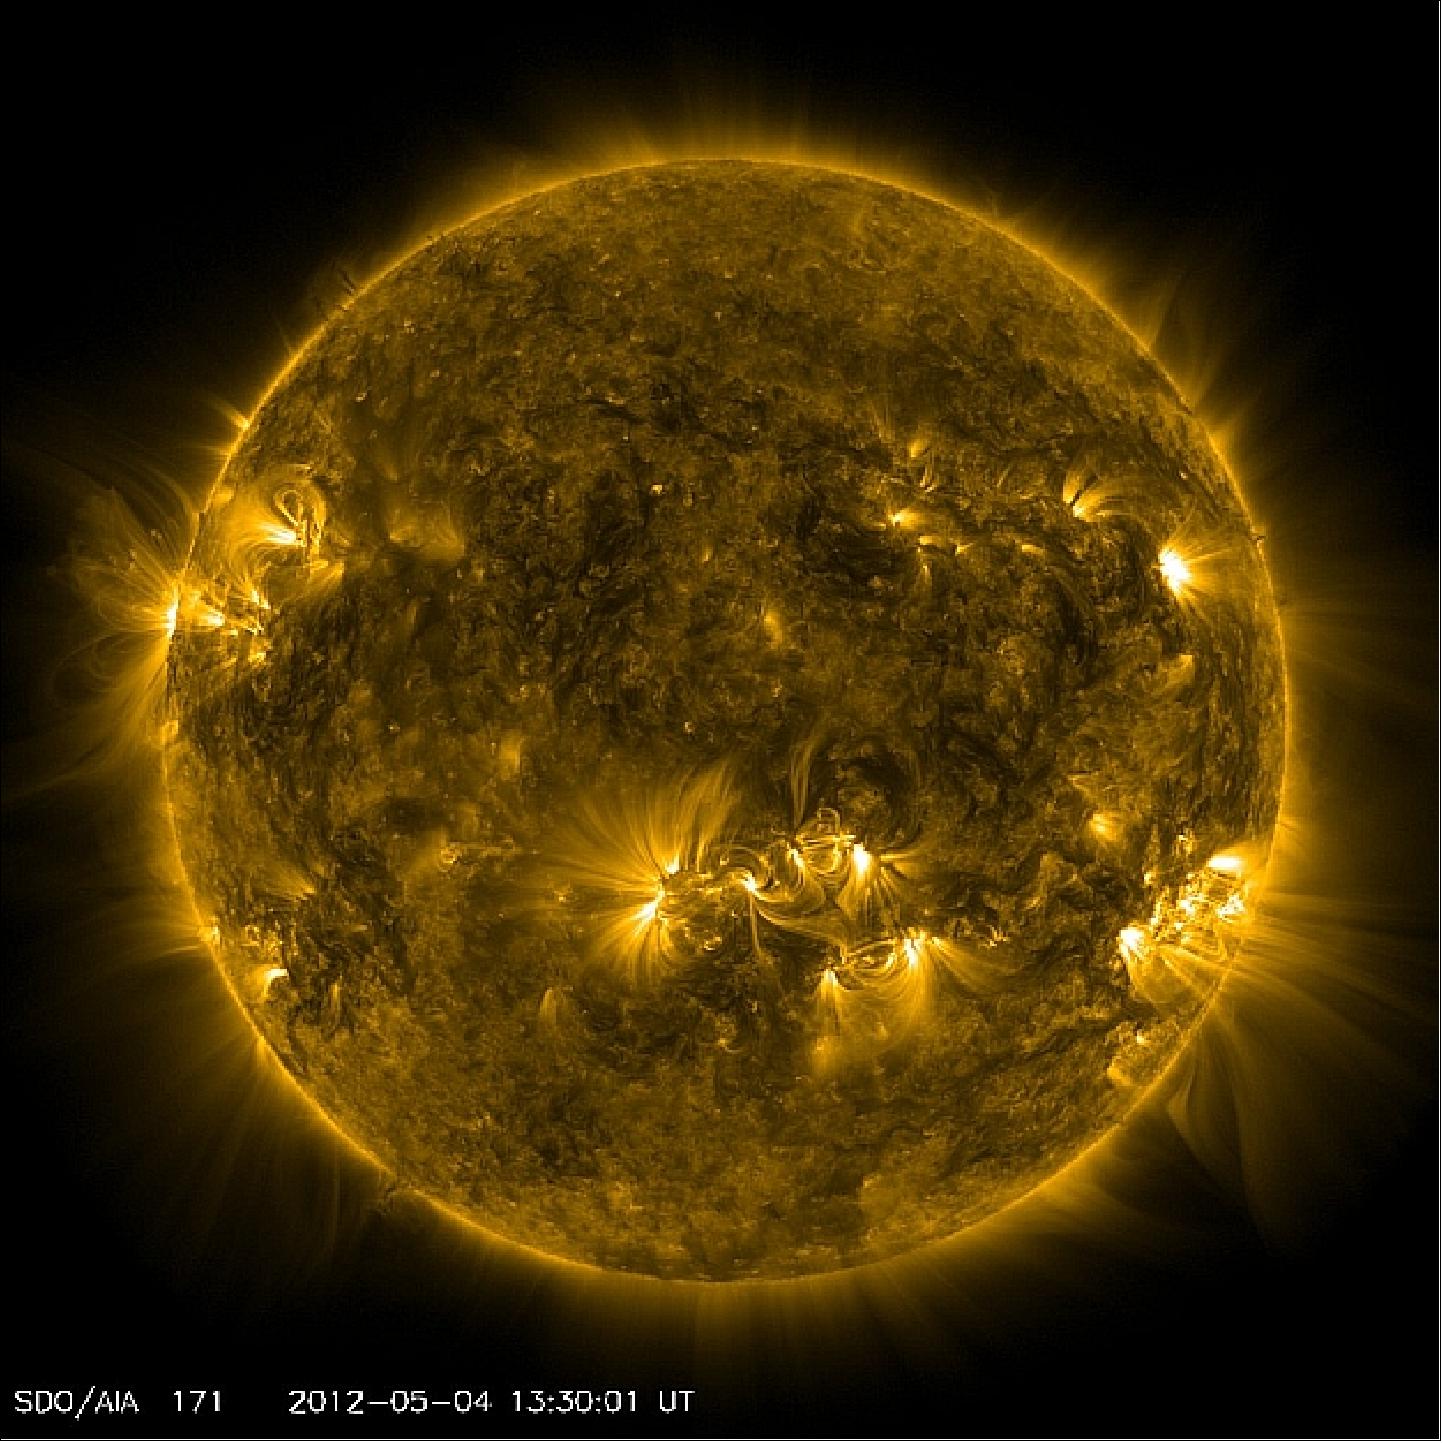
Legend to Figure 32: These six images from SDO, chosen to show a representative image about every six months, track the rising level of solar activity since the mission first began to produce consistent images in May, 2010. The period of solar maximum is expected in 2013. The images were taken in the 171 Angstrom wavelength of extreme ultraviolet light.
• On April 4, 2012, the SDO spacecraft performed a 360º spin. It rolled completely about its axis– something it does twice a year . This maneuver helps the HMI (Helioseismic and Magnetic Imager ) instrument, one of three instruments onboard SDO, take measurements of the solar limb to study the shape of the sun. The roll helps scientists remove optical distortions from the images and to precisely determine the boundaries of the sun's horizon, or "limb". Accumulated over time, such data shows whether the sun's sphere changes in concert with the 11-year solar cycle, during which the sun moves through periods of greater and lesser activity as evidenced by the changing frequency of giant solar eruptions. 42)
• In 2012, the spacecraft and its payload are operating nominally. On Feb. 11, 2012, the SDO spacecraft was 2 years on orbit.
The SDO mission serves as a clear example of the importance of the systems engineering role across all phases of the mission development lifecycle and its contribution to mission success. The best metric to evaluate the success of this approach is in the successful launch and the on-orbit performance of the SDO mission itself, which, despite challenging technical drivers and development obstacles along way, is currently enabling ground-breaking science after only two years into its five-year mission life (Ref. NO TAG#.
• Sept. 2011 (the late phase of solar flares): Over the course of a year, the science team used the EVE (Extreme ultraviolet Variability Experiment) instrument on SDO to record data from many flares. EVE doesn't snap conventional images. T. Woods is the principal investigator for the EVE instrument and he explains that it collects all the light from the sun at once and then precisely separates each wavelength of light and measures its intensity. This doesn't produce pretty pictures the way other instruments on SDO do, but it provides graphs that map out how each wavelength of light gets stronger, peaks, and diminishes over time. EVE collects this data every 10 seconds, a rate guaranteed to provide brand new information about how the sun changes, given that previous instruments only measured such information every hour and a half or didn't look at all the wavelengths simultaneously – not nearly enough information to get a complete picture of the heating and cooling of the flare.
Recording extreme ultraviolet light, the EVE spectra showed four phases in an average flare’s lifetime (Figure 34). The first three have been observed and are well established (though EVE was able to measure and quantify them over a wide range of light wavelengths better than has ever been done).
- The first phase is the hard X-ray impulsive phase, in which highly energetic particles in the sun’s atmosphere rain down toward the sun’s surface after an explosive event in the atmosphere known as magnetic reconnection. They fall freely for some seconds to minutes until they hit the denser lower atmosphere, and then the second phase, the gradual phase, begins.
- Second phase: Over the course of minutes to hours, the solar material, called plasma, is heated and explodes back up, tracing its way along giant magnetic loops, filling the loops with plasma. This process sends off so much light and radiation that it can be compared to millions of hydrogen bombs.
- The third phase is characterized by the sun's atmosphere — the corona — losing brightness, and so is known as the coronal dimming phase. This is often associated with what's known as a CME (Coronal Mass Ejection), in which a great cloud of plasma erupts off the surface of the sun.
But the fourth phase, the late phase flare, spotted by EVE was new. Anywhere from one to five hours later for several of the flares, they saw a second peak of warm coronal material that didn't correspond to another X-ray burst. The late phase turns out to be different, the emissions happen substantially later, and it happens after the main flare exhibits that initial peak. 44) 45)
To try to understand what was happening, the team looked at the images collected from SDO's AIA (Advanced Imaging Assembly) as well. They could see the main phase flare eruption in the images and also noticed a second set of coronal loops far above the original flare site. These extra loops were longer and become brighter later than the original set (or the post-flare loops that appeared just minutes after that). These loops were also physically set apart from those earlier ones.
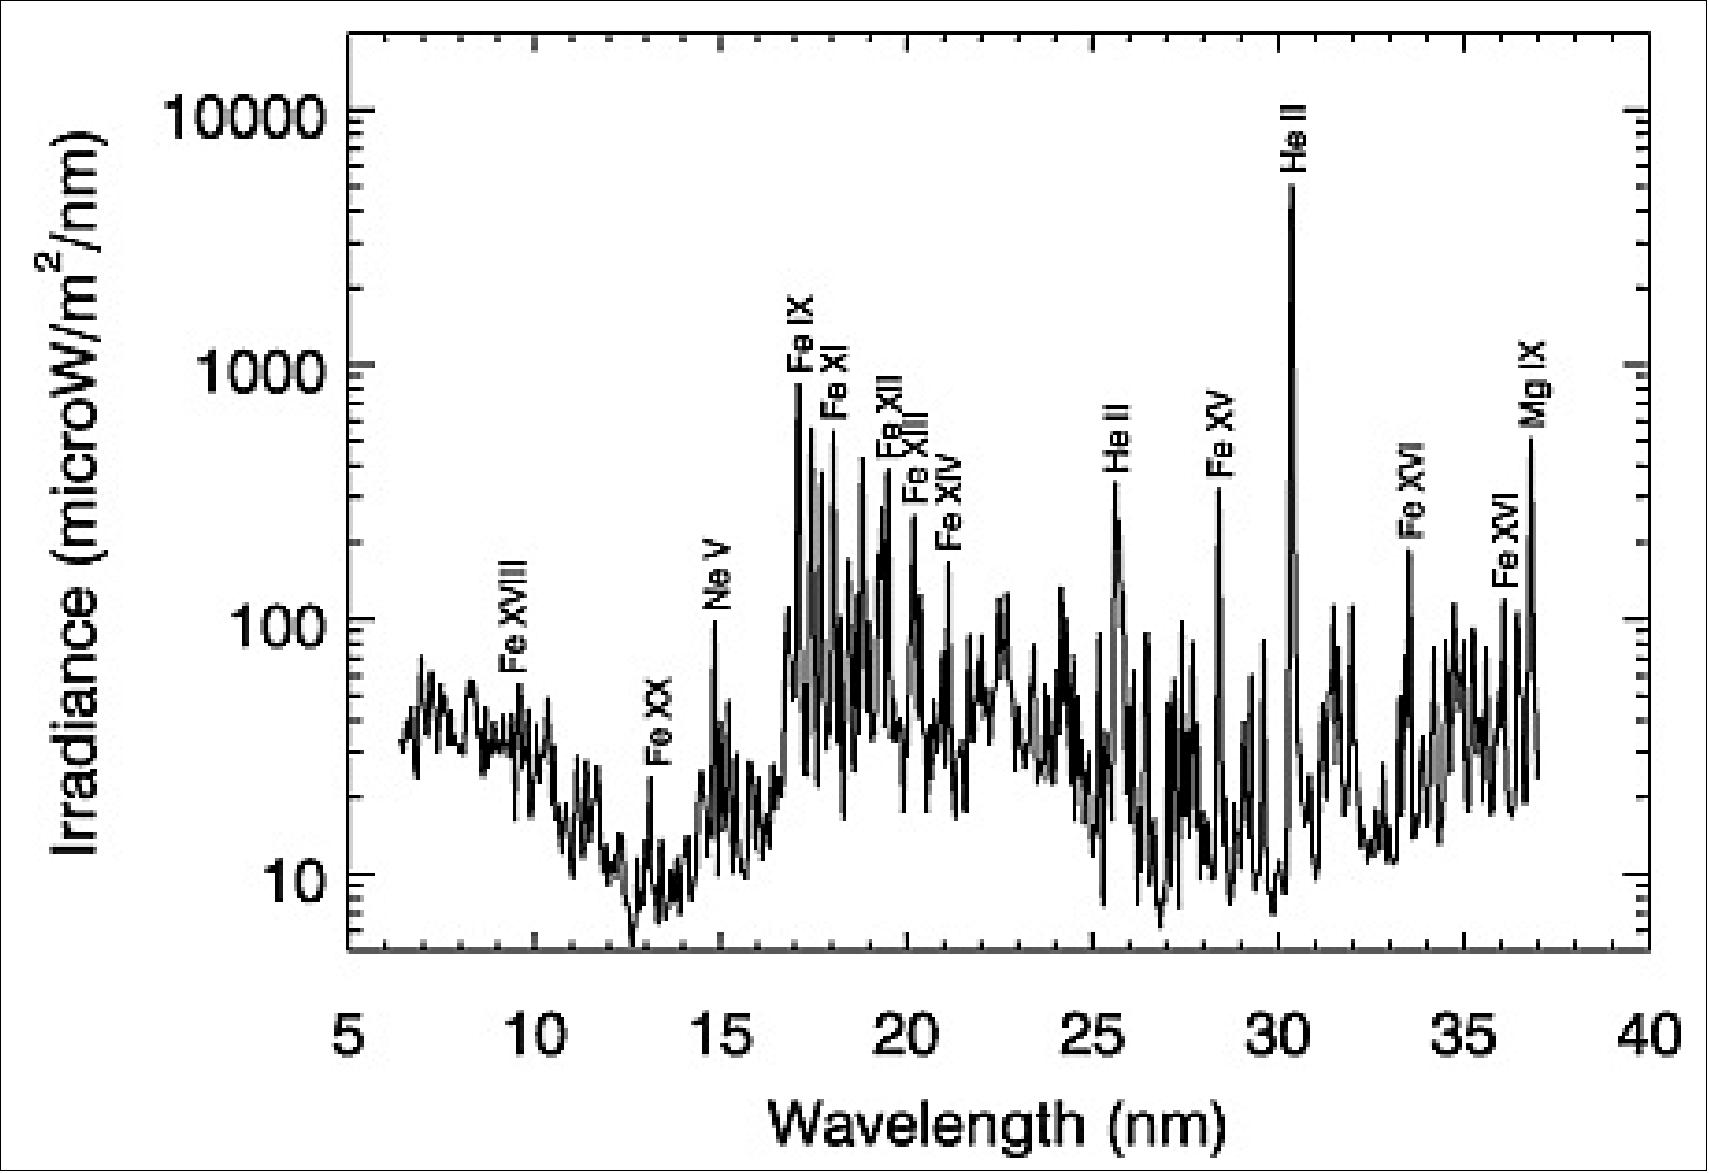
Legend of Figure 34: This image shows a single moment from May 5, 2010. Instead of a conventional picture, the EVE produces graphs like this, called spectra, that show the total intensity of any given EUV wavelength of light coming off of the sun.
The intensity, the project recorded in those late phase flares, is usually dimmer than the X-ray intensity. But the late phase goes on much longer, sometimes for multiple hours, so it's putting out just as much total energy as the main flare that typically only lasts for a few minutes. Because this previously unrealized extra source of energy from the flare is equally important to impacting Earth’s atmosphere, Woods and his colleagues are now studying how the late phase flares can influence space weather (Ref. 44).
• In 2011, the spacecraft and its payload are operating nominally.
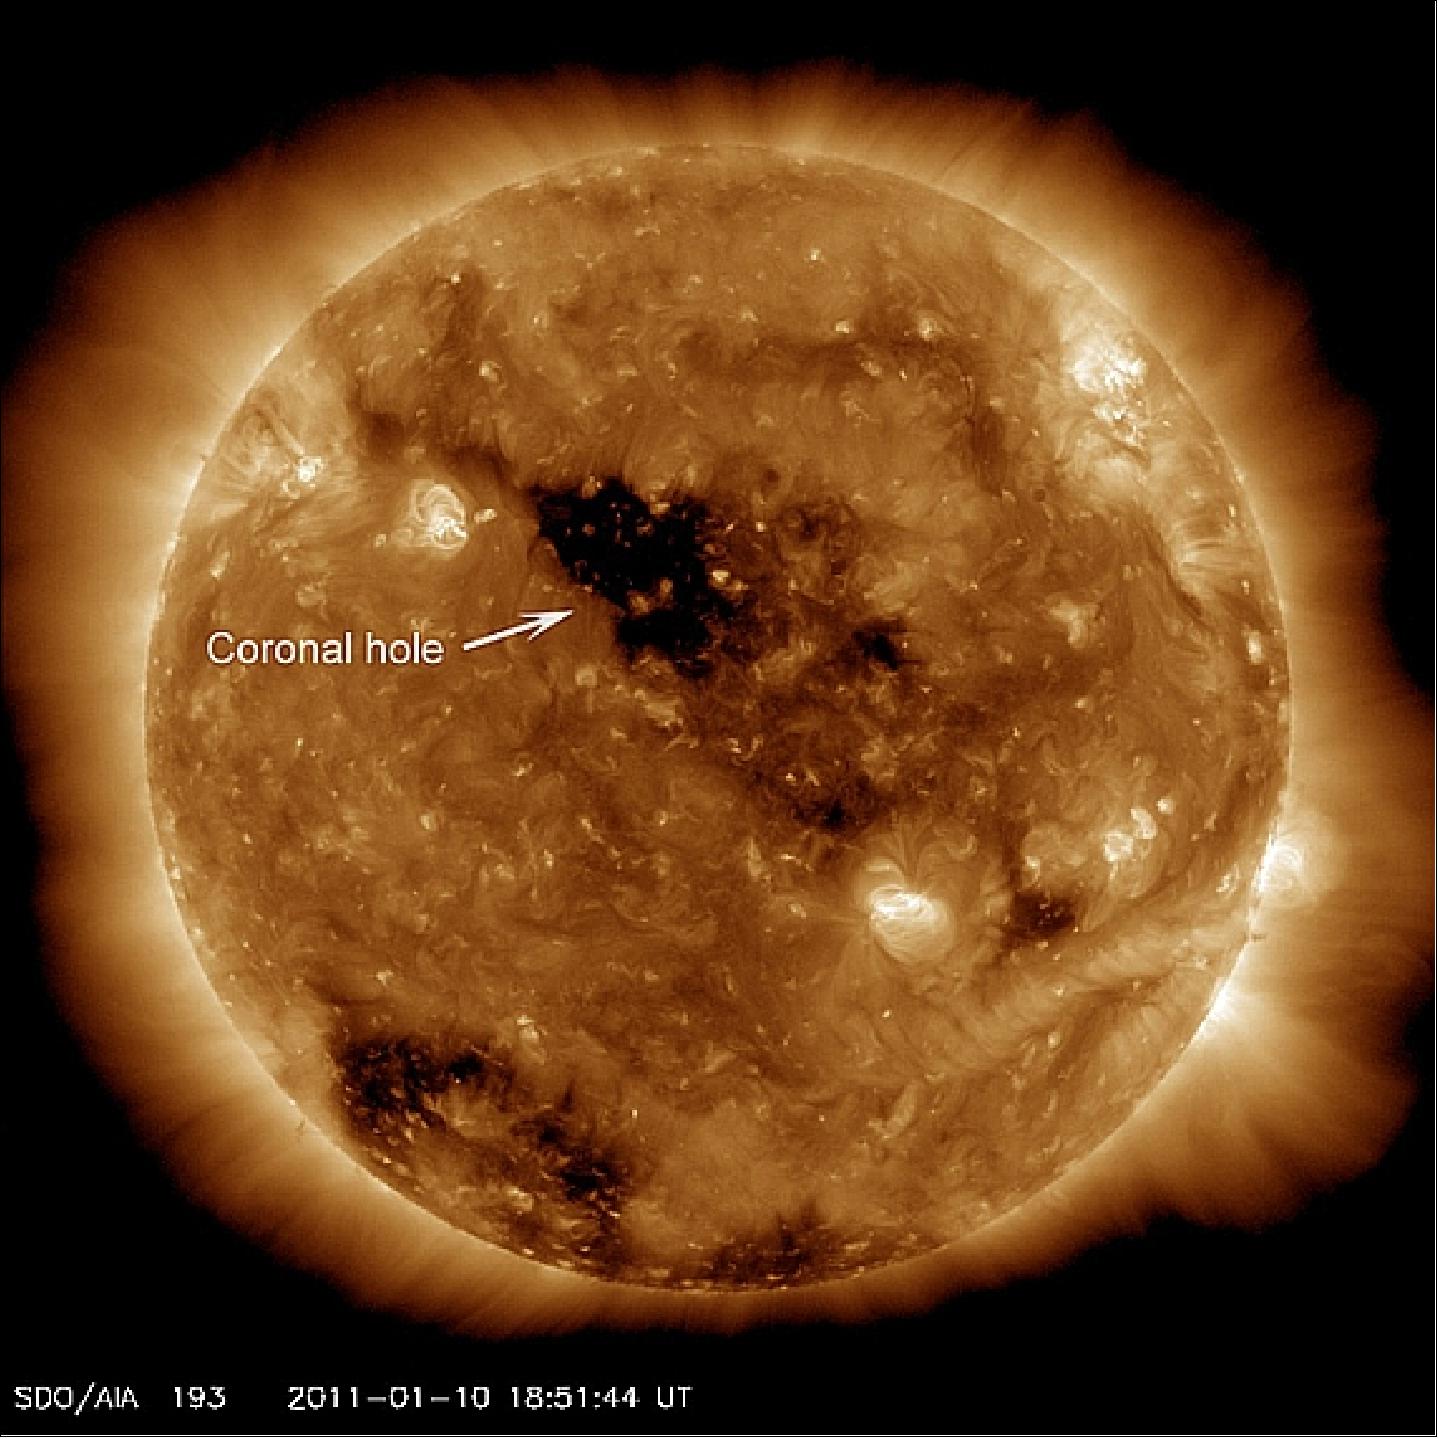
Legend to Figure 35: The image captures a dark coronal hole just about at sun center. Coronal holes are areas of the sun's surface that are the source of open magnetic field lines that head way out into space. They are also the source regions of the fast solar wind, which is characterized by a relatively steady speed of approximately 800 km/s. As the sun continues to rotate, the high speed solar wind particles blowing from this hole will likely reach Earth in a few days and may spark some auroral activity. 46)
• On Aug.1, 2010, a most unusual solar event occurred. Nearly the entire Earth-facing side of the Sun erupted in a tumult of activity, comprising a large solar flare, a solar tsunami, multiple filaments of magnetism lifting off the solar surface, radio bursts and half a dozen coronal mass ejections (CMEs). At the same time, NASA's three solar spacecraft, SDO and the two STEREO spacecraft, were ideally positioned to capture both the action on the Earth-facing side of the Sun, and most activity around the backside, leaving a wedge of only 30 degrees of the solar surface unobserved. 47) 48)
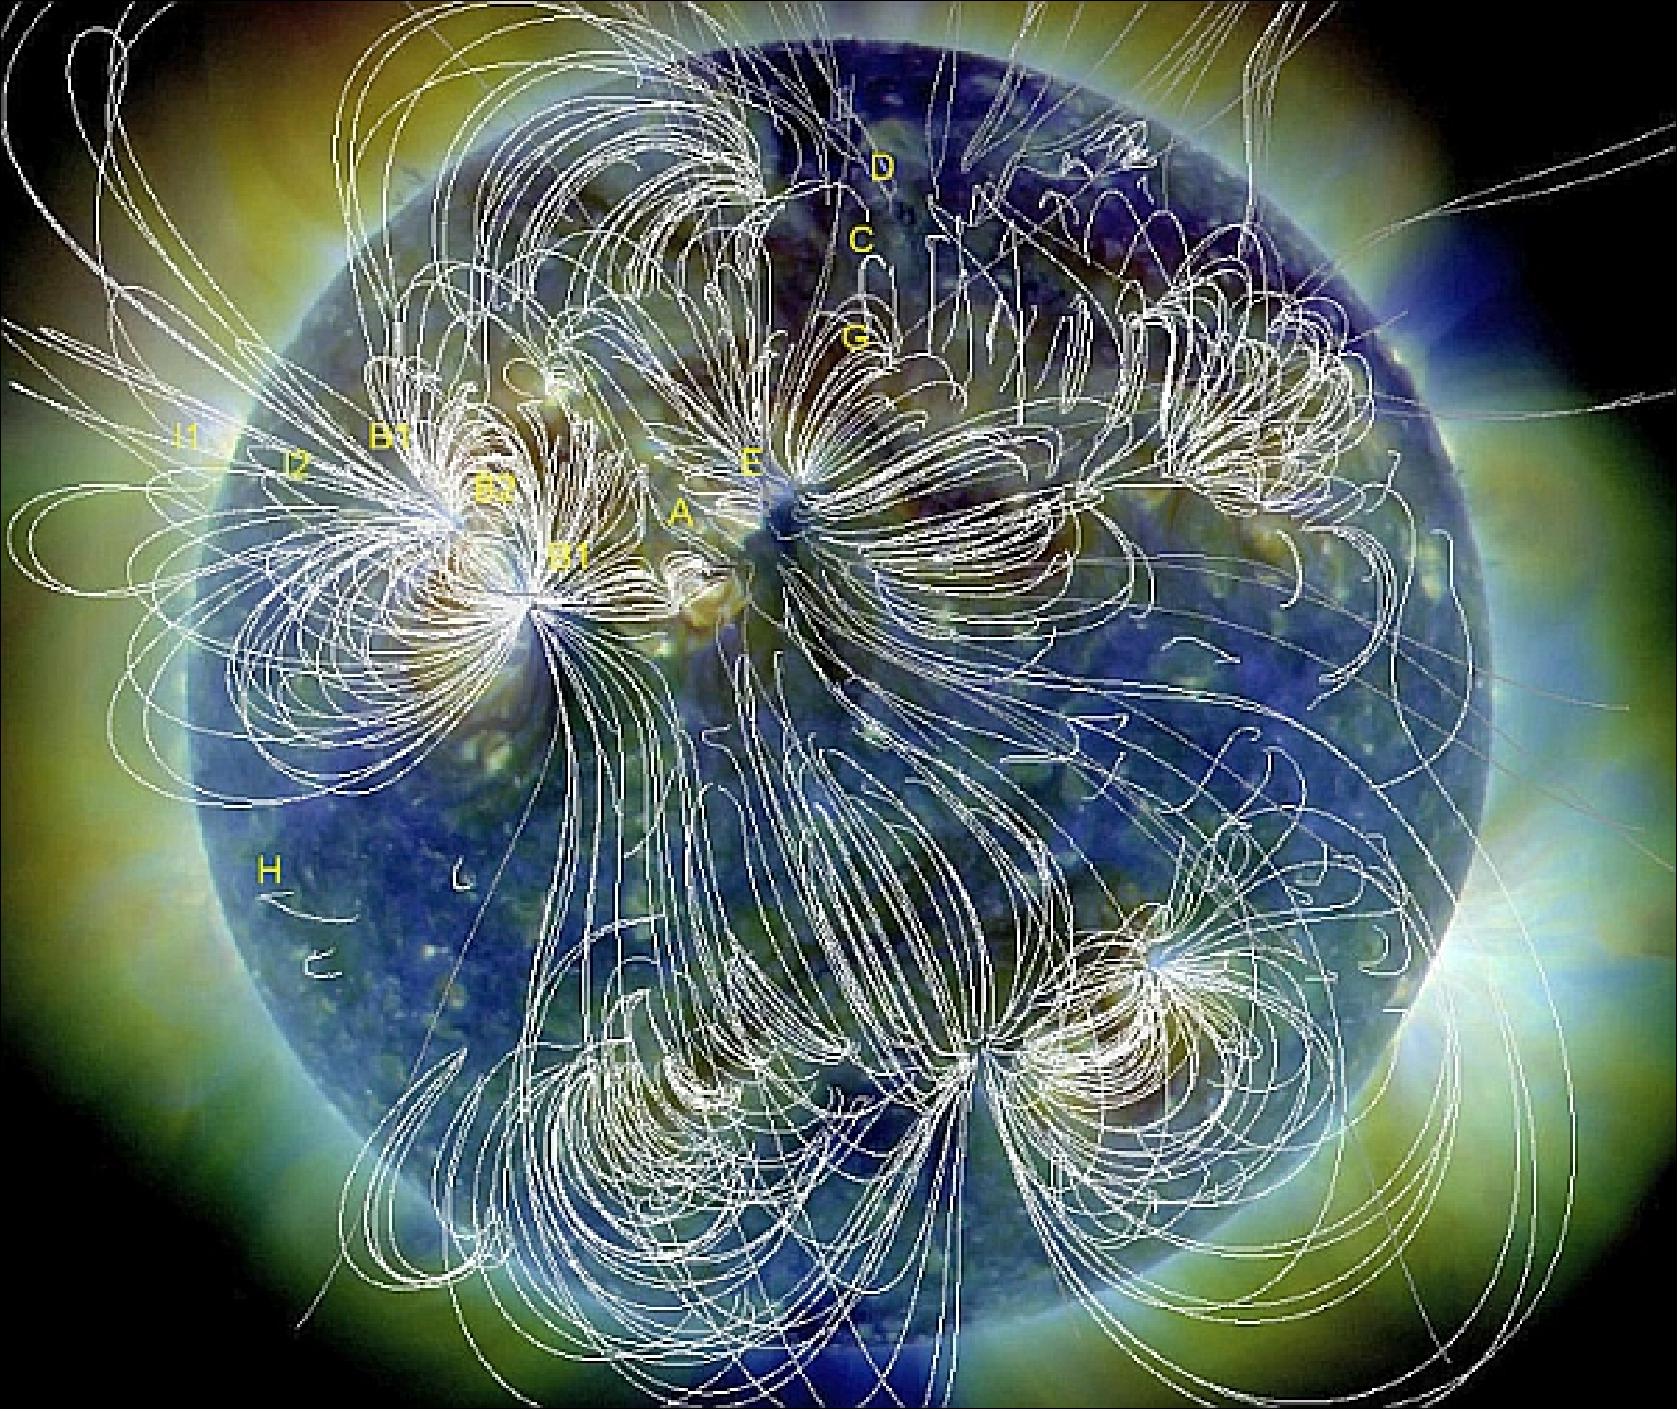
Explosions on the sun are not localized or isolated events, according to Karel Schrijver and Alan Title of LMSAL (Lockheed Martin, Solar & Astrophysics Laboratory). Instead, solar activity is interconnected by magnetism over breathtaking distances. Solar flares, tsunamis, coronal mass ejections--they can go off all at once, hundreds of thousands of miles apart, in a dizzyingly-complex concert of mayhem.
For several decades, scientists studying the sun have observed solar flares that appear to occur almost simultaneously but originated in completely different areas on the Sun. Solar physicists called them “sympathetic” flares, but it was thought these near-synchronous explosions in the solar atmosphere were too far apart – sometimes millions of kilometers distant – to be related. But now, with the continuous high-resolution and multi-wavelength observations with the SDO, combined with views from the twin STEREO spacecraft, the scientists are seeing how these sympathetic eruptions — sometimes on opposite sides of the sun — can connect through looping lines of the Sun’s magnetic field. 49)
• On May 14, 2010, SDO passed a major milestone when it completed its post-launch check out (end of commissioning phase) and officially began its five-year science mission to study the sun (phase E). The project at NASA/GSFC declared SDO an operational mission. All of the instruments and the spacecraft are performing extremely well. SDO is now sending 1.5 TB of data/day to Earth, and will continue to do so at least until the end of the prime phase of the mission in 2015. 50) 51)
The SDO has allowed scientists for the first time to comprehensively view the dynamic nature of storms on the sun. Solar storms have been recognized as a cause of technological problems on Earth since the invention of the telegraph in the 19th century. 52)
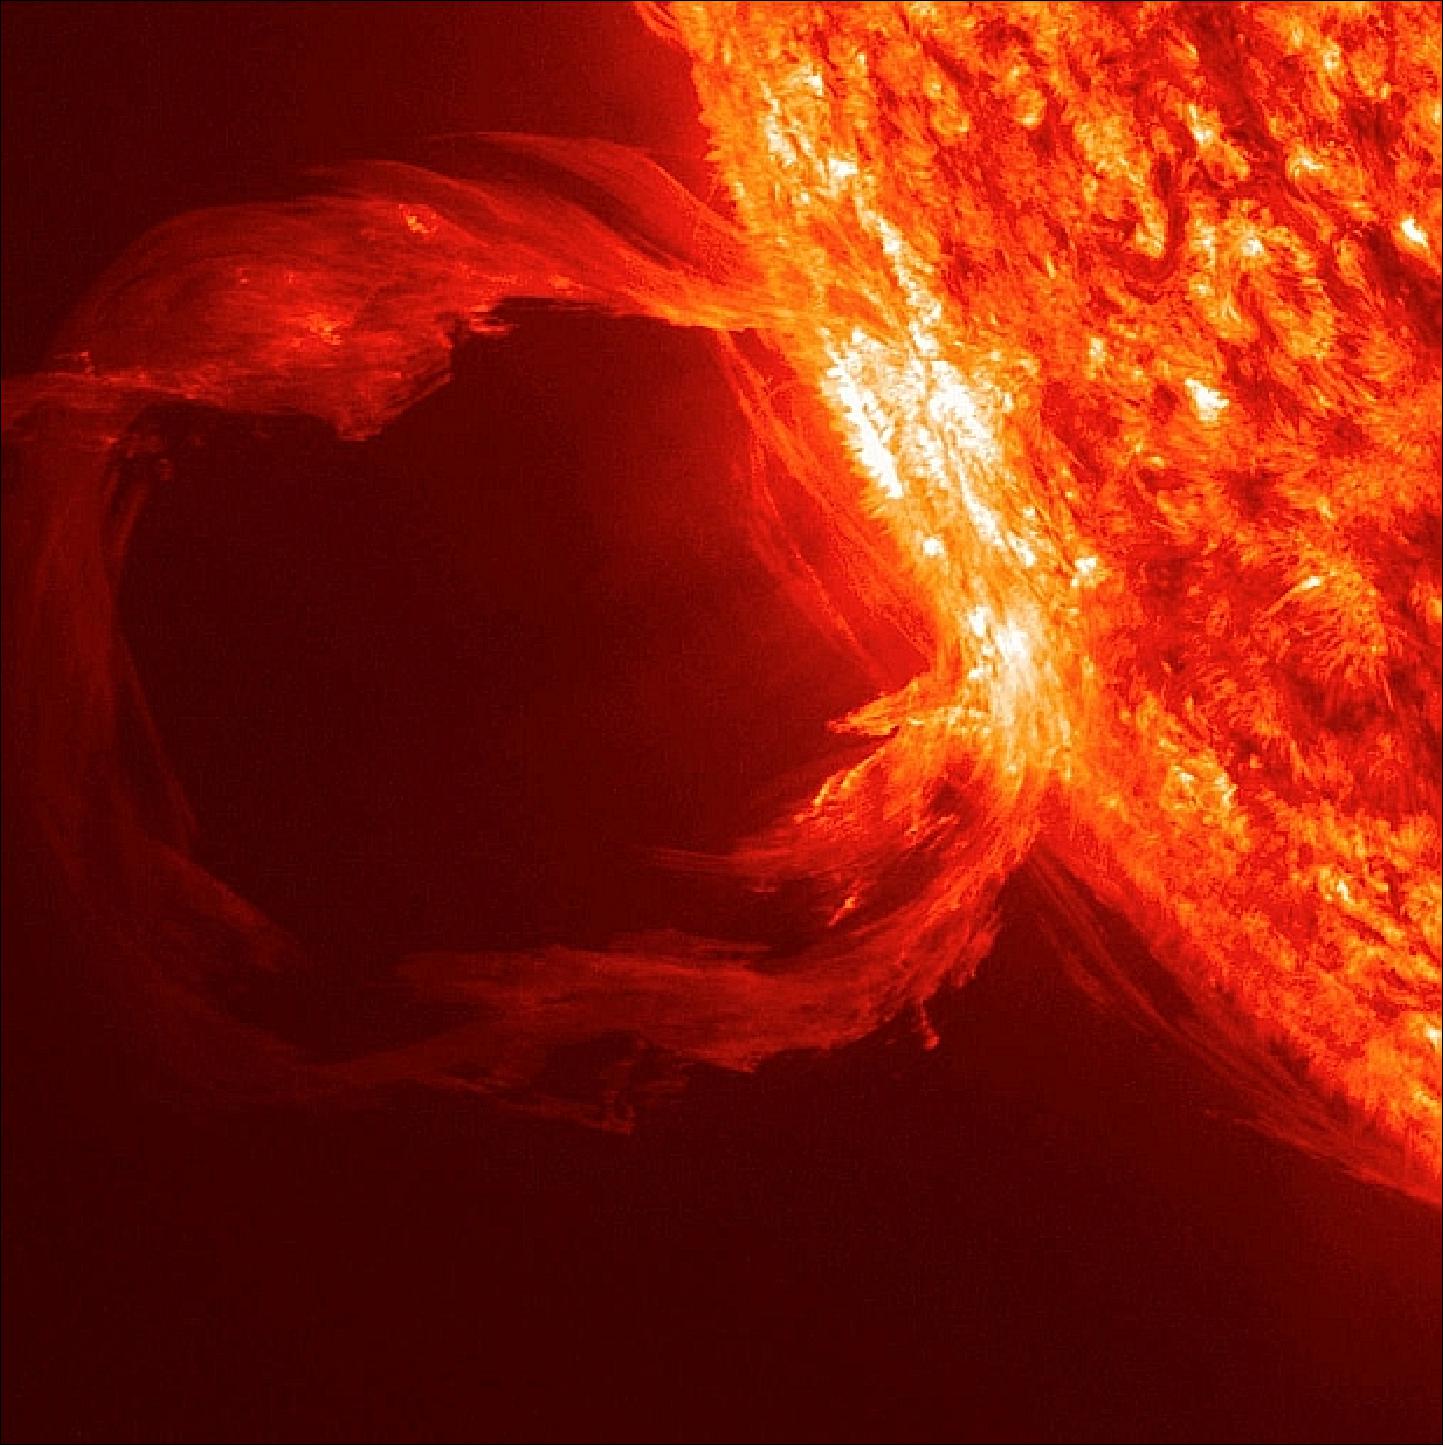
• On April 19, 2010, SDO observed a massive eruption on the sun — one of the biggest in years. Astronomers have seen eruptions like this before, but rarely so large and never in such fluid detail. Coronal rain has long been a mystery. It's not surprising that plasma should fall back to the sun. After all, the sun's gravity is powerful. The puzzle of coronal rain is how slowly it seems to fall. The rain appears to be buoyed by a 'cushion' of hot gas.
Using the AIA (Atmospheric Imaging Assembly) instrument with an array of ultraviolet telescopes, SDO can remotely measure the temperature of gas in the sun's atmosphere. Coronal rain turns out to be relatively cool—"only" 60,000 K. When the rains falls, it is supported, in part, by an underlying cushion of much hotter material, between 1,000,000 and 2,200,000 K. 53)
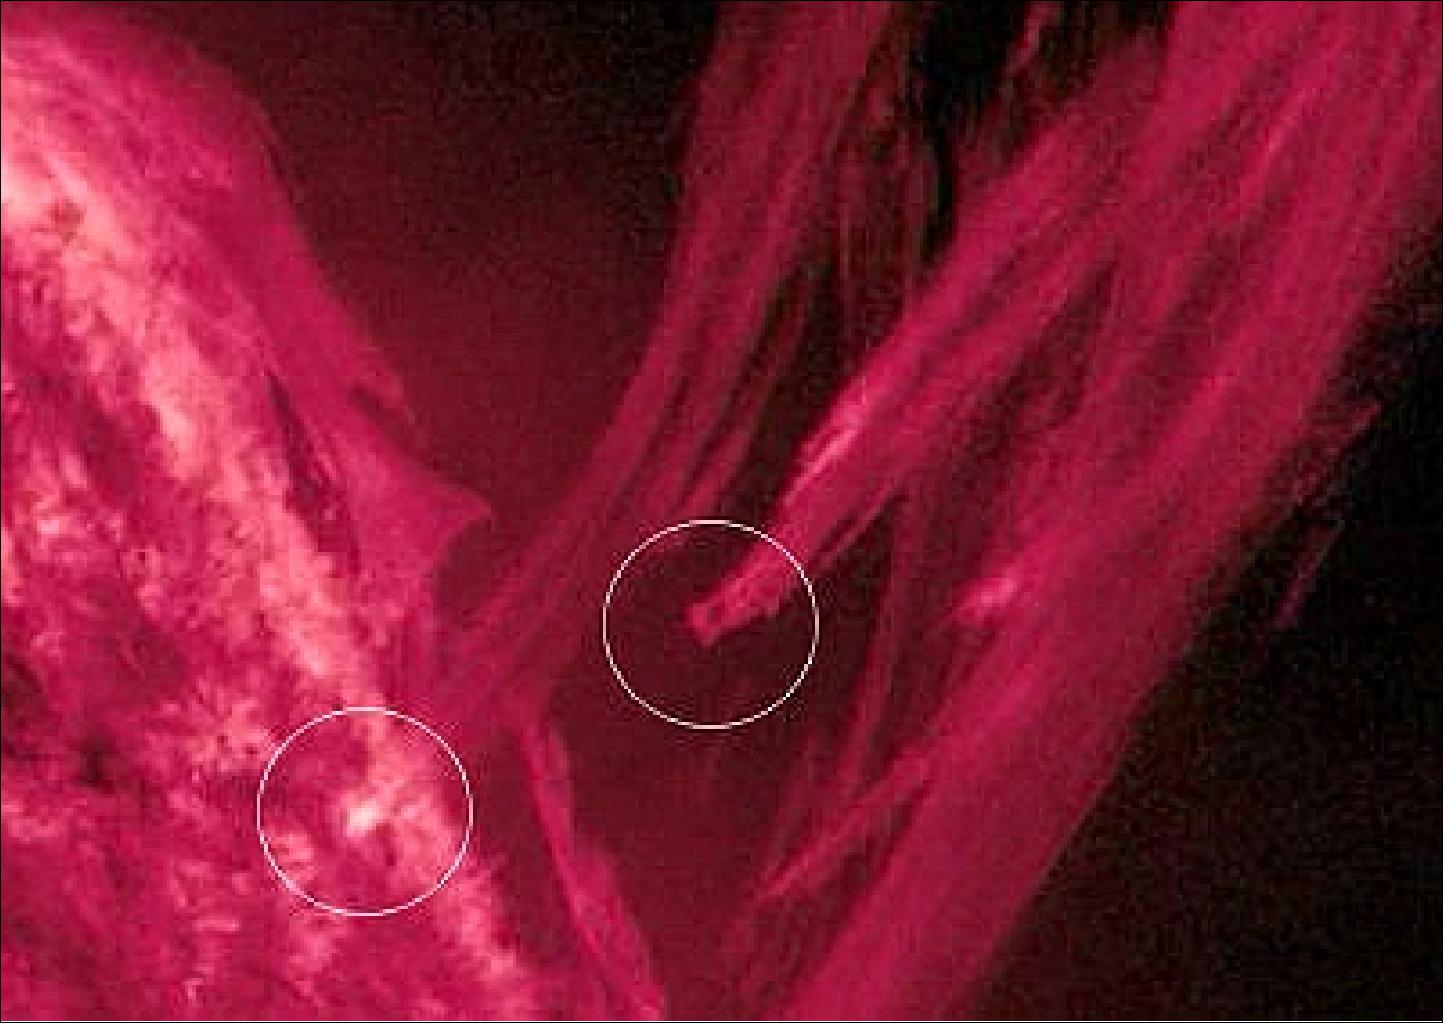
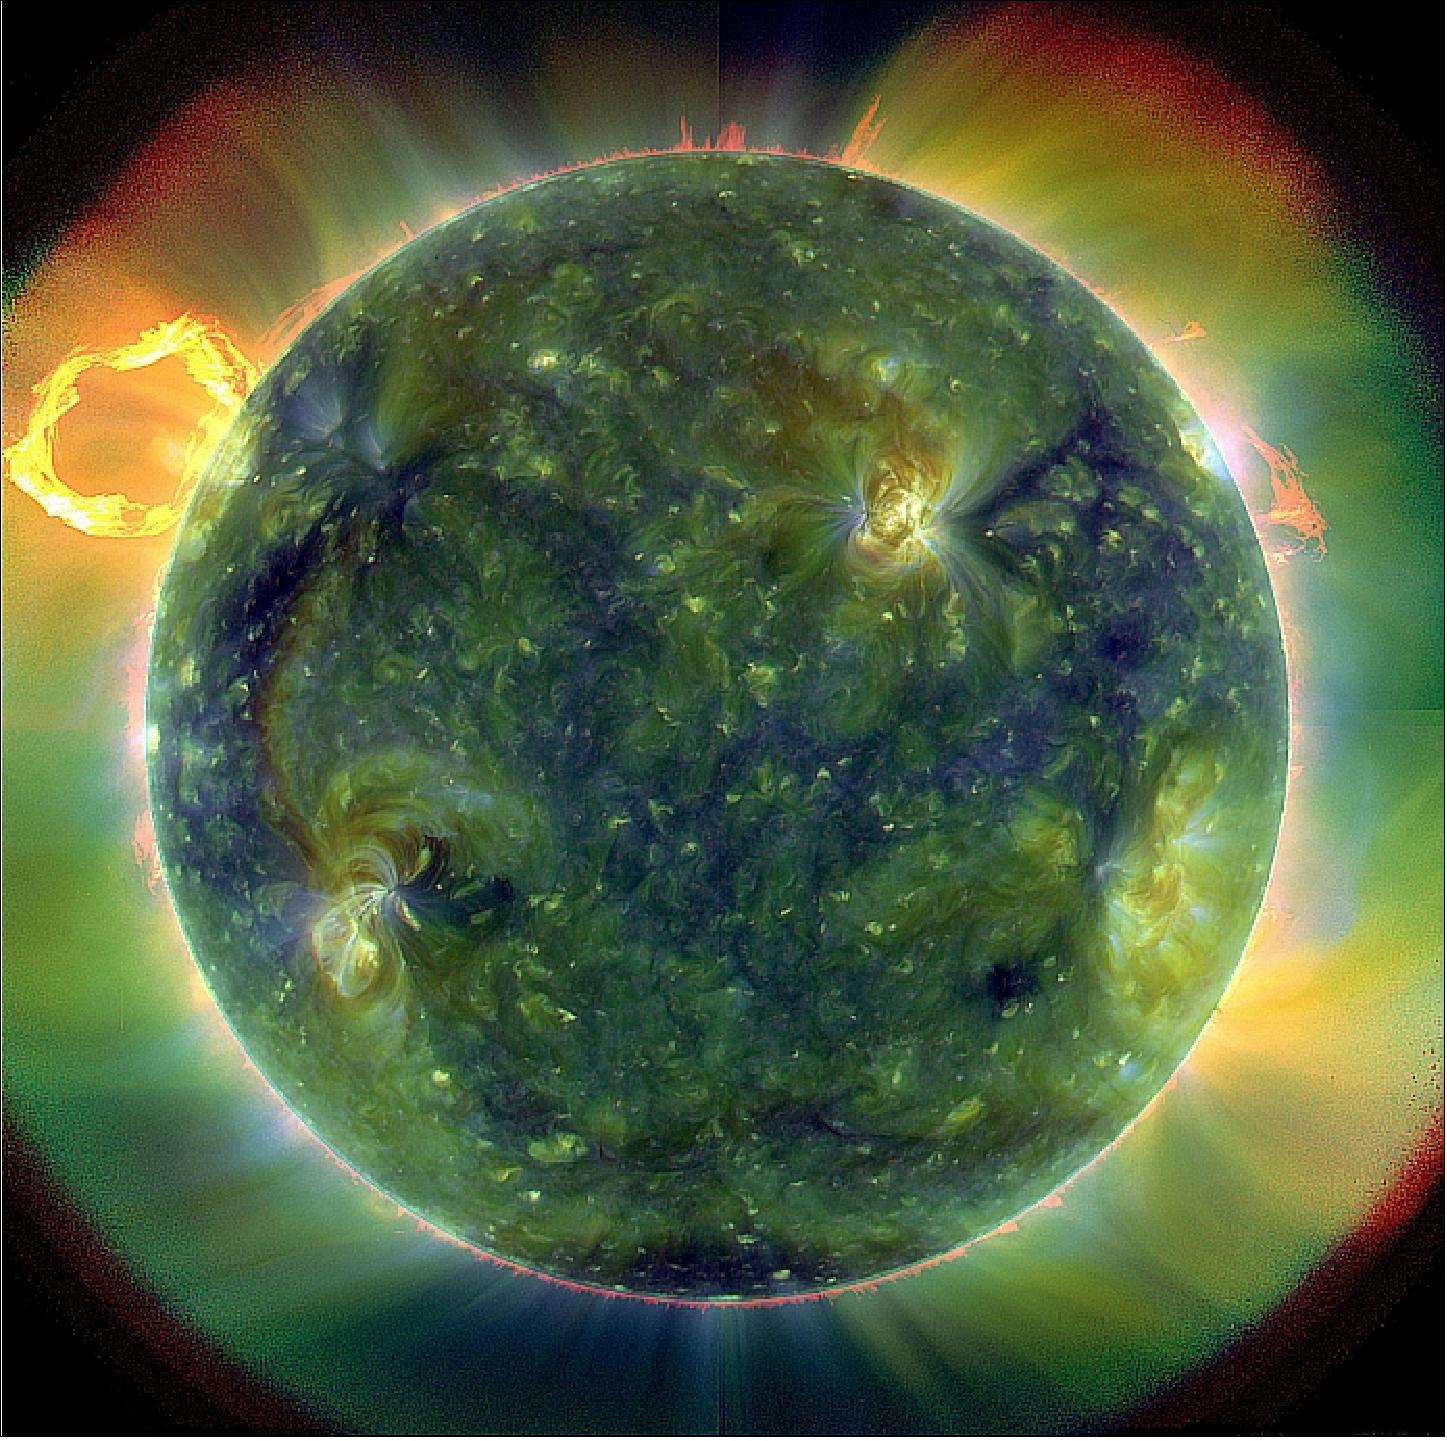
Legend to Figure 38: False colors trace different gas temperatures. Reds are relatively cool (~60,000 K); blues and greens are hotter (> 1,000,000 K). SDO is able to monitor not just one small patch of sun, but rather the whole thing — full disk, atmosphere, surface, and even interior. 54)
• Following several precise propulsion burns to circularize its orbit, SDO arrived “on station” on March 16, 2010. All systems are operating nominally.
1) Nicolas Labrosse, ”Giant solar tornadoes put researchers in a spin,” European Week of Astronomy and Space Science press release, 6 April 2018, https://doi.org/10.1038/s41550-018-0668-9 URL: http://www.astro.gla.ac.uk/?p=4864
2) ”Our Sun: Three Different Wavelengths,” NASA, 10 April 2018, URL: https://www.nasa.gov
/image-feature/our-sun-three-different-wavelengths
3) Samuel D. T. Grant, David B. Jess, Teimuraz V. Zaqarashvili, Christian Beck, Hector Socas-Navarro, Markus J. Aschwanden, Peter H. Keys, Damian J. Christian, Scott J. Houston, Rebecca L. Hewitt, ”Alfvén wave dissipation in the solar chromosphere,” Nature Physics Letters, https://doi.org/10.1038
/s41567-018-0058-3, Pblished online: 05 March 2018, URL: https://www.nature.com
/articles/s41567-018-0058-3.pdf
4) ”Queen's scientists crack 70-year-old mystery of how magnetic waves heat the Sun,” Space Daily, 6 March 2018, URL: http://www.spacedaily.com/reports
/Queens_scientists_crack_70_year_old_mystery_of_how_magnetic_waves_heat_the_Sun_999.html
5) Lina Tran, ”NASA’s SDO Reveals How Magnetic Cage on the Sun Stopped Solar Eruption,” NASA SDO Solar Mission, 23 Feb. 2018, URL: https://www.nasa.gov/feature/goddard/2018
/nasa-s-sdo-reveals-how-magnetic-cage-on-the-sun-stopped-solar-eruption
6) Tahar Amari, Aurélien Canou, Jean-Jacques Aly, Francois Delyon, Fréderic Alauzet, ”Magnetic cage and rope as the key for solar eruptions,” Nature Letter, Vol. 554, pp: 211–215 , doi:10.1038/nature24671, Published online: 08 February 2018, URL of abstract: https://www.nature.com/articles/nature24671
7) ”From Hot to Hottest,” NASA, Nov. 1, 2017, URL: https://www.nasa.gov
/image-feature/from-hot-to-hottest
8) ”NASA’s SDO Sees Partial Eclipse in Space,” NASA, May 26, 2017, URL: https://www.nasa.gov/feature/nasa-s-sdo-sees-partial-eclipse-in-space
9) ”Solar Storms Can Drain Electrical Charge Above Earth,” NASA/JPL News, April 10, 2017, URL: https://www.jpl.nasa.gov/news/news.php?release=2017-103
10) Tibor Durgonics, Attila Komjathy, Olga Verkhoglyadova, Esayas B. Shume, Hans-Henrik Benzon, Anthony J. Mannucci, Mark D. Butala, Per Høeg, Richard B. Langley , ”Multiinstrument observations of a geomagnetic storm and its effects on the Arctic ionosphere: A case study of the 19 February 2014 storm,” Radio Science, Volume 52, Issue 1, January 25, 2017, pp: 146–165, DOI: 10.1002/2016RS006106
11) Lina Tran, ”NASA’s SDO Sees a Stretch of Spotless Sun,” NASA, March 22, 2017, URL: https://www.nasa.gov/image-feature/goddard/2017/nasa-s-sdo-sees-a-stretch-of-spotless-sun
12) Lina Tran, ”NASA’s SDO Performs Calibration Maneuvers,” NASA, Nov. 3, 2016, URL: https://www.nasa.gov/feature/goddard/2016/nasa-s-mms-breaks-guinness-world-record
13) Sarah Frazier, ”Tracking Waves from Sunspots Gives New Solar Insight,” NASA, Oct. 20, 2016, URL: https://www.nasa.gov/feature/goddard/2016/tracking-waves-from-sunspots-gives-new-solar-insight
14) Junwei Zhao, Tobías Felipe, Ruizhu Chen, Elena Khomenko, ”Tracing p-mode waves from the photosphere to the corona in active regions,” The Astrophysical Journal Letters, Vol. 830, No 1, published on Oct. 11, 2016
15) Sarah Frazier, ”Seeing Double: NASA Missions Measure Solar Flare from 2 Spots in Space,” NASA, April 19, 2016: URL: http://www.nasa.gov/feature/goddard/2016
/seeing-double-nasa-missions-measure-solar-flare-from-2-spots-in-space
16) ”Queen's University Belfast lead research milestone in helping predict solar flares,” Queen's University Belfast, Nov. 16, 2015, URL: http://www.qub.ac.uk/home/ceao/News/Title,539712,en.html
17) David B. Jess, Veronika E. Reznikova, Robert S. I. Ryans, Damian J. Christian, Peter H. Keys, Mihalis Mathioudakis, Duncan H. Mackay, S. Krishna Prasad, Dipankar Banerjee, Samuel D. T. Grant, Sean Yau, Conor Diamond, ”Solar coronal magnetic fields derived using seismology techniques applied to omnipresent sunspot waves,” Nature Physics Letter, Nov. 16, 2015, doi:10.1038/nphys3544, URL: http://tinyurl.com/pe225va
18) Sarah Frazier, “NASA's SDO Catches a Double Photobomb,” NASA, Sept. 2015, URL: http://www.nasa.gov/feature/goddard/nasas-sdo-catches-a-double-photobomb
19) Charles Day, “The Sun's tilted axes,” Physics Today, August 31, 2015, URL: http://scitation.aip.org/content/aip/magazine/physicstoday/news/10.1063/PT.5.7199
20) A. Pastor Yabar, M. J. Martínez González, M. Collados, “Where are the solar magnetic poles?,” MNRAS (Monthly Notices Letters of the Royal Astronomical Society) Vol. 453, L69-L72, Oct. 11, 2015, doi:10.1093/mnrasl/slv108, First published online August 22, 2015
21) “NASA Response to the 2015 Senior Review for Heliophysics Operating Missions,” NASA, July 10, 2015, URL: http://science.nasa.gov/media/medialibrary/2015/07/10/NASAResponse2015SeniorReview_FINAL.pdf
22) “The 2015 Senior Review of the Heliophysics Operating Missions, NASA, June 11, 2015, URL: http://science.nasa.gov/media/medialibrary/2015/07/10/HeliophysicsSeniorReview2015_FINAL.pdf
23) Karen C. Fox, “NASA's SDO Observes 'Cinco de Mayo' Solar Flare,” NASA, May 6, 2015, URL: http://www.nasa.gov/feature/goddard/nasas-sdo-observes-cinco-de-mayo-solar-flare
24) Dean Pesnell, “Happy 5th Birthday to SDO Science Data!,” May 1, 2015, URL: http://sdoisgo.blogspot.de/2015/05/happy-5th-birthday-to-sdo-science-data.html
25) Holly Zell, “X2 Flare Erupts,” NASA, March 17, 2015, URL: http://www.nasa.gov/content/goddard/sdo/potw605-x2-flare-erupts/#.VRAbw-H-b_U
26) Karen C. Fox, “New Videos Highlight NASA SDO's Fifth Anniversary;” NASA/GSFC, Feb. 11, 2015, URL: http://www.nasa.gov/content/goddard/videos-highlight-sdos-fifth-anniversary/#.VN828i7-Y_c
27) Karen C. Fox, “Telescope on NASA’s SDO Collects Its 100-Millionth Image,” NASA, Jan. 20, 2015, URL: http://www.nasa.gov/content/goddard/sdo-telescope-collects-its-100-millionth-image/#.VMCNZS7-b_U
28) “NASA's SDO Sees 2 Solar Flares,” NASA, June 10, 2014, URL: http://www.nasa.gov/content/goddard/nasas-sdo-sees-a-summer-solar-flare/#.U5dZEfldXng
29) Karen C. Fox, “Bright Points in Sun's Atmosphere Mark Patterns Deep In Its Interior,” NASA, April, 17, 2014, URL: http://www.nasa.gov/content/goddard/bright-points-mark-patterns-inside-sun/#.U15SiqKegkA
30) Scott W. McIntosh, Xin Wang, Robert J. Leamon, Philip H. Scherrer, “Identifying potential markers of the sun's giant convective scale,” Astrophysical Journal Letters, Vol. 784, No 2, April 2014, doi:10.1088/2041-8205/784/2/L32
31) Karen C. Fox, “NASA telescopes coordinate best-ever flare observations,” NASA. May 7, 2014, URL: http://www.nasa.gov/content/goddard
/nasa-telescopes-coordinate-best-ever-flare-observations/#.U2sygqKegkA
32) Karen C. Fox, “NASA Releases Images of X-class Solar Flare,” NASA, March 31, 2014, URL: http://www.nasa.gov/content/goddard/nasa-releases-images-of-x-class-solar-flare/#.U2s1IqKegkA
33) Bob King, “A Secret Solar Eclipse from Outer Space,” Universe Today, January 30, 2014, URL: http://www.universetoday.com/108772/a-secret-solar-eclipse-from-outer-space/
34) Karen C. Fox, “NASA's SDO Sees Giant January Sunspots,” NASA, Jan. 07, 2014, URL: http://www.nasa.gov/content/goddard/giant-january-sunspots/#.Us-lXPuFf_o
35) “Sounding Rocket Calibrates NASA's SDO Instrument,” Space Travel. Oct. 23, 2013, URL: http://www.space-travel.com/reports/Sounding_Rocket_Calibrates_NASAs_SDO_Instrument_999.html
36) “2013-05-15 02:23 UTC Another R3 From 1748,” NOAA Space Weather Prediction Center, May 15, 2013, URL: http://www.swpc.noaa.gov/
37) May 15, 2013, URL: http://spaceweather.com/
38) “HMI Roll Maneuver, April 3, 2013,” URL: http://sdoisgo.blogspot.de/
39) Nancy Atkinson, “Solar Spacecraft Gets a Little Loopy,” Universe Today, April 4, 2013, URL: http://www.universetoday.com/101244/solar-spacecraft-gets-a-little-loopy/
40) Karen C. Fox, “Year Three: NASA SDO Mission Highlights,” NASA, Feb. 11, 2013, URL: http://www.nasa.gov/mission_pages/sdo/news/sdo-year3.html
41) Tony Phillips, “Solar Variability and Terrestrial Climate,” NASA, Jan. 8, 2013, URL: http://science.nasa.gov/science-news/science-at-nasa/2013/08jan_sunclimate/
42) “SDO Goes For a Spin,” NASA, April 5, 2012, URL: http://www.nasa.gov
/mission_pages/sdo/news/sdo-roll6.html
43) http://www.nasa.gov/mission_pages/sdo/main/index.html
44) Karen C. Fox, “Something New On the Sun: SDO Spots a Late Phase in Solar Flares,” NASA/GSFC, Sept. 7, 2011, URL: http://www.nasa.gov/mission_pages/sdo/news/late-phase-flares.html
45) “NASA spacecraft carrying CU-Boulder instruments observes new characteristics of solar flares,” Space Daily, Sept. 9, 2011, URL: http://www.spacedaily.com/reports/NASA_spacecraft_
carrying_CU_Boulder_instruments_observes_new_characteristics_of_solar_flares_999.html
46) http://www.nasa.gov/mission_pages/sdo/news/news20110111-corona-hole.html
47) Tony Phillips, “Global Eruption Rocks the Sun,” Dec. 13, 2010, URL: http://science.nasa.gov
/science-news/science-at-nasa/2010/13dec_globaleruption/
48) “Solar Scientists Discover Physical Mechanism Behind Sympathetic Flares,” Space Daily, Dec. 15, 2010, URL: http://www.spacedaily.com/reports
/Solar_Scientists_Discover_Physical_Mechanism_Behind_Sympathetic_Flares_999.html
49) “Near-Synchronous Explosions Connect Across the Vast Distances on the Sun,” Universe Today, Dec. 15, 2010, URL: http://www.universetoday.com/81668
/near-synchronous-explosions-connect-across-the-vast-distances-on-the-sun/
50) “NASA's Solar Dynamics Observatory Begins its Five-Year Mission of Discovery,” May 17, 2010, URL: http://www.nasa.gov/mission_pages/sdo/news/mission-begins.html
51) “SDO Day 93: SDO Becomes an Operating Mission,” May 14, 2010, URL: http://sdo.gsfc.nasa.gov/mission/project/leostatus.php
52) “Spacecraft Reveals Small Solar Events Have Large Scale Effects,” May 25, 2010, URL: http://www.nasa.gov/mission_pages/sdo/news/solar-events-release.html
53) Tony Phillips, “SDO Observes Massive Eruption, Scoring Rain,” NASA, April 27, 2010, URL: http://science.nasa.gov/science-news/science-at-nasa/2010/27apr10_plasmarain/
54) Tony Phillips, “First Light for the Solar Dynamics Observatory,” April 21, 2010, URL: http://science.nasa.gov/science-news/science-at-nasa/2010/21apr_firstlight/
The information compiled and edited in this article was provided by Herbert J. Kramer from his documentation of: ”Observation of the Earth and Its Environment: Survey of Missions and Sensors” (Springer Verlag) as well as many other sources after the publication of the 4th edition in 2002. - Comments and corrections to this article are always welcome for further updates (herb.kramer@gmx.net).