Nimbus-7
EO
Atmosphere
Ocean
Cloud type, amount and cloud top temperature
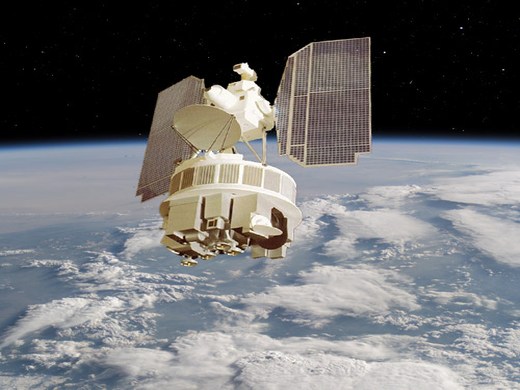
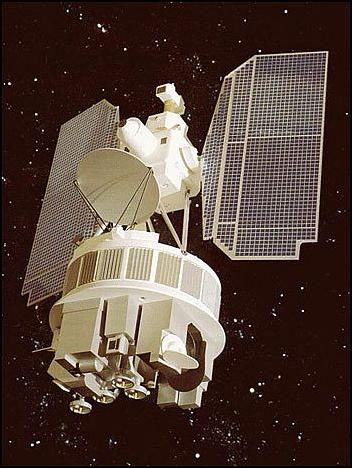
Launched in October 1978, Nimbus-7 was the seventh and final mission in the Nimbus series of research and development satellites designed and developed collaboratively by the National Aerospace and Space Administration (NASA) and the National Oceanic and Atmospheric Administration (NOAA). Nimbus-7 served as a stabilised platform for the testing of advanced systems for sensing and collecting data in atmospheric, oceanographic and meteorological disciplines until October 1994.
Quick facts
Overview
| Mission type | EO |
| Agency | NASA |
| Mission status | Mission complete |
| Launch date | 14 Apr 1969 |
| End of life date | 22 Jan 1972 |
| Measurement domain | Atmosphere, Ocean, Snow & Ice |
| Measurement category | Cloud type, amount and cloud top temperature, Atmospheric Temperature Fields, Ocean colour/biology, Aerosols, Atmospheric Humidity Fields, Ozone, Trace gases (excluding ozone), Sea ice cover, edge and thickness, Atmospheric Winds |
| Measurement detailed | Cloud top height, Aerosol absorption optical depth (column/profile), Color dissolved organic matter (CDOM), Aerosol Extinction / Backscatter (column/profile), Atmospheric specific humidity (column/profile), O3 Mole Fraction, Atmospheric temperature (column/profile), CH4 Mole Fraction, NO2 Mole Fraction, Sea-ice cover, BrO (column/profile), Sea-ice type, Glacier cover, Wind profile (vertical), Sea-ice surface temperature, Sea-ice Concentration |
| Instruments | TOMS, SAGE II, LIMS, IRIS, BUV, SAMS, CZCS, SMMR, LRIR, SBUV/1 |
| Instrument type | Atmospheric chemistry, Imaging multi-spectral radiometers (passive microwave), Atmospheric temperature and humidity sounders |
| CEOS EO Handbook | See Nimbus-7 summary |
Summary
Mission Capabilities
As a research and development satellite for NASA, Nimbus-7 carried nine instruments to test and collect data on many different aspects of Earth’s atmosphere, ocean and cryosphere. The Coastal Zone Colour Scanner (CZCS) was a multichannel scanning radiometer for ocean colour measurements, while the Scanning Multispectral Microwave Radiometer (SMMR) was a ten channel scanning radiometer used to measure microwave brightness temperatures and near-surface winds. SMMR was also able to measure global sea-ice concentrations and type, snow cover, soil moisture, atmospheric water vapour over oceans and rainfall. The Earth Radiation Budget (ERB) experiment featured a 22 channel radiometer to determine the Earth energy balance and thus the radiation budget on both synoptic and planetary scales by simultaneously measuring the incoming solar radiation and the outgoing Earth reflected and emitted radiation.
The Solar/Backscatter Ultraviolet Spectrometer (SBUV) and Total Ozone Mapping Spectrometer (TOMS) mapped the total ozone in the stratosphere and troposphere. SBUV consisted of a double Ebert-Fastie spectrometer which determined the vertical distribution of ozone, solar ultraviolet irradiance and ultraviolet radiation backscatter from Earth, while TOMS was a single Ebert-Fastie spectrometer which also mapped sulphur dioxide and aerosols in the stratosphere and troposphere. The Stratospheric Aerosol Measurement II (SAM-II) experiment was a sun photometer that viewed a small portion of the sun’s ray through the Earth’s atmosphere during sunrise and sunset which also mapped global concentrations of aerosols in the stratosphere and troposphere as well as the distribution of particles in the troposphere. The Limb Infrared Monitor of the Stratosphere (LIMS) was a six channel infrared radiometer that viewed Earth’s limb to map the vertical profiles of temperature and the concentration of ozone, water vapour, nitrogen dioxide and nitric acid in the lower to middle stratosphere while the Stratospheric and Mesospheric Sounder experiment (SAMS) was an infrared spectrometer that measured the global vertical gas concentrations and temperatures in the mesosphere and stratosphere by viewing radiation from the limb of the atmosphere. The Temperature/Humidity Infrared Radiometer (THIR) was an infrared radiometer designed to measure surface and cloud-top temperatures as well as the water vapour in the upper atmosphere.
Performance Specifications
CZCS was a multispectral whiskbroom radiometer with six spectral bands utilising a rotation plane mirror at a 45° angle to the optical axis of a Cassegrain telescope. The six spectral bands were used to measure different parameters of the ocean: chlorophyll absorption was measured using the band between 0.433 and 0.453 µm while chlorophyll absorption was measured in the band 0.51- 0.53 µm. Gelbstoff concentration, which is an indicator of salinity concentration was measured in the band 0.54-0.56 µm, aerosol absorption used the band 0.66-0.68 µm while land and cloud detection was using the band 0.7-0.8 µm and total internal reflection and surface temperature used the band between 10.5-12.5 µm. CZCS had a swath width of 1556 km for all of these measurements.
Nimbus-7 was in a sun-synchronous orbit with an orbital inclination of 104.09°, an altitude of 943 km and an orbital period of 99.28 minutes.
Space and Hardware Components
Nimbus-7 was designed and developed collaboratively by the General Electric corporation (GE) and the Radio Corporation of America (RCA) astro-electrics division. GE was responsible for the spacecraft structure and attitude control system as well as integration of the observatory, while RCA was responsible for the spacecraft power systems, spacecraft camera systems and the spacecraft communication electronics. The Nimbus class of satellite was for many satellite technologies including Earth-centred three-axis active stabilisation controls, sun tracking solar arrays, high-rate data storage systems, and active thermal control systems.
The mission was a success and led the way for further satellites with similar experiments to those tested on Nimbus-7. The satellite ceased operations in 1994 however many of its instruments were shut down in the years earlier as planned. LIMS had the shortest lifespan, lasting only 9 months after launch as it was turned off due to depletion of cryogen in 1979.
Nimbus-7
Overview Spacecraft Launch Mission Status Sensor Complement References
Nimbus is a NASA meteorological research-and-development satellite program (parallel to the operational TIROS program) which started in 1963 with the prime objective to test new instrument concepts (introduction of sensor technology), a secondary objective was to provide atmospheric data for improved weather forecasts. Eventually, the series grew into a major Earth sciences program (study of oceans, land surfaces and atmosphere) with the availability of better sensing instrumentation. The ERTS (Earth Resources Technology Satellite, later renamed to Landsat-1) program, developed in the early 1970s, is a direct descendent of the Nimbus program.
Application:
- Oceanography, pollution of the atmosphere, meteorology;
- measurement of trace gases and particles in the atmosphere;
- distribution phenomena of air pollution;
- observation of the ocean surface colour and of the temperature;
- ice observation, in particular in the coastal regions.
The original Nimbus satellite design life expectancy was 6 months. Due to the increased understanding of the impact of the space environment that led to improved space-hardened electrical components and lubrication techniques, the application of more conservative electrical designs, and the incorporation of redundancy of critical components, the lifetime expectancy for the later satellites increased to five years.
Background
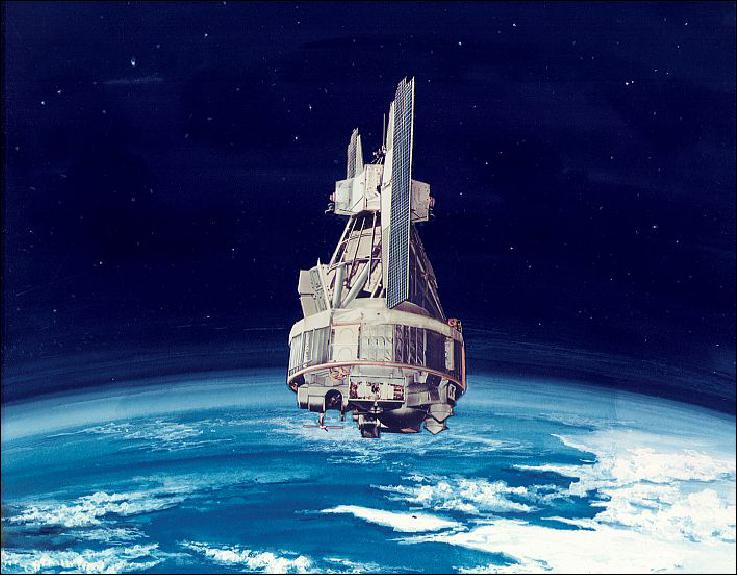
Over the Nimbus Project's thirty-year history, the satellites increased the scientific community's knowledge of the Earth's atmosphere, land surface and ecosystems, weather, and oceanography. When Nimbus-1 launched in 1964, it gave meteorologists their first global images of clouds and large weather systems. By the time the Nimbus-2 mission went into orbit in 1966, the sensors onboard were sophisticated enough to measure the temperature of the ocean. Nimbus-3 in 1969 added atmospheric temperature observations and the ability to measure solar radiation above the atmosphere. In 1970, Nimbus-4 began collecting the first global observations of the ozone layer, and by 1972, scientists and engineers had incorporated into Nimbus-5 the capability to measure rainfall over the world's oceans and to map and monitor sea ice. Taking the atmosphere's temperature became more sophisticated with Nimbus-6 in 1975, which gave scientists the first satellite-based measurements of atmospheric temperature at different altitudes.
The final mission, Nimbus-7, which was launched in 1978, collected data on ozone, the stratosphere, ocean conditions, and global weather until 1994. Nimbus-7 ceased operations in 1995.
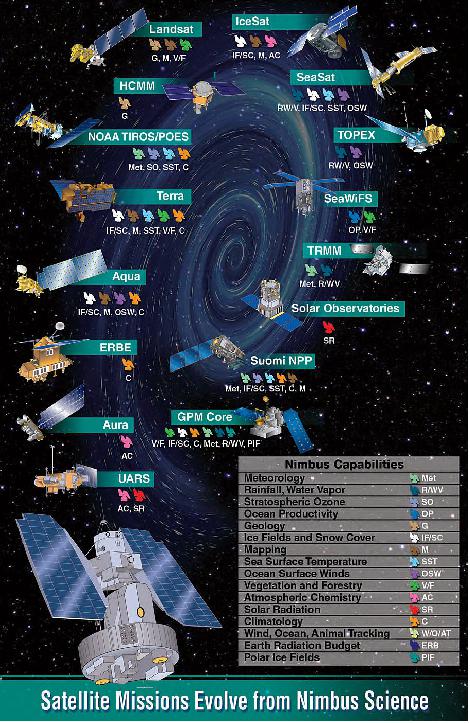
NASA transferred the technology tested and refined by the Nimbus missions to the National Oceanic and Atmospheric Administration (NOAA) for its operational satellite instruments. The technology and lessons learned from the Nimbus missions are the heritage of most of the Earth-observing satellites NASA and NOAA have launched over the past three decades. Even today, scientists use data from the Nimbus missions to study the Earth system and climate change. 1) 2)
Spacecraft | Launch date | End of Operation | Sensor complement/experiment flown |
Nimbus-1 | Aug. 28, 1964 | 1964 | AVCS (Advanced Vidicon Camera System), APT (Automatic Picture Transmission), HRIR |
Nimbus-2 | May 15, 1966 | Jan. 17, 1969 | AVCS, APT, HRIR, MRIR |
Nimbus-3 | Apr. 14, 1969 | Jan. 23, 1972 | MRIR, HRIR, IRIS, SIRS, IDICS, IRLS, MUSE |
Nimbus-4 | Apr. 8, 1970 | Sept. 30, 1980 | IDICS, THIR, IRIS, SIRS, MUSE, BUV (Backscatter UV Spectrometer), FWS, SCR, IRLS |
Nimbus-5 | Dec. 11, 1972 | 1973 | ITPR, SCR, NEMS, ESMR, SCMR, THIR |
Nimbus-6 | June 12, 1975 | 1983 | ERB (Earth Radiation Budget), ESMR, HRIS, LRIR, PMR, SAMS, THIR, TWERLE, T&DRE, |
Nimbus-7 | Oct. 24, 1978 | 1995 | CZCS, ERB, LIMS, SAM-II, SAMS, SBUV/TOMS, SMMR, THIR |
A major success factor in the Nimbus Program was the effective 20-year partnership that existed between the government managers and engineers that managed the program and the over 40 industrial companies that built the satellite equipment and instruments. Designs met performance requirements, individual element schedules were adhered to without impact on the overall integration schedule, and costs came in at or below the rather slim cost estimates for the challenging deliverables.
Two companies were major participants in the Observatory design and development effort. The General Electric Corporation in King of Prussia, PA built the spacecraft structure and the attitude control system integrated the Observatory and conducted the critical, complex environmental testing that validated the Observatory's readiness for launch. The RCA Corporation Astro-Electronics Division in East Windsor, NJ built the spacecraft power systems, spacecraft camera systems, spacecraft communication electronics, high data rate tape recorders, the ground RF signal demultiplexers, and the ground system for converting the visible camera electrical signals into film pictures. A General Electric team of engineers, technicians, and software programmers operated the Nimbus Control Center for thirty years (Ref. 2).
Technology firsts | - Earth-centered 3-axis active stabilization control system |
Instrument firsts | - Slow read-out Vidicon camera (APT system); Local cloud cover |
Programmatic firsts | - Sensory ring design that allowed for easy replacement of boxes in subsequent satellite designs, lowered design and integration cost of follow-on new Nimbus S/C and Landsat S/C |
On October 8, 2014, NASA remembered the first Earth observations on the 50th anniversary of the launch of Nimbus-1 on Aug. 28, 1964. Nimbus-1 was the first of seven Earth-observing satellites in a series that spanned 30 years. 3) 4)
Named after the Latin word for "rain cloud", the Nimbus satellites were a series of seven Earth-observation satellites launched over a 14-year time period from 1964 to 1978, one of which did not achieve orbit. In total, the satellites provided Earth observations for 30 years and collectively carried a total of 33 instruments, including ozone mappers, the Coastal Zone Color Scanner instrument and microwave and infrared radiometers.
These satellites revolutionized weather forecasting to accomplish accurate long-term forecasts and demonstrated location and related search-and-rescue technology. They provided some of the first consistent global measurements of Earth, such as sea measurements, oceanic plant life and the ozone layer.
Nimbus paved the way for future Earth-observing systems such as Aqua, Terra, Aura, Landsat, Sea-Viewing Wide Field-of-View Sensor (SeaWiFS), Tropical Rain Measuring Mission and many more. In celebration of the 50th anniversary of the first Nimbus satellite's launch in 1964, NASA takes a look at some, but certainly not all, of the "first-ever" observations from the Nimbus satellites.
• At a press conference held five days after that first Nimbus launch, William Nordberg, Project Scientist for Nimbus-1–3, said: "The future meteorological satellite programs will move from cloud mapping to measuring parameters of the atmosphere such as temperature profiles, pressure, and winds. We will put all these parameters into a model and run it in a huge computer to grind out the prediction of what the weather is going to be."
Nimbus program firsts:
• First to provide daylight and night-time pictures of intense hurricane clouds viewed from space, which initiated the use of satellite technology to provide hurricane warnings.
• First to measure ozone columns and profiles from space, which led to the first confirmation of the ozone hole and the documentation of the recurrence of the hole every year during the southern-hemisphere springtime.
• First to provide quantitative data on the size of volcanic eruptions by measuring sulfur dioxide, a unique tracer of volcanic eruptions. This led the path for other volcanic ash cloud tracking instruments such as the Ozone Monitoring Instrument.
• First to provide extensive global observations of spectral signatures of ice that indicate the age of the sea ice and first to provide snow depth and snow accumulation rates over the Arctic and Antarctica. This paved the way for other NASA satellites such as Aqua and Terra.
• First to provide global, direct observations of the amount of solar radiation entering and exiting Earth's system. This helped to confirm and improve the earliest climate models and laid the groundwork for Cloud and the Earth's Radiant Energy System (CERES) instruments on NASA's Terra and Aqua satellites and now on Suomi National Polar-orbiting Partnership satellite.
• First to create a map of the global distribution of photosynthetic organisms, such as phytoplankton, in the world's oceans from space. This helped scientists understand the ocean's role in the exchange of carbon around the world and led the way for missions such as SeaWiFS, Aqua and Terra.
• First microwave devices to distinguish rain over the ocean and between snow and ice in polar areas.
• First capability to globally measure the temperature in a planetary atmosphere quantitatively and qualitatively from space. This paved the way for instruments on NASA's Voyager, Cassini, Aqua and Terra.
• First to map topography and Earth's mineral resources from space, which laid the groundwork for similar instruments on Earth-observing mapping satellites such as Landsat.
• First satellite to reveal an ice-free opening in the Antarctica ice pack. This patch of open water called a polynya appeared during the winters of 1974-76 in the Weddell Sea and has not been observed since.
• First meteorological satellites to provide day and night local area coverage every 24 hours, repeated at the same time daily. This sun-synchronous orbit became the norm for satellites.
• First solar panels on a satellite that track the sun during the daylight portion of an orbit, an advancement adapted to many of today's satellites. This sun-tracking arrangement allows the solar panels to harness more power than if the solar cells were fixed to the spacecraft body.
• Demonstrated the first technology that allowed satellites to track the movements of people, animals and items on Earth. This paved the way for GPS technology and international search and rescue satellite-aided tracking programs.
A Summary of the Nimbus' Program Key Achievements:
One of the authorities on the history of Nimbus is Ralph Shapiro, who was the operations manager for the Nimbus Program from 1963 to 1981. When asked to comment on Nimbus for The Earth Observer, Shapiro listed some of Nimbus' scientific achievements. While not intended to be comprehensive, his list does give a sense of the wide range of science that Nimbus instruments were used to investigate.
Specifically, Shapiro mentioned: 4)
• Nimbus three-dimensional global datasets of diverse meteorological data, which, for the first time, enabled accurate two-to-three-day global weather forecasts to become available, confirmed by the international year-long First Global GARP Experiment (FGGE) in 1978-79.
- GARP (Global Atmospheric Research Program) was a fifteen-year international research program that began in 1967 and organized several important field experiments, including the First Global GARP Experiment (FGGE), which later became known as the Global Weather Experiment. Data from these experiments led to significant advances in the field of numerical weather prediction.
• The Total Ozone Mapping Spectrometer (TOMS) onboard Nimbus-7 validated the presence of a large ozone hole in the Antarctic stratosphere and raised awareness of this public health concern, leading to the Montreal Protocol that banned the use of chlorofluorocarbons (CFCs). This discovery was so significant to human health that a similar satellite ozone-measuring device has been flown continuously on several platforms ever since.
• The ability to locate a device anywhere on Earth using Nimbus instruments demonstrated the efficacy of satellite-based location software that led to the satellite GPS (Global Positioning System) and the ongoing international COSPAS-SARSAT satellite system that is used to locate missing boats and downed small aircraft—credited with saving the lives of several hundred people, annually.
- COSPAS is a Russian acronym: Cosmicheskaya Sistema Poiska Avariynyh Sudov, which translates to Space System for the Search of Vessels in Distress; SARSAT stands for Search and Rescue Satellite Aided Tracking.
• Nimbus instruments provided the initial climatology data for measuring global energy balance that subsequent missions have continued to build upon to the present day.
• Nimbus measured oceanographic characteristics and terrestrial resources and conducted land mapping, rain, stratospheric chemistry, and polar ice measurements. These data provided many commercial benefits and led to many NASA follow-on satellite programs (Figure 2).
Instrument Name | Instrument Measurements/Application | Flown on Nimbus |
APT (Automatic Picture Taking) | High-resolution visible pictures; slow readout | 1, 2 |
AVCS (Advanced Vidicon Camera System) | High-resolution visible pictures; full swath coverage | 1, 2 |
BUV (Backscatter Ultraviolet Spectrometer) | Atmospheric ozone profile measurements | 4 |
CZCS (Coastal Zone Color Scanner) | Ocean colour measurements to determine oceanic constituents; ocean temperature; ocean productivity | 7 |
ERB (Earth Radiation Budget) | Incoming and outgoing radiation measurements for Earth energy balance studies | 6, 7 |
ESMR (Electrically Scanning Microwave Radiometer) | Microwave spectrum radiation measurements; global sea ice concentrations, snowcover, water vapour, and rainfall | 5, 6 |
FWS (Filter Wedge Spectrometer) | Measure vertical distribution of water vapour and carbon dioxide | 4 |
HIRS (High-Resolution Infrared Spectrometer) | Full-swath atmospheric temperature profiles | 6 |
HRIR (High-Resolution Infrared Radiometer) | Daytime/nighttime global cloud cover — full swath | 1, 2, 3 |
IDCS (Image Dissector Camera System) | Daytime cloud cover with slow readout capability | 3, 4 |
IRIS (Infrared Interferometer Spectrometer) | Vertical profiles of temperature, water vapour, ozone, and chemical species; interferograms/spectral measurements | 3, 4 |
IRLS (Interrogation, Recording, Location System) | Determines platform location, collects data | 3, 4 |
ITPR (Infrared Temperature Profile Radiometer) | Atmospheric vertical temperature profiles | 5 |
LIMS (Limb Infrared Monitoring of the Stratosphere) | Views Earth's limb; stratospheric temperature, ozone, water vapour, nitric oxide, nitrogen dioxide | 7 |
LRIR (Limb Radiance Inversion Radiometer) | Views Earth's limb; temperature, ozone, and water vapour profiles from the lower atmosphere to stratosphere | 6 |
MRIR (Medium-Resolution Infrared Radiometer) | Measures Earth's reflected and emitted radiation | 2, 3 |
MUSE (Monitor of Ultraviolet Solar Energy) | Measures solar radiation not viewed from Earth | 3, 4 |
NEMS (Nimbus Experiment Microwave Spectrometer) | Atmospheric temperature profiles in the presence of clouds; multispectral observations producing oceanic humidity and cloud water, sea-ice age, snow depth, and snow accumulation rates over Antarctica. | 5 |
PMR (Pressure Modulated Radiometer) | Stratospheric temperature and chemical species | 6 |
RTG (Radioisotope Thermoelectric Generator) | Nuclear material electric power generation from nuclear material heat generation | 3 |
SAM-II (Stratospheric Aerosol Measurement II) | Map global concentrations of aerosols and optical properties in the stratosphere and troposphere | 7 |
SAMS (Stratospheric and Mesospheric Sounder) | Gas concentrations and temperature profiles in the stratosphere and mesosphere | 7 |
SBUV (Solar/Backscatter Ultraviolet Spectrometer) | Measures solar irradiance; ozone profile measurements in the lower atmosphere | 7 |
SCAMS (Scanning Microwave Spectrometer) | Temperature profiles, oceanic humidity, and rain; global imagery characterizing fronts and hurricanes | 6 |
SCMR (Surface Composition Mapping Radiometer) | Earth mapping; identification of surface minerals | 5 |
SCR (Selective Chopper Radiometer) | Temperatures of six layers of the atmosphere | 4, 5 |
SIRS (Satellite Infrared Radiometer Spectrometer) | Atmospheric temperature profiles | 3, 4 |
SMMR (Scanning Multi-channel Microwave Radiometer) | Global sea-ice concentrations and type (age) and sea surface temperatures; sea surface winds; snowcover; soil moisture; atmospheric water vapour over oceans; and rainfall | 7 |
T&DRE (Tracking and Data Relay Experiment) | Data transmission from satellite to ground station through a geosynchronous satellite; develops satellite ephemeris through communication link range and range rate information | 6 |
THIR (Temperature/Humidity Infrared Radiometer) | Daytime/nighttime global cloud cover and water vapour mapping | 4, 5, 6, 7 |
TOMS (Total Ozone Mapping Spectrometer) | Maps of total ozone in the stratosphere and troposphere, sulfur dioxide, and aerosols; volcanic ash cloud tracking | 7 |
TWERLE/RAMS (Tropical Wind Energy Level Conversion and Reference Level Experiment/Random Access Measurement System) | Equatorial wind studies; animal tracking; platform locations; data collection; radio frequency reception from up to 200 platforms | 6 |
Spacecraft | N1 | N2 | N3 | N4 | N5 | N6 | N7 |
Number of experiments | 3 | 4 | 9 | 9 | 6 | 9 | 9 |
Number of spectral channels | 3 | 8 | 28 | 43 | 34 | 62 | 79 |
Spectral region observed | |||||||
Visible | x | x | x | x | x | x | x |
Infrared | x | x | x | x | x | x | x |
Far Infrared |
| x | x | x | x | x | x |
Ultraviolet |
|
| x | x |
|
| x |
Microwave |
|
|
|
| x | x | x |
Spacecraft
Initial design:
The GSFC Nimbus Project, initially established as an R&D Project, was tasked to build the Nimbus spacecraft to serve as the ESSA (Environmental Satellite Service Administration) operational spacecraft replacing the TIROS experimental meteorological satellites operated by ESSA. ESSA helped fund the Nimbus development. The Project was reverted to the NASA Earth remote sensing research Project in 1963 after development failures induced ESSA to drop their support of the Nimbus Program (Ref. 2).
Nimbus, named after the Latin word for rain cloud, was originally conceived as a GSFC in-house satellite Development Project. Bill Stroud led the Project development that started in 1959. John Licht was the designer of the Nimbus spacecraft architecture: Earth viewing, an attitude control concept for achieving three-axis stabilization, (previous spacecraft were spin stabilized.), solar panels that tracked the sun, and a platform structure (sensory ring) with compartments designed to accommodate new configurations that housed instruments and electronic boxes. Rudolf Stampfl was the system designer who conceived the spacecraft bus concepts and the active cooling system for the electronics and small instruments installed in the sensory ring. The complex attitude control system that applied a combination of 3-axis reactive momentum wheels and the inherent gravity-gradient stabilization to provide 1o 3-axis attitude control with low jitter represented a major development challenge. This fine attitude control requirement was necessary to be able to accurately locate the high-resolution scientific data that was planned. A large three-axis stabilized air-bearing platform was conceived for dynamic testing of the attitude control system (Ref. 2).
The General Electric (GE) Company in King of Prussia, PA was contracted to develop, build, and test the attitude control system. GE was also contracted to build the structure and serve as the Observatory integration and test contractor.
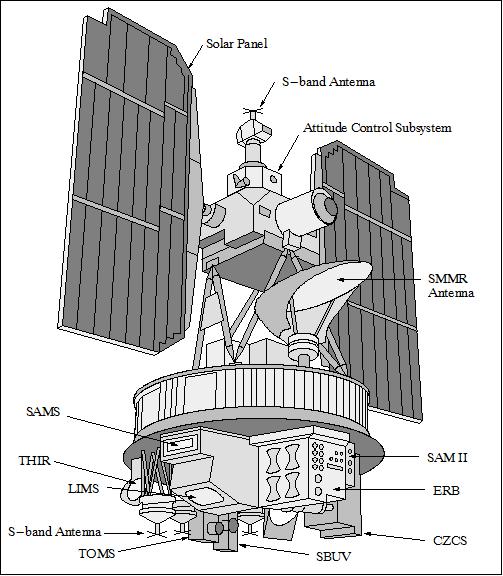
Eventually, all Nimbus series S/C was built and integrated by GE. The RCA Corporation built spacecraft power systems, cameras, communication electronics, and high data rate/volume tape recorders (3). The basic Nimbus series spacecraft structure is butterfly-shaped (some call it `ocean-buoy shaped') when deployed in orbit, designed to serve as a 3-axis stabilized, Earth-oriented platform.
It consisted of three major elements:
1) a sensory ring,
2) two solar paddles,
3) the control system housing. 5) 6) 7) 8) 9)
The solar paddles and the control system housing were connected to the sensory ring by a truss structure. The Nimbus-7 S/C was 3.04 m tall, 1.52 m in diameter at the base, and 3.96 m wide with the solar paddles extended. The sensory ring at the base of the satellite housed the electronic equipment and battery modules. The lower surface of the sensory ring provided mounting space for sensors and telemetry antennas. An H-frame structure mounted within the centre of the torus provided support for the larger sensors and tape recorders.
The ACS (Attitude Control Subsystem) provided stabilization about the spacecraft's roll, pitch, and yaw axes and control of the solar paddles' orientation, maintaining them nearly perpendicular to the nominal sun-line. The ACS consisted of four attitude control loops and associated switching logic, telemetry and test modes, electrical manifolding, and thermal environmental control. This system maintained spacecraft alignment with the local orbital reference axes to within 0.7o of the pitch axis and 1o of the roll and yaw axes. The system kept the instantaneous angular rate changes about any axis to less than 0.01o/s. The three-axis active ACS used horizon scanners for roll and pitch attitude error sensing. The rate gyros sensed yaw rate and, in a gyro compassing mode, sensed yaw attitude. A torquing system used a combination of reaction jets to provide spacecraft momentum control and large control torques when required; flywheels were utilized for fine control and residual momentum storage.
The spacecraft power system consisted of solar arrays with nickel-cadmium (NiCd) batteries, providing regulated power of which approximately 186 W (orbit-averaged) was available to the instrument payload. The S/C had a wet mass of 965 kg (832 kg on-orbit dry mass).
The structure and thermal control system designs proved to be extremely effective in support of the multi-mission Nimbus program that materialized. It accommodated seven different instrument manifests (as many as 9 instruments per spacecraft) with minimum structural changes while providing the required viewing and thermal control requirements.
After the first spacecraft, this provided an extremely favourable payload-to-spacecraft funding ratio compared to other spacecraft programs; on Nimbus-7 with a new complex instrument mission, it was 1.6 compared to 0.2-0.5 for typical new spacecraft programs. This accommodative Nimbus platform enabled the new "Earth Resources" Landsat satellite program to be undertaken with low platform development costs. Landsats 1, 2, and 3, which demonstrated the utility of what became major NASA and commercial satellite programs, used the Nimbus structure and the temperature control, power, attitude control, telemetry, and command subsystems for its platform.
The original Nimbus satellite design life expectancy was 6 months. (Nimbus-1 lasted 28 days, but Nimbus-2 and 3 actually operated for 2 1/2 years.) An increased understanding of the impact of the space environment on the satellite components led to improved space-hardened electrical components and improved lubrication techniques. Starting with Nimbus-4, the incorporation of these measures, the application of more conservative electrical designs, and the incorporation of redundancy of critical components increased the life expectancy for the later satellites to five years. The spacecraft lifetime of the last four Nimbus spacecraft ranged from 6 to 15 years. Except for two instruments with cryogenic coolers that had a 6-month design life, and the Filter Wedge Spectrometer that never functioned properly, the instruments also had lifetimes ranging from 6 to 15 years.
RF communications:
The S-band communication system included the S-band command and telemetry system, the data processing system, and the command clock. The S-band command and telemetry system consisted of two S-band transponders, a command and data interface unit, four earth-view antennas, a sky-view antenna, and two S-band transmitters (downlink frequency of 2211 MHz). Commands were transmitted to the observatory by pulse code modulation, phase-shift keying/frequency modulation/phase modulation of the assigned 2093.5 MHz S-band uplink carrier. S/C data were received via NASA's STDN (Spacecraft Tracking and Data Network) and transmitted to GSFC for processing, archiving, and distribution. GSFC provided also the function of S/C operations. The data of the SAMS instrument were processed in the UK.
Launch
Nimbus-7 was launched on Oct. 24, 1978, on a Delta vehicle from VAFB (Vandenberg Air Force Base), CA.
Orbit: Sun-synchronous polar orbit, apogee = 954 km, perigee = 941 km, inclination = 99.15o, period = 104.16 minutes, local equator crossing time on the ascending node at 12:00 hours [and midnight (descending) equator crossings], with 26.1o of longitude separation.
Mission Status
• The Nimbus-7 spacecraft was turned off in 1995 after more than 16 years of service. During its long period of operation, the Nimbus-7 mission was regarded as the single most significant source of experimental data from Earth's orbit relating to atmospheric and oceanic processes.
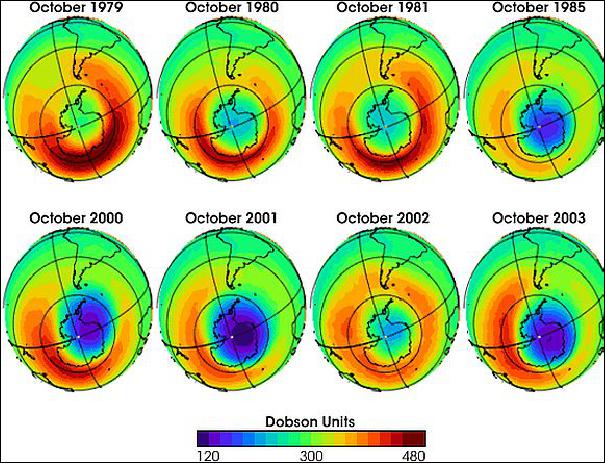
• Nimbus observations began to point to a drop in ozone (blue areas) as early as 1980, with more extreme decreases developing in 1985 (Ref. 3).
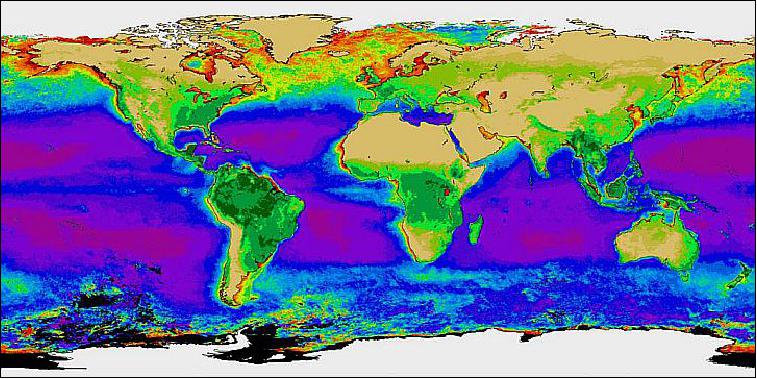
• Figure 6 is a composite map of 60,000 images (1978-1986) taken by NASA's Nimbus CZCS (Coast Zone Color Scanner) showing average ocean phytoplankton chlorophyll-a concentration. Purple and deep blues represent low concentrations. Yellow, orange and red are high concentrations. The Land vegetation data is from NOAA's AVHRR (Ref. 3).
Sensor Complement
CZCS (Coastal Zone Color Scanner)
The CZCS instrument of NASA was built by Ball Brothers Research Corp., Broomfield, CO (USA) - the predecessor of Ball Aerospace and Technologies Corporation (BATC). Objectives: a `proof-of-concept' experiment for the measurement of ocean colour (chlorophyll concentration, sediment distribution, gelbstoff concentrations as a salinity indicator), and the temperature of coastal waters and open ocean (all parameters were optimized for ocean colour sensing). CZCS was in fact the first spaceborne instrument devoted to the measurement of ocean colour. 10) 11) 12)
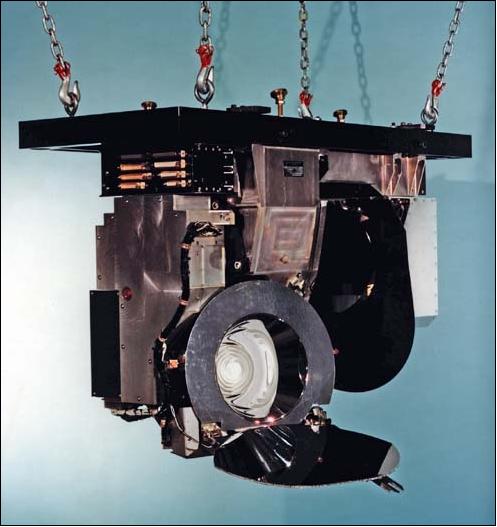
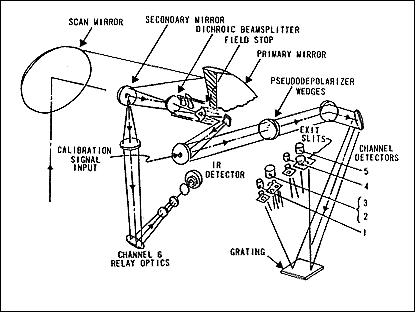
CZCS is a multispectral radiometer (a whiskbroom instrument of 6 spectral bands) utilizing a rotation plane mirror at a 45o angle to the optical axis of a Cassegrain telescope. Band wavelengths: 0.433-0.453 µm (chlorophyll absorption), 0.51-0.53 µm (chlorophyll concentration), 0.54-0.56 µm (Gelbstoff concentration), 0.66-0.68 µm (aerosol absorption), 0.70-0.80 µm (land and cloud detection), and 10.5-12.5 µm (TIR, surface temperature). The mirror scanned 360o but only the ±39.34o of data centred on nadir were collected for ocean colour measurements. Observation of backscattered (or reflected) solar radiation in five bands, and sensing of emitted thermal radiance in band 6.
Band No | 1 | 2 | 3 | 4 | 5 | 6 |
Spectral range (nm) | 433-453 | 510-530 | 540-560 | 660-680 | 700-800 | 10.5-12.5 µm |
Observation | Chlorophyll absorption | Chlorophyll concentration | Gelbstoff concentration | Aerosol absorption | Land and cloud detection | TIR surface temperature |
SNR | > 150 | > 140 | > 125 | > 100 | > 100 | NETD of 0.22 K @ 270 K |
IFOV | 0.865 mrad x 0.865 mrad (or 825 m x 825 m at nadir) | |||||
Swath width | 1556 km | |||||
Mass, power | 27 kg, 11.4 W | |||||
Data rate | 800 kbit/s | |||||
The instrument viewed deep space and onboard calibration sources (incandescent lamps) during the remainder of the scan. The incoming radiation was collected by the telescope and divided into two streams by a dichroic beam splitter. One stream was transmitted to a field stop that was also the entrance aperture of a small polychromator. The radiance that entered the polychromator was separated and re-imaged in five wavelengths on five silicon diode detectors in the focal plane of the polychromator. The other stream was directed to a cooled mercury cadmium telluride detector in the thermal region (10.5-12.5 µm). A radiative cooler was used to cool the thermal detector. To avoid sun glint, the scanner mirror was tilted about the sensor pitch axis on command so that the line of sight of the sensor was moved in 2o increments up to 20o (forward or aft) with respect to the nadir.
CZCS instrument characteristics: multispectral cross-track scanning radiometer, spatial resolution: 825 m x 825 m (each band) at nadir or IFOV = 0.865 mrad, swath width = 1566 km, centred on nadir. Data quantization = 8 bits, data rate = 800 kbit/s. Data products: global maps of chlorophyll concentration, sediment distribution, gelbstoff concentrations as a salinity indicator, and temperature of coastal waters and the open ocean. Prelaunch calibration used an integrating sphere and a blackbody source for the TIR channel. Inflight calibration used an incandescent light source for the first five bands. The TIR channel was calibrated by viewing the blackened housing of the instrument.
The CZCS instrument operated on an intermittent schedule due to overall power demands. The TIR channel failed within the first year after launch. CZCS was operational for eight years before it was turned off in Dec. 1986.
ERB (Earth Radiation Budget)
ERB is an improved follow-on instrument version first flown on Nimbus-6. Objective: to determine the Earth radiation budget (Earth and solar irradiances in UV, VIS, IR regions) on both synoptic and planetary scales by simultaneous measurements of incoming solar radiation and outgoing Earth-reflected (shortwave) and emitted (longwave) radiation.
The ERB instrument consisted of a 22-channel radiometer containing separate subassemblies to perform the required solar, Earth-flux (wide angle), and scanned Earth radiance (narrow-angle) measurements. The systems used optical filters for spectral discriminations, four uncooled thermal detectors, thermopile detectors in the solar and fixed-Earth-flux channels, and pyroelectric detectors in the scanning channels. 13) 14) 15)
The 10 solar channels observed the sun in front of the observatory in the X-Y plane (use of a 10-channel solar telescope). The solar channels obtained usable solar data only during a period of about 3 minutes in each orbit when the spacecraft was over the Antarctic region. Their full response FOV was 0.18 rad. The solar channel subassembly was pivoted ±0.35 rad in the X-Y plane to compensate for sun-angle deviation when required. Channel 10c (solar channel) was a model H-F (Hickey-Frieden) self-calibrating cavity thermopile used for monitoring the total solar irradiance in the spectral range 0.2 - 50 µm. The technology for long-term solar radiation monitoring utilized is referred to as ESCC (Electrically Self Calibrating Cavity).
A special goal of the experiment is to provide data related to the angular distribution of Earth's albedo. For solar measurements, each of the 10 channels is an independent, individually replaceable modular element with a mated amplifier. The sensors are advanced versions of the Eppley-JPL thermopiles. There are no imaging optics, only filters, windows and apertures.
Channel type | Channel No | Spectral range µm | Dominant radiative flux mechanism | Noise equivalent signal (flux) |
Solar channels | 1 | 0.2-3.8 | Shortwave (SW) irradiance | 0.02 W/m2 |
2 | 0.2-3.8 | SW irradiance | 0.02 W/m2 | |
3 | <0.2->50 | Total irradiance | 0.01 W/m2 | |
4 | 0.526-2.8 | SW irradiance | 0.02 W/m2 | |
5 | 0.698-2.8 | SW irradiance | 0.02 W/m2 | |
6 | 0.395-0.508 | VIS reflected | 0.04 W/m2 | |
7 | 0.344-0.460 | VIS reflected | 0.06 W/m2 | |
8 | 0.300-0.410 | UV/VIS | 0.08 W/m2 | |
9 | 0.275-0.360 | UV | 0.01 W/m2 | |
10c | <0.2->50 | Total irradiance | 0.02 W/m2 | |
Fixed WFOV channels | 11 | <0.2->50 | Total irradiance | 0.007 W/m2 |
12 | <0.2->50 | Total irradiance | 0.007 W/m2 | |
13 | 0.2-3.8 | SW reflected | 0.007 W/m2 | |
14 | 0.695-2.8 | SW reflected | 0.007 W/m2 | |
Scanning NFOV channels | 15 | 0.2-4.8 | SW reflected | 0.00004 W/ (cm2 sr) |
16 | 0.2-4.8 | SW reflected | 0.00004 W/ (cm2 sr) | |
17 | 0.2-4.8 | SW reflected | 0.00004 W/(cm2 sr) | |
18 | 0.2-4.8 | SW reflected | 0.00004 W/(cm2 sr) | |
19 | 4.5-50.0 | LW emitted | 0.00002 W/(cm2 sr) | |
20 | 4.5-50.0 | LW emitted | 0.00002 W/(cm2 sr) | |
21 | 4.5-50.0 | LW emitted | 0.00002 W/(cm2 sr) | |
22 | 4.5-50.0 | LW emitted | 0.00002 W/(cm2 sr) |
The four fixed WFOV (Wide Field of View) Earth-flux channels (numbered 11-14) were mounted so that they could continuously view the total Earth disk, and record data at 0.25 s intervals.
The eight narrow FOV (NFOV) scanning channels were mounted in a cylindrical scanning head (4 telescopes). The NFOV channels consisted of four shortwave (0.2 - 4.8 µm) and four longwave (4.5 - 50+µm) channels. The scanning head was gimbal-mounted in the radiometer unit's main frame. The FOVs of the telescopes were asymmetric (4.4 x 89.4 mrad) and those of the shortwave and longwave channels were coincident. The 89.4 mrad FOVs of the four pairs of channels were not contiguous but covered only alternate 89.4 mrad angular intervals along the horizon. - ERB instrument mass = 32.7 kg, power = 36.2 W, bit rate = 4.5 kbit/s.
The improved ERB radiometer on Nimbus-7 was stable enough to detect for the first time short-term and long-term solar irradiance variability (this could not be done with ERB data from Nimbus-6). ERB was the first long-term solar monitor utilizing the ESCC (Electrically Self Calibrating Cavity) technique. - The ERB instrument operation was stopped on Jan. 4, 1994. 17)
LIMS (Limb Infrared Monitor of the Stratosphere)
The LIMS design is of LRIR heritage flown on Nimbus-6 (PI: J. M. Russell III). Objective: Measurement of vertical gas concentrations and temperature profiles in the stratosphere. Observables: O3, H2O, NO2, HNO3 and temperature. Channel centre wavelengths: 6.25, 6.75, 9.65, 11.35, 15.25 µm and one broad channel from 13.3 - 17.2 µm.
The LIMS limb-sounding instrument was a six-channel radiometer consisting of two electronic boxes and the radiometer unit (Hg:Cd:Te detectors were used, cooled by a two-stage solid cryogen cooler). Radiance from the Earth's limb entered the OMP (Optical Mechanical Package) aperture, reflected off the scan mirror to the 18 cm diameter off-axis parabolic primary mirror where the radiation was focused and chopped at 945 Hz. The radiation was re-collimated by the secondary mirror and directed through a Lyot stop to a folding mirror and into the detector capsule assembly (DCA). The radiation was then focused through a cadmium telluride lens and through interference filters, which defined the FOVs, and onto an array of discrete mercury cadmium telluride detectors. The detectors were maintained at about 63 K temperature by the cryogen. 18) 19)
The LIMS began a scan near 153 km altitude, taking about 12 s to move near 38 km below the solid limb, then retraced its motion upward. After every second scan pair, the scan mirror was placed in a position to observe radiation from a small cavity blackbody for inflight warm calibration after which the instrument viewed space to obtain a cold calibration point. Instrument mass = 68.4 kg, power = 27 W, bit rate = 4 kbit/s.
The LIMS instrument operated successfully for about 9 months from October 25, 1978, to May 28, 1979. The instrument was turned off due to the depletion of cryogen, as planned, in June 1979.
SAM-II (Stratospheric Aerosol Measurement II)
The NASA/LaRC instrument is a sun photometer that views a small portion of the sun through the Earth's atmosphere during S/C sunrise and sunset. The single-channel instrument measured the distribution of particles in the stratosphere, making measurements only at high latitudes (a characteristic of occultation instruments in polar sun-synchronous orbits) from 1978 to 1995.
SAM-II measured aerosol extinction and extinction ratio profiles, and stratospheric optical depth as a function of altitude, latitude and longitude.
Channel wavelength: 0.98-1.02 µm.
Spatial resolution is 1 km (vertical); swath width is 5 - 40 km vertical.
Measurement calibration technique: the Langley technique is used to calculate zero air mass solar intensity. By measuring the intensity of the sun over a several-hour period on a clear, optically stable day and using the calendar day and latitude/longitude of the measurement location, one can plot intensity versus air mass. 20)
The SAM-II instrument package consisted of optics and electronics subassemblies. The optical assembly consisted of gimbals, a flat entrance window (which filters out UV radiation), Cassegrain optics, a flat scanning mirror, sun acquisition sensors, and a sun-photometer detector package. Solar radiation was reflected from the scan mirror into the Cassegrain telescope forming a solar image at the slit plate, which contained two solar edge sensors for monitoring solar limb crossings on either side of the detector aperture. Solar radiation passed through the aperture, was collected by a field lens, passed through an interference filter for wavelength discrimination, and finally measured by a silicon photodiode detector. The optics assembly was gimbaled in azimuth. After the acquisition in azimuth, the mirror servo scanned in elevation until the Sun was acquired. The Sun was then scanned back and forth. The photometer viewed a portion of the solar disk with a 0.145 mrad IFOV and a sampling rate of 50 samples/s. Instrument mass = 17 kg, power = 0.8 W, bit rate = 4 kbit/s.
Data products: global maps of the concentration and optical properties of stratospheric aerosols as a function of altitude, latitude, and longitude, which prove valuable for studies on radiative transfer and climatic effects; aerosol transport sources and sinks in the stratosphere; seasonal variations and sudden warming phenomena; and volcanic injection phenomena. When no clouds were present in the instrument's IFOV, then tropospheric aerosols were also mapped.
SAMS (Stratospheric and Mesospheric Sounder)
SAMS was provided by Oxford University, Oxford, UK (PI: F. W. Taylor). Measurement of vertical gas concentrations (H2O, CH4, CO and NO) and temperature profiles in the stratosphere and mesosphere. Observation of `resonant scattering of solar radiation.' Channel wavelengths: nine channels defined by gas cell modulation 4.1 to 15 µm and 25 - 100 µm. Radiation from the limb of the atmosphere was incident on a scan mirror in front of a 15 cm aperture telescope. The scan mirror scanned the limb, viewed space for calibration, and viewed the atmosphere obliquely to obtain vertical profiles.
There were three adjacent FOVs, each 28 mrad x 2.8 mrad (corresponding to 100 km by 10 km at the limb). The FOVs were focused onto a field-splitting mirror by the telescope which directed radiation to six detectors. Separation into channels was accomplished through dichroic beam splitters. There were seven pressure modulator cells (PMC), two containing CO2, the remainder N2O, NO, CH4, CO, H2O. Pressure in the cells could be varied on command by changing the temperature of a small container of molecular sieve material attached to each PMC. The spectral parameters for the H2O channel were 2.7 µm and 25 - 100 µm. All other channels lay within the range 4.1 to 15 µm. A chopper operating at 250 Hz within the telescope, allowed the measurement of two separate signals from all detectors, one at 250 Hz and one at the PMC frequency. Instrument mass = 23.6 kg, power = 20 W, bit rate = 25 kbit/s. 21) 22) 23)
SAMS was operational until April 9, 1985 (an anomalous behaviour of the limb scan motor in the SAMS instrument resulted in the instrument being turned off).
SBUV/TOMS (Solar Backscatter Ultraviolet/Total Ozone Mapping Spectrometer)
Instrument mass = 20 kg, power = 20 W, bit rate = 4 kbit/s. Measurement of vertical O3 profiles, total column amounts of atmospheric O3, solar irradiance, and terrestrial radiances.
• SBUV was a double Ebert-Fastie spectrometer and filter photometer, similar to the BUV on Nimbus-4. SBUV used three detectors: a photomultiplier tube (PMT) and a photodiode for the monochromator, and one photodiode for the photometer. Both the monochromator and the photometer have chopper wheels operating at 25 Hz. The SBUV used a depolarizer to eliminate the sensitivity of the grating monochromator to the polarization of the backscattered radiation. The instrument's field of view (FOV) at nadir was 0.20 rad. A roughened aluminium diffuser plate viewed the sun for solar-spectral irradiance measurements and for calibration by viewing a mercury-argon lamp. In one mode, SBUV serially monitored 12 selected narrow wavelength bands in the spectral region from 0.250 - 0.340 µm. 24) 25) 26)
The SBUV spectrometer had a second mode of operation that allowed a continuous solar-spectral scan from 0.16 - 0.4 µm for a detailed examination of the extraterrestrial solar spectrum and its temporal variations. A parallel photometer channel at 0.343 µm measured the reflectivity of the atmosphere's lower boundary in the same 0.21 rad FOV.
Spatial resolution of SBUV = 11.3o in each band. Swath width = 200 km, separated by the 26o longitude interval between successive orbits.
- The SBUV instrument was operational until 1990.
• TOMS (Total Ozone Mapping Spectrometer) is a nadir-looking instrument that measures the albedo (backscatter technique) of the Earth's atmosphere at six narrow spectral bands in the near-ultraviolet region. The albedo is measured by comparing the radiance of the Earth with the radiance of a calibrated diffuser plate. The TOMS instrument (the first in a series of TOMS instruments) was developed by NASA/GSFC, PI: R. D. McPeters. 27) 28)
TOMS was a single-stage Ebert-Fastie spectrometer with a fixed grating and an array of exit slits. TOMS step-scanned across the orbital track of ±51o from the nadir in 3o steps with an IFOV of about 0.052 rad. Spatial resolution is 3o x 3o (scanned through the satellite subpoint and perpendicular to the orbital plane) resulting in a footprint of 50 km x 50 km at nadir. Swath width of about 3000 km providing contiguous mapping of ozone data. At each scan position, the Earth's radiance was monitored at six wavelengths between 312 and 380 nm (centred at 312.5, 317.5, 331.3, 339.9, 360.0 and 380 nm) to infer the total ozone amount. TOMS completed a cross-scan in eight seconds, with one second for retrace, to record 35 scenes per scan. At each scene, a chopper sequentially sampled all six wavelengths four times. TOMS used the same type of PMT as SBUV, and had a separate mercury-argon lamp for wavelength calibration and a separate depolarizer. TOMS shared the diffuser plate with SBUV. Both SBUV and TOMS had five scanner modes and a shared electronics module.
The TOMS instrument provided reliable, high-resolution maps of global ozone amounts on a daily basis from October 1978 to May 1993.
Data products: vertical distribution of ozone, global maps of total ozone and 200-mb height fields; incident solar ultraviolet irradiance and ultraviolet radiation backscattered from the Earth. SBUV helps to determine the total amount of atmospheric ozone in a vertical column above the subsatellite point; the vertical profile of ozone above the ozone maximum; measurements of ultraviolet solar spectral irradiance and its temporal variability over the 160 - 400 nm range (with a spectral resolution of 1 nm). TOMS exploits the polar orbit to yield global, contiguous maps of total ozone concentrations.
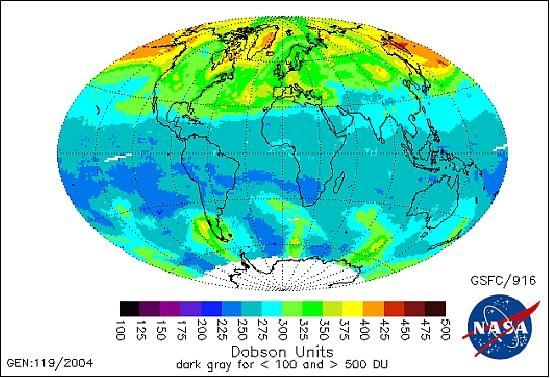
Note: The TOMS instrument aboard Nimbus-7 mapped the extent of the phenomenon known as the "ozone hole." Data from TOMS were part of the scientific basis for treaties banning the manufacture and use of ozone-depleting chemicals, known as CFC (chlorofluorocarbon) compounds.
SMMR (Scanning Multichannel Microwave Radiometer)
SMMR is a NASA instrument (conceptual design by GSFC based on ideas by C. R. Laughlin and K. Richter).
Objective: observation of sea-ice parameters, ocean surface conditions, atmospheric conditions, land parameters, and glacial features. Microwave brightness temperatures were observed with a 10-channel (five-frequency dual polarized) scanning radiometer operating at frequencies of 37 (0.81 cm), 21 (1.42 cm), 18 (1.66 cm), 10.69 (2.8 cm), and 6.6 (4.54 cm) GHz.
The SMMR instrument consists of five hardware elements: 29) 30)
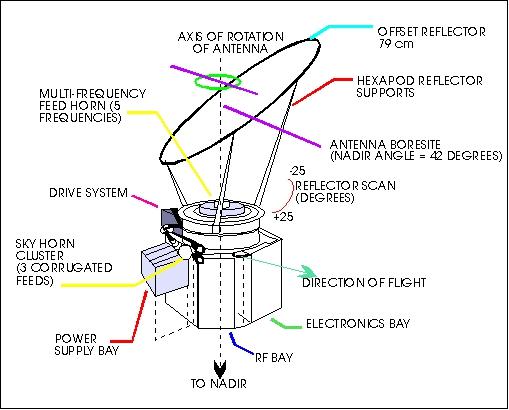
• The antenna assembly consists of the reflector, fabricated of graphite epoxy, and the feedhorn.
• The scan mechanism, including momentum compensation devices
• An RF module containing the input and reference switching networks, the mixer-IF preamplifiers, and the Gunn local oscillators
• An electronics module containing the main IF amplifiers, all the post-detection electronics, and the power supplies for the scan and data subsystems
• A power supply module which contains the dc-to-dc converters and regulators for the rest of the instrument.
Microwave radiation from the Earth's surface and its atmosphere is collected by a 42o offset parabolic reflector that focuses the received power into a single feedhorn covering the entire range of operating wavelengths and provides coaxial antenna beams for all channels. Scanning is accomplished by oscillating the parabolic reflector about the vertical axis between local azimuth angles of ±25o with a period of 4.096 s. The various integrate-and-dump times of the radiometers combined with the oval IFOV result in roughly circular beam spots ranging in diameter from about 30 km at 0.81 cm to 150 km at 4.6 cm wavelength. Cross-track/along-track sampling intervals range from 14 km x 14 km to 58 km x 28 km over the wavelength interval. The incoming microwave beam is at a constant angle of 42o from nadir, corresponding to an Earth incidence angle of 50.2o at the Nimbus-7 orbital altitude.
The SMMR instrument is forward viewing and scans 390 km to either side of the orbital track. It is operated on alternate days so that it maps the entire globe twice every 6 days. The antenna beam scan lies along a conical surface with a 42o half angle so that the distance to the surface of the Earth is constant over the scan. The angle of incidence at the Earth's surface is about 50.2o.
Calibration: By observing both hot and cold reference sources, the instrument is calibrated in flight. A radio frequency source at the ambient temperature serves as a hot reference, and deep space viewed by a special antenna horn provides a cold reference. This two-point reference system allows the measured antenna counts to be converted to the observed radiances. Radiances are computed with a calibration equation from the radiometric signal from the Earth's surface, the hot and cold calibration counts, and several instrument temperatures in the SMMR microwave circuity. This calibration equation was developed using prelaunch calibration data.
Six separate Dicke-type radiometers were utilized. Those operating at the four longest wavelengths measured alternate polarizations (H, V) during successive scans of the antenna; the others operated continuously for each polarization. The motion of the antenna reflector provided observations from within a conical volume along the ground track of the spacecraft. An identical instrument was flown on SEASAT (launch June 28, 1978). SMMR instrument mass = 52.3 kg, power = 60 W, bit rate = 25 kbit/s.
Status: The SMMR operations on Nimbus-7 ended on July 6, 1988.
THIR (Temperature Humidity Infrared Radiometer)
The instrument was built by Hughes SBRC. A similar instrument was flown on Nimbus-4, -5, and 6. The Nimbus-7 THIR operation ended on Nov. 30, 1987.
Objective: detection of emitted thermal radiation in two spectral ranges, measurement of daytime and nighttime surface and cloud-top temperatures as well as the water vapour content of the upper atmosphere. The instrument consisted of a 12.7 cm Cassegrain system, a scanning mirror common to both channels, a beam splitter, filters, and two germanium-immersed thermistor bolometers. Incoming radiant energy was collected by a flat scanning mirror inclined at 45o to the optical axis. The mirror rotated through 360o at 48 rpm and scanned in a plane normal to the spacecraft velocity vector. The energy was then focused into a dichromatic beam splitter, which divided the energy spectrally and spatially into two channels (10.5 - 12.5 µm TIR window, and 6.5 - 7.0 µm for water vapour). Direct readout infrared radiometer (DRIR) data could be transmitted to APT ground stations for both day and night portions of the orbit. The TIR window channel had a ground resolution of about 7 km and the water vapour channel about 22 km at nadir.
- Instrument mass = 9.0 kg, average power consumption = 8.5 W. 31) 32)
References
1) Rebecca Lindsey, "Nimbus: 40th Anniversary," NASA Earth Observatory, July 19, 2005, URL: http://earthobservatory.nasa.gov/Features/Nimbus/nimbus.php
2) Ralph Shapiro, "Nimbus Program History - Earth Resources Research Satellite Program -Observatory Observations 1964-1094 - Earth Science Research 1964-2004," NASA, October 26, 2004, URL: http://atmospheres.gsfc.nasa.gov/uploads/files/Nimbus_History.pdf
3) Kasha Patel, "Nimbus: NASA Remembers First Earth Observations," NASA, Oct. 8, 2014, URL: http://www.nasa.gov/content/goddard/nimbus-nasa-remembers-first-earth-observations/#.VDpECxZvj_V
4) Alan Ward, "Nimbus Celebrates Fifty Years," NASA, The Earth Observer, Volume 27, Issue 2, March-April 2015, pp:18-31, URL: http://eospso.gsfc.nasa.gov/sites/default/files/eo_pdfs/Mar_Apr_2015_color_508.pdf
5) http://nssdc.gsfc.nasa.gov/nmc/spacecraftDisplay.do?id=1978-098A
6) I. S. Haas, R. Shapiro, "The Nimbus Satellite System: Remote Sensing R&D Platform of the 1970s," Monitoring Earth's Ocean, Land, and Atmosphere from Space - Sensors, Systems, and Applications, Progress in Astronautics and Aeronautics, AiAA, Volume 97, 1985, pp. 71-95
7) C. R. Madrid (ed.), "The Nimbus-7 User's Guide," NASA/GSFC, Prepared by The Landsat/Nimbus Project, Aug. 1978
8) "Nimbus-7, Observing the Atmosphere and Oceans," NASA pamphlet Dec. 1983
9) C. R. Madrid, "The Nimbus 7 Spacecraft System," The Nimbus 7 Users' Guide, URL: http://nsidc.org/data/docs/daac/nimbus-7_platform.gd.html
10) http://oceancolor.gsfc.nasa.gov/CZCS/czcs_instrument.html
11) R. H. Evans, H. R. Gordon, "Coastal zone color scanner 'system calibration': A retrospective examination," Journal of Geophysical Research, Vol. 99, No. C4, pp. 7293-7307, April 15, 1994
12) http://daac.gsfc.nasa.gov/guides/GSFC/guide/CZCS_Sensor.gd.shtml#1.
13) J. R. Hickey, L. L. Stowe, H. Jacobowitz, P. Pellegrino, R. H. Maschhoff, F. House, T. H. Von der Haar, "Initial Solar Irradiance Determinations from Nimbus-7 Cavity Radiometer Measurements," Science Vol. 208, April 1980, pp. 281-283
14) H. Jacobowitz, L. L. Stowe, J. R. Hickey, "The Earth Radiation Budget (ERB) Experiment,," Nimbus User's Guide, edited by C. R. Madris, 1978, NASA/GSFC, Greenbelt, MD
15) H. L. Kyle, J. R. Hickey, P. E. Ardanuy, H. Jacobowitz, A. Arking, G. G. Campbell, F. B. House, R. Maschhoff, G. L. Smith, L. L. Stowe, T. Von der Haar, "The Nimbus Earth Radiation Budget (ERB) Experiment: 1975 to 1992," Bulletin of the American Meteorological Society, Vol. 74, Issue 5, May 1993, pp. 815-830, URL: http://journals.ametsoc.org/doi/pdf/10.1175/1520-0477%281993%29074%3C0815%3ATNERBE%3E2.0.CO%3B2
16) http://badc.nerc.ac.uk/data/gedex/detail/erb_soli.det
17) D. V. Hoyt, H. L. Kyle, J. R. Hickey, R. H. Maschhoff, 1992: "The Nimbus-7 total solar irradiance: A new algorithm for its derivation," Journal of Geophysical Research, Vol. 97, 1992, pp. 51-63.
18) "Nimbus-7 Limb Infrared Monitor of the Stratosphere (LIMS)," URL: http://daac.gsfc.nasa.gov/guides/GSFC/guide/LIMS_dataset.gd.shtml
19) "Limb Infrared Monitor of the Stratosphere (LIMS)," URL: http://nssdc.gsfc.nasa.gov/nmc/experimentDisplay.do?id=1978-098A-01
20) "Stratospheric Aerosol Measurement II (SAM II), Langley DAAC Project Guide," URL: https://web.archive.org/web/20200213102014/https://eosweb.larc.nasa.gov/project/sam2/sam2_table
21) J. R. Drummond, J. T. Houghton, G. D. Peskett, C. D. Rogers, M. J. Wale, J. G. Whitney, E. J. Williamson, "The NIMBUS 7 User's Guide: SAMS, Section 6," 1978, pp. 139-174
22) F. W. Taylor, J. J. Barnett, M. Corney, R. L. Jones, C. D. Rodgers, C. D. Wale, E. J. Williamson, "Performance and early results from the SAMS on Nimbus 7," Advances in Space Research, Vol. 1, 1981, pp. 261-265
23) F. W. Taylor, "Infrared remote sensing of the middle atmosphere from satellites: The stratospheric and mesospheric sounder experiment 1978-1983," Surveys in Geophysics, Vol. 9, No 2, June 1987, pp.123-148
24) "National Space Science Data Center Header Solar Backscatter Ultraviolet/Total Ozone Mapping Spectrometer (SBUV/TOMS)," URL: http://nssdc.gsfc.nasa.gov/nmc/experimentDisplay.do?id=1978-098A-09
25) D. F. Heath, A. J. Krueger, H. R. Roeder, B. D. Henderson, "The solar backscatter ultraviolet and total ozone mapping spectrometer (SBUV/TOMS) for Nimbus G, Optical Engineering, Vol. 14, pp. 323-331, 1975
26) R. P. Cebula, H. W. Park, D. F. Heath, "Characterization of the Nimbus-7 SBUV radiometer for long term monitoring of the stratospheric ozone," Journal of Atmospheric and Oceanic Technology, Vol. 5, 1988, pp. 215-227
27) "The TOMS instrument and data products," URL: http://badc.nerc.ac.uk/data/toms/tomshelp.html#Nim7InstDes
28) T. H. Markert, et al., "Solar backscatter ultraviolet and total ozone mapping spectrometer (SBUV/TOMS) for Nimbus G," Optical Engineering., Vol. 14, No. 4, pp. 323-331, July-Aug. 1975
29) P. Gloersen, F. T. Barath, "A Scanning Multichannel Microwave Radiometer for Nimbus-G and SeaSat-A,". IEEE Journal of Oceanic Engineering, Vol. 2, 1977, pp.172-178, URL: http://nsidc.org/data/docs/daac/smmr_instrument.gd.html
30) P. Gloersen, D. J. Cavalieri, A. T. C. Chang, et al., A Summary of Results From the First Nimbus-7 SMMR Observations," Journal of Geophysical Research, Vol. 89, No D4, June 30, 1984, pp. 5335-5344
31) "Temperature/Humidity Intrared Radiometer (THIR)," URL: http://nssdc.gsfc.nasa.gov/nmc/experimentDisplay.do?id=1978-098A-10
32) J. C. Comiso, "Surface temperatures in the polar regions from Nimbus 7 temperature humidity infrared radiometer," Journal of Geophysical Research, Vol. 99, Issue C3, March 1994, pp. 5181-5200
The information compiled and edited in this article was provided by Herbert J. Kramer from his documentation of: "Observation of the Earth and Its Environment: Survey of Missions and Sensors" (Springer Verlag) as well as many other sources after the publication of the 4th edition in 2002. - Comments and corrections to this article are always welcome for further updates (eoportal@symbios.space).
Overview Spacecraft Launch Mission Status Sensor Complement References Back to Top