MetOp-SG (MetOp-Second Generation Program)
EO
ESA
Atmosphere
Ocean
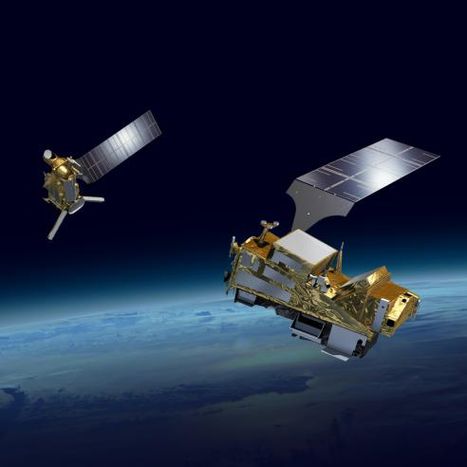
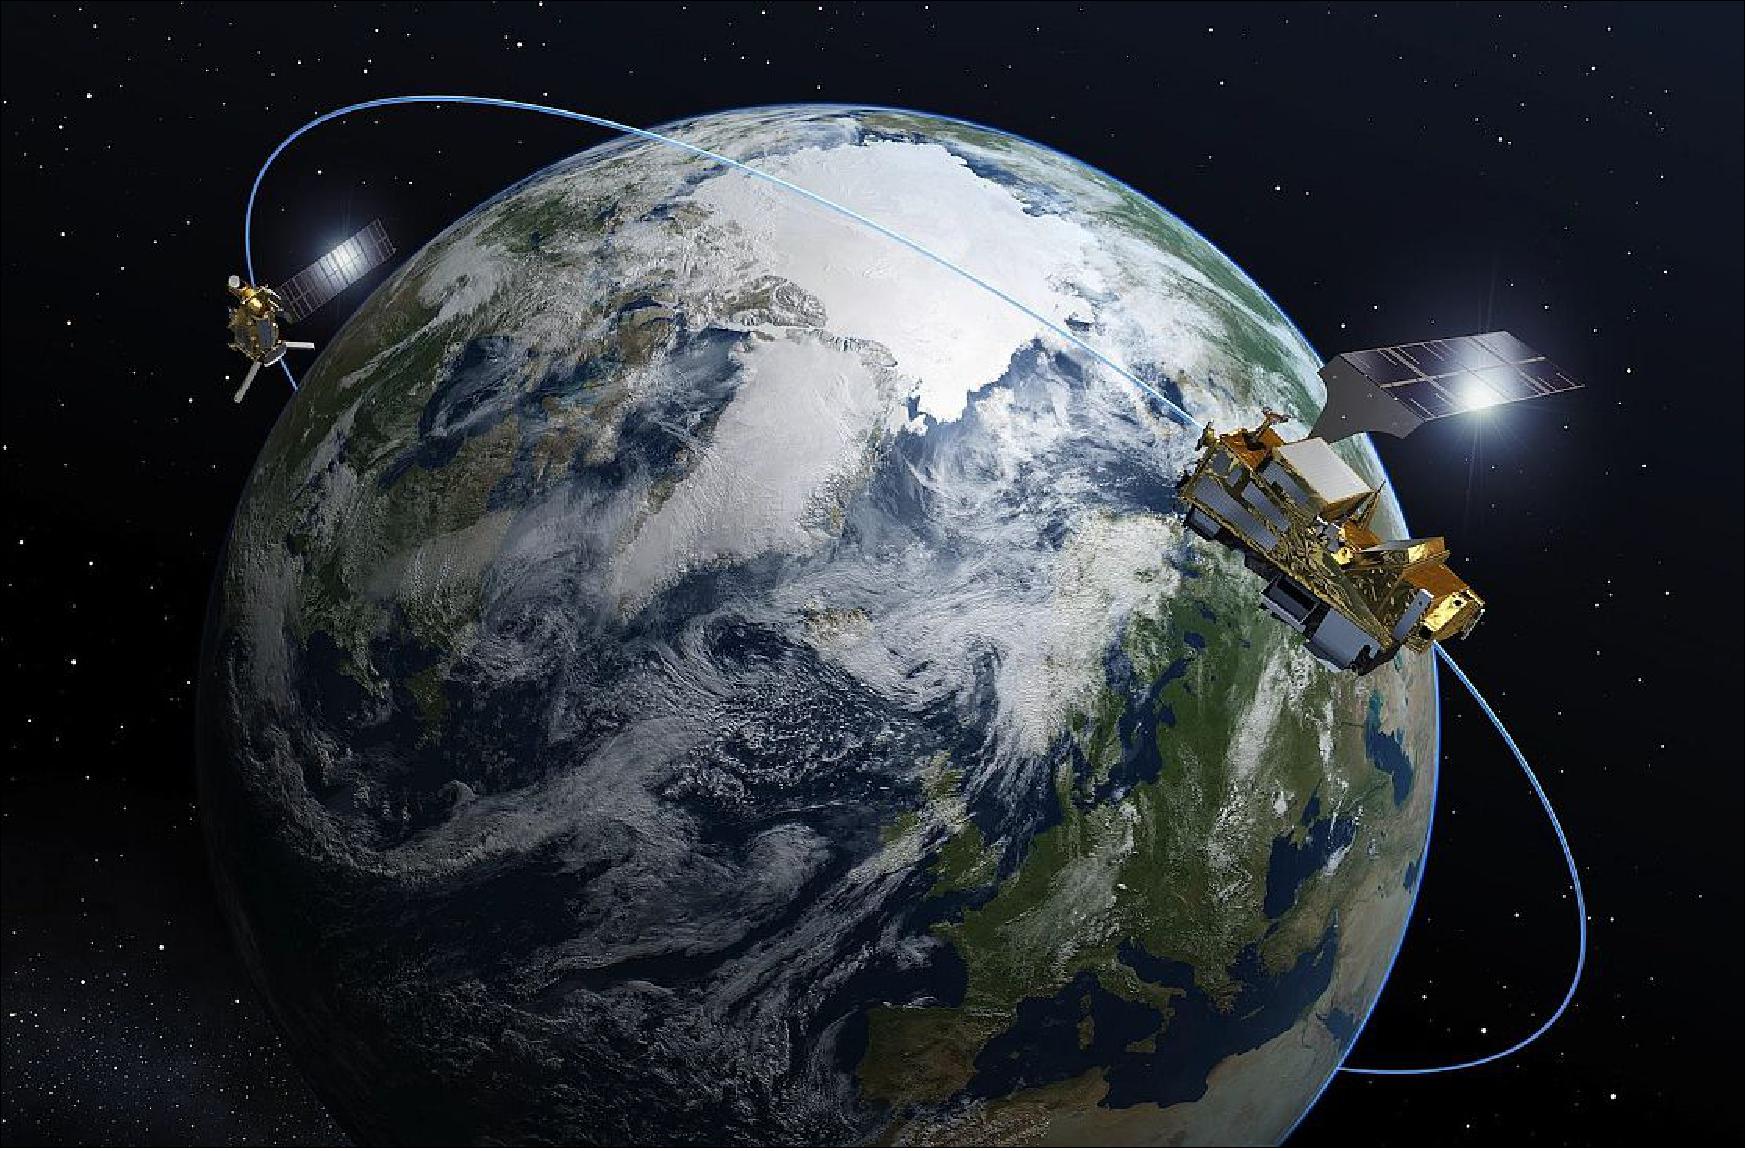
MetOp-SG (Meteorological Operational satellite- Second Generation) is a series of 6 meteorological satellites, which will act as the successor to the MetOp series. The mission is developed by ESA (European Space Agency) and EUMETSAT (European Organisation for the Exploitation of Meteorological Satellites), and divided into two different series, MetOp-SG-A and -B, with complementary sensor payloads that will orbit in pairs.
Quick facts
Overview
| Mission type | EO |
| Agency | ESA, CNES, DLR, EUMETSAT, COM |
| Mission status | Approved |
| Measurement domain | Atmosphere, Ocean, Land, Snow & Ice |
| Measurement category | Cloud type, amount and cloud top temperature, Liquid water and precipitation rate, Atmospheric Temperature Fields, Cloud particle properties and profile, Aerosols, Radiation budget, Multi-purpose imagery (land), Surface temperature (land), Vegetation, Albedo and reflectance, Surface temperature (ocean), Atmospheric Humidity Fields, Ozone, Trace gases (excluding ozone), Sea ice cover, edge and thickness, Soil moisture, Snow cover, edge and depth, Ocean surface winds, Atmospheric Winds |
| Measurement detailed | Cloud top height, Precipitation Profile (liquid or solid), Cloud cover, Cloud optical depth, Precipitation intensity at the surface (liquid or solid), Aerosol optical depth (column/profile), Cloud ice (column/profile), Cloud imagery, Cloud liquid water (column/profile), Land surface imagery, Cloud drop effective radius, Cloud ice effective radius (column/profile), Fire fractional cover, Earth surface albedo, Atmospheric specific humidity (column/profile), O3 Mole Fraction, Atmospheric temperature (column/profile), Land surface temperature, Sea surface temperature, CH4 Mole Fraction, HNO3 (column/profile), Wind vector over sea surface (horizontal), NO2 Mole Fraction, Sea-ice cover, Snow cover, Soil moisture at the surface, Wind speed over sea surface (horizontal), Cloud top temperature, Normalized Differential Vegetation Index (NDVI), BrO (column/profile), Wind profile (horizontal), Atmospheric stability index, Volcanic ash, Fraction of Absorbed PAR (FAPAR), CO2 Mole Fraction, OClO (column/profile), CO Mole Fraction, Sea-ice type, SO2 Mole Fraction, Wind profile (vertical), Downward short-wave irradiance at Earth surface, Sea-ice surface temperature, Cloud mask, Sea-ice Concentration, Aerosol Layer Height, HCHO Mole Fraction, Water vapour imagery, CHOCHO (column/profile), Cloud top pressure, Upwelling (Outgoing) spectral radiance at TOA, SO2 Total Column, Sea-ice motion |
| Instruments | A-DCS4, SCA, METimage, MWS, IASI-NG, RO, ICI, MWI, 3MI, UVNS (Sentinel-5) |
| Instrument type | Imaging multi-spectral radiometers (vis/IR), Scatterometers, Atmospheric chemistry, Imaging multi-spectral radiometers (passive microwave), Data collection, Atmospheric temperature and humidity sounders |
| CEOS EO Handbook | See MetOp-SG (MetOp-Second Generation Program) summary |
Summary
Mission Capabilities
The MetOp-SG series contains 9 sensor instruments in all, these being: METImage (Meteorological Imager), IASI-NG (Infrared Atmospheric Sounding Interferometer–New Generation), MWS (Microwave Sounder), SCA (Scatterometer), RO (Radio Occultation sounder), UVNS/S5 (Ultraviolet /Visible/Near Infrared/Shortwave Infrared spectrometer -Sentinel-5), MWI (Microwave Imager), ICI (Ice and Cloud Imager) and 3MI (Multi-viewing, Multi-channel, Multi-polarization Imager). The MetOp-SG-A series satellites will carry the 3MI, IASI-NG, MWS, METImage, RO, and UVNS/S5 instruments, while MetOp-SG-B series craft will carry the ICI, MWI, RO and SCA instruments.
The instruments utilised by the MetOp-SG series cover applications of aerosol and cloud microphysical observations (METImage, 3MI), temperature/humidity sounding (IASI-NG, MWS, RO), ozone column and total profile observations (IASI-NG), wind speed and vector observations (SCA), cloud ice observations (ICI), atmospheric density observations (RO) and supplementary climate and atmospheric imaging (MWI), as well as atmospheric chemistry observations (UVNS/S5).
Performance Specifications
Across all instruments, MetOp-SG has spatial resolutions of 0.5km (METImage) to 25km (SCA). It has swath widths of 2715km (UVNS/S5)- 500km (RO). The MetOp-SG satellites will be in a sun-synchronous orbit with a planned mean altitude of approximately 835km and a planned LTDN (Local Time at Descending Node) at 0930 hours.
Space and Hardware Components
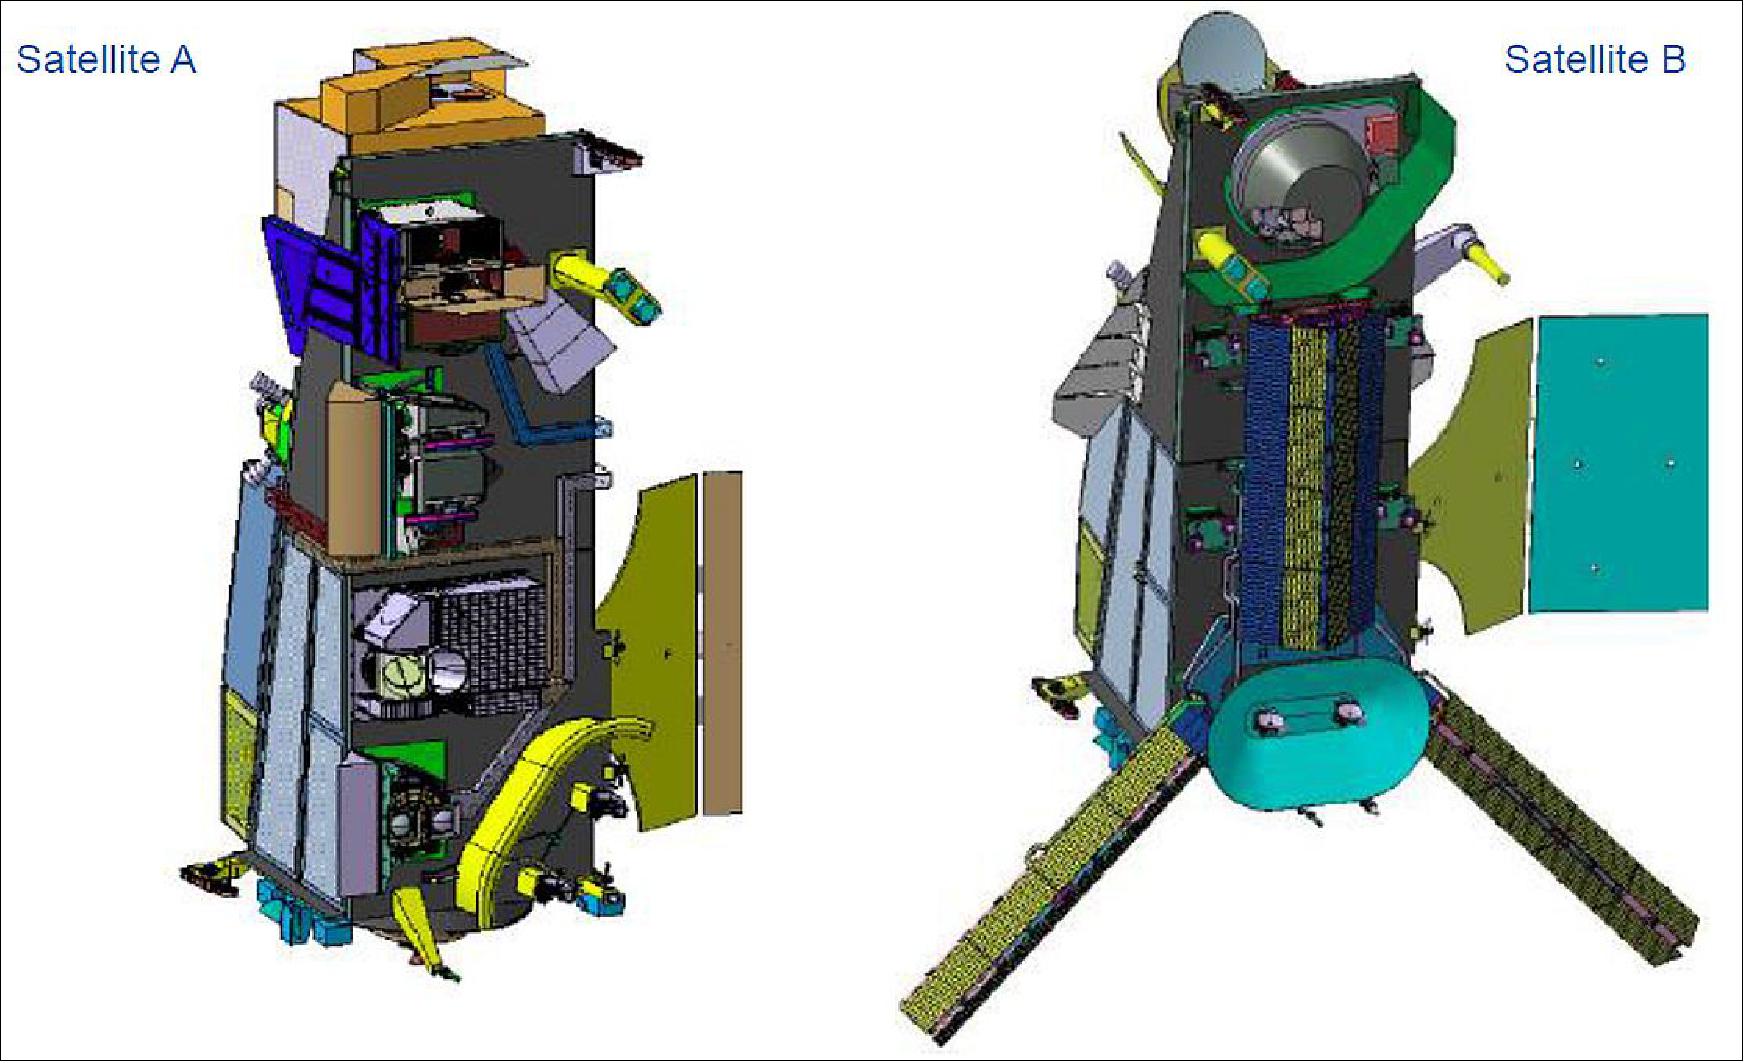
The MetOp-SG program utilises a two-satellite architecture of craft equipped with different but complementary sensors, operating within an identical sun-synchronous orbit. The two series of MetOp-SG satellites will use slightly different buses, designed and manufactured by Airbus Defence and Space, with dimensions of 6.5 m x 2.97 m x 3.46 m for the A series satellites, and 6.1 m x 2.91 m x 3.43 m for B series units. The MetOp-SG-B satellites are all equipped with an ADCS (Advanced Data Collection System) module, which collects and transmits observations and data from collection platforms.
MetOp-SG (MetOp-Second Generation Program)
Spacecraft Development Status Launch Sensor Complement References
The current MetOp series of EUMETSAT has three identical satellites. Launched in 2006, MetOp-A is Europe's first polar-orbiting mission dedicated to operational meteorology, and will be followed by MetOp-B in 2012 and MetOp-C in 2016. - These first three MetOp satellites guarantee the continuous delivery of high-quality data for medium- and long-term weather forecasting and for climate monitoring until at least 2020.
The EPS-SG (EUMETSAT Polar System-Second Generation) Phase System baseline has been agreed by Council in June 2010 and is based on a Two-Satellite In-orbit Configuration. 1)
In 2011, ESA, in partnership with EUMETSAT, embarked upon the initial steps (industrial studies, Phase A) towards developing concepts for the next generation of MetOp -SG satellites. While the three satellites in the first series are identical, the current concept for MetOp-SG, also known as 'Post-EPS', will comprise two different satellites orbiting as a pair. It is envisaged that each satellite will carry a different, but complementary, instrument package. 2) 3)
In November 2012, the EUMETSAT Council successfully concluded the approval process for the EPS-SG (EUMETSAT Polar System Second Generation) Preparatory Program with all 26 Member States having now firmly committed themselves. 4)
On May 20, 2014, the first documents signalling the go-ahead for Europe’s fleet of MetOp Second Generation weather satellites were signed by Volker Liebig, ESA Director of Earth Observation Programs, and Michael Menking, Head of Airbus Defence & Space’s Earth Observation, Navigation and Science Programs in the presence of the German Chancellor Angela Merkel at the Berlin Air Show. - With the first contractual documents now signed, the ‘A’ satellites will be developed and built by Airbus Defence and Space in Toulouse, France, while the ‘B’ satellites will be developed and built at the company’s facilities in Friedrichshafen, Germany. However, under the leadership of Airbus Defence and Space, a large industrial consortium of many different companies around Europe will be involved. 5) 6)
MetOp-SG encompasses the objective of obtaining consistent, long-term collection of remotely sensed data of uniform quality for operational services for meteorology and climate monitoring state analysis, forecasting and operational service provision, in the context of the EUMETSAT’s EPS-SG system.
| MetOp-SG-A | MetOp-SG-B |
|
| |
Orbit, altitude | SSO, 830 km | SSO, 830 km |
S/C mass | ~4.017 (+135 adaptor) kg | ~3.818 (+135 adaptor) kg |
Lifetime | 8.5 years | 8.5 years |
|
|
|
Sensor complement | 8 instruments | 7 instruments |
| METimage (DLR) | MWI (Microwave Imaging Radiometer), (ESA) |
| MWS (Microwave Sounder), (ESA) | ICI (Ice Cloud Imager), (ESA) |
| IASI-NG (Infrared Atmospheric Sounder Interferometer-Next Generation), (CNES) | SCA (Scatterometer), (ESA) |
| RO (Radio Occultation), (ESA) | RO (Radio Occultation), (ESA) |
| 3MI (Multi-view Multi-channel Multi-polarization Imager), (ESA) | Argos-4 (Data Collection Service) (NOAA/CNES) |
| Radiation Energy Radiometer (NOAA) | Search and Rescue (COSPAS-SARSAT) |
| Sentinel-5/UVNS (ESA/Copernicus) | Space Environment Monitor (NOAA) |
| Low Light Imager (NOAA) |
|
The MetOp-SG program is being implemented in collaboration with EUMETSAT. ESA develops the prototype MetOp-SG satellites (including associated instruments) and procures, on behalf of EUMETSAT, the recurrent satellites (and associated instruments). EUMETSAT is responsible for the overall mission, funds the recurrent satellites, develops the ground segment, procures the launch and LEOP services and performs the satellites operations. The corresponding EUMETSAT Program is termed EPS-SG (EUMETSAT Polar System – Second Generation).
On October 16, 2014, contracts were signed to build three pairs of MetOp Second Generation satellites, ensuring the continuity of essential information for global weather forecasting and climate monitoring for decades to come. Airbus Defence and Space of France now takes up the role as prime contractor for the A satellites and Airbus Defence and Space of Germany for the B series. Although the different satellites will be developed and built in Toulouse, France and Friedrichshafen, Germany, respectively, a large industrial consortium of many European companies will be involved under the leadership of Airbus Defence and Space. 9)
New instruments observing extended spectral and frequency ranges will allow new environmental measurements to be collected. In addition, the A series will carry the Copernicus Sentinel-5 instrument on behalf of the European Commission. Sentinel-5 includes five ‘spectrometers’ from the ultraviolet to the shortwave infrared, to monitor atmospheric composition and support the forecasting of air quality.
• On 15 December 2016, Europe and the US achieved another milestone in the cooperation on meteorological satellite systems when Marc Cohen, EUMETSAT Associate Director for LEO Programs and Harry A. Cikanek III, NOAA Director, Joint Polar Satellite System, signed the plan that will implement the JPS (Joint Polar System). 10)
- The PIP (Polar System Program Implementation Plan) encompasses the space and ground segments associated with EUMETSAT’s EPS-SG (Polar System Second Generation) and the Joint Polar Satellite System of NOAA (National Oceanic and Atmospheric Administration). It also regulates the use of assets and operations as well as access to third party mission products such as the Copernicus Earth Observation Program of the EU and the NOAA COSMIC (Constellation Observing System for Meteorology Ionosphere and Climate) and follow-on partnerships.
- The JPS extends to a new generation of polar-orbiting satellites the cooperation established since 1998 on the IJPS (Initial Joint Polar System) which builds on EUMETSAT’s MetOp and NOAA’s POES and Suomi-NPP satellites. — The agreement on the JPS was signed on 2 December 2015, between the EUMETSAT Director-General Alain Ratier and Stephen Volz, NOAA Assistant Administrator for Satellite and Information Services.
- JPS can be considered as a ‘system of systems’, with each party responsible for designing, sizing, and operating their own space and ground assets to meet their mission needs. At the same time, the partners have agreed to exploit those assets in a way that optimizes cross-support to the other party. Data and products generated by each party will be distributed to their own user community and will be available for access by the other party. Each party will fulfill its responsibilities on a best effort basis, taking into account schedule and funding constraints.
- Marc Cohen, Associate Director EUMETSAT said, “JPS is designed to provide observations from two complementary polar orbits in the period from 2020 to 2040. The Implementation Plan we have now signed will translate our designs into action.”
MetOp-SG Program Overview 11) 12)
• MetOp-Second Generation is a follow-on system to the first generation series of MetOp (Meteorological Operational) satellites, which currently provide operational meteorological observations from polar orbit.
• MetOp-SG is a collaborative program between ESA and EUMETSAT, similar to the previous successful cooperations between the two organizations.
• ESA is responsible for the development of the prototype satellites and, on behalf of EUMETSAT, for the procurement of the recurrent satellites.
• EUMETSAT is responsible for overall user requirements, procurement of the launchers and LEOP services, development of the ground segment and also performs the operations.
• ESA funding comes from the ESA MetOp-SG Program, which was approved at the ESA Council at Ministerial Level in November 2012.
• EUMETSAT funding will come from the EUMETSAT Polar System Second Generation (EPS-SG) Program, which is currently in the final stages of approval (Poland has already approved the Program).
Overall MetOp-SG Objectives
• To provide operational observations and measurements from polar orbit for numerical weather prediction and climate monitoring in the 2020 to mid-2040’s timeframe.
• In addition, to provide services to atmospheric chemistry, operational oceanography and hydrology.
• With respect to the first generation of MetOp satellites:
- to ensure continuity of essential operational meteorological observations from polar orbit, without a gap
- to improve the accuracy / resolution / dynamic range of the measurements (e.g. MWS, RO, SCA as well as METimage, IASI-NG, Sentinel-5)
- to add new measurements / missions (e.g. 3MI, MWI, ICI as well as Sentinel-5).
• MetOp-SG consists of two series of satellites (termed Satellite A and Satellite B), with three satellites in each series (3+3 configuration).
• A total of ten different instruments will be flown across the two satellites.
• Six instruments are developed as part of the MetOp-SG Program (Contractor Provided Item or CPI instruments):
- MWS (MicroWave Sounder)
- MWI (MicroWave Imager)
- ICI (Ice Cloud Imager)
- SCA (SCAtterometer)
- 3MI (Multi-viewing, Multi-channel, Multi-polarization Imager)
- RO (Radio Occultation sounder)
• Four instruments are Customer Furnished Items or CFIs (Sentinel-5 from ESA / EU Copernicus Program, METimage from DLR, and IASI-NG and Argos-4 from CNES) and are NOT the subject of this briefing.
• The ground segment development is the responsibility of EUMETSAT and is also NOT the subject of this briefing (Ref. 11).
Spacecraft
A two-satellite architecture has been selected for MetOp-SG by ESA and EUMETSAT, namely MetOp-SG- A and -B, flying in the same sun-synchronous orbit. Unlike the current MetOp system of identical satellites operating in a relay, the MetOp-SG system envisages a pair of different satellites, each carrying a different but complementary suite of instruments. This will comprise a mix of instruments offering data continuity with improved performance and new instruments to meet the evolving demands of the meteorological community.
The overall system lifetime is 21 years, with each satellite designed to exceed an eight and a half year lifetime.
On October 17, 2014, Airbus Defence and Space signed formal contracts with ESA to design and manufacture of six MetOp-SG satellites. 13)
Satellites key parameters | Satellite A | Satellite B |
Payload complement | METimage, IASI-NG, MWS, Sentinel-5, 3MI, RO | SCA, MWI, ICI, RO, Argos-4 |
Spacecraft mass | 4,400 kg | 4,180 kg |
Fuel | 684 kg | 659 kg |
Total ΔV | 325.8 m/s (of which 68% is for controlled reentry) | |
Stowed dimensions (m) | 6.5 (+0.55) x 2.97 x 3.46 | 6.1 (+0.55) x 2.91 x 3.43 |
Power consumption | 3.29 kW | 2.40 kW |
Nominal mode | Yaw steering – gyroless | |
Reaction wheels | 5 | 6 |
Safe mode | Earth pointing – 3 axes stabilized | |
Data storage | 745 Gbit (sized for 1.5 orbits of Satellite A) | |
Average data rate (Mbit/s) | 65 (day) & 27 (night) | 19 (day & night) |
Ka-band downlink (Mbit/s) | 781 (2 channels) | 390.5 (1 channel) |
X-band downlink (Mbit/s) | 80 | |
Design life | Nominal = 7.5 years, Extended = 9.5 years | |
EPS-SG Direct Broadcast: 14)
• Roughly 20-fold increase of sensing data rates from EPS to EPS-SG, with a corresponding increase in global and direct broadcast data rates
• Direct broadcast data rates will be 80 Mbit/s, making it impossible to remain in L-band as per EPS. The X-band has been chosen instead; The L-band will not be supported on the MetOp-SG satellites
• Satellite A has a much higher peak data rate than Satellite B, but both satellites will have exactly the same direct broadcast data rates (filler data to be inserted on Satellite B)
• In routine operations, Satellite B will be flying about 90° / 25 minutes ahead of Satellite A. MetOp satellites will also be flying in the same orbit, with MetOp-C nominally at 90° after MetOp-SG A1 until its deorbiting.
Characteristic | NPP/JPSS-1 | EPS-SG |
Reception station performance requirement, G/T | 22.7 dB/K | 22.7 dB/K |
Typical resulting antenna size | 2.4 m | 2.4 m |
Data rate (instrument data) | 16 Mbit/s | 80 Mbit/s |
Radio frequency | 7.8 GHz | 7.8 GHz |
Modulation scheme | QPSK | Offset QPSK |
Polarization | RHCP | RHCP |
• The parameter G/T is the main driver for the Reception Station Performance Requirements. For EPS-SG, the plan is to match the NPP requirement
• The G/T depends on the full chain of equipment including antenna dish quality and size, antenna tracking performance, feed, LNA, cabling, etc
• With good quality equipment, the required G/T can be achieved with a 2.4m antenna dish. To add additional margins for severe weather conditions and to mitigate potential local RF interference, a larger dish size may be chosen.
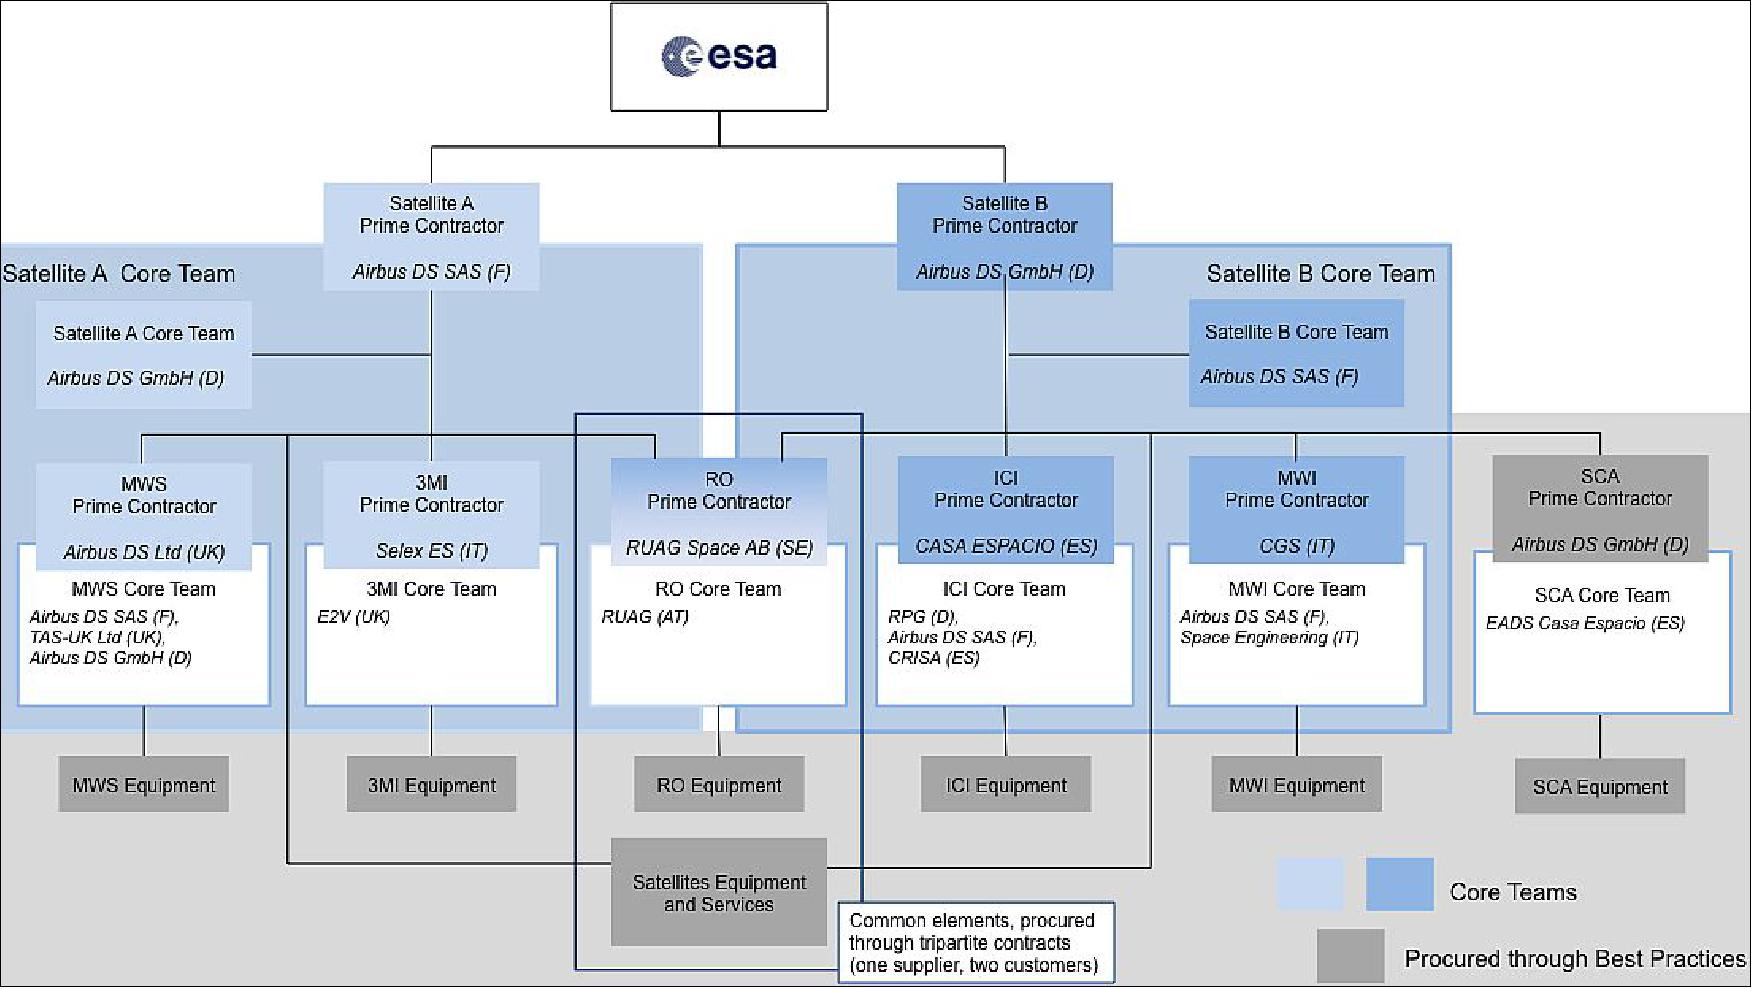
Figure 3: MetOp-SG industrial consortia (image credit: ESA, Ref. 6)
Development Status
• March 8, 2023: Test data have been released to users in BUFR format for the following instruments: MWS L1B, IASI-NG L1C, IASI-NG L1D, MWI L1B, ICI L1B, SCA L1B SZF, SCA L1B SZR, VII L2 (AMV, CLD, CTP, OCA, WVI, WVV), IASI-NG L2 (CLD, CO, GHG, NAC, O3, SFC, SO2, TWV). 65)
• April 4, 2022: The scatterometer antenna of MetOp Second Generation has successfully undergone extensive testing at Airbus' facilities in Madrid, Spain. The four-month testing campaign included trials replicating the extreme conditions of launch and space, covering aspects such as antenna deployment, thermal cycling, mechanical vibrations, and acoustic exposure. As one of the five instruments on the new MetOp-SG-B satellites, the scatterometer will play a crucial role in monitoring ocean winds, continental ice sheets, and land-surface soil moisture. This instrument is designed to provide comprehensive coverage of 99% of Earth's surface within a two-day period, offering a resolution of 25 km. 15)
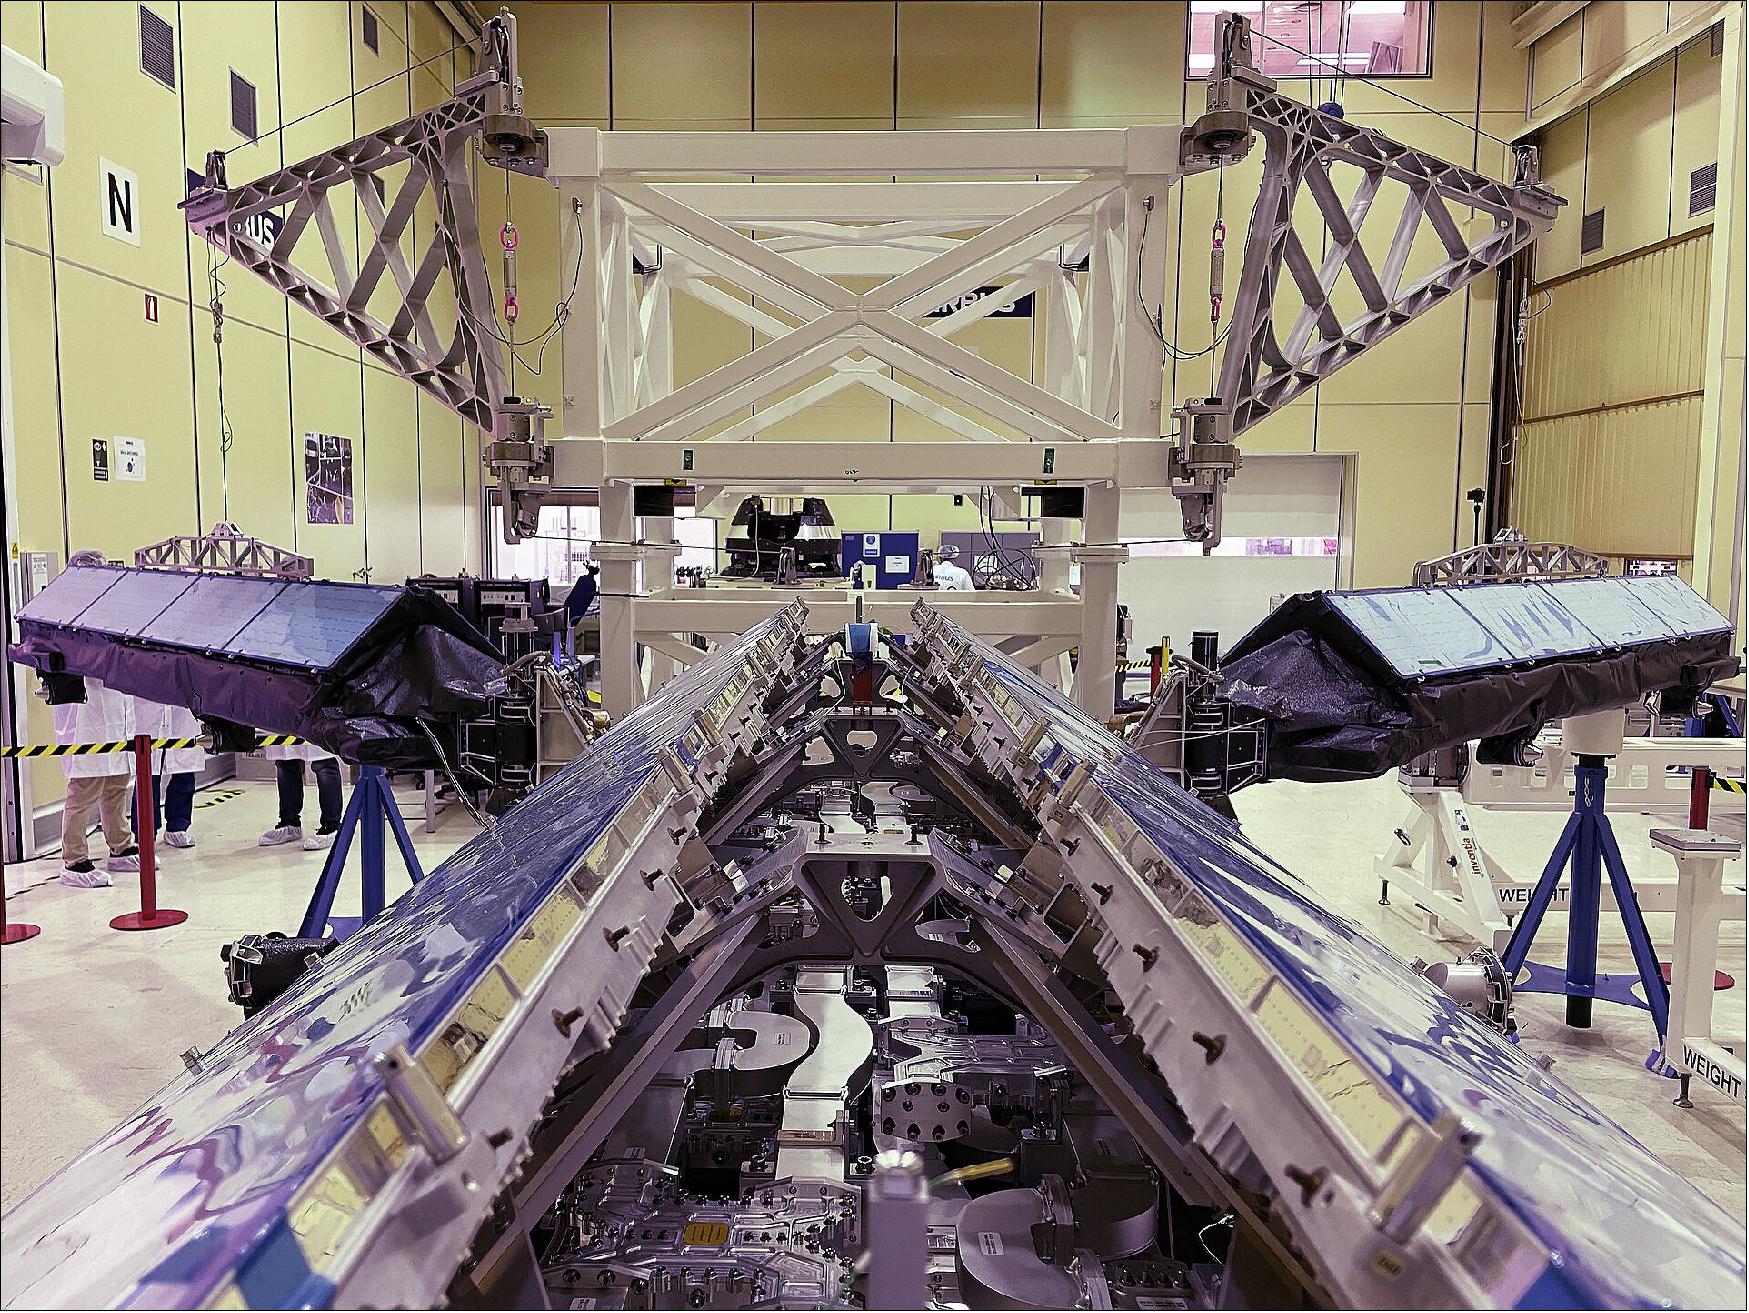
Figure 4: MetOp-SG B antenna deployment test (image credit: Airbus)
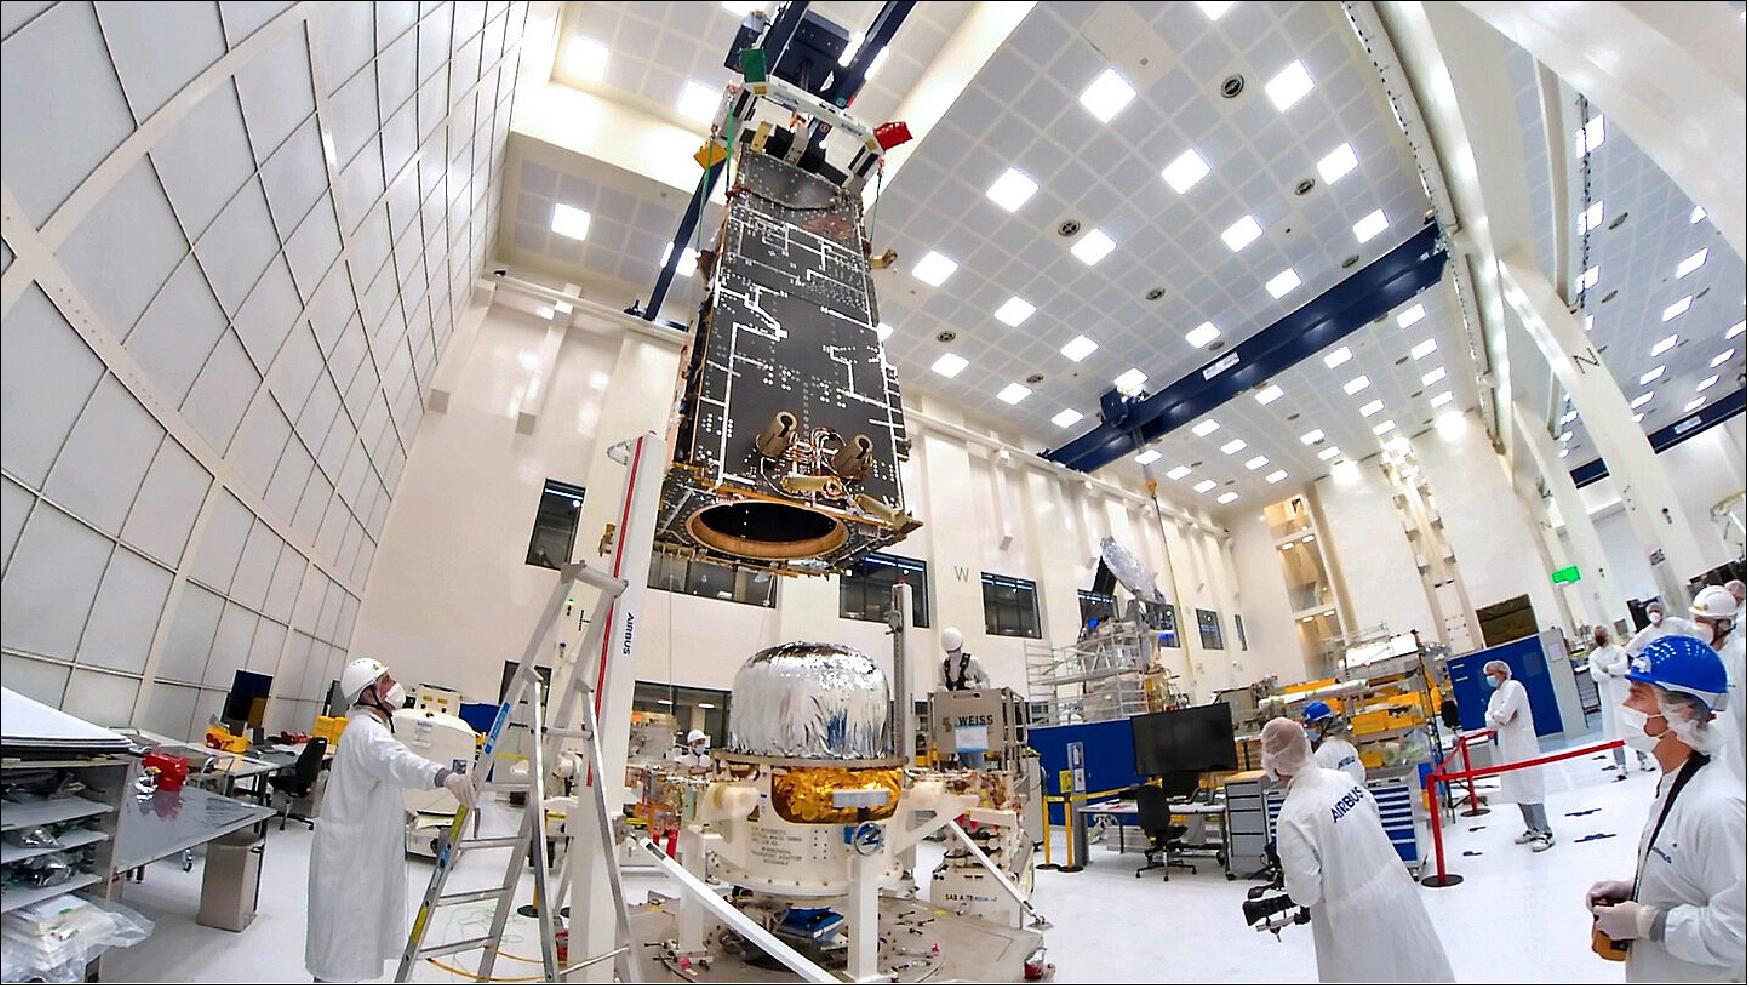
• October 7, 2021: The first MetOp-SG "B" model, part of the next-generation polar-orbiting weather satellite series, has undergone a precise integration with its propulsion system at Airbus' satellite integration center in Friedrichshafen, Germany. The propulsion system, constructed in Stevenage, UK, accommodates 760 kg of hydrazine fuel for maintaining the satellite's orbit and attitude throughout its mission, with controlled re-entry planned over the South Pacific at the mission's end. 16)
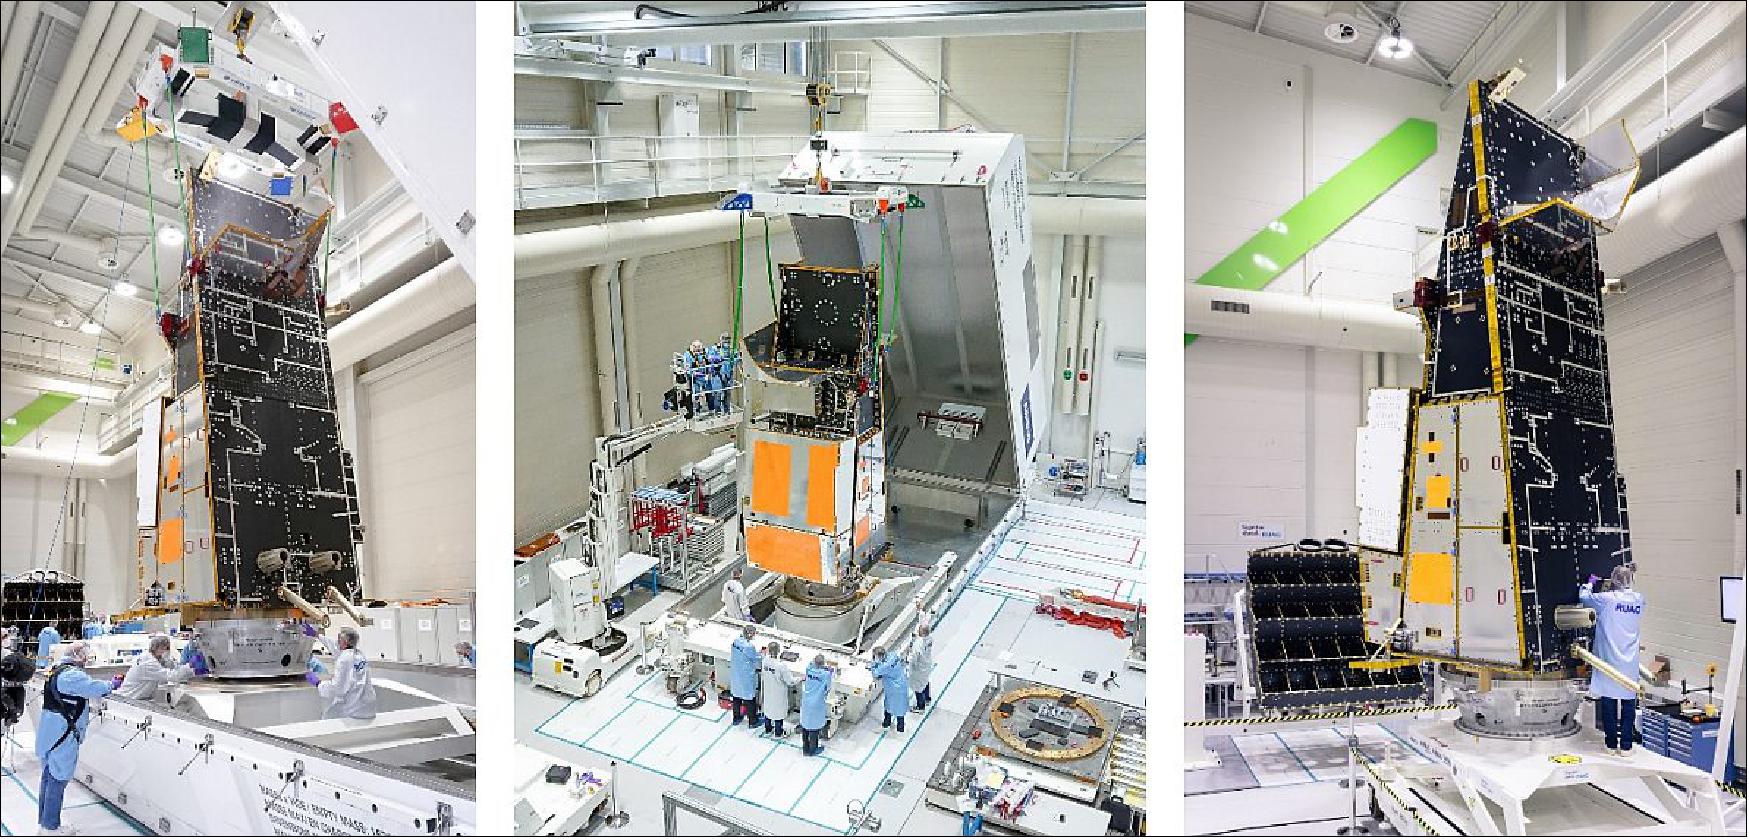
• May 6, 2021: RUAG Space in Zürich, Switzerland, is providing the second of six flight models for the MetOp-SG (Meteorological Operational Satellite-Second Generation), contributing to the enhancement of weather forecasting accuracy and the prediction of extreme weather events. The six-meter-high and 1000 kg basic structure, designed to endure the rigors of launch, extreme temperatures, and vacuum conditions in space, was developed by RUAG Space and assembled from over 24,000 parts. Constructed as a lightweight "sandwich" with an aluminum honeycomb core and carbon fiber-reinforced plastic cover layers, the structure aims to optimize fuel efficiency.17)
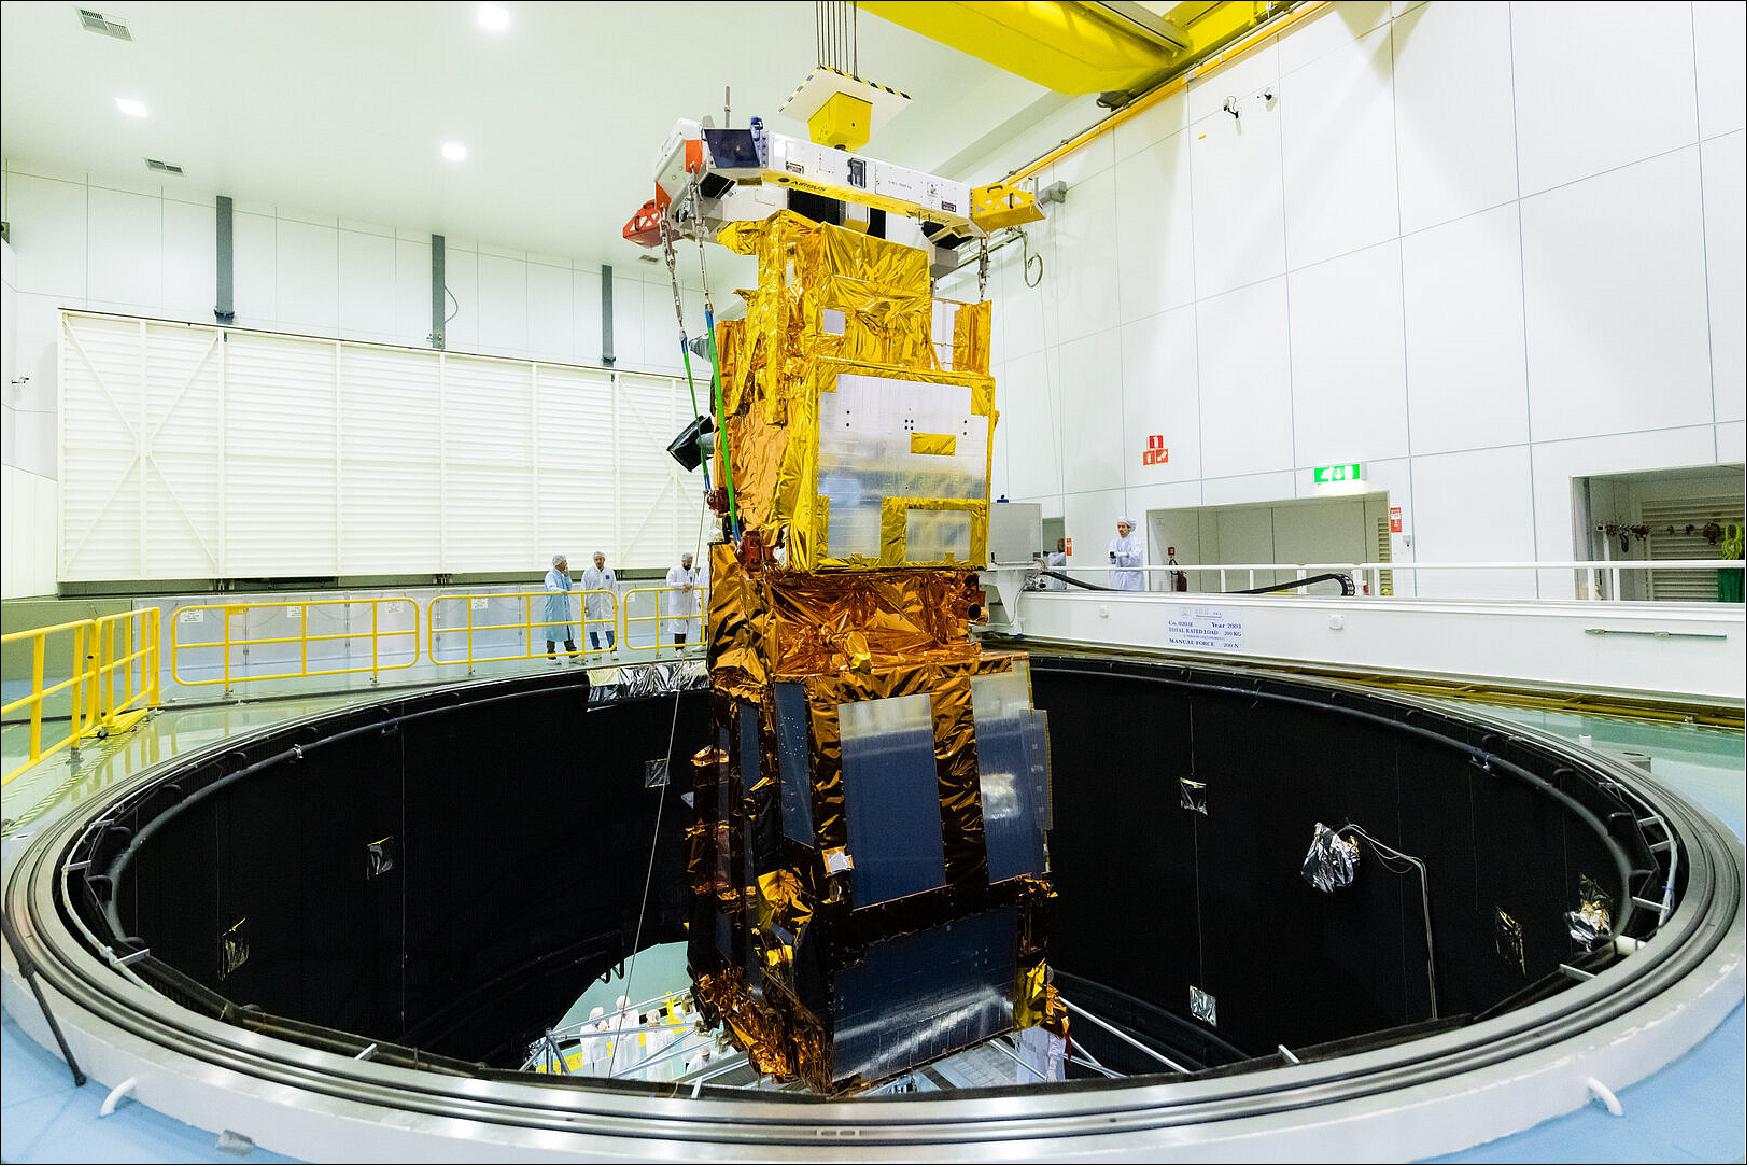
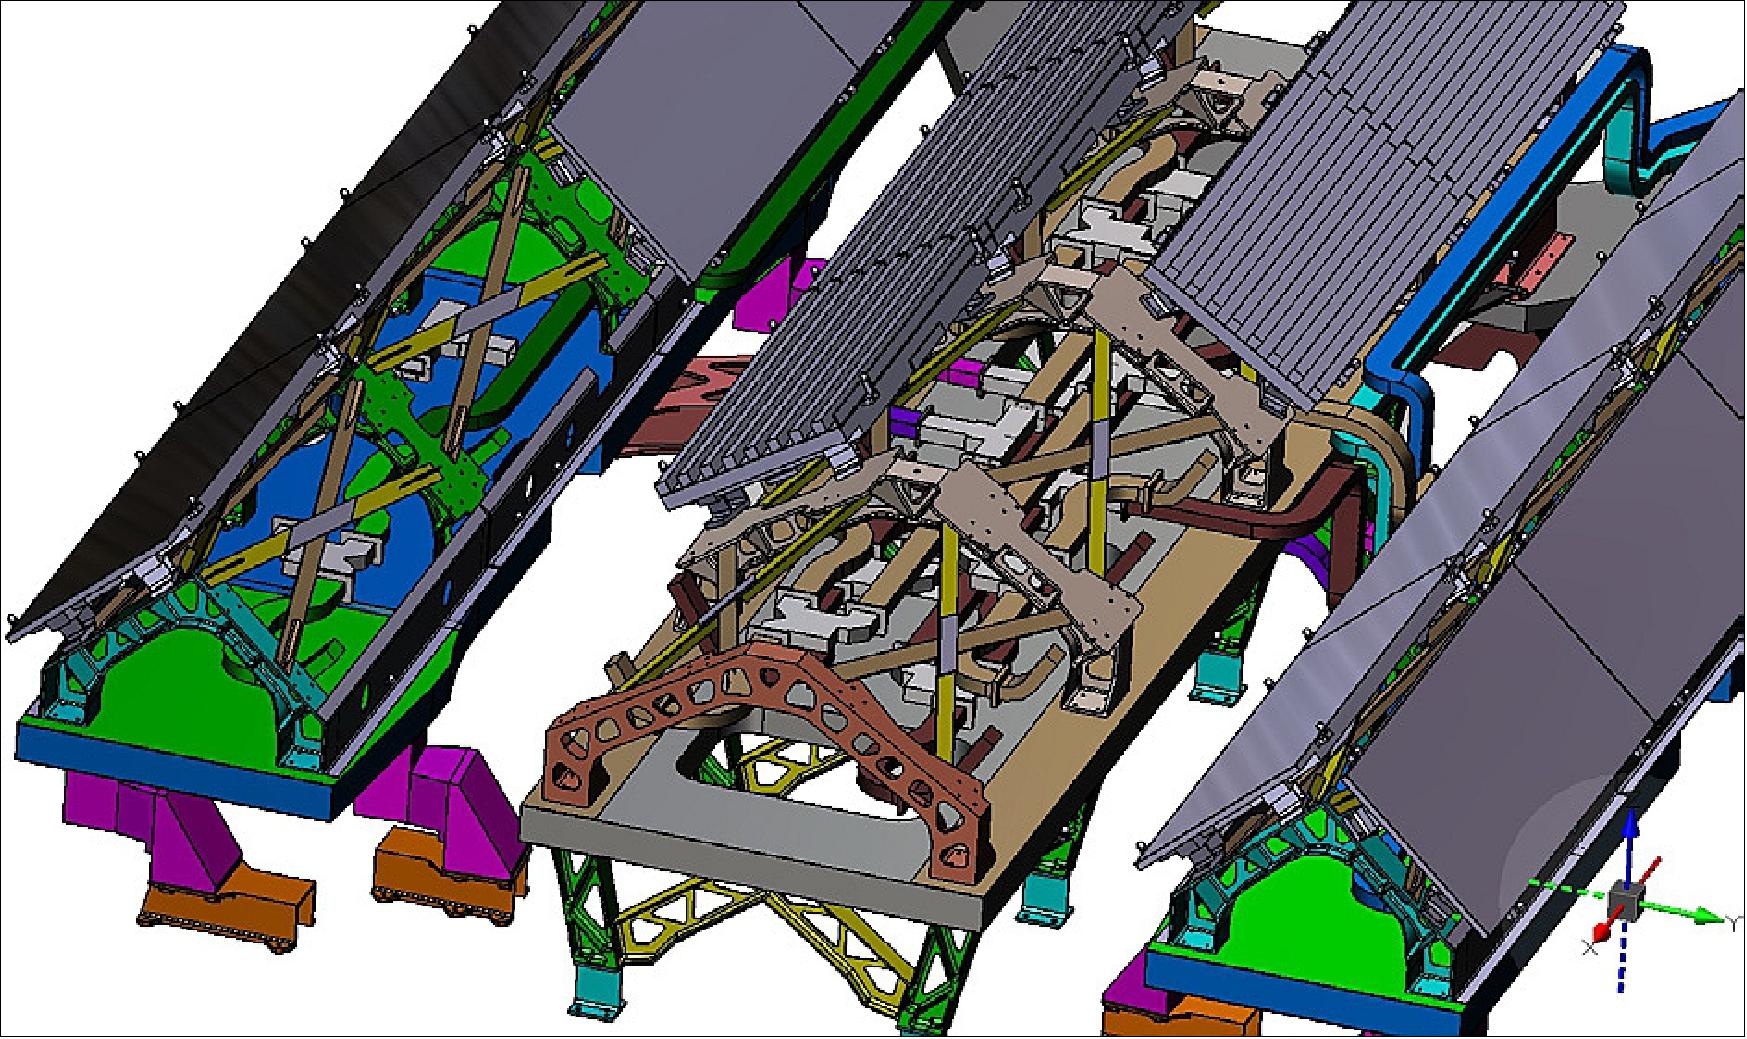
• November 25, 2019: ESA/ESTEC in the Netherlands has successfully completed the initial test campaign for MetOp Second Generation (MetOp-SG), the follow-on system to the MetOp satellites. The test item, a prototype version known as the 'structural and thermal model' (STM), underwent rigorous testing, including vibration testing, thermal testing in a vacuum chamber, acoustic testing simulating the noise of a launch, a separation test, and alignment testing. The MetOp-SG system comprises two different satellites, each with different instrument suites. The testing of the STM provides essential qualification data, confirming the analysis performed during the design stage. 18)

• May 30, 2019: The SENER Group has delivered the Engineering Qualification Models (EQM) of the Ice Cloud Imager (ICI) Back End Receivers for MetOp SG, the second generation of weather satellites. These satellites, consisting of six units, are set to be deployed by the European Space Agency (ESA) and the European Organization for the Exploitation of Meteorological Satellites (EUMETSAT) starting in 2021 until mid-2040. The Back End Receivers play a crucial role in measuring the power detected within the received signal across different channels, involving complex conditioning and amplification stages. After delivering the EQMs, SENER will proceed with manufacturing the Flight Models. Additionally, SENER is responsible for various components, including hold-down and release mechanisms, deployment and latching mechanisms, and reception equipment for radiometers and telemetry/telecommand antennas for MetOp-SG. 19)
• November 18, 2016: Airbus Defence and Space has awarded the Communications & Medical Products Division of Communications & Power Industries (CPI) an 8.7 million euro contract to support a new generation of satellites set to provide global advanced meteorological data from 2021 until after 2040. Under the contract, CPI will develop engineering and flight models of 5.355 GHz Extended Interaction Klystrons (EIKs). These EIKs are essential for the Scatterometer (SCA) radar instrument, generating high-power microwaves crucial for measuring surface winds over the ocean. The work will be carried out at CPI’s facilities in Georgetown, Ontario, Canada, with the delivery of flight models beginning in 2019. 20)
• September 20, 2016: DLR has awarded a contract to Airbus DS for the design, construction, and testing of the METimage radiometer (Figure 9). This complex instrument, comprising three sensors, two of which are infrared sensors operating at cryogenic temperatures below -210°C, observes a 12 km wide and 2,670 km long swath of the Earth's surface within 1.7 seconds using a scan mirror oriented perpendicular to the flight direction. METimage delivers data through 20 channels, making it one of the most intricate instruments Airbus Defence and Space is currently developing. 21) 22)
• December 8, 2015: EUMETSAT and CNES have entered a cooperation agreement for the development of a new generation of IASI-NG (Infrared Atmospheric Sounding Interferometers). Under this agreement, CNES will be responsible for developing the complete IASI-NG system, including the instrument and the data processing chain. CNES will also procure recurrent instruments on behalf of EUMETSAT and provide operational support. EUMETSAT will fund 30% of the development costs for the first instrument and all recurrent instruments. Furthermore, EUMETSAT will integrate the IASI-NG data processing chain into its operational ground systems and utilize the instrument chain throughout the EPS-SG system's lifetime. 23)
• October 5, 2015: EUMETSAT and ESA signed a cooperation agreement that secures the development of the MetOp Second Generation satellites which form the space segment of the EUMETSAT Polar System of Second Generation. 24)
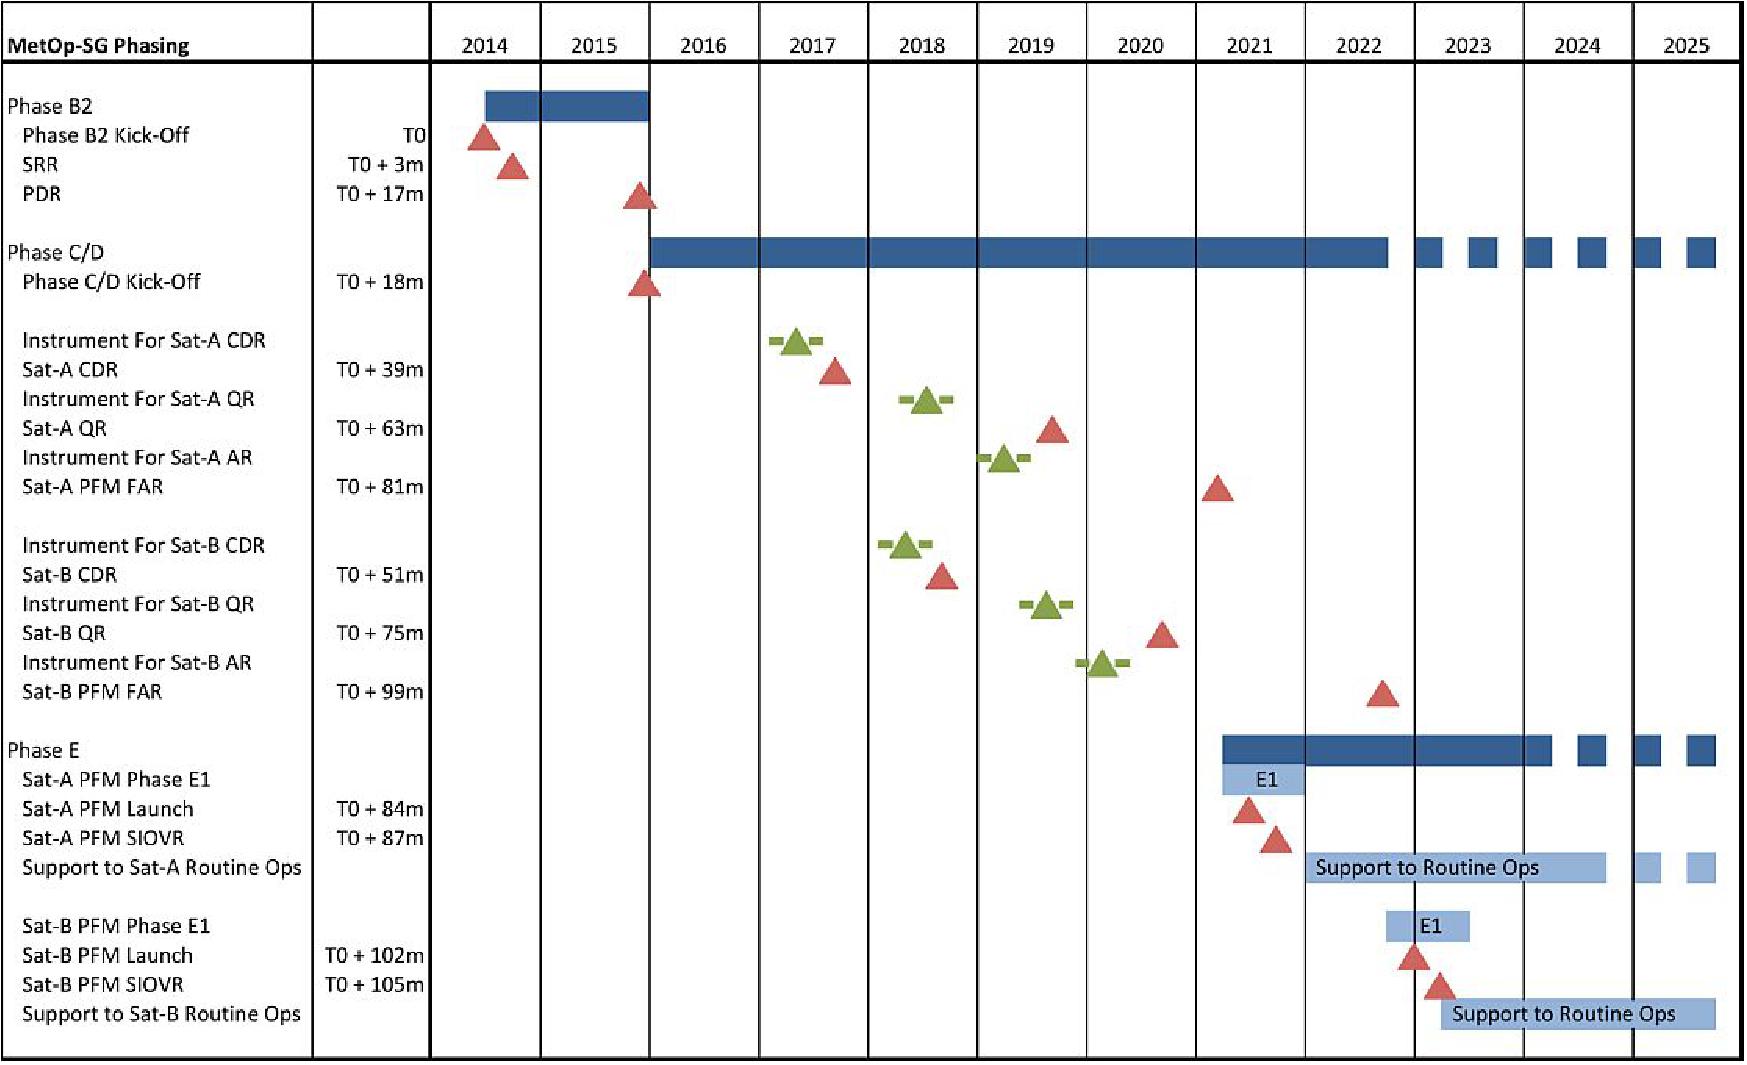
MetOp-SG Status as of May 2015
• Phase B2 Kick-off: 28 May 2014
• Industry Days Event: 25 – 26 June 2014
• System Requirements Review: September – October 2014
• Contract Signature: 16 October 2014
• SCA Kick-off: 11 December 2014
• Preliminary Design Review: September – November 2015
• MWS, 3MI, RO, MWI and ICI instruments kicked-off together with the Satellites in May 2014.
• SCA instrument selected through Best Practices and kicked-off in December 2014.
• Currently, the main industrial activities are the build-up of the industrial consortia through the Best Practices procurements and preparation for the PDR.
Launch
Orbit: The MetOp-SG satellites will orbit Earth in a sun-synchronous orbit at a mean altitude of ~835 km to provide global coverage, LTDN (Local Time on Descending Node) = 09:30 hours. Identical orbit as for EPS ⇒ shared orbit between MetOp and MetOp-SG satellites.
Sensor Complement
Since 2006, the European contribution to operational meteorological observations from polar orbit has been provided by the first generation of Meteorological Operational (MetOp) satellites. The MetOp-SG (MetOp Second Generation) series of satellites will provide continuity and enhancement of these observations in the timeframe of 2020 to 2040.
The payload of the MetOp-SG satellites consists of the following 10 instruments: 25) 26) 27)
• METimage (Meteorological Imager), to provide information on clouds, cloud cover, land surface properties, sea, ice and land surface temperatures, etc. The METimage instrument is provided by DLR via EUMETSAT.
• IASI-NG (Infrared Atmospheric Sounding Interferometer–New Generation), to provide atmospheric temperature and humidity profiles, as well as monitor ozone and various trace gases. IASI-NG is provided by CNES via EUMETSAT.
• MWS (MicroWave Sounder), to provide atmospheric temperature and humidity profiles. MWS is provided by ESA
• SCA (Scatterometer), to provide ocean surface wind vectors and land surface soil moisture. SCA is provided by ESA.
• RO (Radio Occultation sounder), to provide atmospheric temperature and humidity profiles, as well as information about the ionosphere. RO is provided by ESA.
• UVNS/S5 (Ultra-Violet /Visible/Near Infrared/Short Wave Infrared spectrometer -Sentinel-5) instrument, to monitor various trace gases, air quality and support climate monitoring. Sentinel-5 is provided by ESA.
Note: The Sentinel-5/UVNS instrument is described in a separate file on the eoPortal.
• MWI (MicroWave Imager), to provide precipitation monitoring as well as sea ice extent information. MWI is provided by ESA.
• ICI (Ice and Cloud Imager), to measure cloud ice water path, properties and altitude. ICI is provided by ESA.
• 3MI (Multi-viewing, Multi-channel, Multi-polarization Imager), to provide information on atmospheric aerosols
• ADCS (Advanced Data Collection System) Argos-4, for the collection and transmission of observations and data from surface, buoy, ship, balloon or airborne data collection platforms. ADCS-4 is provided by CNES via EUMETSAT.
ESA is responsible for design/development of the following 6 instruments within the MetOp-SG program: MWS, SCA, RO, MWI, ICI and 3MI. The Sentinel-5 instrument (UVNS/S5) is developed by ESA under the Copernicus Program, formerly GSC (GMES Space Component) program. The other instruments are provided through EUMETSAT under cooperation agreements with its partners DLR, CNES and NOAA and will be provided as Customer Furnished Items to the MetOp-SG contractor.
ICI (Ice Cloud Imager)
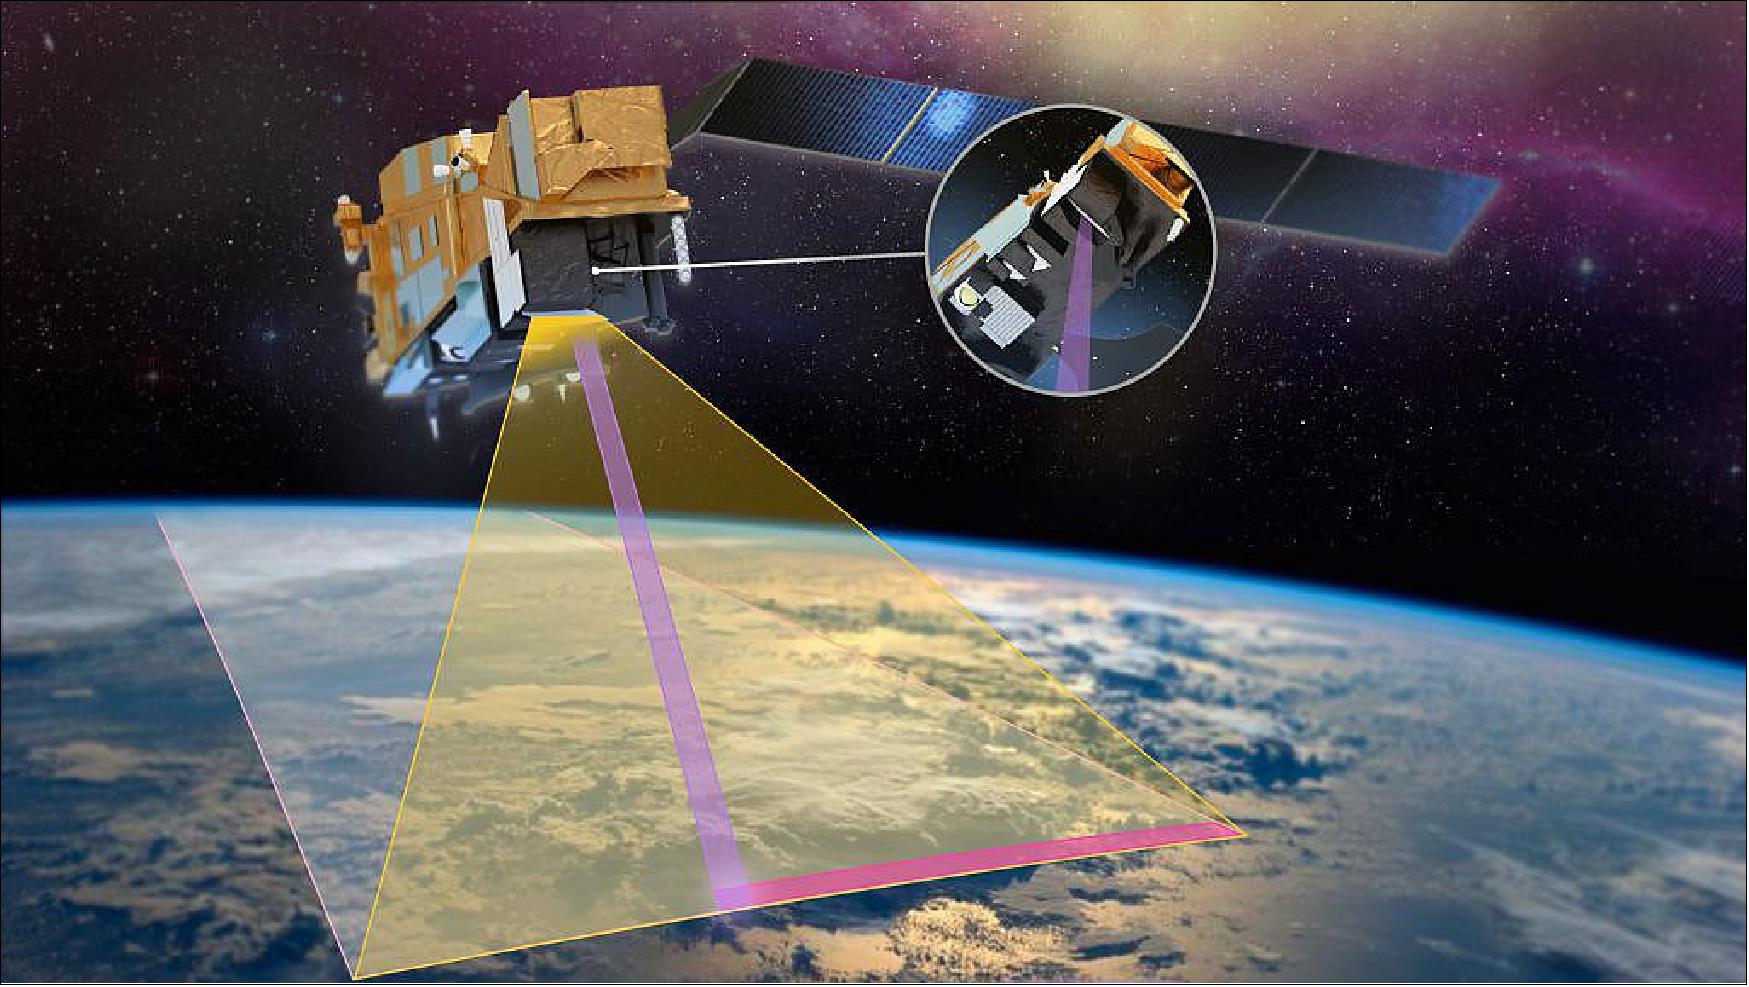
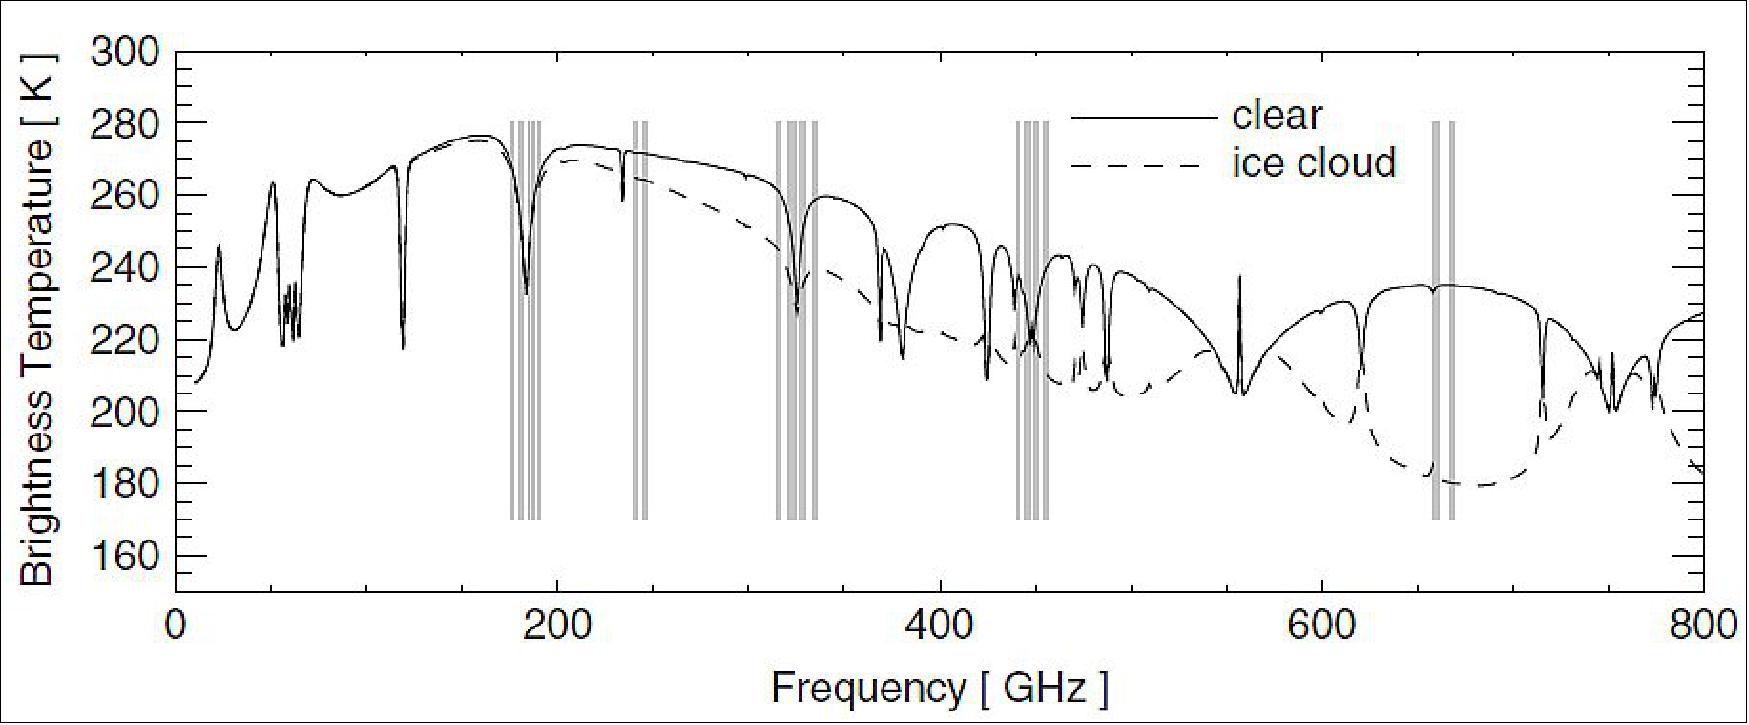
The ICI instrument is a total power millimeter and sub-millimeter wave conically scanning radiometer, providing brightness temperature measurements in 11 channels, two of them dual-pol, ranging from 183 GHz up to 664 GHz. ICI is designed to monitor the exchange mechanisms in Earth's upper troposphere and lower stratosphere, and focusing in particular on the remote sensing of high altitude ice clouds using several heterodyne receiver channels centered at 183 GHz, 243 GHz, 325 GHz, 448 GHz and 664 GHz, with two window channels (243 GHz and 664 GHz) measured at both V and H polarization. In recent years, several ESA funded activities have been aimed at further advancing the maturity of sub-millimeter wave Schottky technology in Europe in order to fulfil the ICI stringent requirements (Ref. 39). 28) 29) 30) 31)
Airbus DS-CASA Espacio, Spain (former EADS CASA Espacio) was selected by ESA (European Space Agency) as the prime contractor of the ICI instrument. Airbus DS SAS (France), RPG and CRISA are part of the industrial core team as well. Even if the technique to measure ice clouds was already proposed in 1995, this sub-millimeterwave imager will be the first radiometer of its kind ever developed for Earth observation from space.
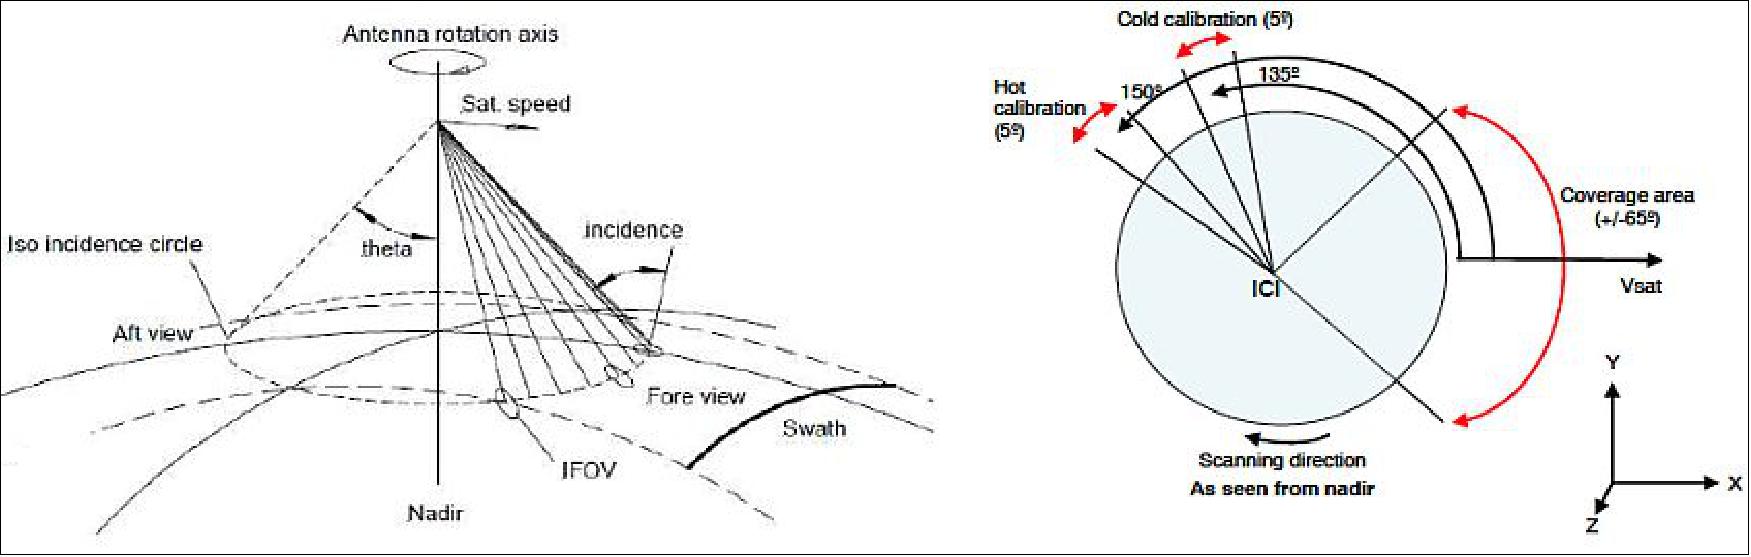
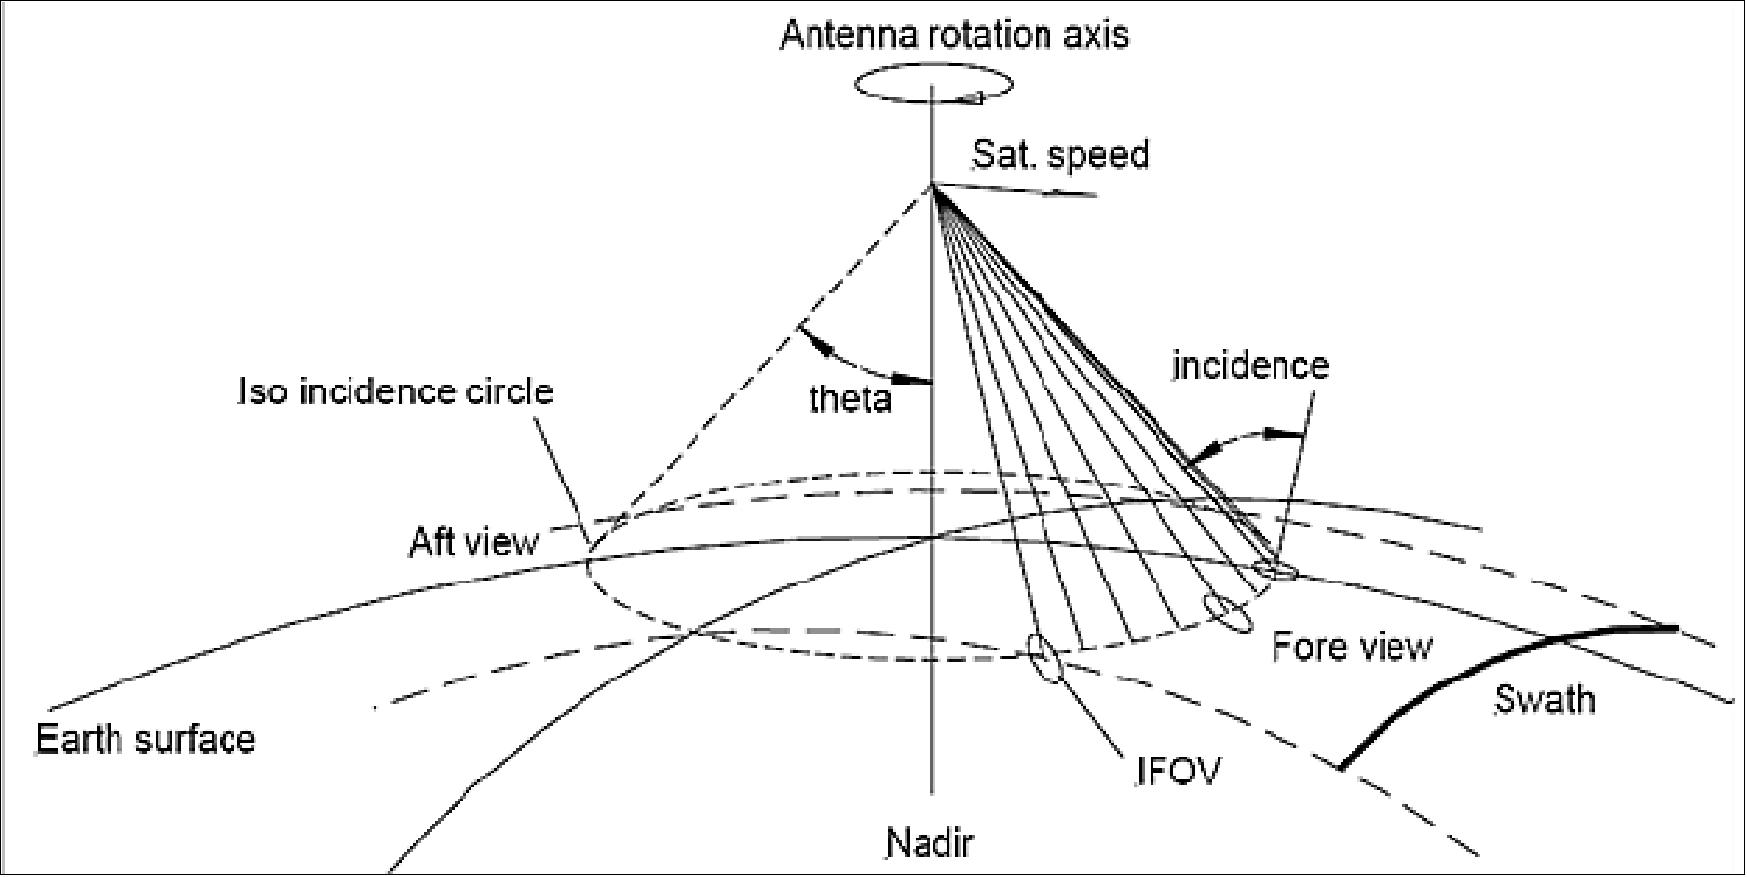
The ICI radiometer rotates at a constant speed of 45 rpm, providing Earth scene measurements to over an azimuth range of ±65º, with an incidence angle of around 53º and a projected footprint of 15 km for all channels. All footprints are sampled at Nyquist, providing a good image quality capability. The channels at 243 GHz and 664 GHz are measured at V and H polarizations, while all other channels are measured in V polarization. Hot and Cold calibrations are performed periodically at each rotation.
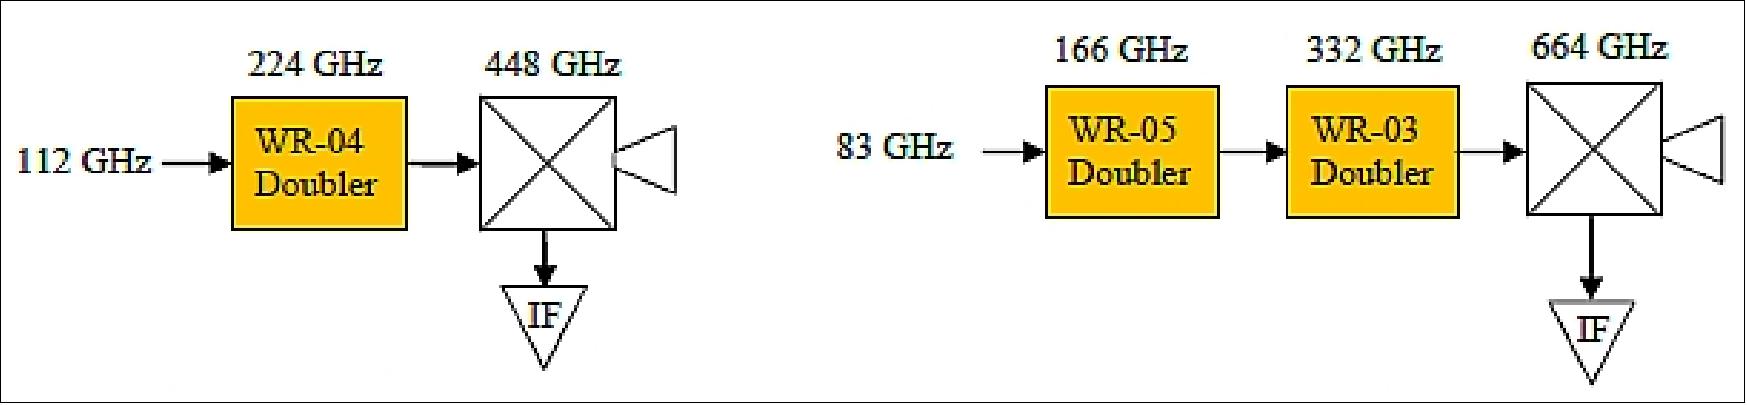
The ICI instrument onboard the MetOp-SG-B series will include several receiver channels that cover part of the millimeter and part of the sub-millimeter wave range, at center frequencies of 183 GHz, 243 GHz, 325 GHz, 448 GHz and 664 GHz. A lot of results have already been obtained up to 325 GHz, as discrete devices can be used in this frequency range without major limitation or performance degradation compared to integrated MMIC devices. At 448 GHz, it is expected that both discrete and integrated mixer devices will give a similar performance. The decision factor might come from repeatability issues during mounting and eventually stress tests. A schematic of a 448 GHz receiver frontend is shown in Figure 13 on the left hand side. It includes a medium power 224 GHz doubler, a 448 GHz sub-harmonic mixer and an IF Low Noise Amplifier (LNA).
Channel No | Frequency (GHz) | Bandwidth (GHz) | Polarization | Utilization | NEΔT (K) |
ICI-1 | 183.31±8.4 | 6 | V |
| 0.6 |
ICI-2 | 183.31±3.4 | 3 | V | 0.7 | |
ICI-3 | 183.31±2.0 | 3 | V | 0.7 | |
ICI-4 | 243.2±2.5 | 6 | V, H | Quasi-window, cloud ice retrieval, cirrus clouds | 0.6 |
ICI-5 | 325.15±9.5 | 6 | V |
| 1.1 |
ICI-6 | 325.15±3.5 | 4.8 | V | 1.2 | |
ICI-7 | 325.15±1.5 | 3.2 | V | 1.4 | |
ICI-8 | 448±7.2 | 6 | V |
| 1.3 |
ICI-9 | 448±3.0 | 4 | V | 1.5 | |
ICI-10 | 448±1.4 | 2.4 | V | 1.9 | |
ICI-11 | 664±4.2 | 10 | V, H | Quasi-window, cirrus clouds, cloud ice water path | 1.5 |
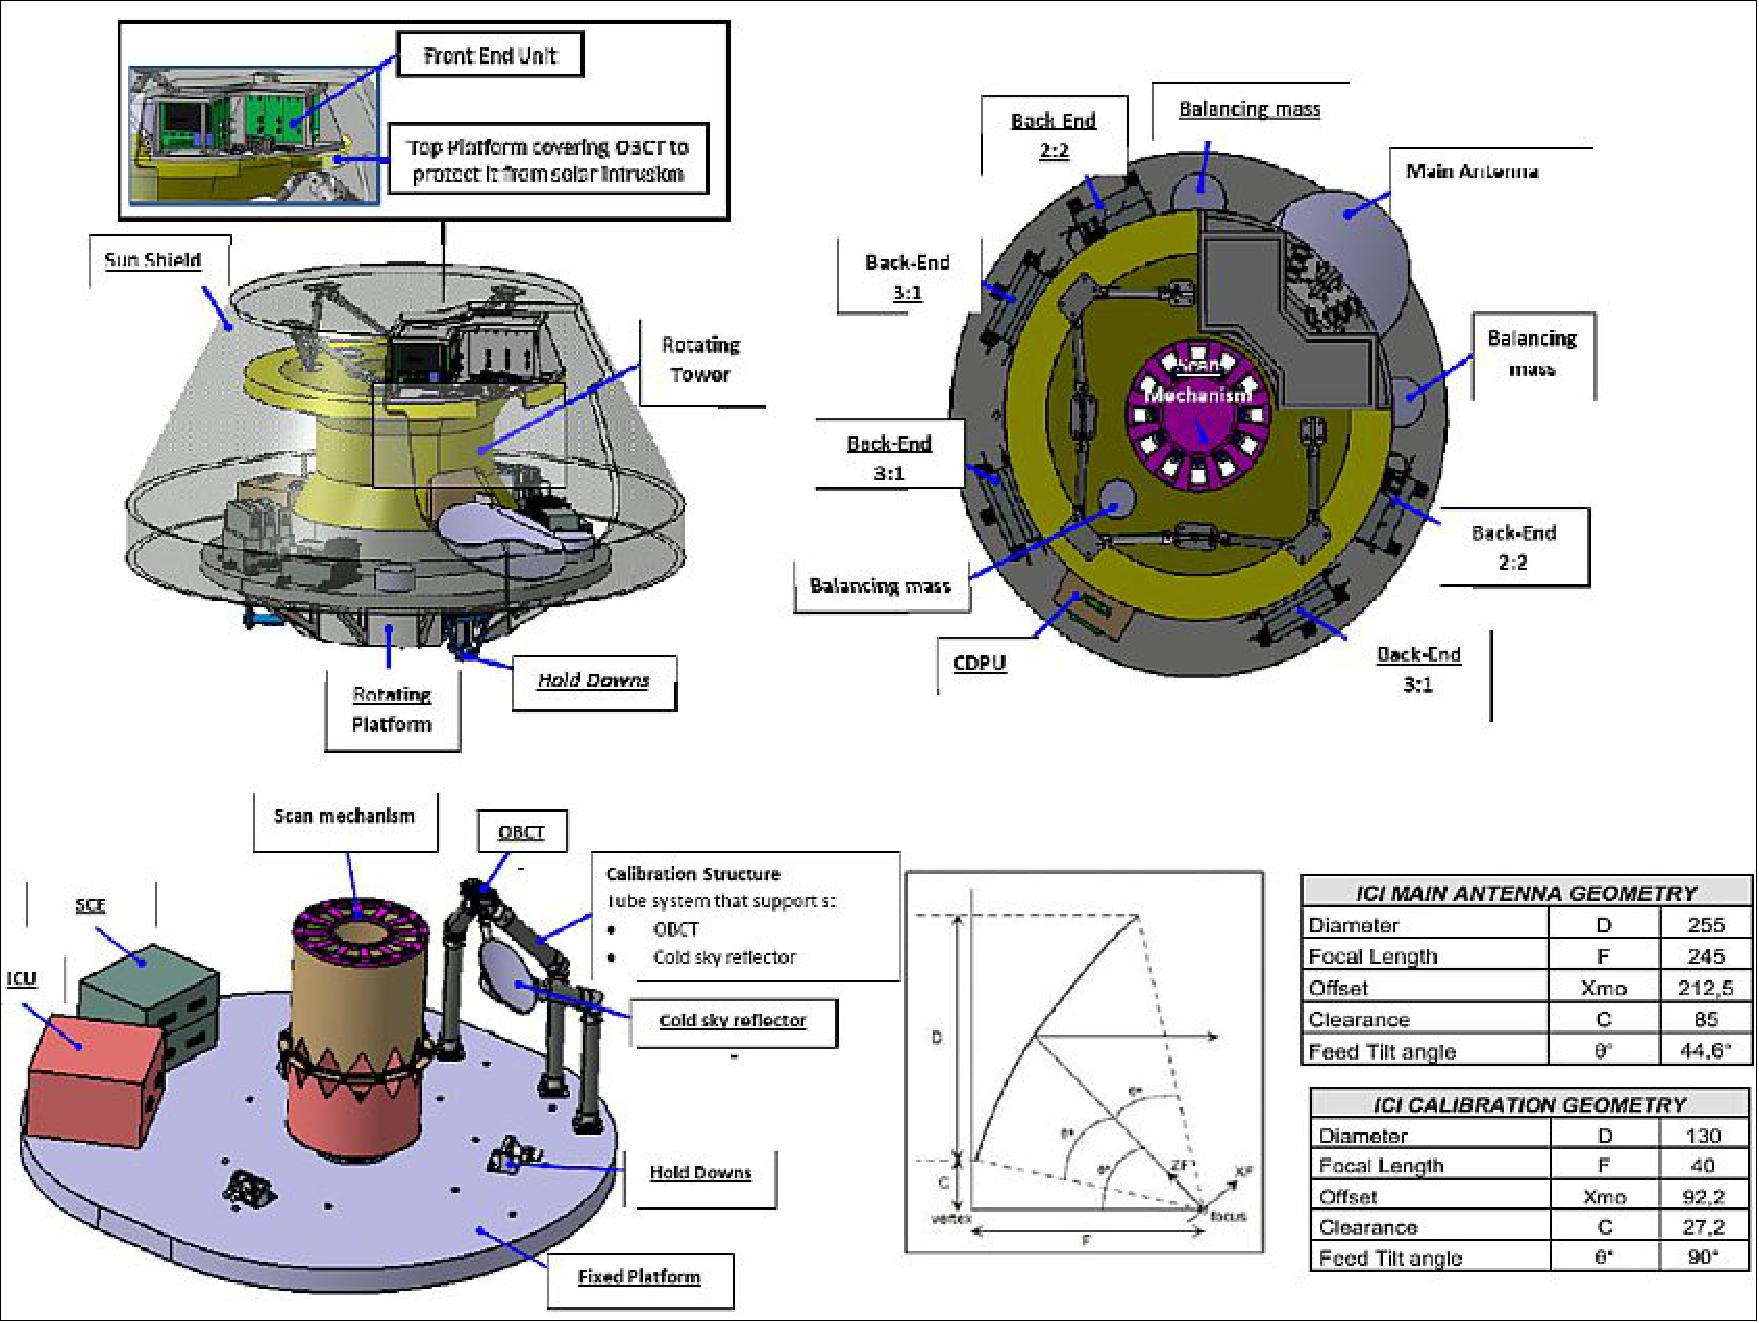
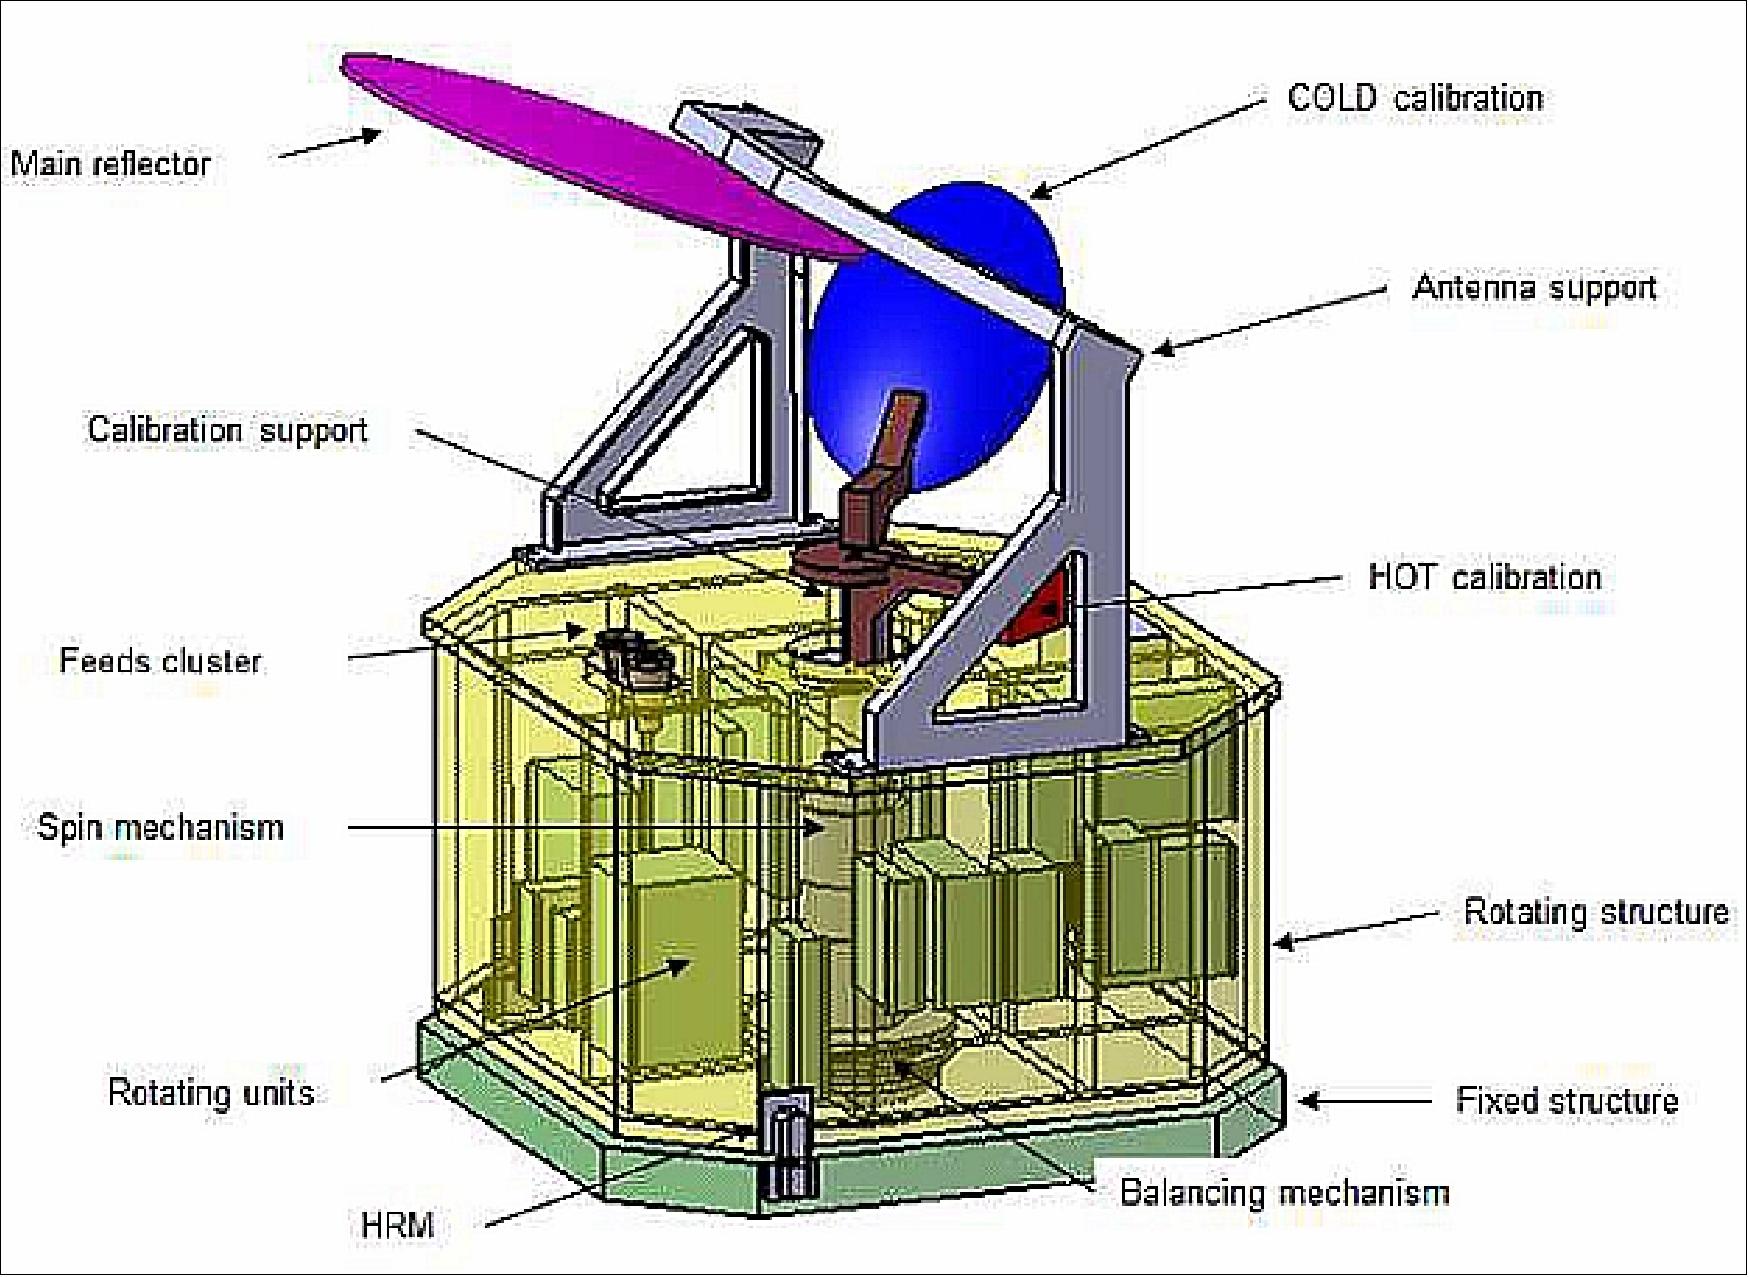
While the rotating part has to be external to the platform, the fixed part can be accommodated either internally or externally to the platform. The advantage of having the fixed part placed inside the platform is the reduction of instrument envelope that makes it easier to manage the ICI payload accommodation.
The moving part is rotated about the axis of the instrument by a coaxially mounted motor and it includes the reflector and feed horns that are mounted on a "drum" which contains the receivers, a digital processing unit and a power supply unit.
Contrary to traditional conical scanners, ICI will be mounted on the nadir side of the spacecraft. The 183 GHz channel selection overlaps with the one of MWI, allowing a cross-calibration between the two instruments.
Scanning technique | Conical: 53.1º zenith angle, swath width of 1700 km; Scan rate: ~ 27 scan/min = ~ 15 km/scan |
Spatial resolution | Consistent with an antenna diameter of ~ 0.5 m, brought to same (15 km) for all channels |
Coverage / Cycle | Global coverage once/day |
Instrument mass, power, data rate | 70 kg, 80 W, 60 kbit/s |
The new (Sub)millimeter-wave Scanner Test Facility at ESA/ESTEC in Noordwijk, the Netherlands, was used for the first time for early testing of prototype feed horns designed for the highest frequency channel of a ‘radiometer’ to scan Earth’s atmosphere for icy cirrus clouds. 34)
These high-altitude clouds play a crucial role in global climate. They reflect radiation from the Sun back into space as well as trapping upwelling radiation from below in a natural greenhouse effect. Which of these two competing mechanisms dominates depends on the altitude, the composition of the clouds and the size and shape of the ice crystals making up the clouds. - As part of the MetOp-SG payload, ICI (Ice Cloud Imager) will continuously observe Earth’s atmosphere in 11 mm and sub-mm channels.
“With our new (Sub)mm-wave Scanner we can easily work with frequencies up to 750 GHz,” explains ESA antenna engineer Elena Saenz. “This test bench, equipped to build up a detailed signal picture in all directions, is the functional equivalent of the full-scale Hertz Hybrid European RF and Antenna Test Zone chamber, big enough to encapsulate entire satellites or large antennas, which operates up to 50 GHz. But there are big challenges associated with extending our operating frequencies upwards in this way. First of all, the extreme electronics performance needed to generate the radio signals, and then to ensure the highly precise alignment of the test, using laser measurement systems. The scanner itself rests on a granite block to isolate it from external vibration.”
MWI (MicroWave Imager)
MWI is a conically scanning total power microwave radiometer (antenna size of ~ 75 cm), an imager which rotates continuously about an axis parallel to the local spacecraft vertical with an active portion of the scan of > ±65º centered on the fore (or afterward) direction of the spacecraft. The antenna system will view an Earth scene with a nearly constant incidence angle ,or OZA (Observation Zenith Angle), of ~53º±2º. 35) 36)
The instrument is providing a total number of 26 channels (including dual polarization channels). The MWI frequency coverage is from 18 GHz up to 183 GHz. Table 6 shows the MWI channels, utilization purpose and NEΔT. All MWI channels up to 89 GHz are measured with both V- and H polarizations. Channels above 89 GHz are measured at V polarization only (Ref. 39).
The main goal of the MWI is to serve operational meteorology, oceanography, sea-ice/snow/land surface observation and climate applications. The MWI will provide continuity of other key microwave imager channels (e.g., SSM/I, TRMM TMI, SSMIS, AMSRE, AMSR-2, GMI) in support of long-term climate records.
Channel No | Frequency (GHz) | Bandwidth MHz) | Utilization | NEΔT (K) | Footprint (km) |
MWI-1 | 18.7 | 200 | Precipitation over sea | 0.7 | 50 |
MWI-2 | 23.8 | 400 | Total column water vapor over sea | 0.6 | |
MWI-3 | 31.4 | 200 | Precipitation over sea and (marginally) land | 0.8 |
|
MWI-4 | 50.3 | 400 |
|
| |
MWI-5 | 52.61 | 400 | |||
MWI-6 | 53.24 | 400 | |||
MWI-7 | 53.75 | 400 | |||
MWI-8 | 89 | 4000 | Precipitation (sea & land) & snowfall | 0.8 |
|
MWI-9 | 118.7503±3.2 | 2 x 500 |
|
| |
MWI-10 | 118.7503±2.1 | 2 x 400 | |||
MWI-11 | 118.7503±1.4 | 2 x 400 | |||
MWI-12 | 118.7503±1.2 | 2 x 400 | |||
MWI-13 | 165.5±0.725 | 2 x 1350 | Quasi-window, water-vapor profile, precipitation over land, snowfall | 1.1 | |
MWI-14 | 183.31±8.4 | 2 x 2000 |
| 1.0 | |
MWI-15 | 183.31±6.1 | 2 x 1500 | 1.1 | ||
MWI-16 | 183.31±4.9 | 2 x 1500 | 1.1 | ||
MWI-17 | 183.31±3.4 | 2 x 1500 | 1.1 | ||
MWI-18 | 183.31±2.0 | 2 x 1500 | 1.2 |
The main objective of the MWI is to measure precipitation. In addition, MWI provides measurements of cloud products, water vapor and temperature profiles and surface imagery. MWI supports NWP (Numerical Weather Prediction) at regional and global scales. MWI has a moderate antenna size providing on-ground footprints ranging from 50 km down to 10 km, depending on frequency. The smallest antenna footprint defines the minimum rotation cycle, and footprint overlap is present also for highest frequencies due to the high rotation rate (45 rpm). This guarantees a good image quality and even Nyquist spatial sampling at the lowest frequency channels.
The relatively small antenna of MWI does not require deployment mechanism and enables a complete sun shield around the instrument to protect from sun-intrusions.
Additional features of MWI include RFI (Radio Frequency Interference) mitigation at the lowest frequency channel and internal calibration targets to complement traditional external targets. RFI mitigation is done by dividing the measured signal spatially, spectrally and temporally and detecting non-Gaussian (man-made) signals and removing them from the data. Internal calibration targets will be implemented at the lowest frequency channels, providing improvement of orbital stability of the instrument.
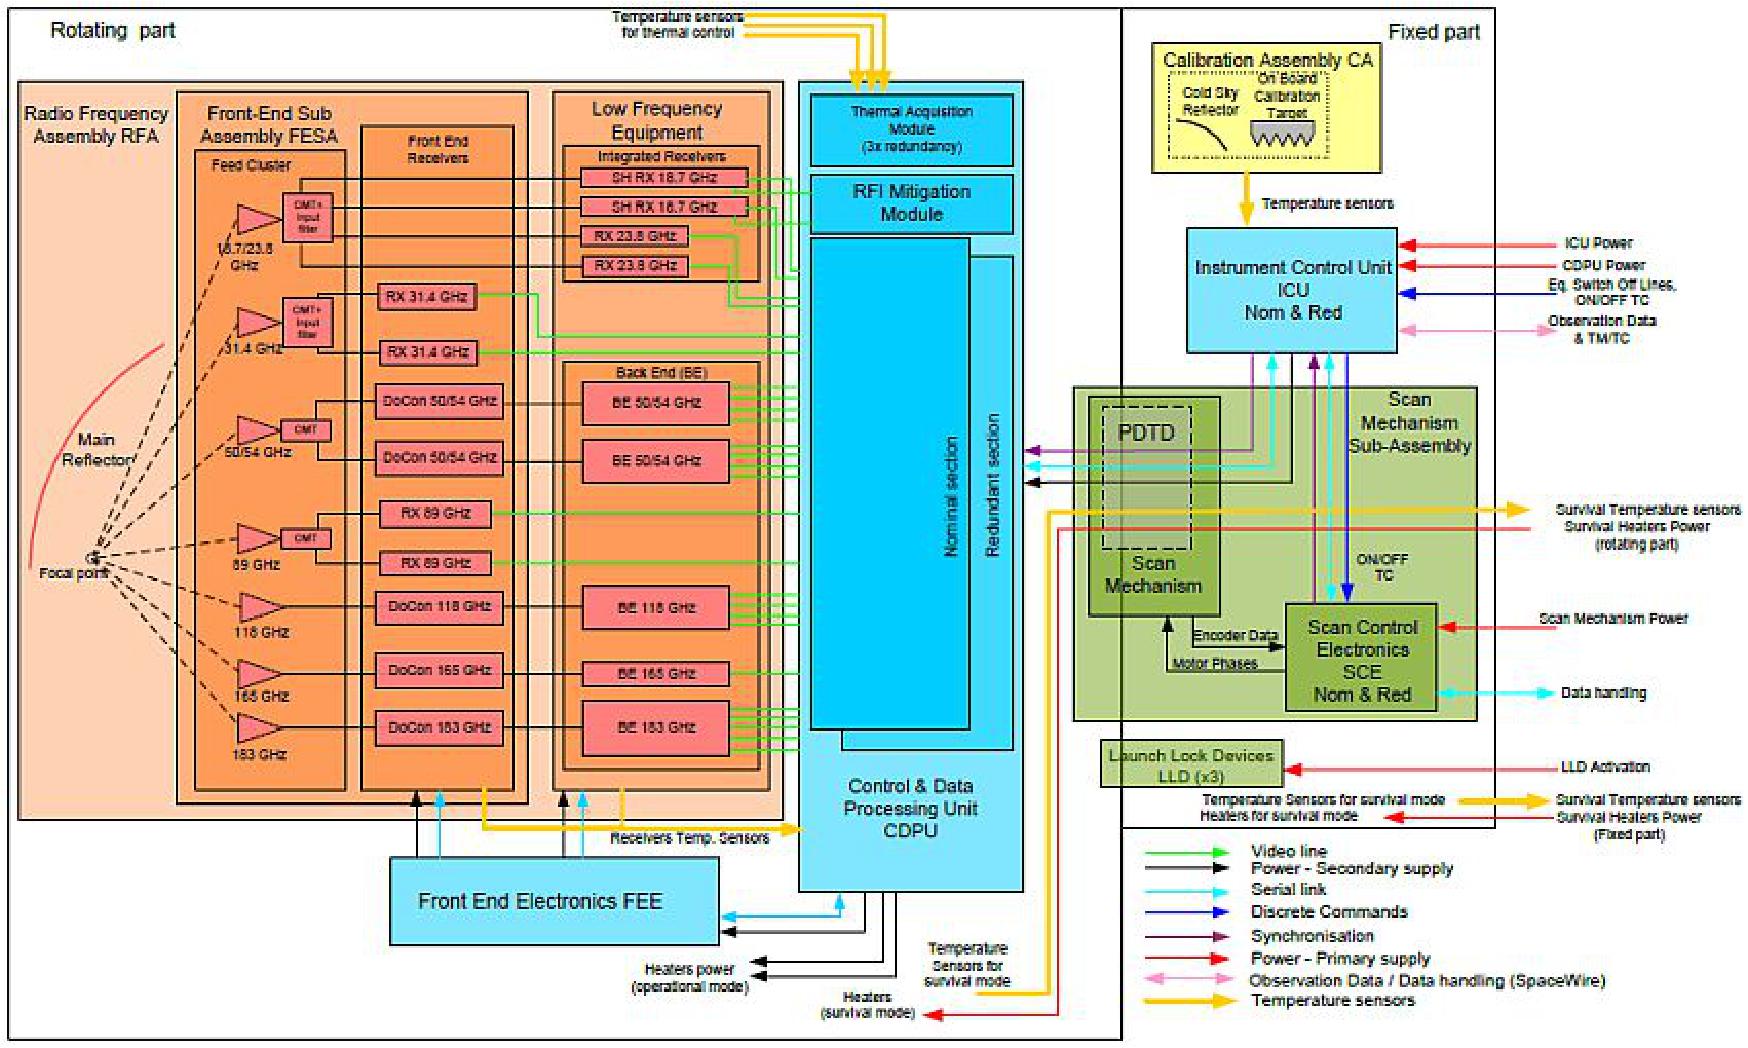
Instrument: The MWI instrument consists of a fixed part and a rotating part. The moving part is rotated about the axis of the instrument by a coaxially mounted motor and it includes the reflector and feed horns that are mounted on a "drum" which contains the receivers, a digital processing unit and a power supply unit.
The scan mechanism assembly provides the rotation of the instrument and acts as mechanical and electrical interface between the fixed and rotating part. All data, commands, timing and telemetry signals, and power, pass through the rotating part to the fixed part via the PSTD (Power and Signal Transfer Device). A DSCE (Dedicated Scan Control Electronics) device is included for the control of the scan mechanism.
The fixed part of the instrument comprises the assembly of scan mechanism (which locates the scan motor, an angular position encoder, mechanical unbalance sensors, various electronics including the control of scan and balance functions), and allocates the units interfacing with the platform (power supply connected to the platform power bus and a control/processing unit which links respectively with the platform command & telemetry bus and the platform science data bus).
A fixed rod through the scan assembly, emerging above the rotating drum upper plane, is providing off axis mechanical support in a fixed position for the two calibration targets that consist of a small reflector and a hot blackbody load, which once per rotation illuminates the feed horns obscuring them from the view of the main reflector.
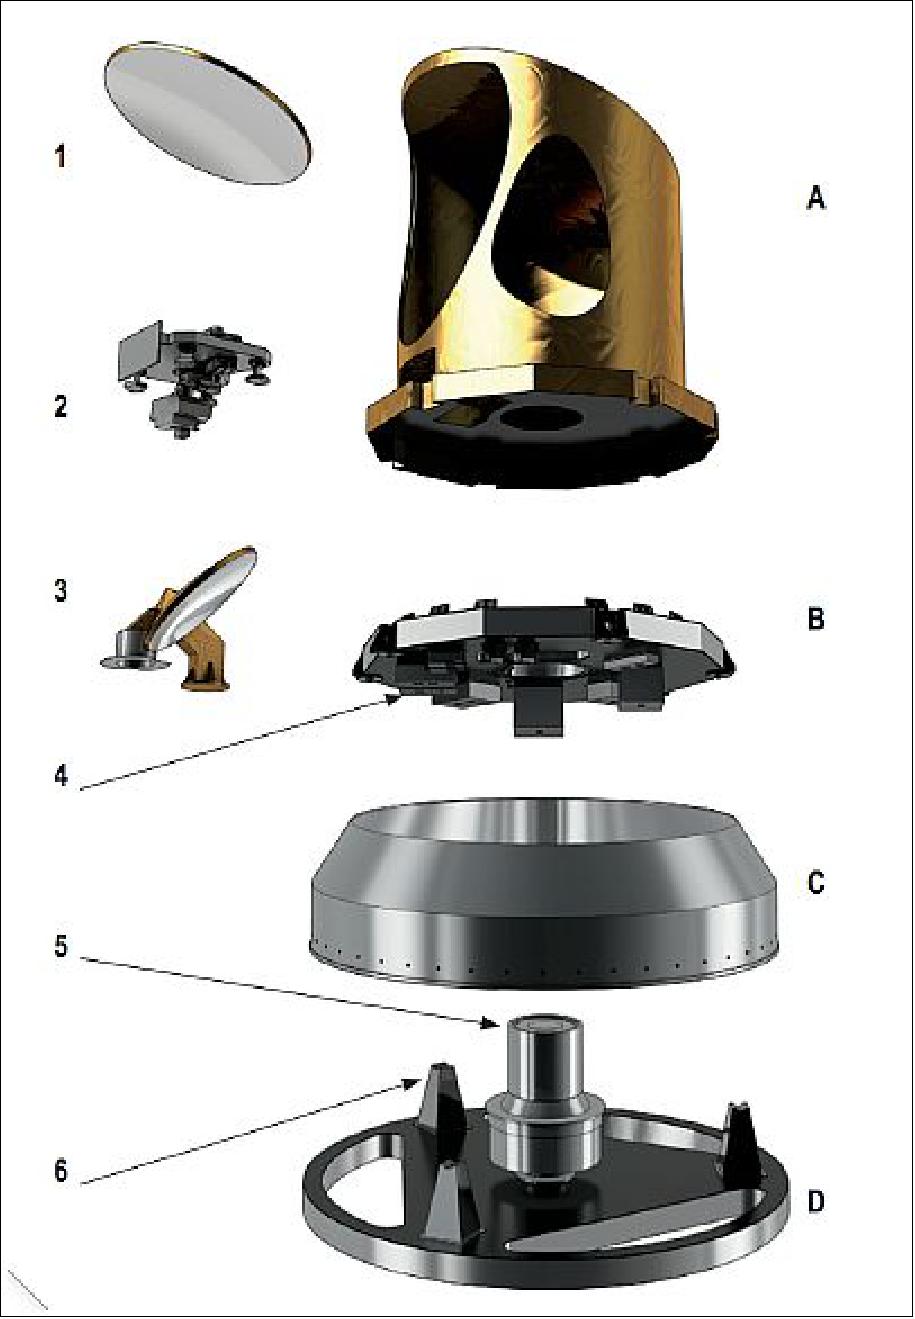
Legend: A) Tube Structure, B) Rotating Deck, C) Baseplate Cover, D) Baseplate, 1) Main Reflector, 2) Frontend Subassembly, 3) Calibration Assembly, 4) Receiver Backends, Electronics and CDPU, 5) Scan Mechanism, 6) Launch Lock Devices.
To achieve very good radiometric accuracy and stability, the MWI is designed with a sun-shield (tube structure) to minimize sun-intrusion on the instrument units. MWI is calibrated using an internal hot target and a cold sky, which is viewed through a dedicated antenna reflector. The calibration targets, a CCR (Cold sky Calibration Reflector) and the on-board HL (Hot Load),are accommodated in such a way that the CCR is constantly pointing to the deep space on the opposite side of the sun direction. The CCR and the HL calibration devices are viewed once every rotation cycle. A specific baffle is included around the OBCT (On-Board Calibration Target) to eliminate sun intrusion into the target. In addition, 4-point calibration is used for the lowest frequency channels by means of noise diodes.
MWI includes a mixture of direct detection and heterodyne receiver architectures. Low noise amplifiers are foreseen to be used as first element of the receiver. For highest frequency channels (166 GHz and 183 GHz), Schottky-based mixers and multipliers are foreseen. For lower frequencies, several technologies are still possible from discrete components to fully integrated MMIC receiver. For all heterodyne receivers, frontends and backends are separated to optimize the accommodation and thermal dissipation.
MWI provides a robust design as required for an operational instrument. The MWI includes stringent input filtering before the receiver at the lowest channels up to 31 GHz to provide protection against RFI (Radio Frequency Interference). An RFI processor at 18.7 GHz is also included to detect and mitigate interference on-board.
The MWI instrument has high failure detection and recovery autonomy. The ICU will automatically switch ON/OFF subsystems in case of SEEs (Single Event Effects). In case of hardware failures, MWI will have a capability to shut down each channel individually and keep the other channels still operational. The MWI instrument is designed to guarantee very good reliability and availability for the whole lifetime of 7.5 years. For key electronics on both the rotating and fixed part, full redundancy is included.
The structural design and the adopted materials of the rotating assembly shall be such to optimize the stiffness to mass ratio and minimize the in orbit mechanical and thermal distortions.
Technology challenges: To guarantee the performance and reliability of the mission, many technological challenges exist. One of the most critical elements of the MWI instrument is the scan mechanism assembly. The criticality of this element is mainly due to the very high number of revolutions to be performed within the instrument lifetime, which are in the order of 180 million cycles. Other critical functions of this subsystem are the power transfer (in the order of 200 W), the pointing accuracy and the repeatability of the release after launch. Breadboard developments of this critical subsystem are currently ongoing.
On the other hand, the required performances obviously need improvements in semiconductor technologies, which have recently been finished successfully. In addition to performance, the reliability of components is a key factor for the MWI instrument and for the in-orbit nominal lifetime of 7.5 years for the MetOp-SG mission, combined with a maximum of 19 years of in -storage period; these requirements were not seen before. For critical semiconductor technologies (receiver front-ends), reliability testing is already on-going to make sure that the components will be able to withstand the environment. Temperature + DC & RF step stress tests, storage + DC & RF life tests, humidity and environmental tests are being performed to all non-hermetic components.
In the timeframe 2021-2042, the MWI instrument is required to support NWP activities at regional and global scales, by providing high quality operational cloud and precipitation observations, snow and sea-ice coverage as well as gross profiles of water vapor and temperature.
Development Status
• In November 2014, Airbus DS GmbH awarded a contract to CGS (Carlo Gavazzi Space) S.p.A, Milan, Italy for the realization of the MWI instrument of the MetOp Second Generation satellites. CGS is a unit of OHB AG. The MWI is a sophisticated instrument that will be installed on board the MetOp-SG-B satellite series and provide Europe’s National Meteorological Services and, by extension, the international users and Science Community, with unprecedented and high-value data for meteorological and climate monitoring. By signing this contract, which has a total volume of € 134 million, CGS will assume responsibility for the design and the development of the MWI instrument, from Phase B2 to the final in-orbit verification of three flight models, to be supplied to Airbus DS GmbH, the prime contractor of the MetOp-SG-B satellite series. 37)
MWS (Microwave Sounding Mission)
MWS is a total power radiometer with the goal to measure the brightness temperature, at various altitudes, and delivering calibrated and geo-located atmospheric temperature and water-vapor sounding data, in all weather and illumination conditions, this instrument will be a key element in the provision of operational meteorological data over the next two decades. By offering significant improvements in measurement performance over the MetOp First Generation instruments and indeed all microwave sounders currently operating on meteorological satellites, MWS offers a significant upgrade to input data for the operational NWP (Numerical Weather Prediction) service. 38)
The MWS is an cross-track scanning microwave radiometer, measuring the total power, atmospheric brightness temperature in 24 channels over the frequency range from 23.8 GHz up to 229 GHz. In recognition of the significance of the temperature sounding data, the channels (50 GHz – 58 GHz) are fully redundant. The instrument provides measurements of temperature and humidity (water vapor) profiles and total liquid water columns. These are key parameters for Numerical Weather Microwave soundings, which greatly enhance the ability of the various NMS (National Meteorological Services) to initialize global and regional NWP models with realistic information on temperature and moisture. The frequent availability of detailed temperature and moisture soundings would also contribute to fulfil other key requirements common to NWC (Now Casting) and very short range weather forecasting at regional scales. 39)
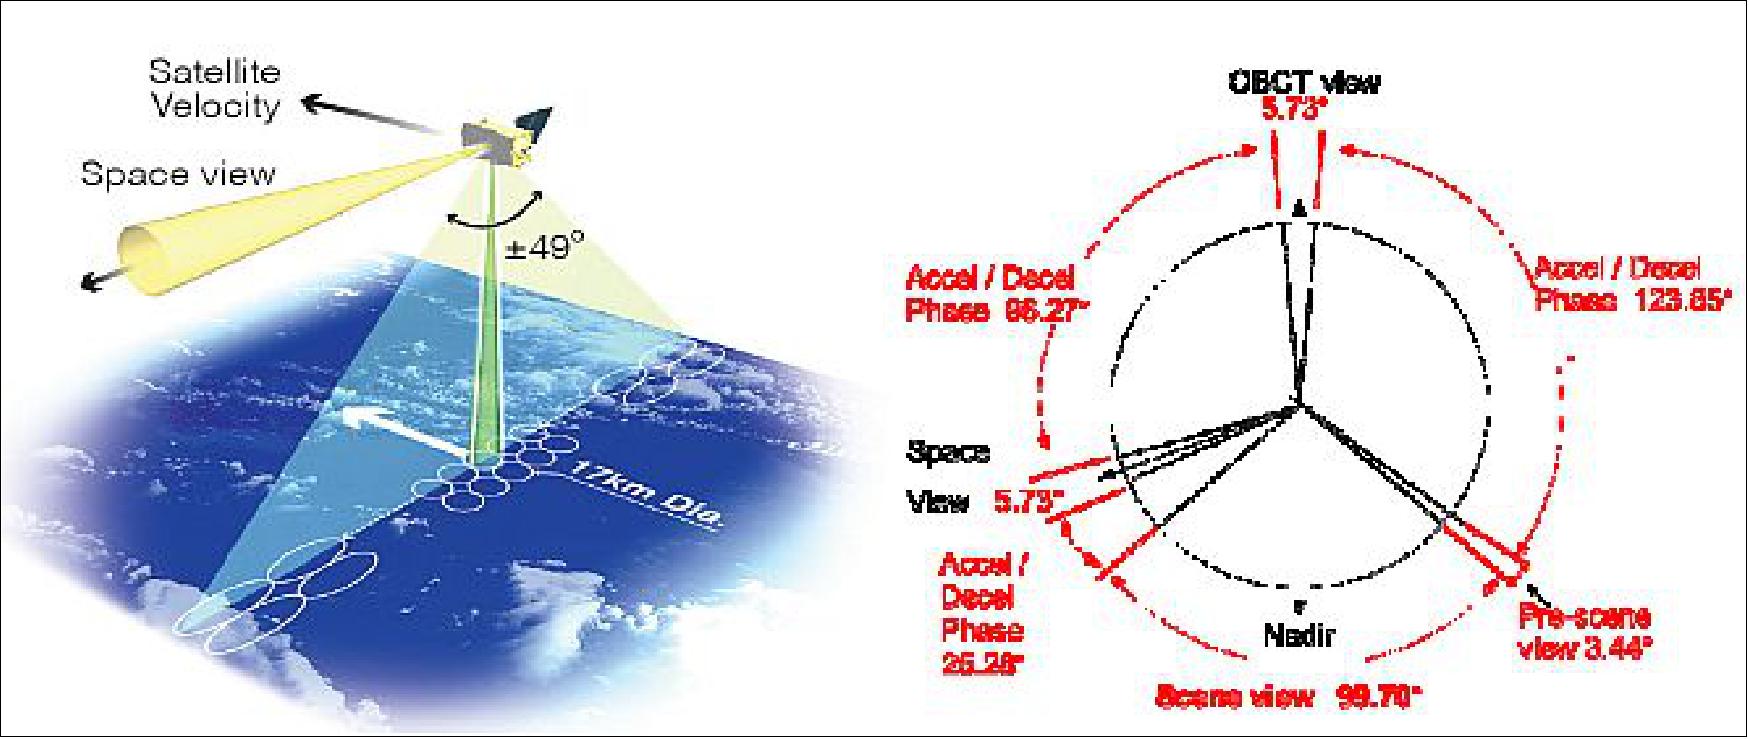
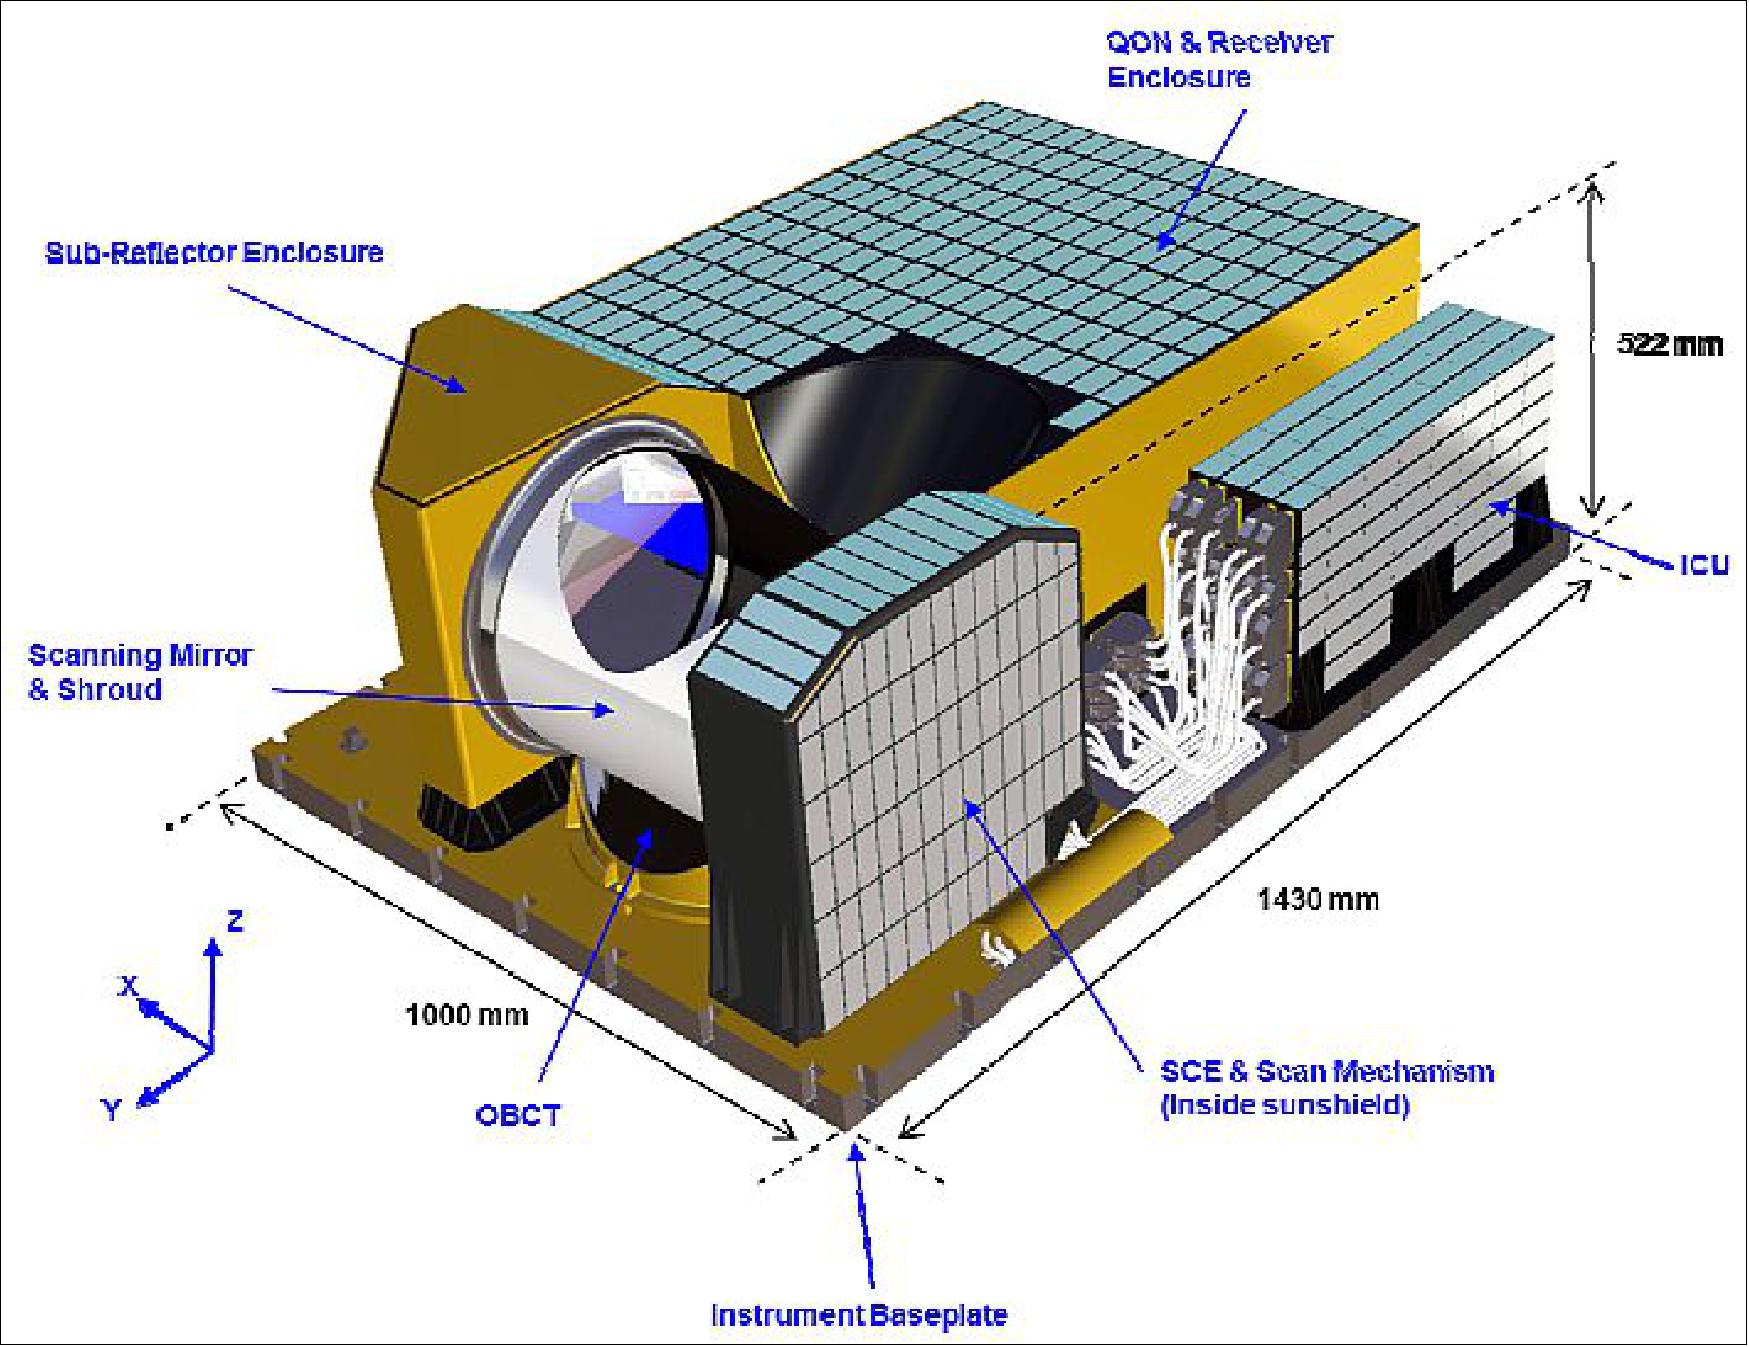
The MWS measurement principle is essentially similar to that of predecessor instruments (e.g. MHS, AMSU), the main difference being the inclusion of the complete range of radiometric frequency channels within a single instrument with a single main antenna. One particular difference is that the two lowest frequency channels (MWS-1 and MWS-2) will be over-sampled with respect to the footprint in the scanning direction, in order to allow the possibility of filtering out RFI (Radio Frequency Interference). The principle mode of operation, as before, uses a scanning antenna. This rotates every 2½ seconds, sampling the atmosphere below (to 49° each side). Each rotation also views a warm OBCT (On-Board Calibration Target) and the cold sky. The antenna rotates at non-uniform speed as shown in Figure 20 in order to maximize the scene and calibration targets integration times.
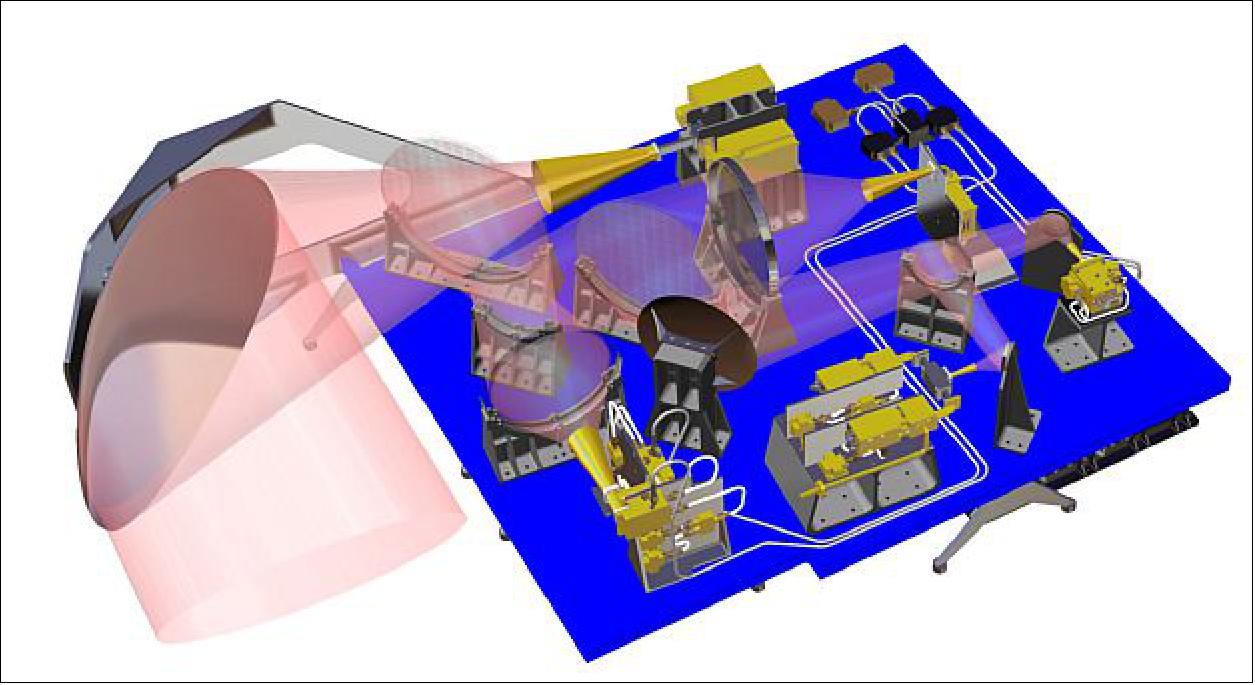
The single antenna concept allows the MWS instrument to remain compact but requires a complex QON (Quasi-Optical Network) capable of splitting the different channels in the instrument. A fixed, parabolic sub-reflector is used to fold the signal into the QON.
All MWS measurements are performed with a single polarization (QV or QH). The instrument will have a 40 km footprint at the lowest frequencies leading to an antenna size of ~35 cm. The footprint at highest frequency channels will be 17 km. The sampling distance on the ground is defined by the highest frequency channels.
The instrument design is a single unit, single antenna concept. The large frequency range required infers a stringent requirement to the MWS quasi-optical network, which must be able to handle this frequency range. The first electrical demonstrator of the QON has been built and measured losses are typically below 0.3 dB for all channels. Table 7 shows the predicted NEΔT values for each channel in nominal conditions at BOL (Beginning of Life). The predicted radiometric accuracy (RSS) is below 1 K for all channels, the inter-channel accuracy is better than 0.5 K and the inter-pixel accuracy <0.3 K (at 280 K reference scene). An orbital stability of better than 0.2 K is targeted. The beam efficiency is between 95% and 99%, depending on channel.
Channel No | Frequency (GHz) | Utilization | NEΔT (K) |
MWS-1 | 23.8 | Water-vapor column |
|
MWS-2 | 31.4 | Window, water-vapor column | |
MWS-3 | 50.3 | Quasi-window, surface emissivity | |
MWS-4 | 52.8 |
| |
MWS-5 | 53.246±0.08 | ||
MWS-6 | 53.596±0.115 | ||
MWS-7 | 53.948±0.081 | ||
MWS-8 | 54.4 | ||
MWS-9 | 54.94 | ||
MWS-10 | 55.5 | ||
MWS-11 | 57.290344 | 0.35 | |
MWS-12 | 57.290344±0.217 | 0.5 | |
MWS-13 | 57.290344±0.3222±0.048 | 0.5 | |
MWS-14 | 57.290344±0.3222±0.022 | 0.8 | |
MWS-15 | 57.290344±0.3222±0.010 | 1.1 | |
MWS-16 | 57.290344±0.3222±0.0045 | 1.8 | |
MWS-17 | 89 | Window | 0.2 |
MWS-18 | 165.5±0.725 | Quasi-window, water-vapor profile | 0.4 |
MWS-19 | 183.311±7.0 | Water-vapor profile, precipitation | 0.35 |
MWS-20 | 183.311±4.5 |
| 0.35 |
MWS-21 | 183.311±3.0 | 0.5 | |
MWS-22 | 183.311±1.8 | 0.5 | |
MWS-23 | 183.311±1.0 | 0.7 | |
MWS-24 | 229 | Quasi-window, water-vapor profile | 0.5 |
Channel (GHz) | AMSU/MHS | ATMS | MWS |
23.8 | 50 km | 77 km | 40 km |
31.4 | 50 km | 77 km | 40 km |
50-58 | 50 km | 33 km | 20 km |
89 | 50 km/16 km | 33 km | 17 km |
165.5±0.725 | 16 km | 16 km | 17 km |
183 | 16 km | 16 km | 17 km |
229 | Not included | Not included | 17 km |
The QON separates the incoming radiation from the antenna system into 6 separate frequency bands. The signal is split out through the use of dichroics or splitters and transfers the separated frequencies to the RF feed horns coupled to the receiver front ends, specific for the different channels. This is illustrated in Figure 21.
MWS includes a mixture of direct detection and heterodyne receivers, which comprise the front end receiver elements. Those channels not employing direct detection down-convert and amplify the signals, sending them to the backend electronics for further down-conversion and filtering. Finally the analog data is passed to the ICU (Instrument Control Unit) for digitization and downlink.
Key design features of MWS. The instrument has been divided into the following functional blocks:
- RSA (Reflector and Shroud Assembly): The reflector is a scanning flat mirror which collects the microwave energy from the Earth scene and calibration targets and directs it into the QON (Quasi-Optics Network). The shroud limits stray radiation entering the QON.
- SM (Scan Mechanism) and SCE (Scan Control Electronics): The SM rotates the reflector across the scenes and targets at a uniform velocity. The reflector rapidly accelerates and decelerates between the scenes and targets in order to maximize the time spent looking at them. The SCE provides the power and electronics control necessary to achieve the required scan profile.
The SM and the SCE form a single functional block which drives the reflector in the required scan profile under closed loop control, with only a simple start and stop command required from the ICU and its software. This has the advantage that the scan control function can be designed, developed and tested independently of the ICU and its software. On MHS, scan control could not be tested until the Scan Mechanism, ICU and its software were integrated.
- QON (Quasi Optics Network): This consists of a parabolic sub-reflector, a set of dichroic and polarizing mirrors and lenses to direct the radiation from the reflector into 5 separate feed horns.
- Rx FE (Receiver Frontends): This consists of 7 separate receivers for the different frequency groups of MWS. Three channels are direct detection receivers which directly filter the required channel frequencies and provide the detection and video amplification. The remaining four receivers are superheterodyne receivers which perform the down-conversion to generate an IF signal for the receiver backends. One of these receivers covers the 54 GHz channels and is cold redundant.
- Rx BE (Receiver Backends): These provide a total of 21 channel filters, detectors and video amplifiers for the superheterodyne channels.
- SPE (Signal Processing Electronics): This performs the digitization of the 24 receiver video signals. Each channel has programmable gain and offset adjustment to optimize the signal to the ADC dynamic range.
- Packetization: This collects the digitized data from the SPE and formats it into the required packet format for transmission to the spacecraft over a SpaceWire Bus.
- Instrument Control and Monitoring: This accepts telecommands from the spacecraft via the SpaceWire Bus and performs the necessary commanded functions. It collects housekeeping data from the instrument subsystems and transmits them to the spacecraft via the SpaceWire Bus. It also performs monitoring of the instrument health and implements the necessary recovery actions in the event of an anomaly (FDIR).
- Power Conversion and Distribution: This generates the required power rails for the instrument from the spacecraft primary power buses. It also switches and distributes the power to the different functions.
- Mechanical Structure and Harness: This includes the baseplate and support brackets for the instrument equipment. The harness provides the power and signal connections between the various equipment.
- Thermal Control: This provides thermal control in the normal operating modes and in safe mode using heaters and surfaces covered in SSM (Second Surface Mirrors) or MLI (Multilayer Insulation).
The MWS radiometer is designed and developed by Airbus Defence and Space Ltd, Portsmouth, UK, leading a core team of industrial partners: TAS-UK, Airbus DS GmbH and Airbus DS SAS.
SCA (Scatterometer Mission)
The Scatterometer (SCA) is one of the high priority payload instruments to provide vector surface wind observations over ocean, which constitute an important input to the NWP (Numerical Weather Prediction) as well as valuable information for tracking of extreme weather events. The secondary products derived from the scatterometer data are: 40)
- Land surface soil moisture
- Leaf area index
- Snow water equivalent
- Snow cover
- Sea-ice type
- Sea-ice extent.
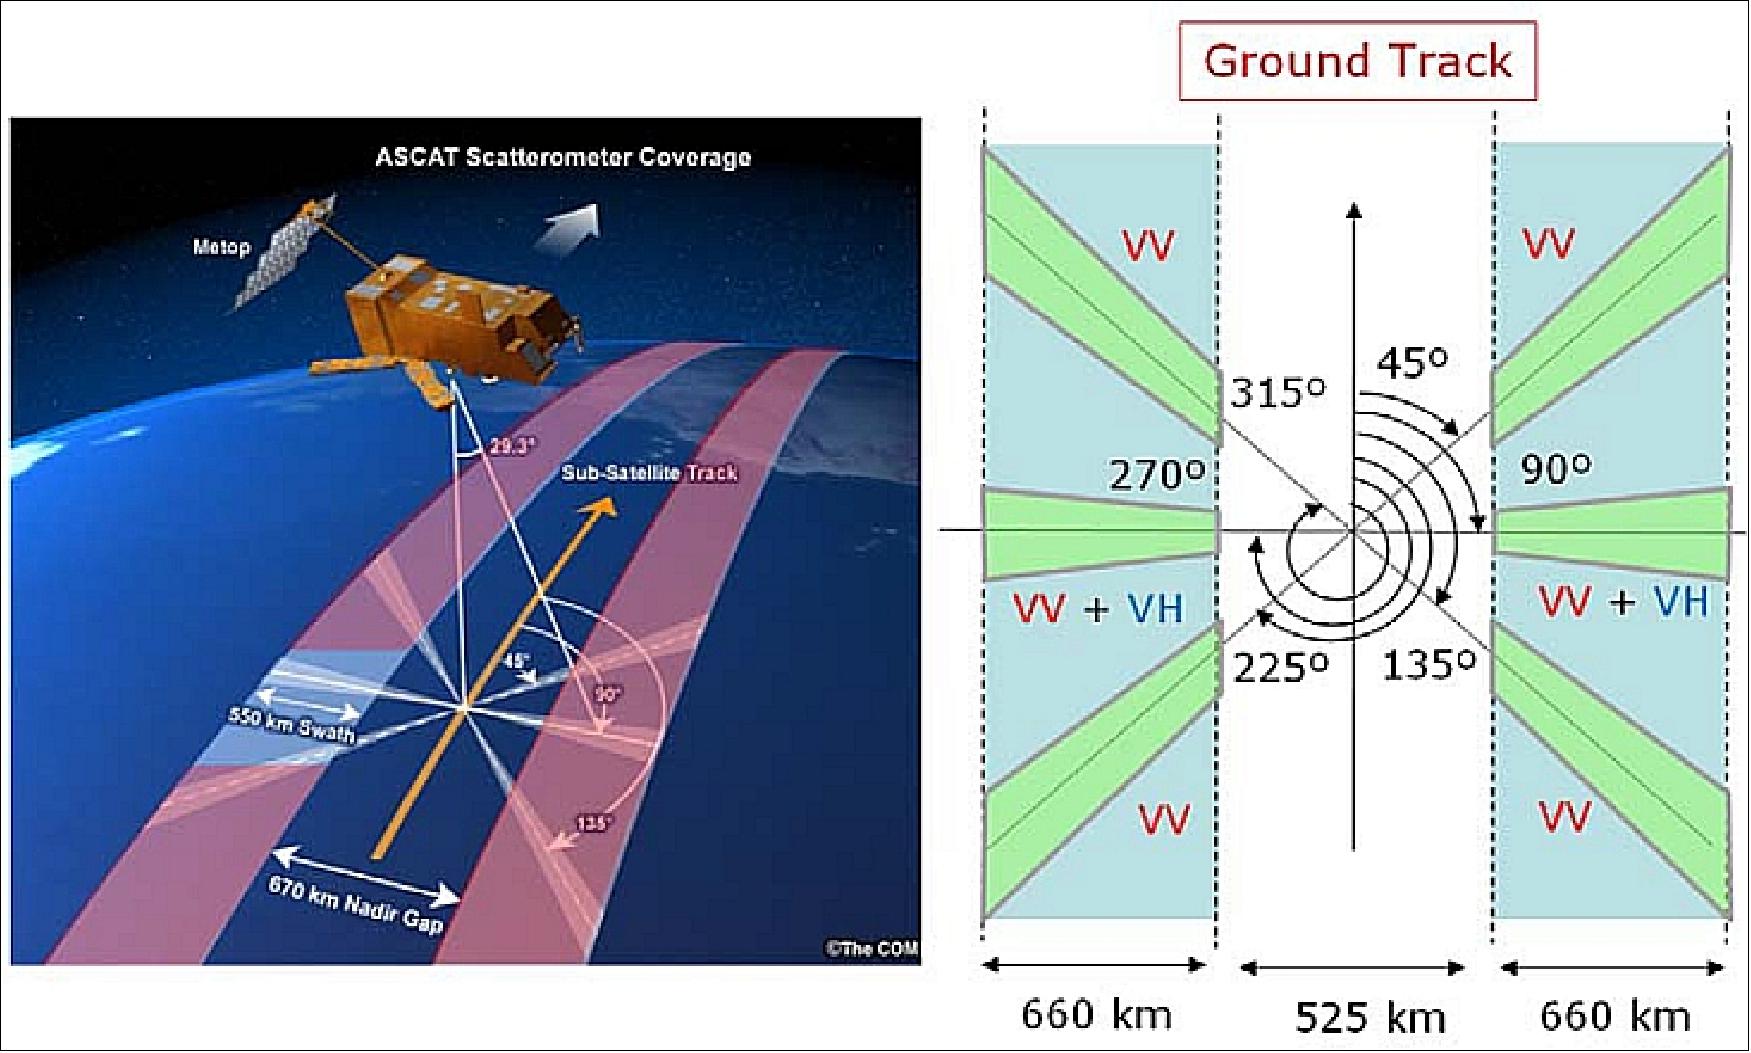
Instrument requirements: The SCA instrument is a real-aperture, pulsed imaging radar with six fixed fan beam-antennas. In this configuration, the principal elevation planes of the SCA antenna beams are oriented at 45º (Fore-left), 90º (Mid-left), 135º (Aft-left), 225º (Aft-right), 270º (Mid-right) and 315º (Fore-right) with respect to the flight direction, similar to MetOp’s ASCAT (Figure 24).
Each of the SCA beams shall acquire a continuous image of the normalized (per-unit-surface) radar backscatter coefficient of the ocean surface, called σο over a swath. Both sides of the subsatellite track are imaged each with three azimuth views, with an unavoidable observation gap below the satellite. A large number of independent looks are summed in range and azimuth (multi-looking), for each azimuth view, in order to achieve the specified radiometric resolution of the σο estimate on each measurement pixel.
The three σο measurements (σο triplet) are uniquely related to the 10 m vector wind through the GMF (Geophysical Model Function. The wind inversion is based on a search for minimum distances between the measured σο triplet and all the backscatter model solutions lying on the GMF surface, taking into account instrumental and geophysical noise sources . Due to measurement noise, multiple solutions are usually found (wind ambiguities), which have to be filtered out using the background wind information provided by a NWP model (ambiguity removal).
As compared to ASCAT, SCA shall have a smaller nadir gap by reducing the minimum incidence angle from 25º (ASCAT) to 20º. The main technical requirements of SCA are reported in Table 9 and compared to the ones of ASCAT. The major improvements to be brought by SCA with respect to ASCAT are the spatial resolution of 25 km x 25 km, the radiometric stability of ≤ 0.1 dB and the addition of VH polarization measurements on the mid beams.
Parameter | ASCAT | MetOp-SG SCA |
Frequency | 5.3 GHz | |
Polarization | VV for all beams | VV for all beams + VH for Mid-beams |
Azimuth views | 45º, 90º and 135º w.r.t. satellite track | |
Minimum incidence angle | 25º | 20º |
Horizontal resolution | Nominal: (50 km)2 | Nominal: (25 km)2 |
Horizontal sampling | Nominal: (25 km)2 | Nominal: (12.5 km)2 |
Radiometric resolution | ≤ 3 % for θi ≤ 25º at 4 m/s cross-wind (VV) | |
Radiometric stability | ≤ 0.2 dB | ≤ 0.1 dB |
Coverage | 97 % in 48 hrs | 99 % in 48 hrs |
Instrument design: The SCA instrument has 6 antennas, 3 on both sides of the satellite ground-track. All antennas emit in vertical polarization. The 4 side antennas receive only vertically polarized signals, whereas the 2 mid antennas receive both V and H-polarized signals. For the mid antennas, two different concepts are under investigation: simultaneous / non- simultaneous reception of V and H-pol signals. The antennas consist of slotted waveguide arrays, connected through waveguides to the beam-switching matrix. For the Fore-/Aft-antenna assemblies, rotating RF-joints are required for enabling deployment.
The SCA antennas are considered a key component of the instrument, as they have direct impact on performance figures like e.g. radiometric stability. Their stability is therefore considered of utmost importance. The design of the SCA antennas is based on a aluminum support structure and RF elements are also made of aluminum.
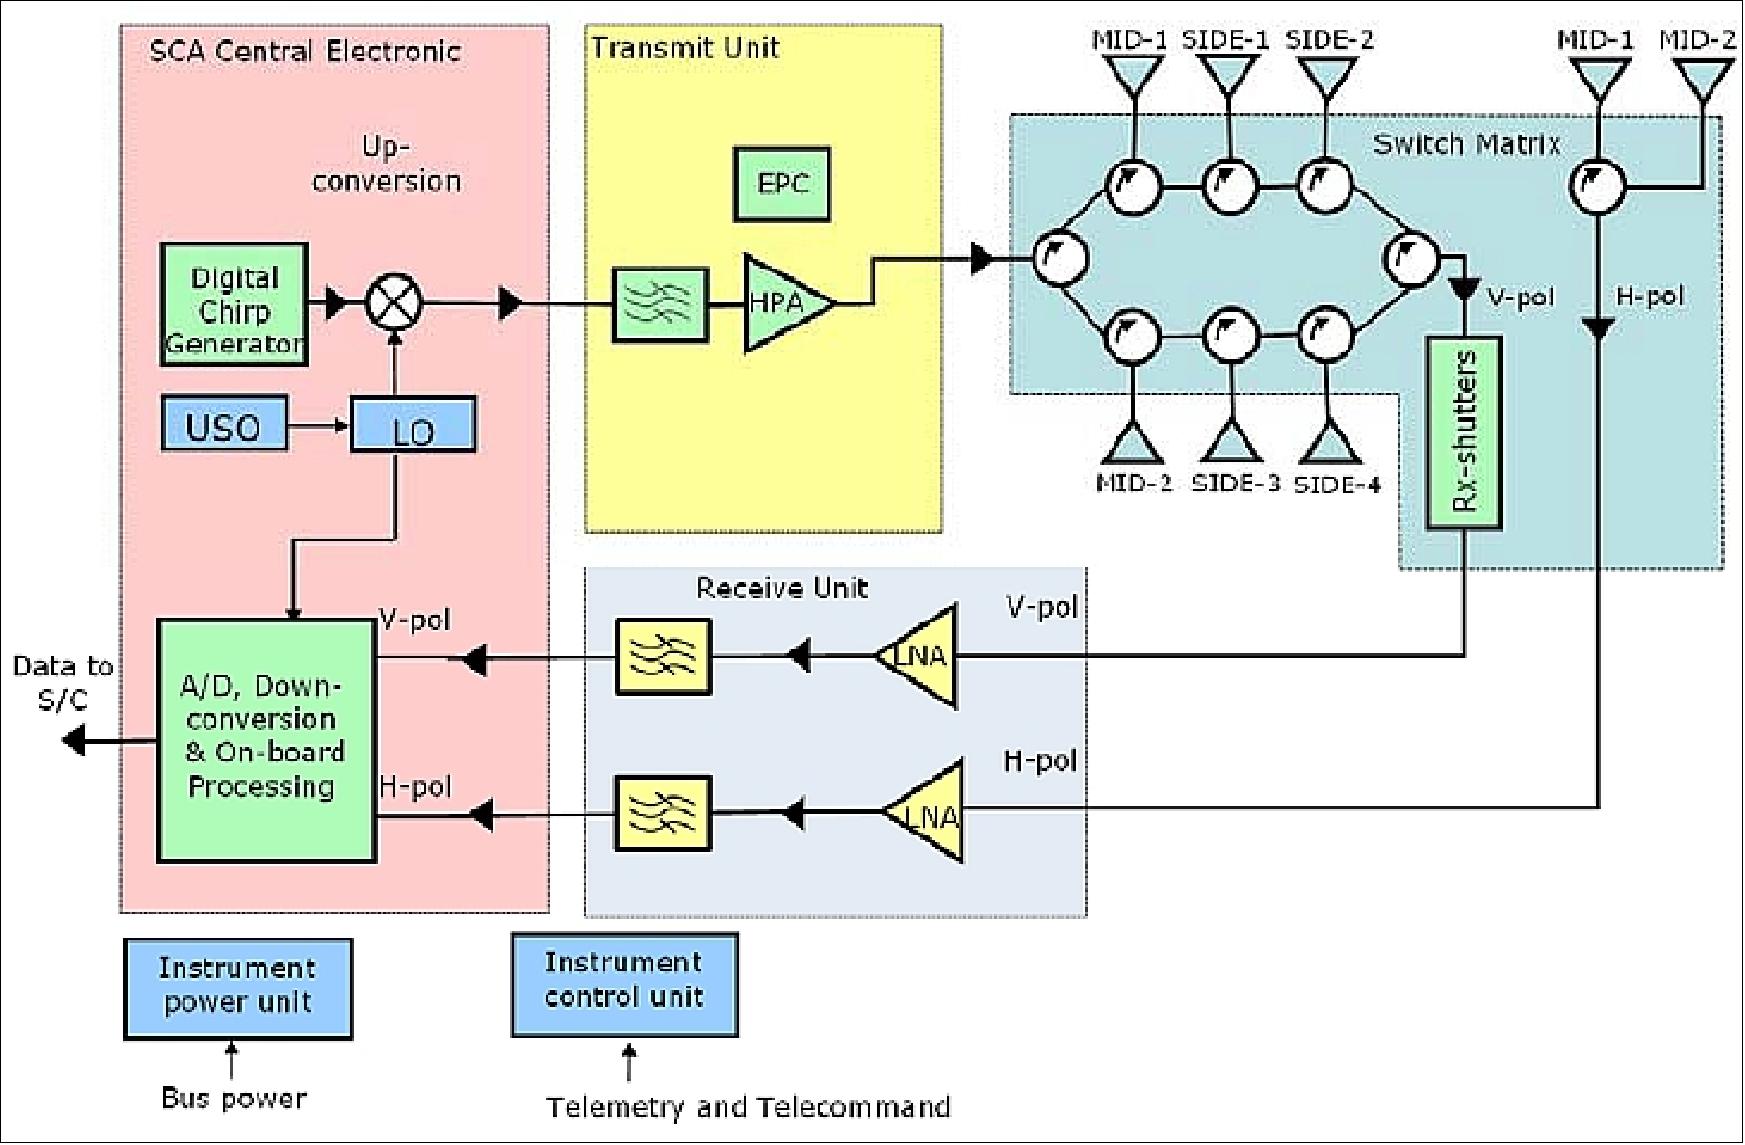
A high level SCA block diagram is depicted in Figure 25. The baseband radar pulse is stored in the digital memory read-out and followed by the DAC (Digital-to-Analog Converter). The analog pulse is then up-converted to the carrier frequency by a quadrature mixer. The HPA (High Power Amplifier) is driven by a high voltage EPC (Electronics Power Conditioner). The HPA feeds the six antennas sequentially through the beam-switching matrix. The receive signal is amplified by the LNA (Low Noise Amplifier) and down-converted to the in-phase (I) and quadrature phase (Q) baseband signals. The digitized I and Q baseband signals are downlinked and further processed on ground.
An internal calibration loop measures the transmit pulses at the output of the HPA and that of the beam-switching matrix. The calibration pulses are also injected at the input of the beam-switching matrix and measured at the input of the LNA. Those measurements enable gain characterization of the transmit- and receive-chains, as well as losses of the components in the radar front-end. The necessity of measuring the pulses at the input ports of the antennas is a subject of further analysis in relation to meeting the radiometric stability requirement.
The instrument also measures the thermal noise in the absence of radar echo for determining the background noise level. After the noise estimation on ground, noise subtraction is performed for determining the unbiased ocean surface radar cross-section.
Two possible implementation configurations have been studied for the SCA instrument. These configurations are characterized by the presence of 6 slotted wave guide array antennas. Table 10 summarizes the instrument budgets. The ranges correspond to the budgets of the two concepts.
Mid antenna length | 3.20 m |
Side antenna length | 3.55-4.00 m |
Average power | 370-430 W |
Data rate | 3.2-5.1 Mbit/s |
Mass | 420-500 kg |
The use of a short, chirp-modulated transmit pulse was assumed for the design optimization. The optimization of the pulse length, taking into account the feasibility of the high power amplifier, has been subject of trade-offs in Phase A.
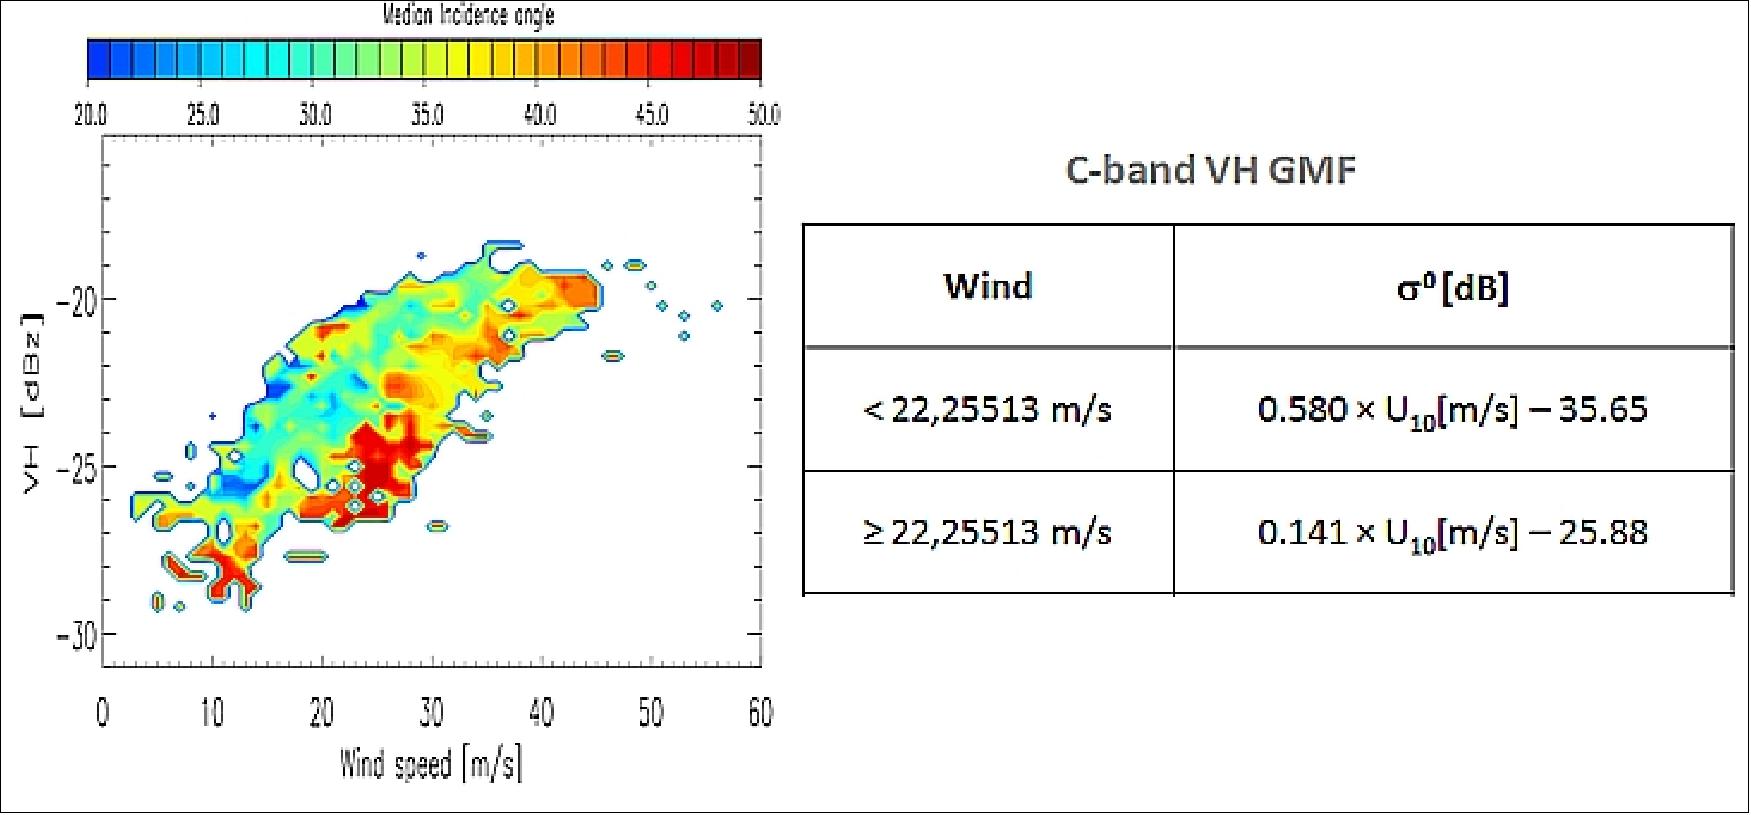
Instrument performance: The GMF (Geophysical Model Function) is an empirically derived function that relates backscatter measurements to surface wind vectors and viewing geometries in the form of σο= GMF (incidence angle, azimuth angle, wind vector). For C-band VV simulations, the project uses the CMOD5 model for ocean backscatter, which is valid for incidence angles ranging from 18 to 58º. For VH simulations, the project uses an empirical model function derived from the last RADARSAT-2 mission and from the NOAA SFMR (Stepped Frequency Microwave Radiometer) flight campaigns in VH polarization over hurricanes. These campaigns confirmed a linear tendency of σοVH with the wind-speed (as depicted in Figure 26) and a low sensitivity to both incidence and azimuth angles.
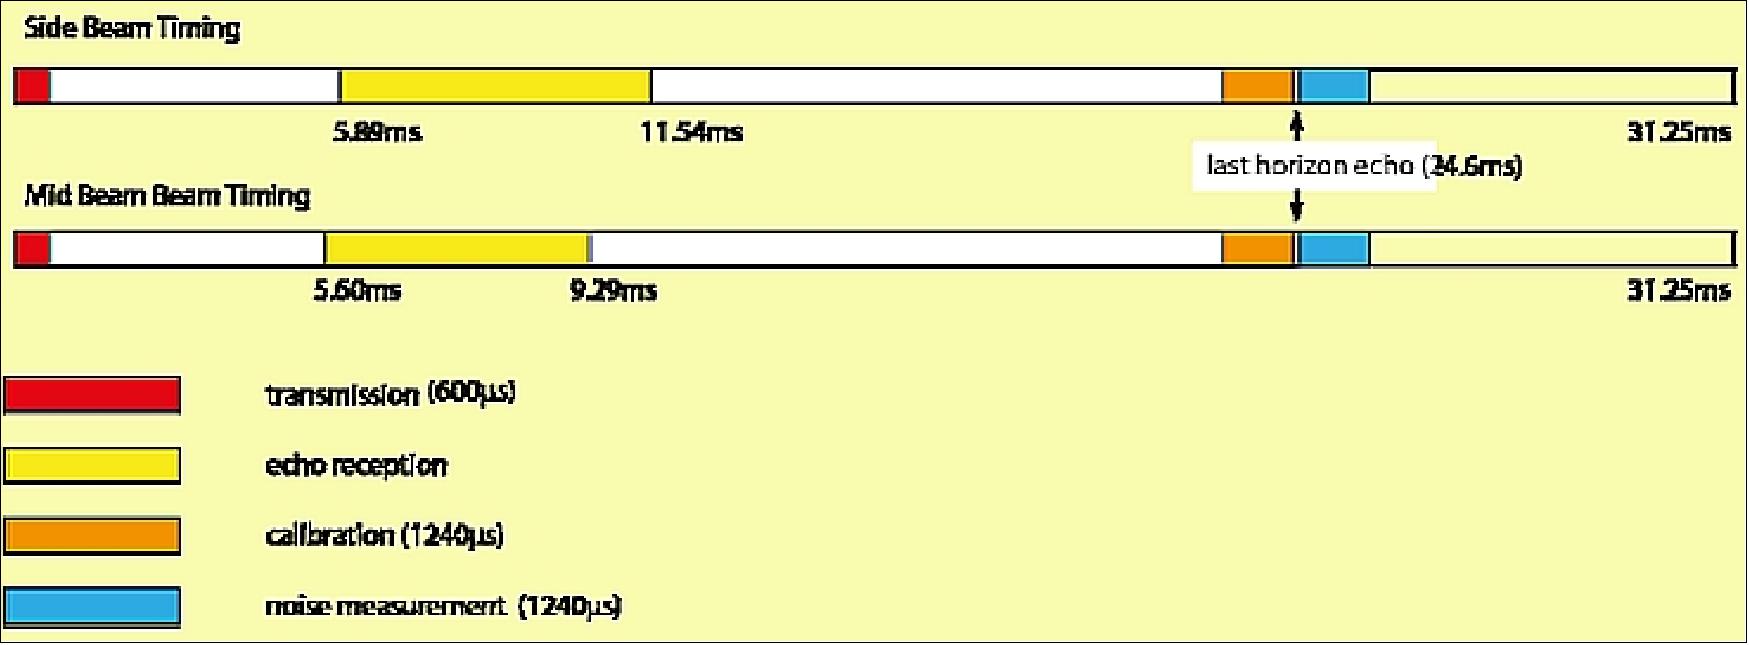
External calibration approach: The SCA timing is based on the use of transmission pulses which are much shorter than those of ASCAT (600 µs against 8.5 ms and 10.8 ms respectively). For sake of clarity, the SCA TX/RX timing is shown in Figure 27. The essential difference is that the transmit pulse length is now shorter than the noise measurement window. Therefore reception of a transponder response can, in principle, be accommodated within the noise measurement window. This window is ideally suited for calibration reception, as it is not contaminated by clutter. If a time delaying transponder is set-up to inject its signal into the noise measurement slot, then a transparent calibration method can be implemented.
For the transparent calibration, it is only necessary that the ground processing is aware of the presence of the transponder echoes within the noise window. Since SCA does not use an on-board processing, it is not necessary that the on-board software is aware of the presence of calibration signals. In the ground processor, the noise data packets containing transponder echoes will be separated from the nominal noise data stream and processed separately. The calibration processing is mostly identical to the ASCAT calibration processing, with the exception that signal demodulation and timing has to be adapted to SCA. Transponder echoes are present in the noise window for about 10 s per over flight. This is a small time interval when compared with 150 s noise integration time employed in the nominal ground processing. Therefore, there is no specific need to compensate for the lost noise measurements.
With the external calibration being transparent to the space segment, it is possible to continuously acquire calibration data and decide when new sets of calibration data need to be injected into the level 1b processor. Explicit calibration campaigns would no longer be needed. In principle, more than one transponder echo (up to three) could be received at the same time, when the transponders are aligned along the direction of an antenna footprint. As it can be seen from Figure 27, the duration of the noise window can easily be extended without impact on the overall timing concept if a larger margin for timing tolerances is desired.
Instrument description: The SCA is a real aperture C-band (5.355 GHz) radar system which is a follow up of the ASCAT system developed in the late 90’s. It is subdivided into the SAS (SCA Antenna Subsystem) and the SES (SCA Electronic Subsystem). The SCA Instrument is being developed by Airbus DS in Germany and in Spain. 41)
SAS (SCA Antenna Subsystem) is composed of 6 slotted waveguide antennas accommodated on three roof-top shaped antenna assemblies. The antennas comprise 2 dual polarized (H&V) and 4 single polarized (V) antennas, which generate narrow beams with low sidelobes in the azimuth (along track) direction and fan beams in the elevation (across track) direction. Each of the SAS arrays is connected to a switching front-end unit (SFE) which selects the operating antenna according the radar operating principle.
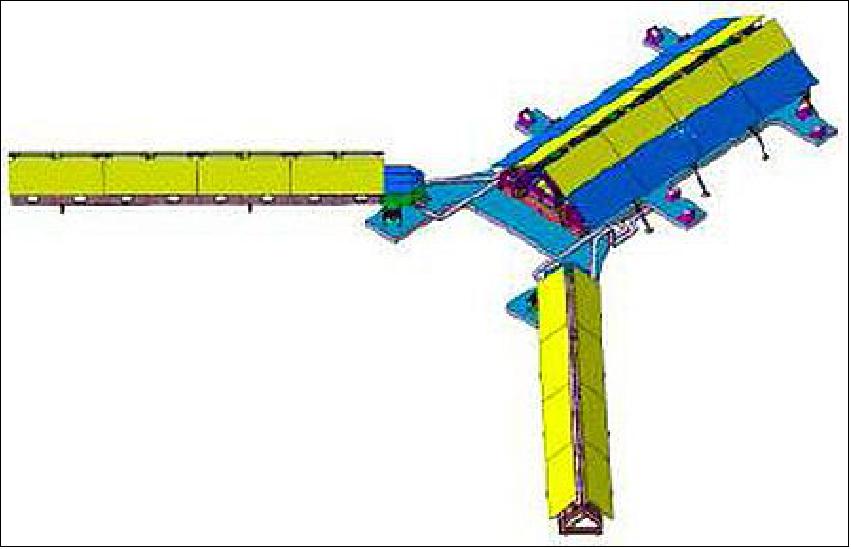
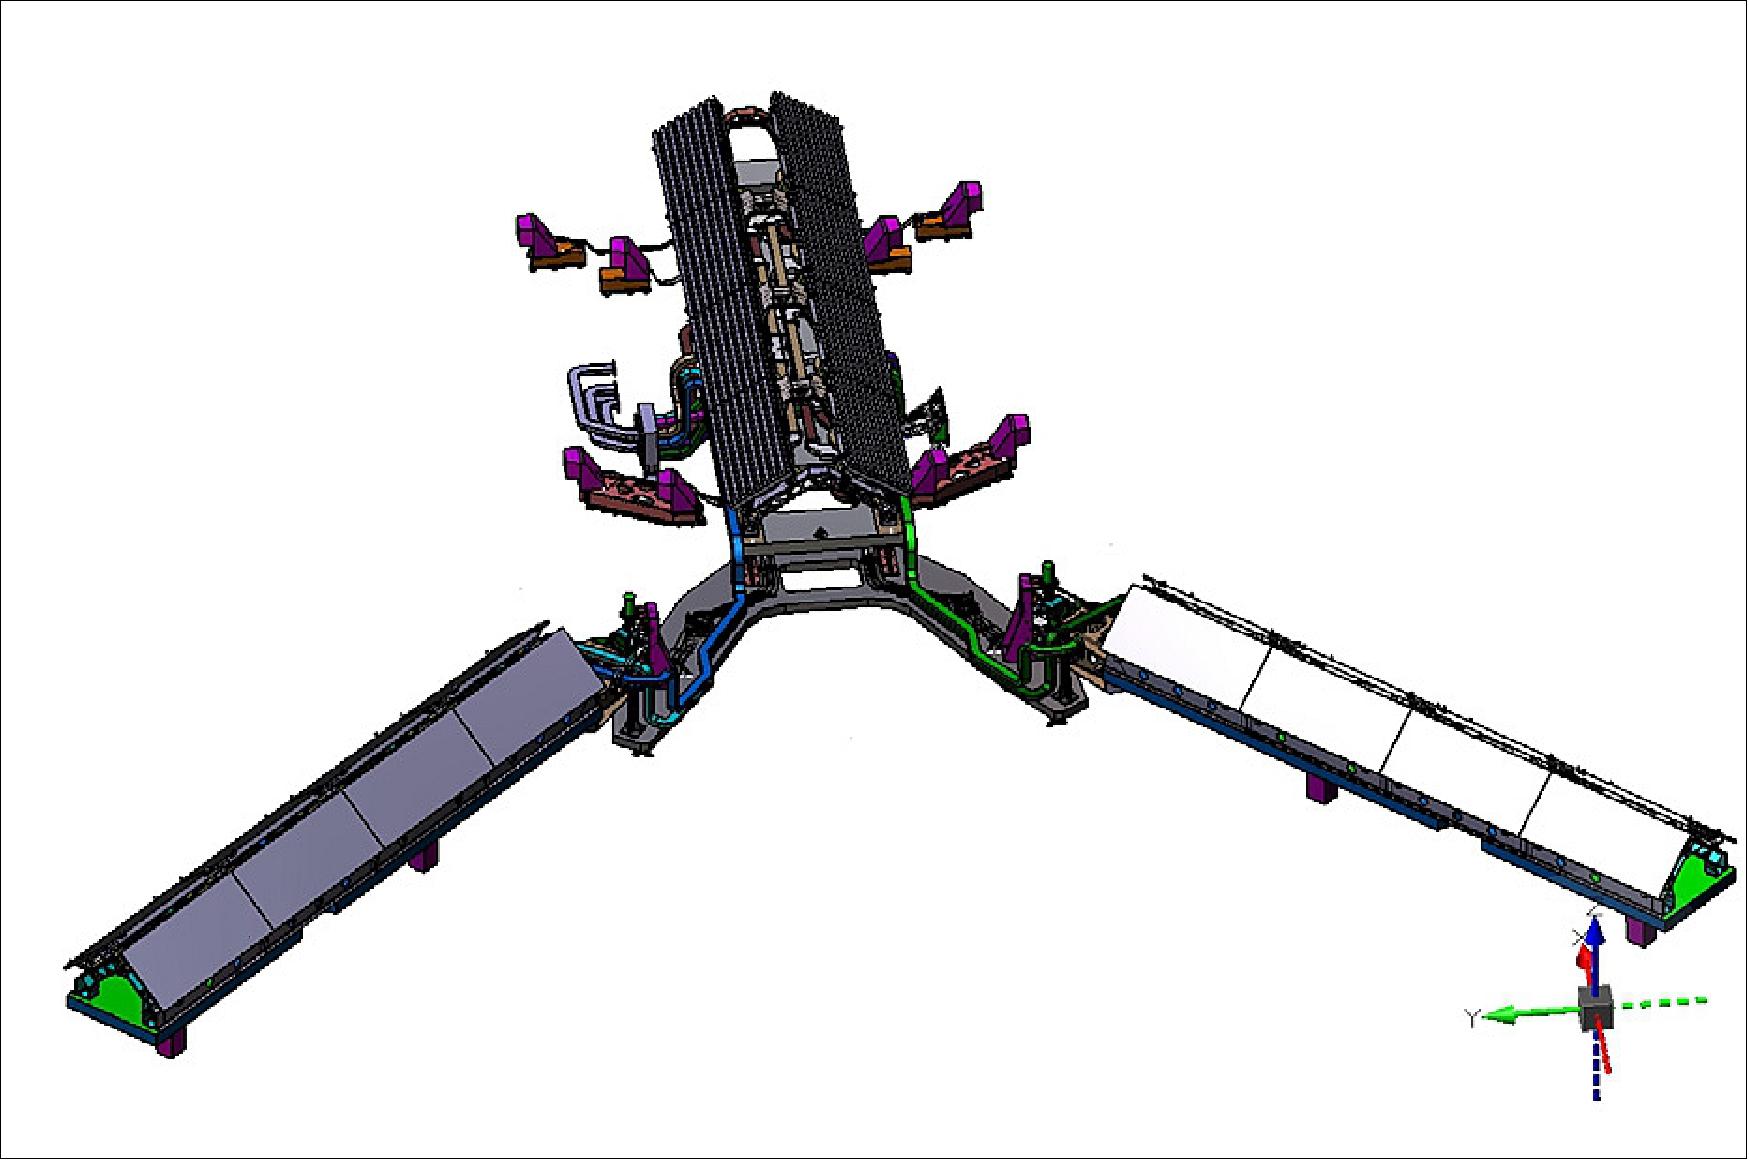
SAS is organized in a lambda configuration distributed on 3 antenna assemblies, called MAA (Mid Antenna Assembly) which holds the Mid left and right dual polarized antennas and Side Antenna Assemblies (SAA+Y and SAA-Y) which hold the Fore and Aft right and left array antennas.
The dimensions of the deployable antenna structure are of about 2m x 3.9m in stowed and 7 m x 6 m in deployed with a total mass of approximately 430 kg.
The main SAS elements are the following:
• MAA (Mid Antenna Assembly), which hosts dual polarized antenna panels and the two deployable Side Antenna Assemblies SAA+Y and SAA-Y that host V-polarized antenna panels.
• HDRMs (Hold Down and Release Mechanisms). The HDRMs are released by NEAs (Non Explosive Actuators).
• DLM (Deployment and Latch Mechanism) that are in charge of the deployment of the two SAA arms after release of the HDRMs.
• The Mechanical Support Structure comprising a U-shaped Baseplate Panel Structure and the Hold Down Release Mechanism Structure.
• The thermal hardware made of SLI (Single Layer Insulation) and MLI (Multi Layer Insulation) covering the exposed areas of the SAS with the objective of providing an adequate thermal environment to the SAS units.
The antenna assemblies, including their deployment and hold down mechanisms, are accommodated on the nadir panel of the MetOp-SG satellite B.
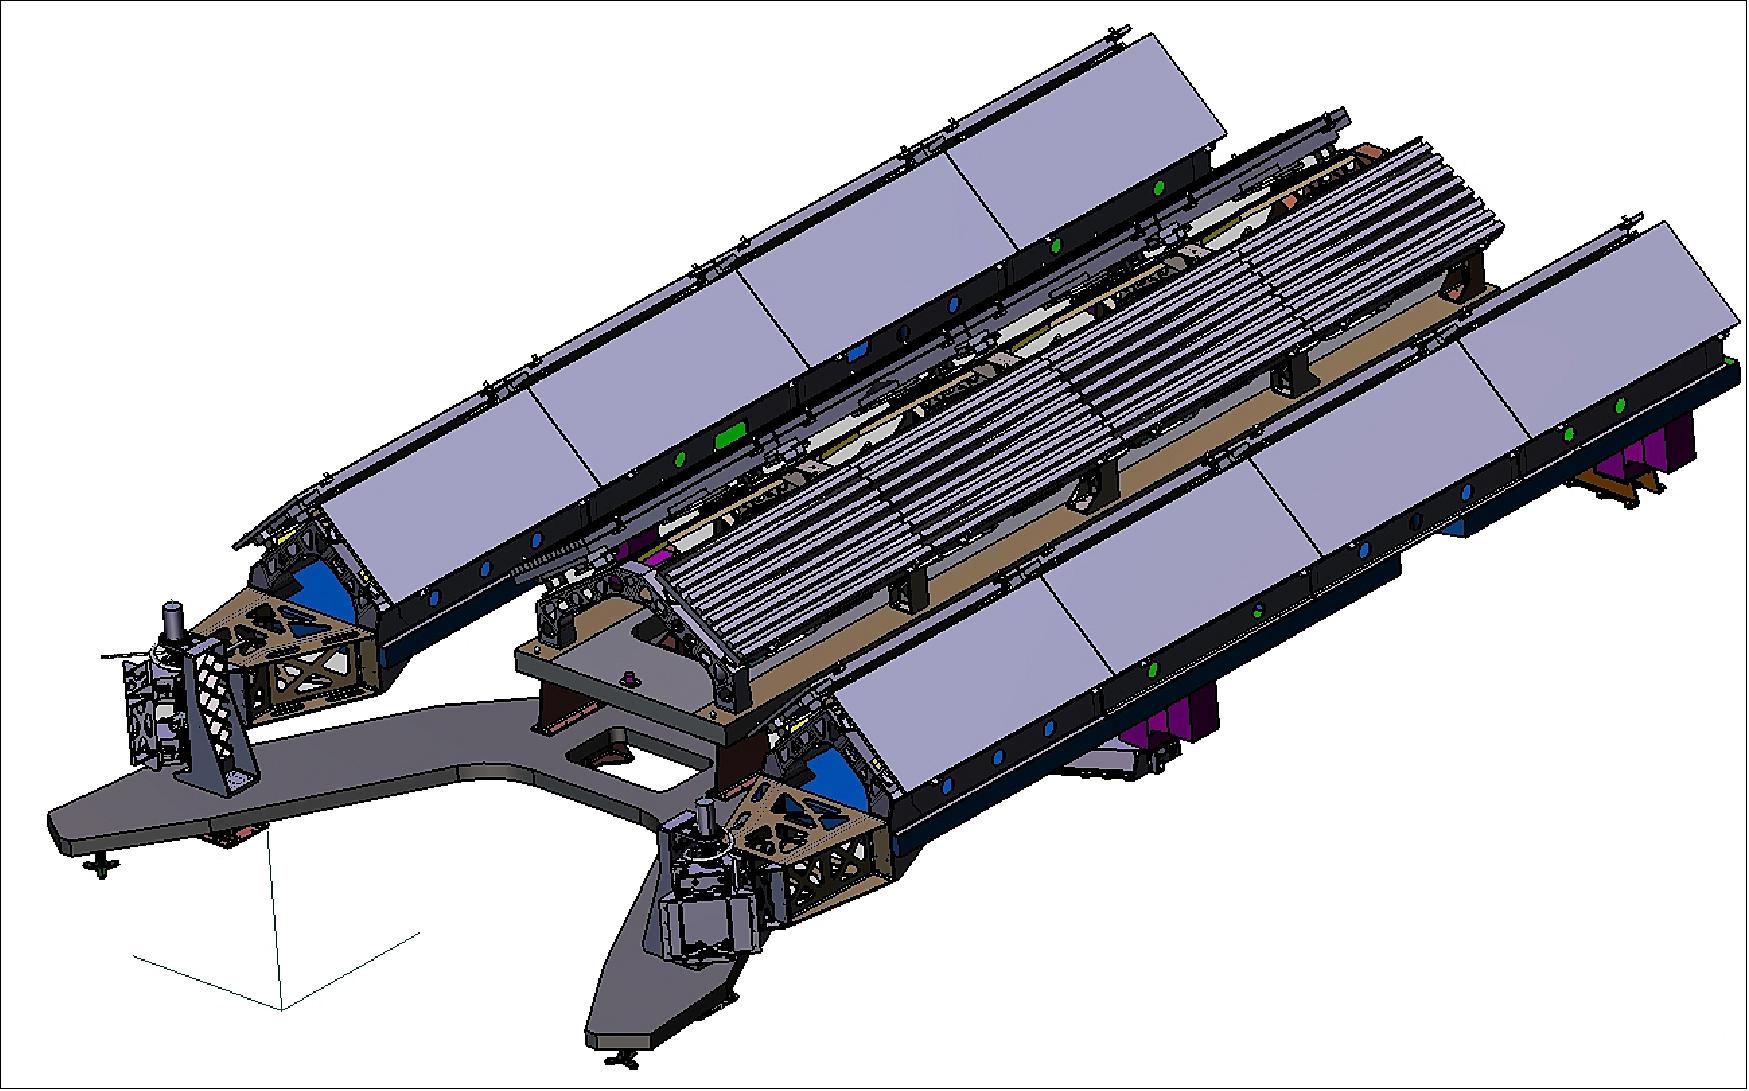
The mechanical structures of the SAS subassemblies (SAAs and MAA) are composed of aluminum brackets parts attached to supporting sandwich structures (each subassembly includes a sandwich panel). They are connected to a common U shaped support panel made of CFRP (Carbon Fiber Reinforced Polymer). Given the size of the SAS antenna and the tight mechanical requirements in terms of mechanical loads, stiffness, mass and frequency response, the design task of these units involves intensive simulation work in order to guarantee that the subassemblies (panels, mechanism) are submitted to mechanical loads compatible with their capabilities.
Thermal performance: The thermal load cases analyzed for SAS are intended to define both the design limits which the equipment has to withstand in orbit, as well as to assess the thermal ranges of each of the units during operation, information which is used to compute the elements deformations due to thermoelastic effects and from this, to derive the impact on the RF behavior.
The following list is a summary of the dimensioning cases:
- Hot/Cold nominal
- Cold Safe – Deployed
- Hot/Cold Stowed (DLM Heaters ON/OFF)
- Launch cases.
Mechanical performance: Given the size and mass of the SAS structure, the dynamic behavior of the SAS is strongly dominated by the design of the interfaces with the satellite. For the Mid Assembly the first fundamental mode is a translation in the longitudinal direction, and for the Side Assemblies the modal response is driven by the stiffness of the structure, the mechanisms (DDM and HD RM) and its distribution along the mounting panel of the spacecraft. Overall, the SAS first fundamental mode in stowed configuration is a torsion along the longitudinal direction of the SAAs at 64 Hz.
In deployed configuration, the main SAS mode is driven by the stiffness of the DLM and the offset of the Side Assemblies masses. The minimum frequency in this case is 2.32 Hz.
Quasi Static Load analysis over 18 cases has been conducted and safety margins have been calculated for each element of the antenna in all static load cases. Sine vibration analysis has been also performed and primary notching levels have been considered to avoid exceeding quasi-static load levels at the SAS interface with the spacecraft. Primary notching takes into account the direct reaction forces in the same direction that the input level. Acoustic coupled analysis has been also performed to derive the mechanical loads to the SAS elements.
With respect to the impact of the structure on the SAS antenna performances, the main input to RF comes from the TED (Thermoelastic Distortion) analysis. TED is performed in deployed SAS configuration and covers the 4min sampled EOL and BOL thermal cases defined by the thermal analysis. In total 150 TED cases have been run.
SAS performance: The SAS performances are driven by the Gain stability requirements for the antenna system. SAS thermal control design and mechanical design are intended to guarantee that thermoelastic effects on the antenna assemblies populated with the radiating panels maintain the antenna gain variation within the 0.1dB requisite.
The RF stability analysis of SAS covers both the TED effects on the radiation patterns, which translates into pointing error and pattern deformation effects, and also on the impact of temperature variations on the RF elements that form the antenna [BFN (Beamforming Network) and radiating panels].
In order to determine these two combined effects, the RF subsystem inputs are the outcomes of the TED and the thermal analysis, presented before. The radiation pattern impact is computed by mapping the TED distortion maps on the array factor of the slotted antenna panels, and from them the pattern effects in terms of antenna gain and sidelobe effects are derived. This process is performed for the 150 EOL/BOL TED cases, for each of the 8 arrays included in SAS.
SAS Development Status
Airbus Defence and Space (Spain) is in charge of the design of the SAS, as well as on the MAIT (Manufacturing Assembly Integration and Test) activities at antenna subsystem level, while the elements that compose the SAS have been submitted to an ITT process through the Best Practices protocol of ESA, which has been recently completed and is now being assigned to the last contractors.
The project development plan includes the design, manufacturing and test of three flight SAS models (PFM, FM2 and FM3) and one STM (Structural and Thermal Model). The STM is the qualification model of the complete thermomechanical subsystem and includes flight representative elements of all the components of the SAS.
In advance to the full SAS model built, each of the SAS subsystems (HDRM, DLM, radiating panels, BFN), has defined their lower tier qualification models and verification strategies in order to guarantee the development of flight model units fully qualified for the environmental boundary conditions defined.
The STM will be the first complete subsystem to be manufactured, integrated and tested for CDR (Critical Design Review). The large dimensions of the SAS involve large test facilities in Europe to perform the test campaign. The selected company in charge of the environmental test campaign is Intespace (Toulouse, France). The flight SAS model will also include the RF test campaign of the antennas.
RO (Radio Occultation sounding mission)
The main objective of the RO mission is to provide measurements of refractivity profiles in the troposphere and the lower stratosphere with a good vertical resolution and high accuracy. Refractivity profiles are then used for retrieving atmospheric temperature and humidity profiles as well information on surface pressure. High quality and global observations of atmospheric temperature and humidity profiles are of great importance for real time assimilation on NWP (Numerical Weather Prediction) and climate monitoring. 42)
A secondary objective of the RO mission is the retrieval of depth of the planetary boundary layer and the height (and structure) of the tropopause. Additionally, ionospheric TEC (Total Electron Content) and electron density profiles can be retrieved.
The RO instrument is equivalently called the GNSS (Global Navigation Satellite System) RO instrument, since it exploits the L-band radio-navigation GNSS signals to extract the required information on the Earth atmosphere.
The RO instrument is a passive instrument measuring the time variation of the excess path length of GNSS signals as they are occulted by the atmosphere. As depicted in Figure 31, the excess path length is the path length difference between the straight line path (between the GNSS satellite and the RO sensor, light blue line in Figure 31) and the actual refracted path (red line in Figure 31) travelled by the signal when passing through the atmosphere (the path is refracted/bended due to vertical refractivity gradients of the atmosphere). The excess path length depends on the refractive index of the atmosphere which is a function of pressure, temperature and humidity. On board the RO sensor, the excess path length is simply obtained by measuring the received GNSS signal carrier phase (equivalent to a signal Doppler shift).
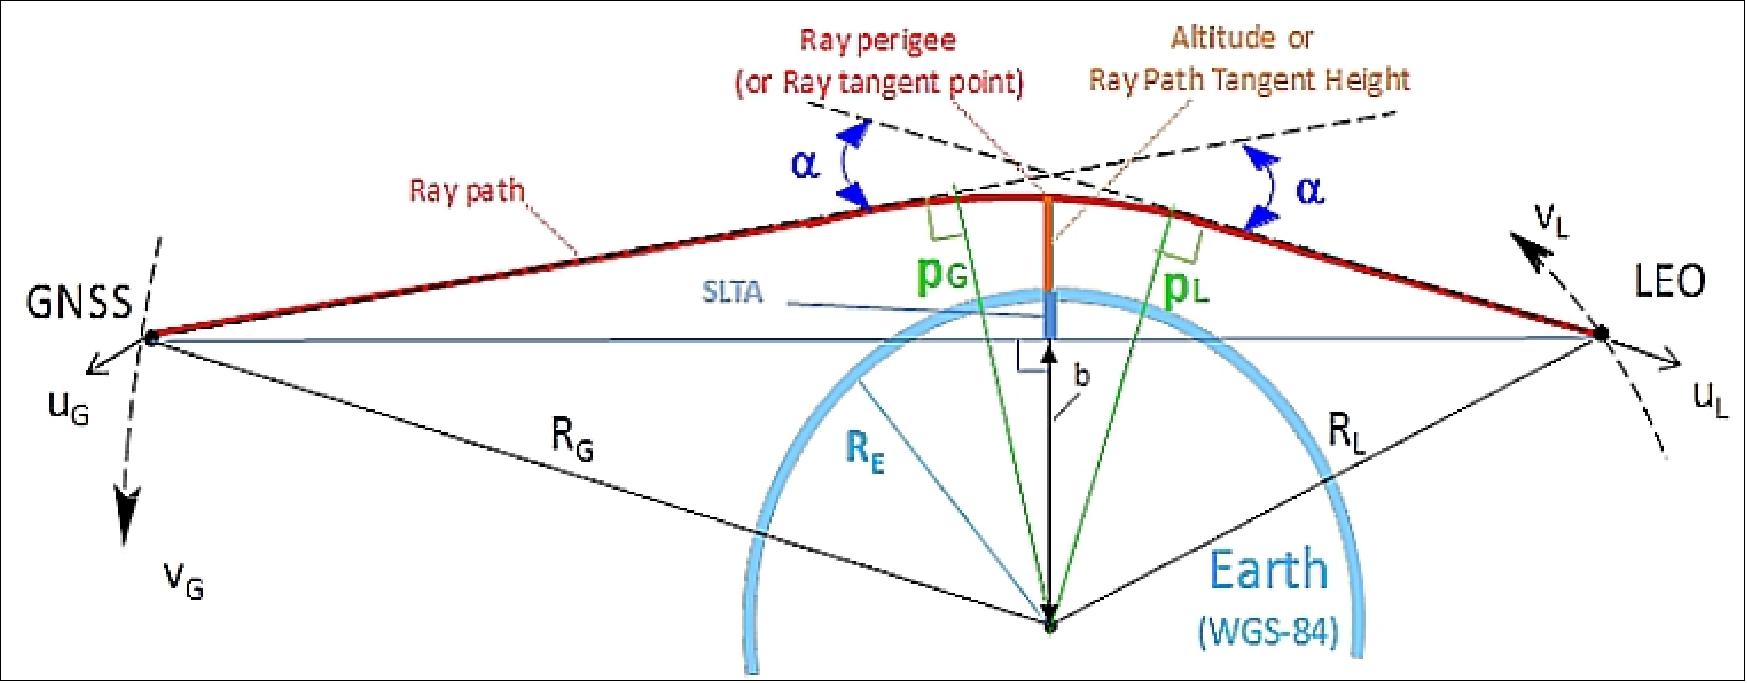
Legend to Figure 31: Shown are the bending angle (α) , the GNSS and LEO side impact parameters (pG and pL), the GNSS and LEO coordinate vectors (RG , RL ), the ray path (solid red line), the SLTA (Straight Line Tangent Altitude), Altitude or Ray Path Tangent Height (in orange), and the satellite side asymptotes of the ray path (dashed).
The RO Level 1b product, starting point for the derivation of instrument requirements, is defined as the geolocated, time-tagged neutral bending angle as a function of impact parameter, available for each occultation.
Main RO instrument requirements are listed in the following:
- Number of occultations per SAT: > 1300/day
- Bending angle accuracy: < 0.5 µrad @ 35 km (1σ)
- Minimum SLTA (Straight Line Tangent Altitude): < -300 km
- Carrier and Code Open-Loop in Dual Frequency
- Open-Loop and Closed-Loop parallel processing
- Altitude range: 0-80 km for atmosphere, 80 km- 500 km for ionosphere
- Tracking of GNSS constellations: GPS, Galileo, and optionally GLONASS, BeiDou.
System | Signal | Carrier Frequency (MHz) |
GPS | L1 C/A | 1575.42 |
GPS | L1C | 1575.42 |
GPS | L5 | 1176.45 |
Galileo | E1-B/C | 1575.42 |
Galileo | E5a | 1176.45 |
GLONASS | L1 OC | 1575.42* |
GLONASS | L5 OC | 1176.45* |
Compass-BeiDou | B1 | 1575.42* |
Compass-BeiDou | B2a | 1175.00* |
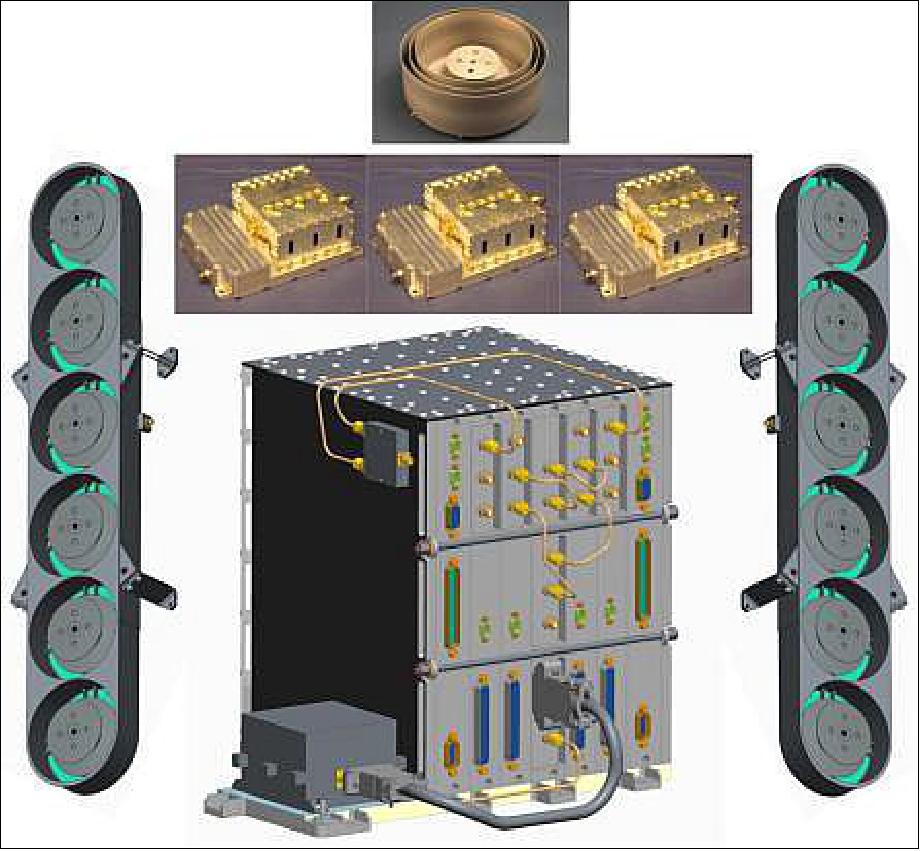
Instrument description: The RO instrument is mainly composed of 3 antennas (zenith, velocity and anti-velocity antennas), of a central electronics unit, and, if needed, depending on satellite configuration, by external LNA/filtering units for system noise figure minimization. The velocity and anti-velocity antennas are, respectively, looking in the velocity and anti-velocity satellite directions for tracking of rising and setting occultations. The central electronic unit is the core of the instrument. It performs signal filtering, down-conversion, signal processing, storage and instrument control tasks. The electronic unit is able to track new high-rate GPS, Galileo, GLONASS and Beidou signals as well as pilot signals. The signals are tracked by means of classical closed-loops, but also, in parallel, by carrier and code open-loops in order to deal with multipath conditions occurring in the lower troposphere. Tracking parameters such as sampling rate, integration time, loops bandwidth, are configurable anytime during the mission in order to guarantee maximum signal processing flexibility. The instrument operates both at L1 and L5 GNSS center frequencies in order to support the on-ground processing for correction of frequency-dependent ionospheric effects.
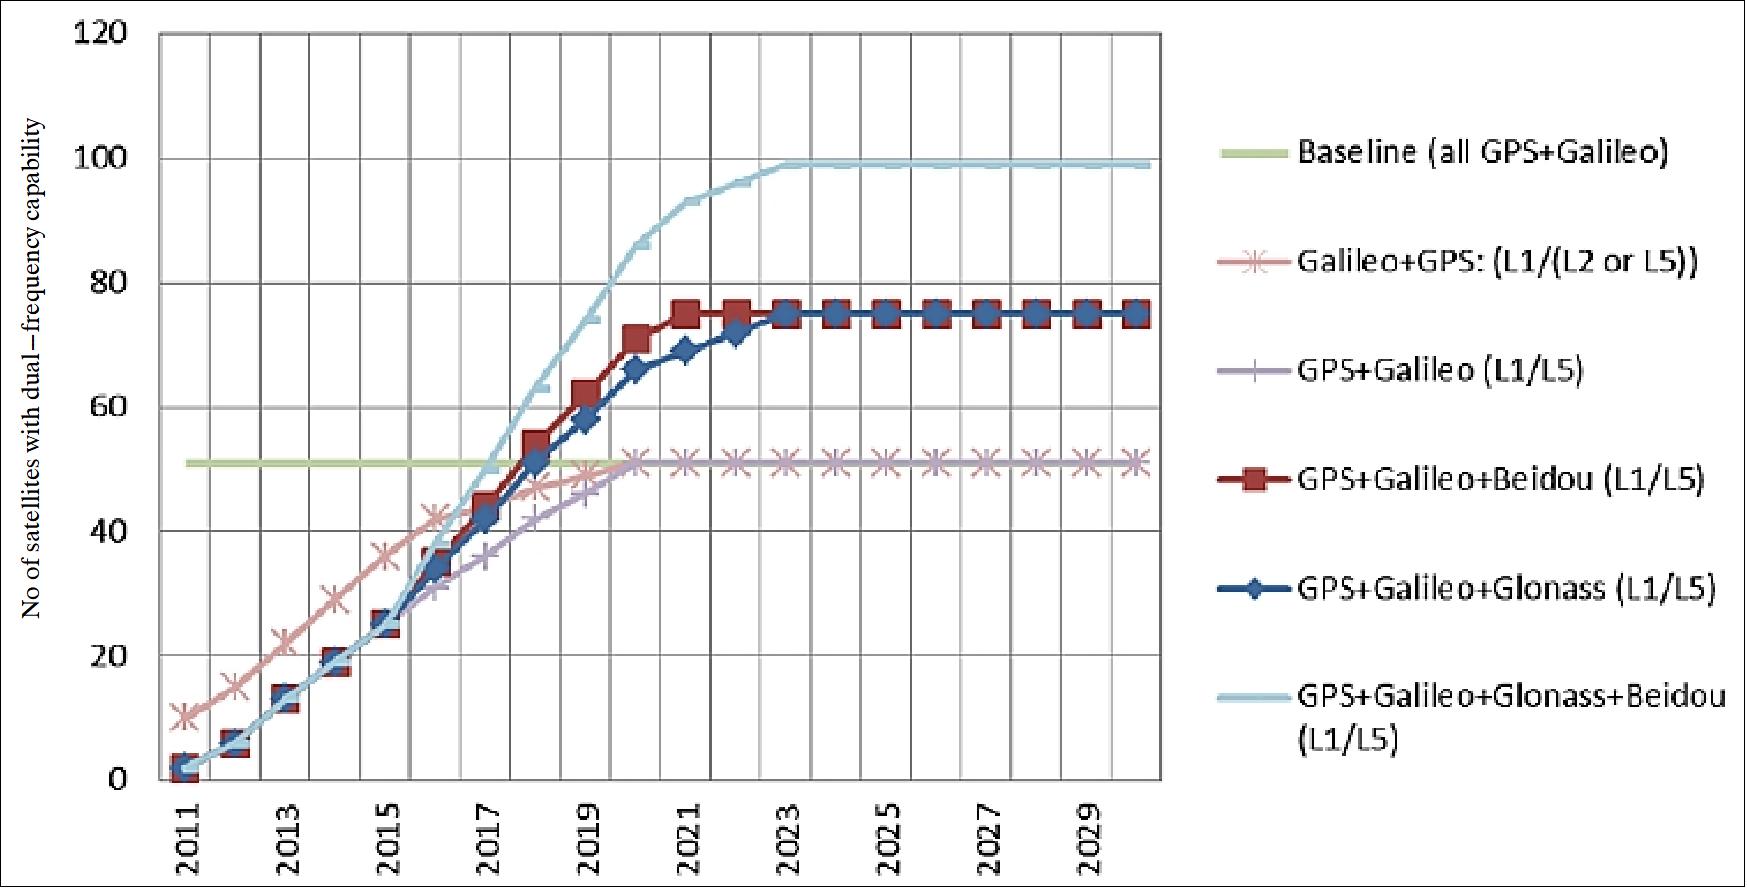
Predicted performance: The upcoming deployment of new GNSS constellations (i.e. Galileo, Beidou-Compass) and the improvement of associated signal characteristics make the MetOp-SG Radio Occultation sounding mission very attractive, considering the success of the current mission on board MetOp.
As an example, the coverage will improve up to three times thanks to the exploitation of Galileo and GLONASS (or Beidou/Compass) systems. With a single satellite it will be possible to achieve more than 1300 occultations per day. - In addition, the characteristics of novel signals such as the pilot signals, will guarantee higher quality observations on the lower troposphere regions. Novel design of open-loop acquisition schemes will also improve the quality and robustness of observations on the low troposphere. Other improvements come from the use of dual frequency channels with wide separation (i.e. L1 and L5), leading to better correction of the ionosphere.
Figure 32 shows the expected evolution of GNSS systems deployment, according to latest available public information.
All these features will be such that the radio occultation instrument will almost double the bending angle accuracy performance with respect first generation and will provide up to three times better Earth spatial-temporal sampling.
Parameter | MetOp GRAS | MetOp-SG |
Bending angle accuracy | <0.8 μrad @ 35km | <0.5 μrad @ 35 km |
Number of observations per satellite | ~ 650 occultations/day | ~ 1300 occultations/day (GPS, Gal) |
GNSS constellations | GPS only | GPS, Galileo, GLONASS, Compass |
Closed Loop | Yes, @ L1 and L2 | Yes, @ L1 and L5 |
Open Loop for low altitude tracking | Open Loop @ L1, | Open Loop @ L1 and L5, |
Use of pilot signals | No | Yes, yields to better performance in closed loop |
Minimum SLTA | -140 km, extendible | -300 km |
3MI (Multi-viewing, Multi-channel, Multi-polarization Imaging mission)
The primary 3MI mission objective is to provide aerosol characterization for climate monitoring, NWP (Numerical Weather Prediction), atmospheric chemistry and air quality. High quality aerosol imagery ,delivered by the 3MI mission, will facilitate the measurement of all essential aerosol parameters for climate records, such as aerosol optical depths, particle types and sizes, refractive index, sphericity and height index. When used as constrains to the models, these products will be used to provide improved AQI (Air Quality Index) and Aerosol Load Masses for different particles sizes (Ref. 26). 43) 44)
The measurement of surface albedo as well as improved cloud characterization are 3MI mission’s secondary objectives. The first will be facilitated via the observation of the surface BRDF (Bidirectional Reflectance and Distribution Function), made possible by the unique multi-angular measurement concept adopted. Similarly, while METimage will provide information on most cloud properties, the multi-viewing and multi-polarization measurements delivered by the 3MI mission will allow for accurate characterization of the extension, optical depth, particle size as well as asphericity factor and crystal orientation of cirrus clouds.
While currently, aerosol and cirrus parameters are mostly used in GCMs ( General Circulation Models) for climate simulation and prediction, utilization of these parameters is becoming increasingly important in operational NWP as the representation of radiative processes in the atmosphere is a recognized area of deficiency. Hence, the 3MI mission is expected to be of great benefit to both real-time and non-realtime user communities.
Background: Aerosol properties can only be unambiguously determined by instruments that can provide the so called 3M type of measurements, i.e. by instruments offering multi-viewing, multi-channel and multi-polarization capabilities. The only instrument designed specifically to do exactly that is the POLDER instrument. Developed by CNES, POLDER-1 and POLDER-2, respectively, launched in 1996 and 2002 on board the Japanese satellites ADEOS (Advanced Earth Observation Satellite) and ADEOS-2, were short-lived. POLDER-3 followed in 2004 on board the PARASOL satellite (A-train) and still delivers its measurements today (2012), having the highest aerosol retrieval capability of all other passive instruments currently in space. The APS (Aerosol Polarimetric Sensor), which was designed to provide even higher polarimetric accuracy and a larger number of viewing angles, unfortunately failed during launch of the Glory satellite in March 2011.
3MI is an evolution of the POLDER-3 / PARASOL instrument. It will therefore provide similar type of measurements (multi-angle, multi-wavelength and multi-polarization) nevertheless with an improved spatial resolution (4 km at nadir) and coverage, and over an extended spectral range (400 -2100 nm).
The 3MI measurement concept: In order to facilitate the ‘multi-viewing’ type of measurements, 3MI adopts a similar to the POLDER instrument concept, upon which overlapping 2D images on the surface of Earth are recorded consecutively at regular points along the orbit [called along-track (ALT) acquisition points], thus providing the means to sense the TOA (Top of Atmosphere) radiance at different OZAs (Observation Zenith Angles) for each target.
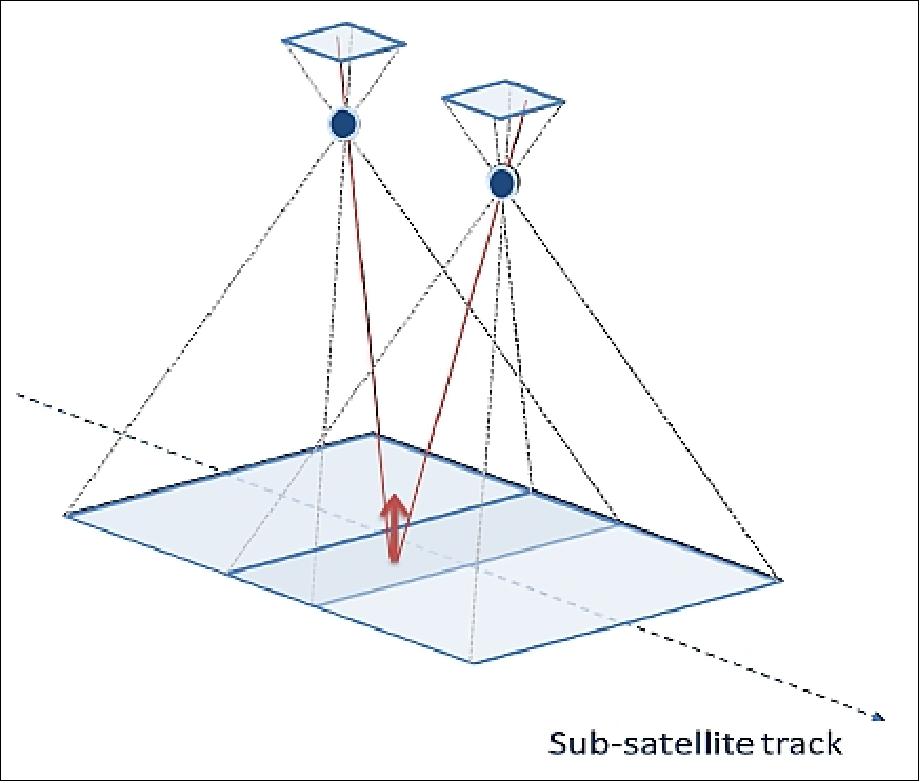
The various spectral channels as well as the polarization state of the incoming to the instrument signal is then recorded by means of a rotating filter wheel, which accommodates all necessary filters and polarizers. All channels are acquired (in any given ALT acquisition) in less than 7 s during a single filter wheel rotation, while the distance between two consecutive ALT acquisitions is in the order of 22 seconds.
The 3MI instrument is providing a number of spectral channels spanning over an extended (compared to that of POLDER) spectral range, from 410 nm to 2130 nm. To achieve this, 3MI features two optical modules (VNIR and SWIR), each made of a dedicated telescope and focal plane assembly, both sharing a single filter wheel hosting all necessary spectral filters and polarizers. In the current instrument baseline, the two modules feature different ALT FOVs which has an impact both on the number of OZAs acquired per target and also on the OZA sampling range achieved for the two different groups of channels.
The VNIR module features a FOV of ±50.2º x ±50.2º (ACT x ALT, respectively), while the 3MI SWIR module features a FOV of ±50.2 º x ±30º (ACT x ALT, respectively). Due to this difference and given the timings mentioned earlier, this leads to approximately 14 and 6 OZAs views for each target within the swath of the instrument for the VNIR and SWIR groups, respectively. The angular sampling range will also vary accordingly between the two modules. It is possible, however, to increase the number of angular samples in the SWIR module by implementing the so-called angular ‘oversampling’, whereby additional images are obtained, only for the SWIR channels, using one of the extra rotations of the filter wheel in-between the two nominal ALT acquisitions (during which the instrument would otherwise remain idle). These extra samples, however, cannot be co-registered with the VNIR ones.
One direct consequence of the adopted measurement concept is that, during any given pass of the satellite, a set of views is collected, which are nevertheless different for different targets on Earth. It is also obvious that, for any given target, the angular sampling step is also different as well as irregular. Figure demonstrates this, reporting the OZAs recorded for various targets on the sub-satellite track (from the VNIR module), between two sub-satellite points corresponding to two consecutive ALT acquisition points. The horizontal axis reports the normalized distance of a given target between those two points. It can also been seen from this figure that the angular sampling interval among the different angular samples collected for each target is not constant either (varies from about 5 deg to approximately 12 deg) and also different for different targets. Still, this irregular sampling is thought to facilitate improved accuracy of the aerosol specific retrieval algorithms.
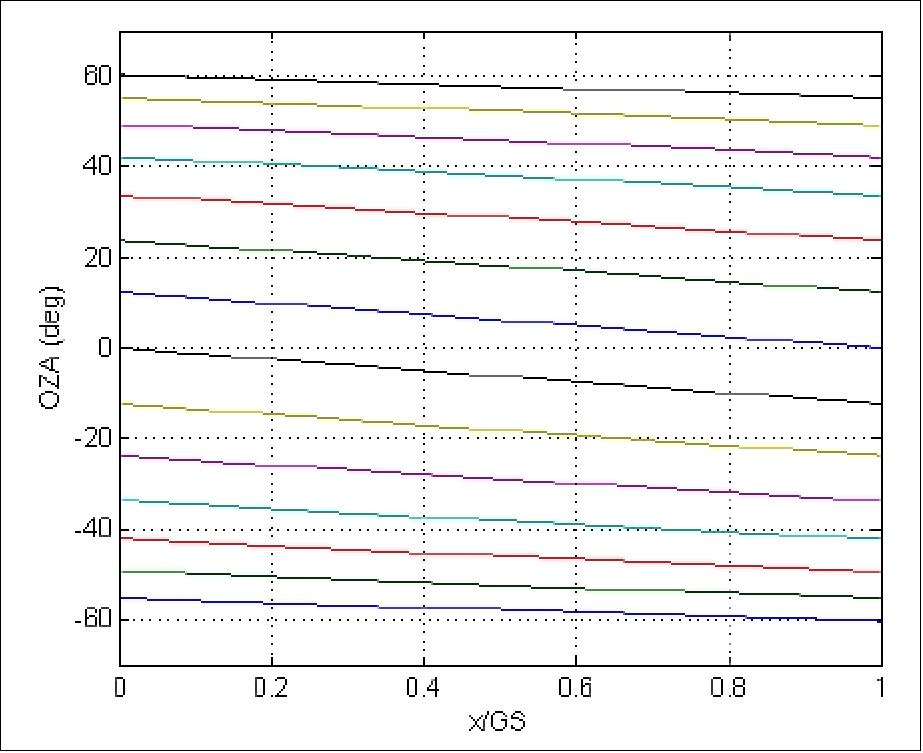
Figure 36 shows the footprint of the VNIR module of 3MI when the satellite crosses the equator in the day part of the orbit, indicating the range of OZAs accessible by the instrument for the different targets on Earth in a single image acquisition.
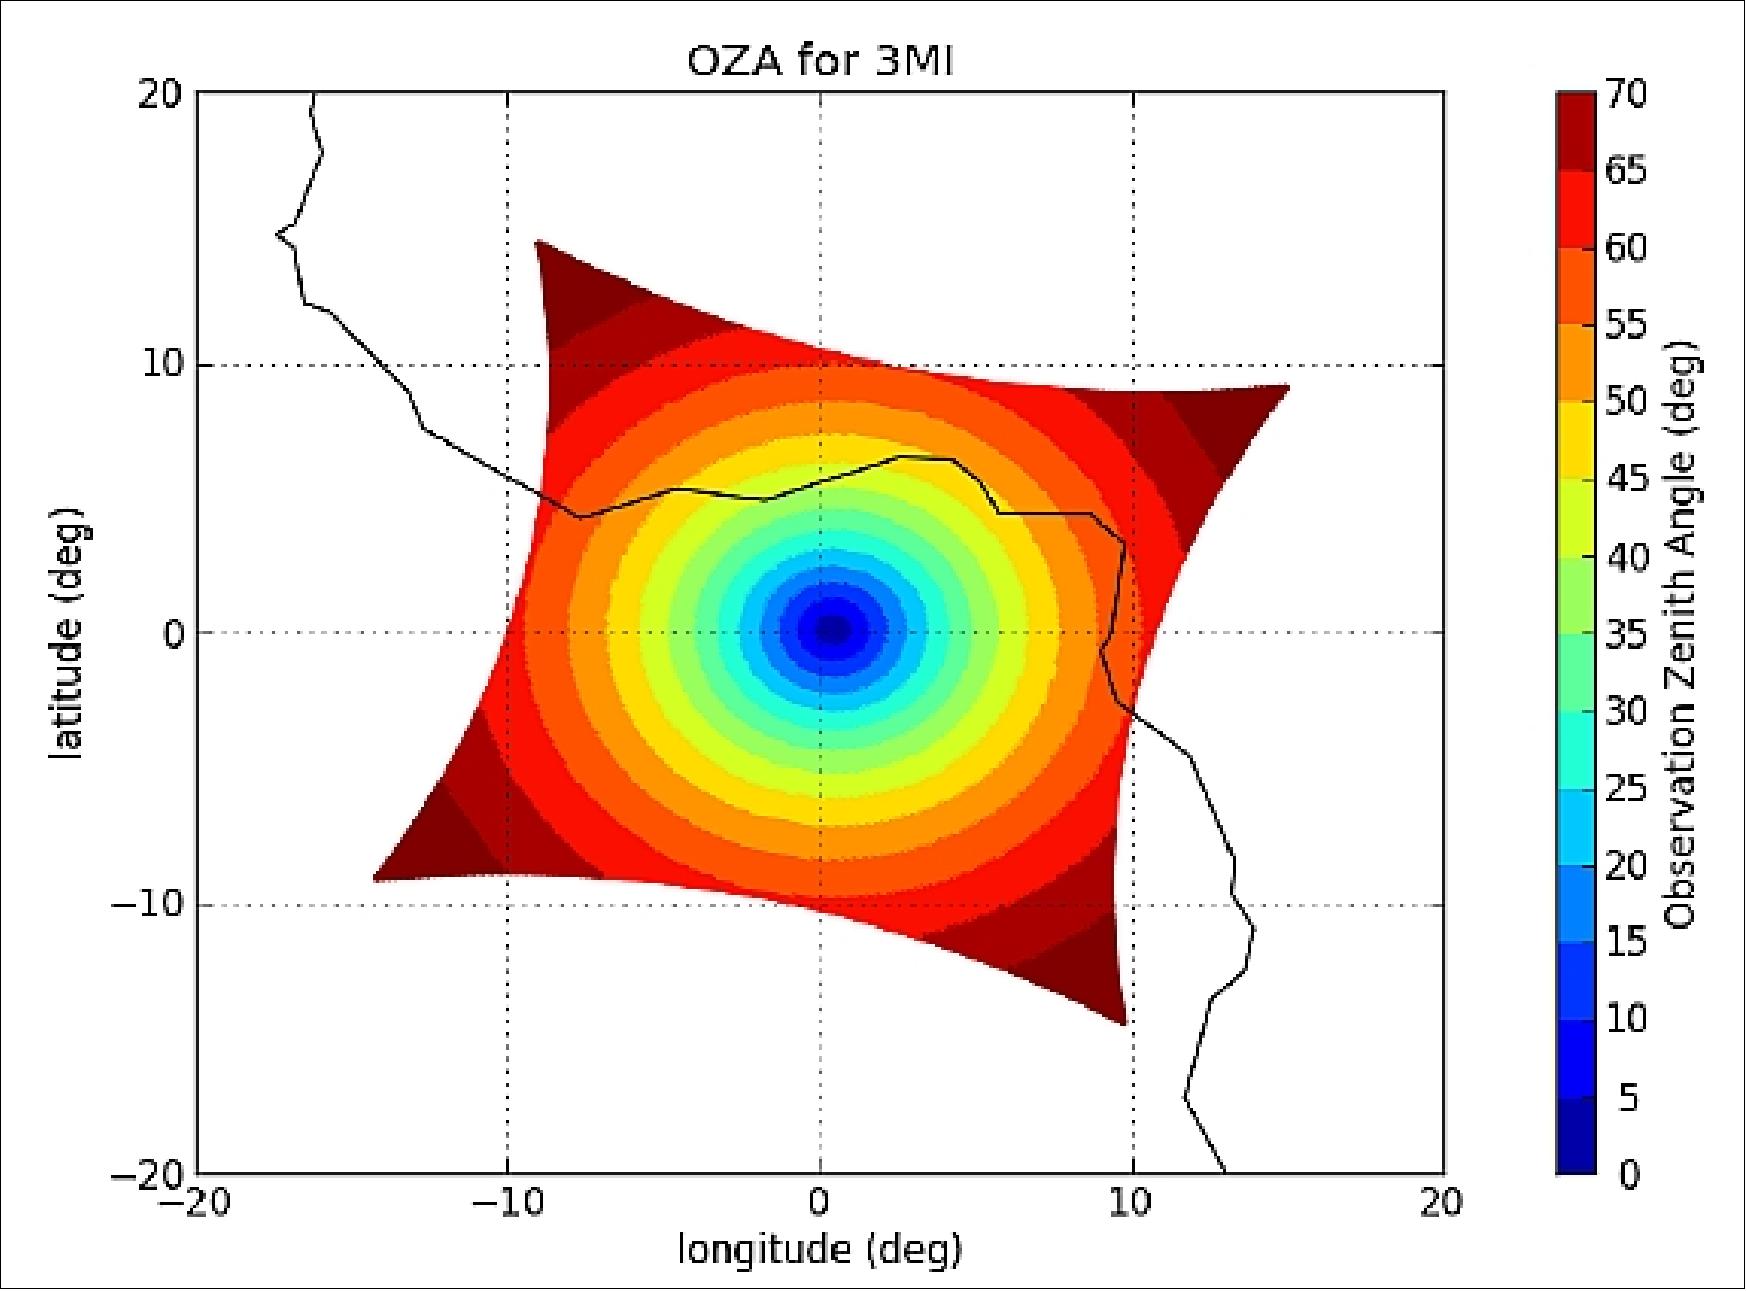
3MI Key Performances
• 3MI swath: 3MI delivers a minimum swath of 2200 km, which is considerably larger of that of POLDER-3 on PARASOL. This is the result of its increased ACT (Across Track) FOV (± 50.2° for 3MI compares with ±42.6° for POLDER-3), as well as the higher orbiting altitude of MetOp-SG (approx. 820 km of MetOp-SG compares with approx. 705 km of the A-train /PARASOL orbit). Figure 37 shows the footprints of the two instruments for cross-comparison.
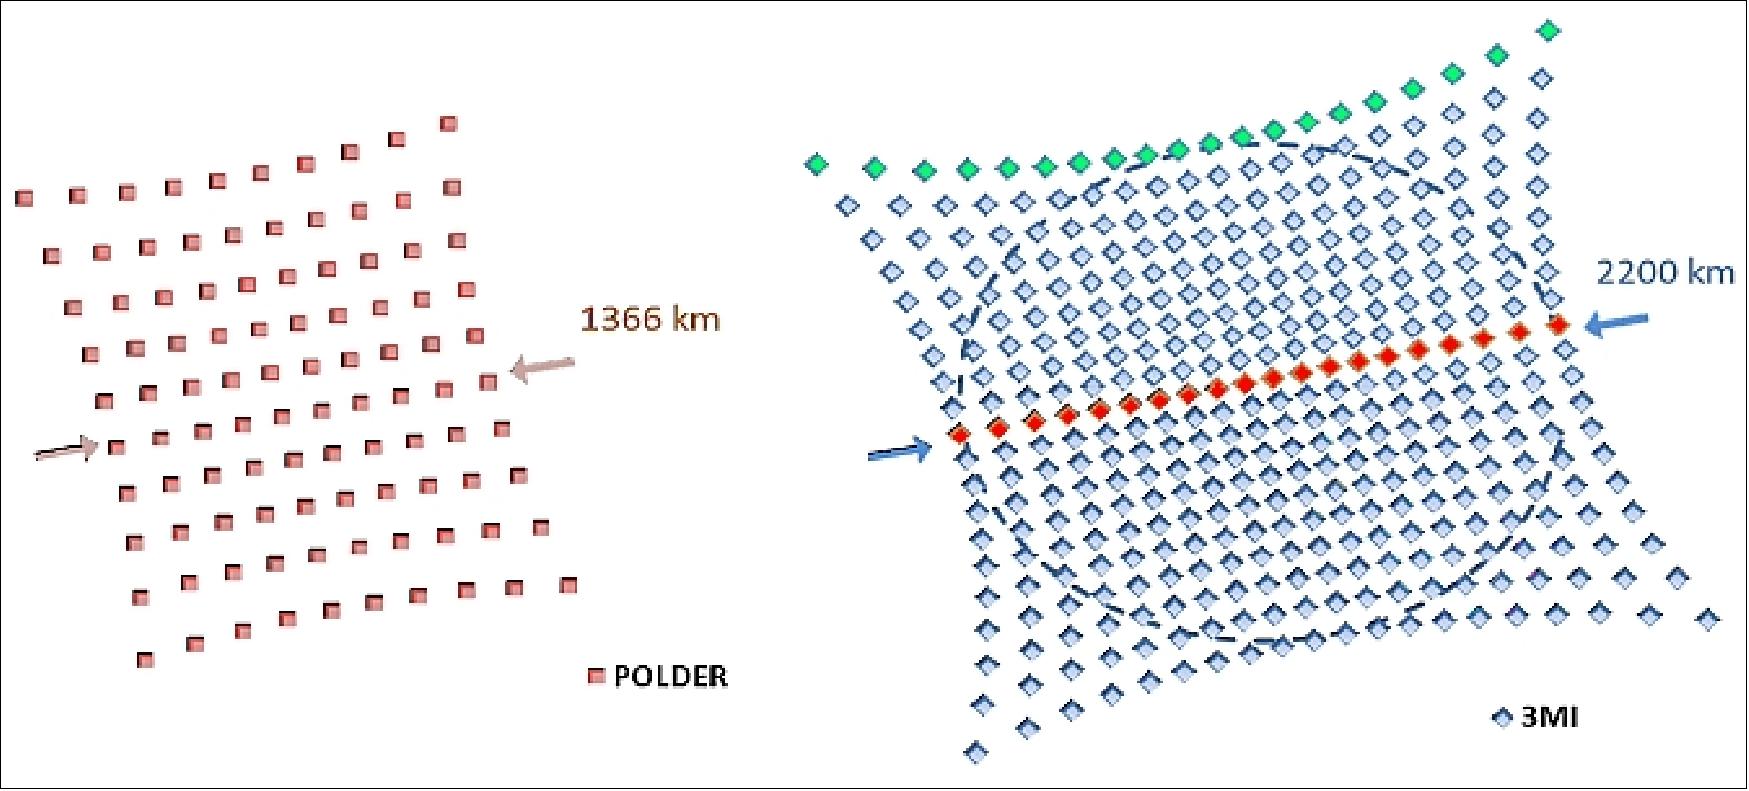
• Illumination geometry and scattering angle: The illumination geometry is of great interest too for the retrieval of the final 3MI products. Of particular importance is the so called Scattering Angle (SCA), defined as the π supplement of the angle formed by the direction of sun illumination and the satellite viewing direction (OZA) in the target reference frame. Figure 38 shows the accessible scattering angles by the nadir view of the instrument, (i.e. the one obtained using the central detector line), both for POLDER-3 and 3MI, indicating the differences which are the result of the two different orbits.
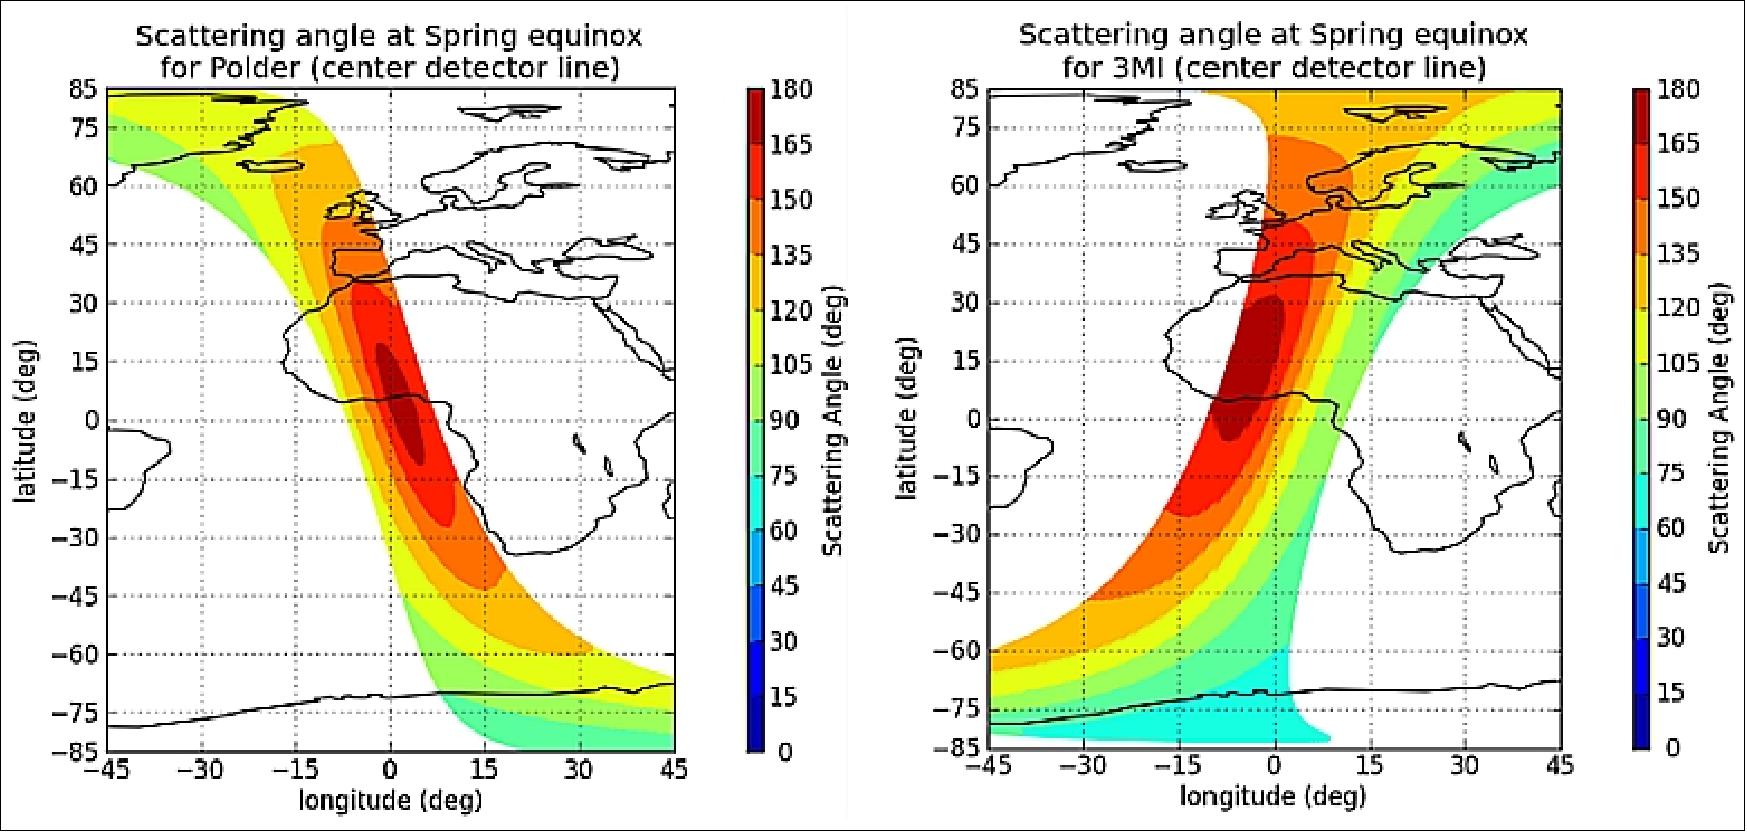
• Spatial sampling: The SSD (Spatial Sampling Distance) of 3MI in the along track and across track directions is a maximum of 4 km at nadir and varies slightly with the variation of altitude along the orbit. This compares with approximately 6 km of the POLDER-3 instrument. For off-nadir points, this figure increases slightly due to the curvature of the Earth and the mapping law of the instrument. For 3MI, the mapping law is an “f.tan(THETA)” law, which leads to a relative mild increase of the SSD across the swath. Figure 39, demonstrates the SSD variation for all samples within an 3MI image acquired above the equator. The color scale gives the average (mean ACT- and ALT-) SSD.
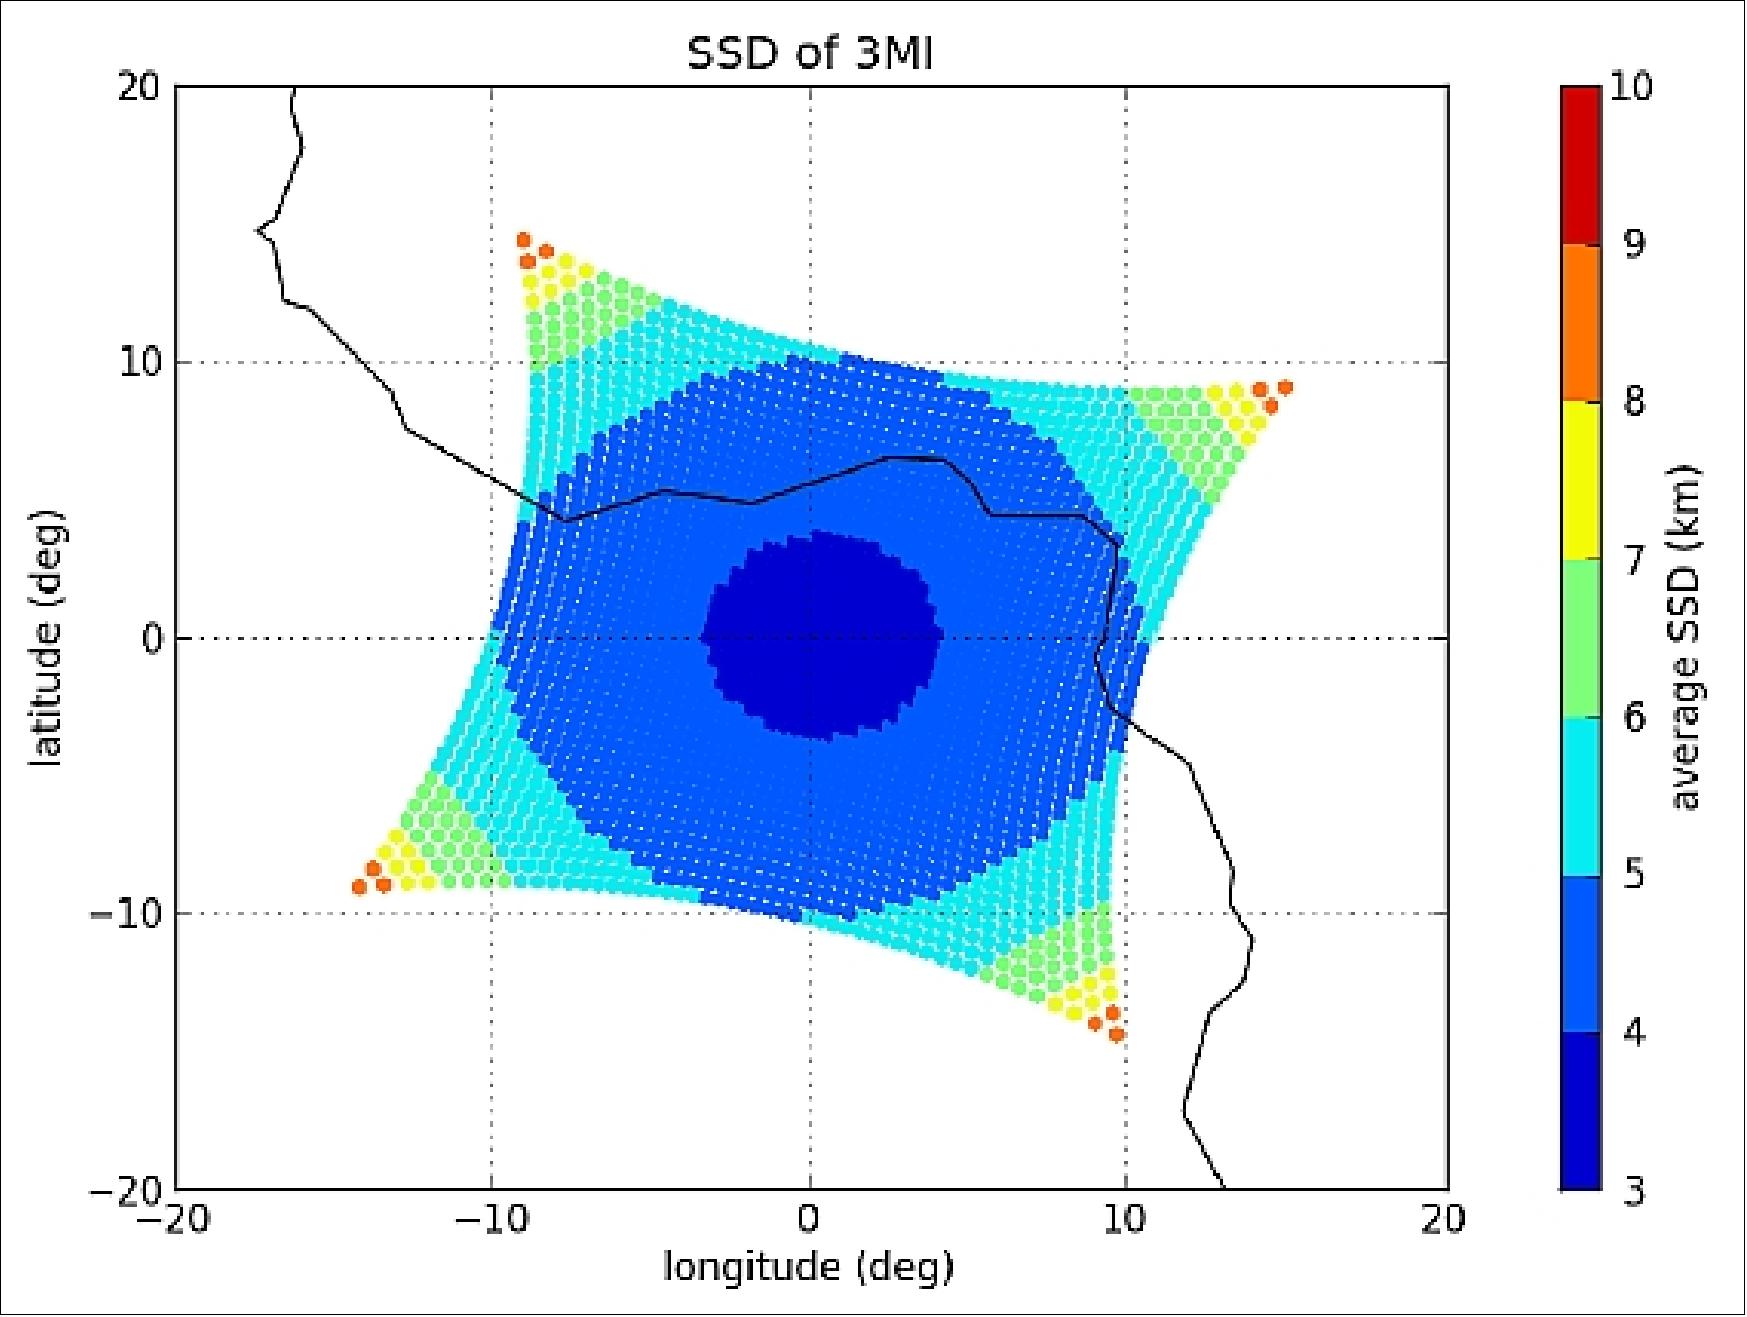
• 3MI spectral channels: The 3MI spectral bands are shown in Table 13. For comparison this table contains also the POLDER-3 spectral bands as well as the bands of 3MI at the beginning and the end of the Phase A studies. This last table is the current 3MI baseline. Red color is used to indicate the main differences. The extension of the spectral coverage of 3MI towards both sides of the spectrum is evident from this table.
PARASOL/POLDER | 3MI - Start of Phase A | 3MI - End of Phase A | |||||||
| Center Wavelength (nm) | Width (nm) | Polarized | Center Wavelength (nm) | Width (nm) | Polarized | Center Wavelength (nm) | Width (nm) | Polarized |
VNIR |
|
|
| 354 | 10 | Y |
|
|
|
|
|
| 388 | 20 | Y | 410 | 20 | Y | |
443 | 20 | N | 443 | 20 | Y | 443 | 20 | Y | |
490 | 20 | Y | 490 | 20 | Y | 490 | 20 | Y | |
565 | 20 | N | 555 | 20 | Y(G)/N(R) | 555 | 20 | Y | |
670 | 20 | Y | 670 | 20 | Y | 670 | 20 | Y | |
763 | 10 | N | 763 | 10 | N | 763 | 10 | N | |
765 | 40 | N | 754(G)/765(R) | 20(G)/40(R) | N | 754 | 20 | N | |
865 | 40 | Y | 865 | 40 | Y | 865 | 40 | Y | |
910 | 20 | N | 910 | 20 | N | 910 | 20 | N | |
1020 | 20 | N |
|
|
|
|
|
| |
SWIR |
|
|
| 1370 | 40 | Y | 1370 | 40 | Y |
|
|
| 1650 | 40 | Y(G)/N(R) | 1650 | 40 | Y | |
|
|
| 2130 | 40 | Y | 2130 | 40 | Y | |
• Polarization sensitivity: Assuming the measurement of a stable, spatially uniform and linearly polarized scene, the polarization sensitivity of the instrument is defined as PS = (Smax-Smin)/(Smax+Smin), where Smax and Smin are the maximum and minimum sample values, respectively obtained when the polarization is gradually rotated over 180º. Table 14 shows the predicted values for this key instrument performance parameter for samples acquired with an OZA ≤ 60° and for samples acquired with an OZA> 60°. Figure 40 gives a typical example of the behavior of polarization sensitivity across the FOV of the instrument, for both a polarized and a non-polarized channel.
Item | Polarization Sensitivity | |
3MI channel | OZA ≤ 60º | OZA > 60º |
All 3MI polarized channels (except 410 nm) | > 0.96 | > 0.94 |
410 nm channel | > 0.93 | > 0.91 |
All 3MI non-polarized channels | < 0.05 | < 0.07 |
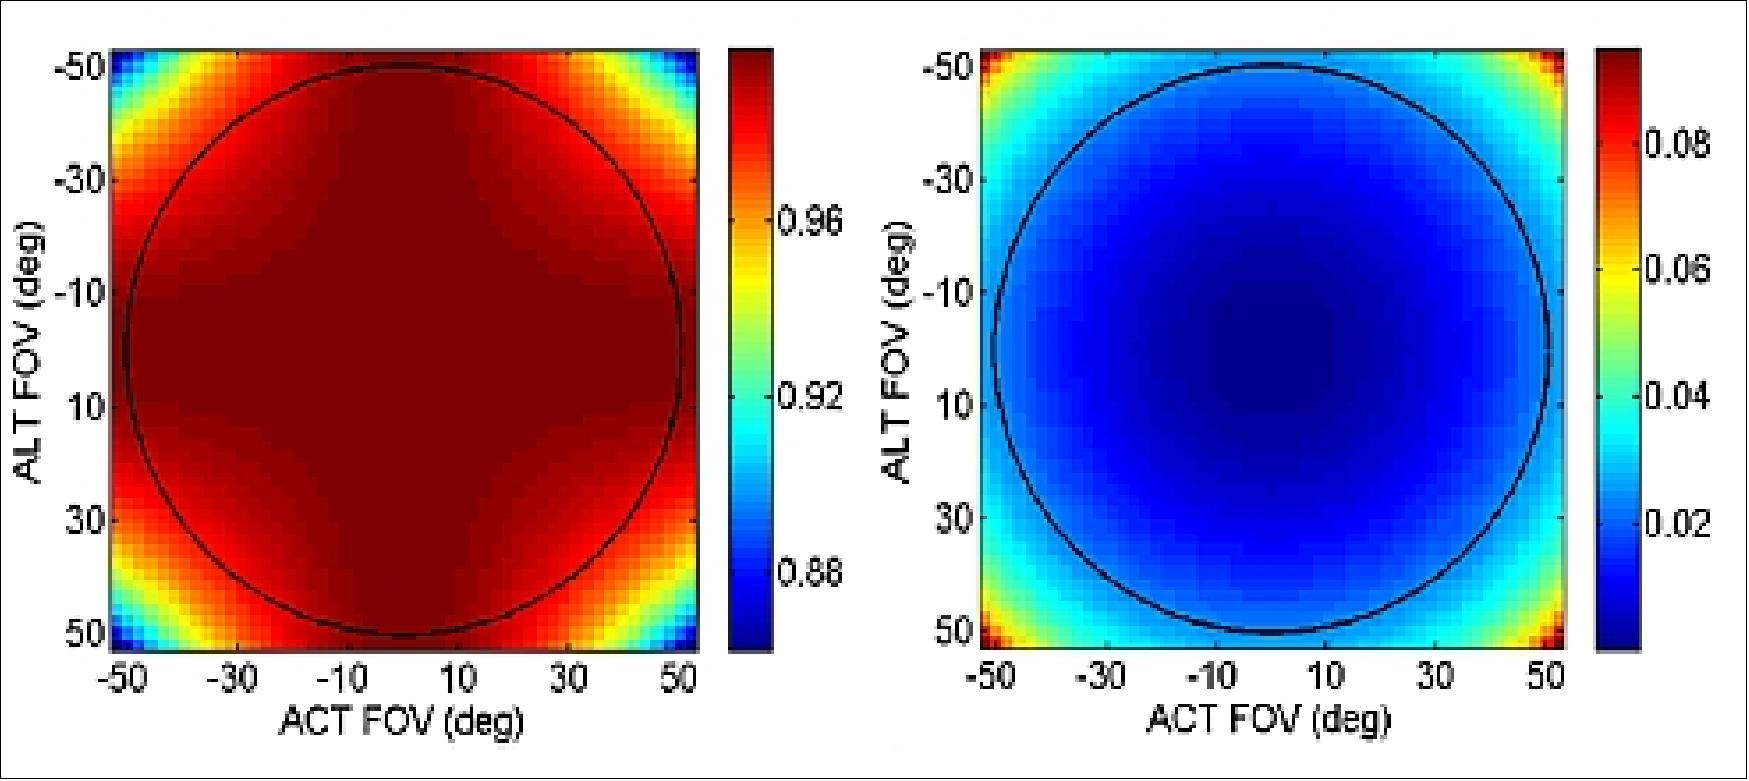
• Instrument radiometric resolution and calibration: As with POLDER, 3MI does not feature an on-board calibration system. Its absolute radiometric calibration cannot be subsequently guaranteed at instrument level, but will be subject to the accuracy of the vicarious calibration campaigns to be performed during the lifetime of the instrument. As a result, the output product of 3MI at instrument level (conventionally noted as Level 1b1), will be subject to absolute radiometric scaling and correction during the actual operations. Regarding radiometric resolution, a SNR (Signal-to-Noise Ratio) of 200 is specified for a range of TOA (Top-of-Atmosphere) radiances between Lref and Lmax, where the ratio of Lmax/Lref is approximately 11 for all specified spectral bands.
3MI Instrument Design
In the frame of MetOp SG-A mission, Leonardo Spa of Campi Bisenzio, Italy, is leading a large Industrial Team – including more than 10 subcontractors – for developing an imaging radiometer called 3MI (Multi-viewing, Multi-channel, Multi-polarization Imaging). The 3MI instrument main science objectives are to collect Earth imagery and to provide a measurement of the TOA (Top-of-Atmosphere) radiance; the collected data is used to derive information concerning the BRDF (Bidirectional Reflectance Distribution Function) and the (BPRF (Bidirectional Polarized Reflectance Function). The imagery is ultimately used to study changes in the Earth tropospheric aerosol distribution, the Earth radiance budget, land surface and ocean color. 45)
The 3MI mission is primarily aimed at providing aerosol characterization for climate monitoring, NWP (Numerical Weather Prediction), atmospheric chemistry and air quality. High quality aerosol imagery delivered by the 3MI mission will facilitate the measurement of all essential aerosol parameters for climate records, such as aerosol optical depths, particle types and sizes, refractive index, sphericity and height index. When used as constrains to the models, these products will be useful to provide improved Air Quality Index and Aerosol Load Masses for different particles sizes.
Secondary mission objectives include the measurement of surface albedo as well as improved cloud characterization. More specifically, the mission will facilitate the measurement of surface albedo via the observation of the surface BRDF, made possible by the unique multi-angular measurement concept adopted. The multi-viewing and multi-polarization measurements delivered by the 3MI mission will allow for accurate characterization of the extension, optical depth, particle size as well as asphericity factor and crystal orientation of cirrus clouds. While currently, aerosol and cirrus parameters are mostly used in General Circulation Models for climate simulation and prediction, utilization of these parameters is becoming increasingly important in operational NWP as the representation of radiative processes in the atmosphere is a recognized area of deficiency. Hence, the 3MI mission is expected to be of great benefit to both real-time and non-real-time user communities.
Measurement concept: Based on the heritage of the POLDER/PARASOL instrument by the French Space Agency (CNES), 3MI will extend the observations to the SWIR spectral range with improved spatial resolution and swath (4 km and 2200 km, respectively). 3MI combines sequential views of the same ground target with multi-channel spectral acquisitions in both polarized and un-polarized channels.
The measurement concept of 3MI is based on a multi-angle acquisition performed by forward, nadir and backward observations of the same on-ground target at different instants exploiting the very wide FOV (Field of View) optical design, a two-dimensional FPA (Focal Plane Array) and the pushbroom scanning concept in which the satellite orbital motion is used as ALT (Along-Track) scanning, providing the means to sense the TOA) radiance at different OZAs (Observation Zenith Angles) for each target. This is schematically shown in Figure 41.
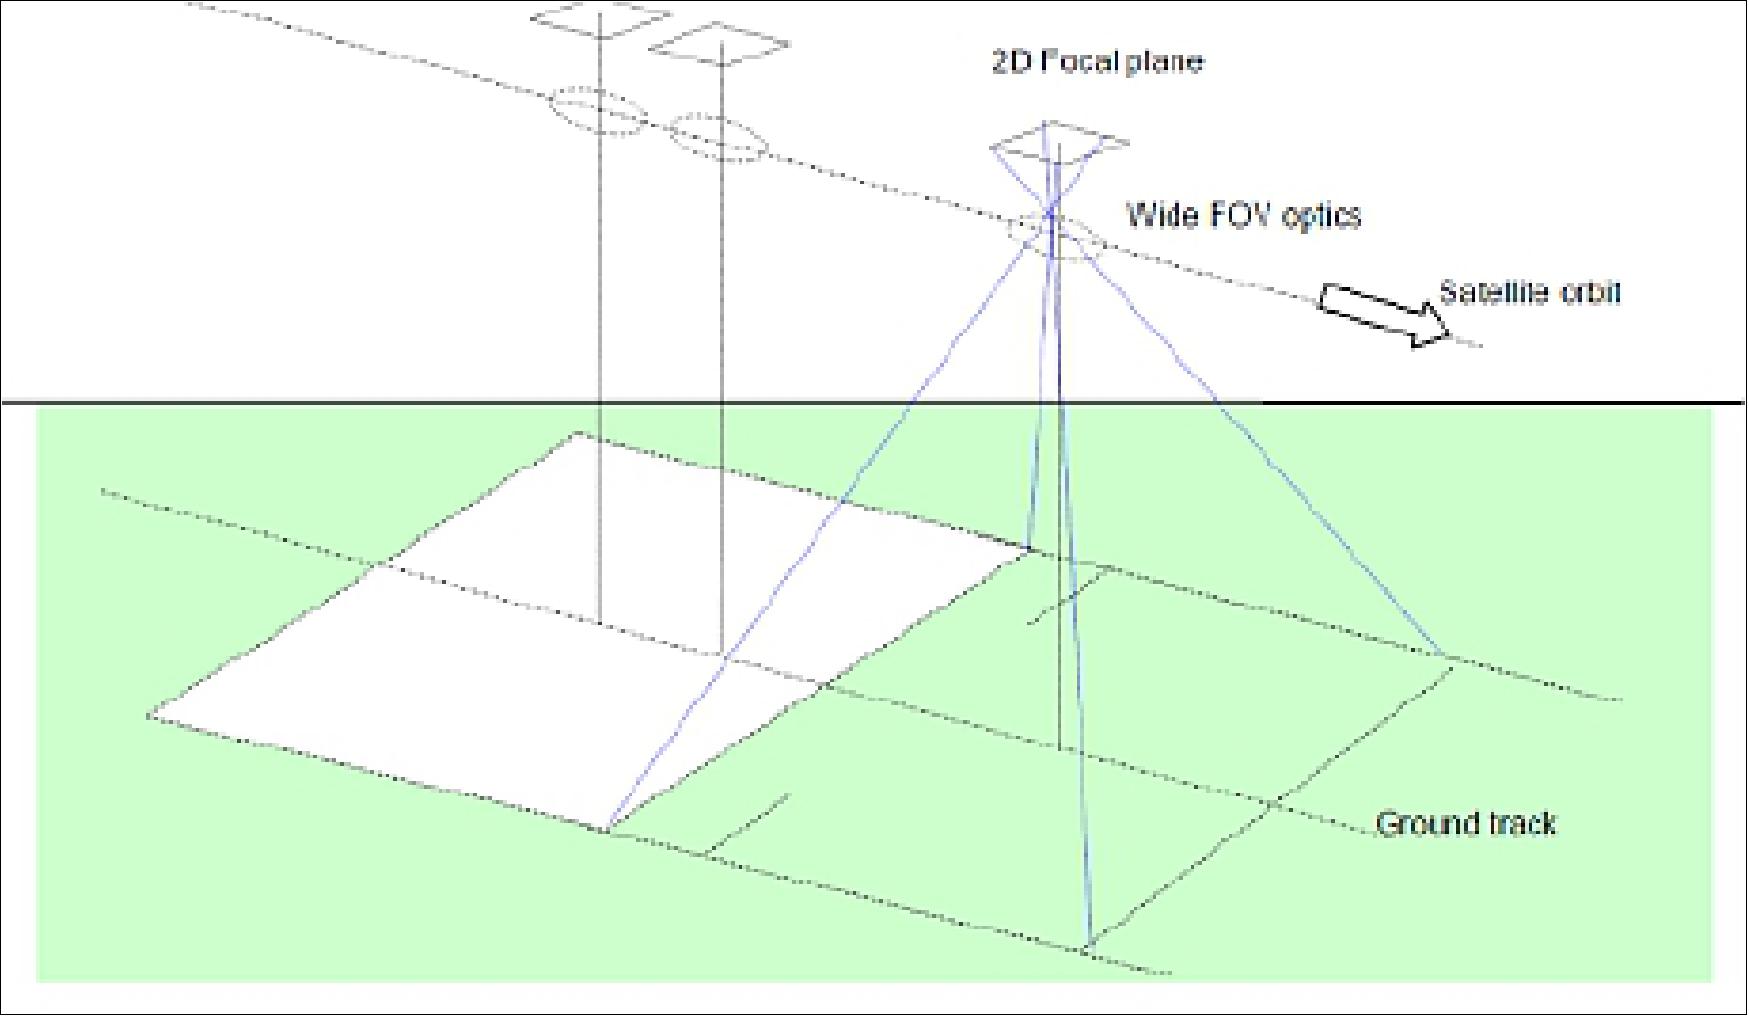
Successive acquisitions of polarized and un-polarized spectral bands are performed using a rotating FWS (Filter Wheel System) located in front of the focal plane that enables to change the polarizing filters (Figure 42).
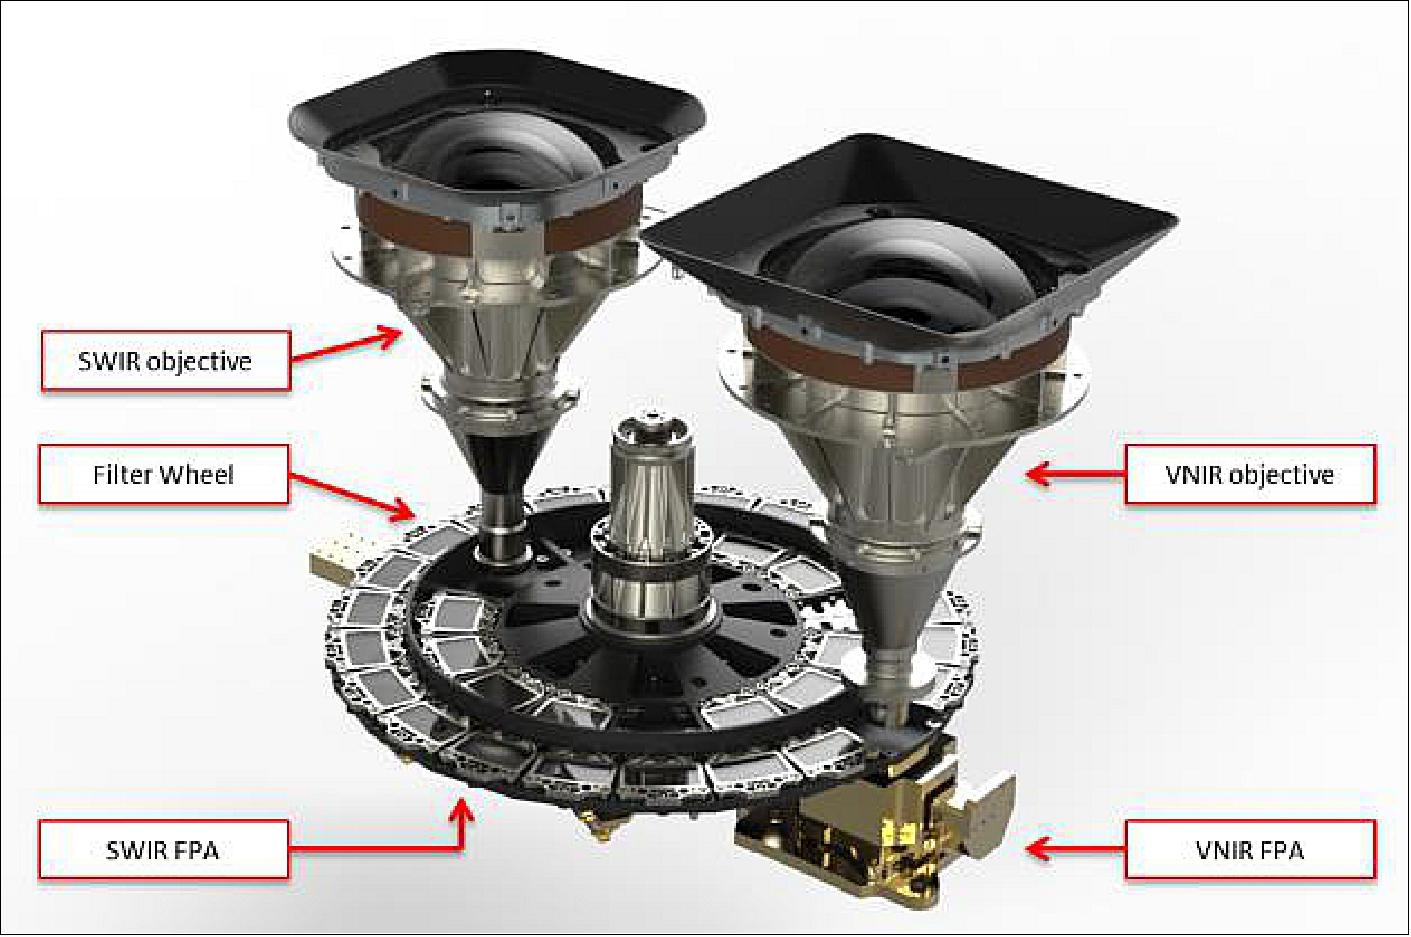
3MI provides wavelength coverage in the VNIR and in the SWIR bands. The instrument consists mainly of two electrooptical imagers: a VNIR optical assembly and a SWIR optical assembly which are integrated with their respective Focal Plane Arrays with interposed a rotating Filter Wheel featuring 2 rings of filters one for each band. These are mounted onto mechanical support structures that are thermally monitored and controlled. Embedded flight software is envisioned to control the instrument ensuring synchronous operations of FWS and FPA and instrument thermal stabilization by the TCS (Thermal Control System).
The instrument requirements reported in Table 15 and Table 16 are very challenging and they define, together with the baseline measurement concept, the main drivers for the 3MI design.
Parameter | Requirement |
Swath width | > 2200 km |
SSD (Spatial Sampling Distance) | > 4 km |
Instrument FOV VNIR | ACT (Across Track): -50.152º to +50.152º |
Instrument FOV SWIR | ACT: -49.592º to +49.592º |
Multi-view per target | VNIR: 14 OZA (Observation Zenith Angle) views |
OZA sampling range | VNIR: 110º |
In-flight calibration | Vicarious (by EUMETSAT) |
Channel | Central wavelength (nm) | Bandwidth (nm) | Polarized |
3MI-2 | 410 | 20 | Y |
3MI is composed of 2 main units, the OMU ( Opto Mechanical Unit) located on the nadir panel of MetOp SG-A and the ICU (Instrument Control Unit) located in the satellite Payload Bay, the interconnections between the 2 units are routed inside the satellite structure (Figure 43).
The OMU is composed of the following main subsystems:
• Two Optical Heads: one for VNIR channels (0.41 to 0.91 µm) and one for SWIR channels (0.91 to 2.13 µm), each of them including a 100.3° FOV dioptric telescope, an entrance Sun shield and a supporting structure, have been designed to collect global observations of polarized and directional solar radiation reflected by the Earth-atmosphere system in the requested spectral bands.
• FWS (Filter Wheel System): it includes a motor and a filter disk rotating at constant speed accommodating two filter rings; the external ring presents 22 positions (21 VNIR filters/polarizers and 1 shutter) while the internal ring presents 11 positions (10 SWIR filters/polarizers and 1 shutter). A FWC (Filter Wheel Control) unit drives the motor and manages the rotation receiving the synchronism from the ICU.
• VNIR SubSystem (VNIR S/S): it receives light from the VNIR Optical head, converts it into digital data and transmits them to the ICU. The VNIR S/S includes a FPA (Focal Plane Array ), featuring a 512 x 512 pixel Semi-Custom CCD E2V detector with 26 µm pitch optimized to the broadband VNIR, and a FEE (Front End Electronics) in charge of driving and reading the detector outputs.
• VNIR SubSystem (VNIR S/S): it receives light from the VNIR Optical head, converts it into digital data and transmits them to the ICU. The VNIR S/S includes a FPA, featuring a 512 x 512 pixel Semi-Custom CCD E2V detector with 26 µm pitch optimized to the broadband VNIR, and a FEE in charge of driving and reading the detector outputs.
• Structural hardware: designed to guarantee the mechanical stability required by instrument optical and pointing performances.
• Thermal Hardware: designed to guarantee the thermal control and stability of the OMU subsystems, it is composed of: one cold direct-condensing radiator connected to the SWIR detector package by means of a heat pipe, to ensure the passive cooling of the SWIR detector at 185 K; one additional patch radiator to cool the VNIR detector at -15°C by means of a thermal strap and TEC (Thermo-Electric Cooler) integrated in the detector package; three additional patch radiators to cool, by means of one thermal strap each, the FEEs, the Optical Bench and the FWC within their operational temperature limits; MLI blankets to wrap the instrument, except for the radiators and the optical apertures.
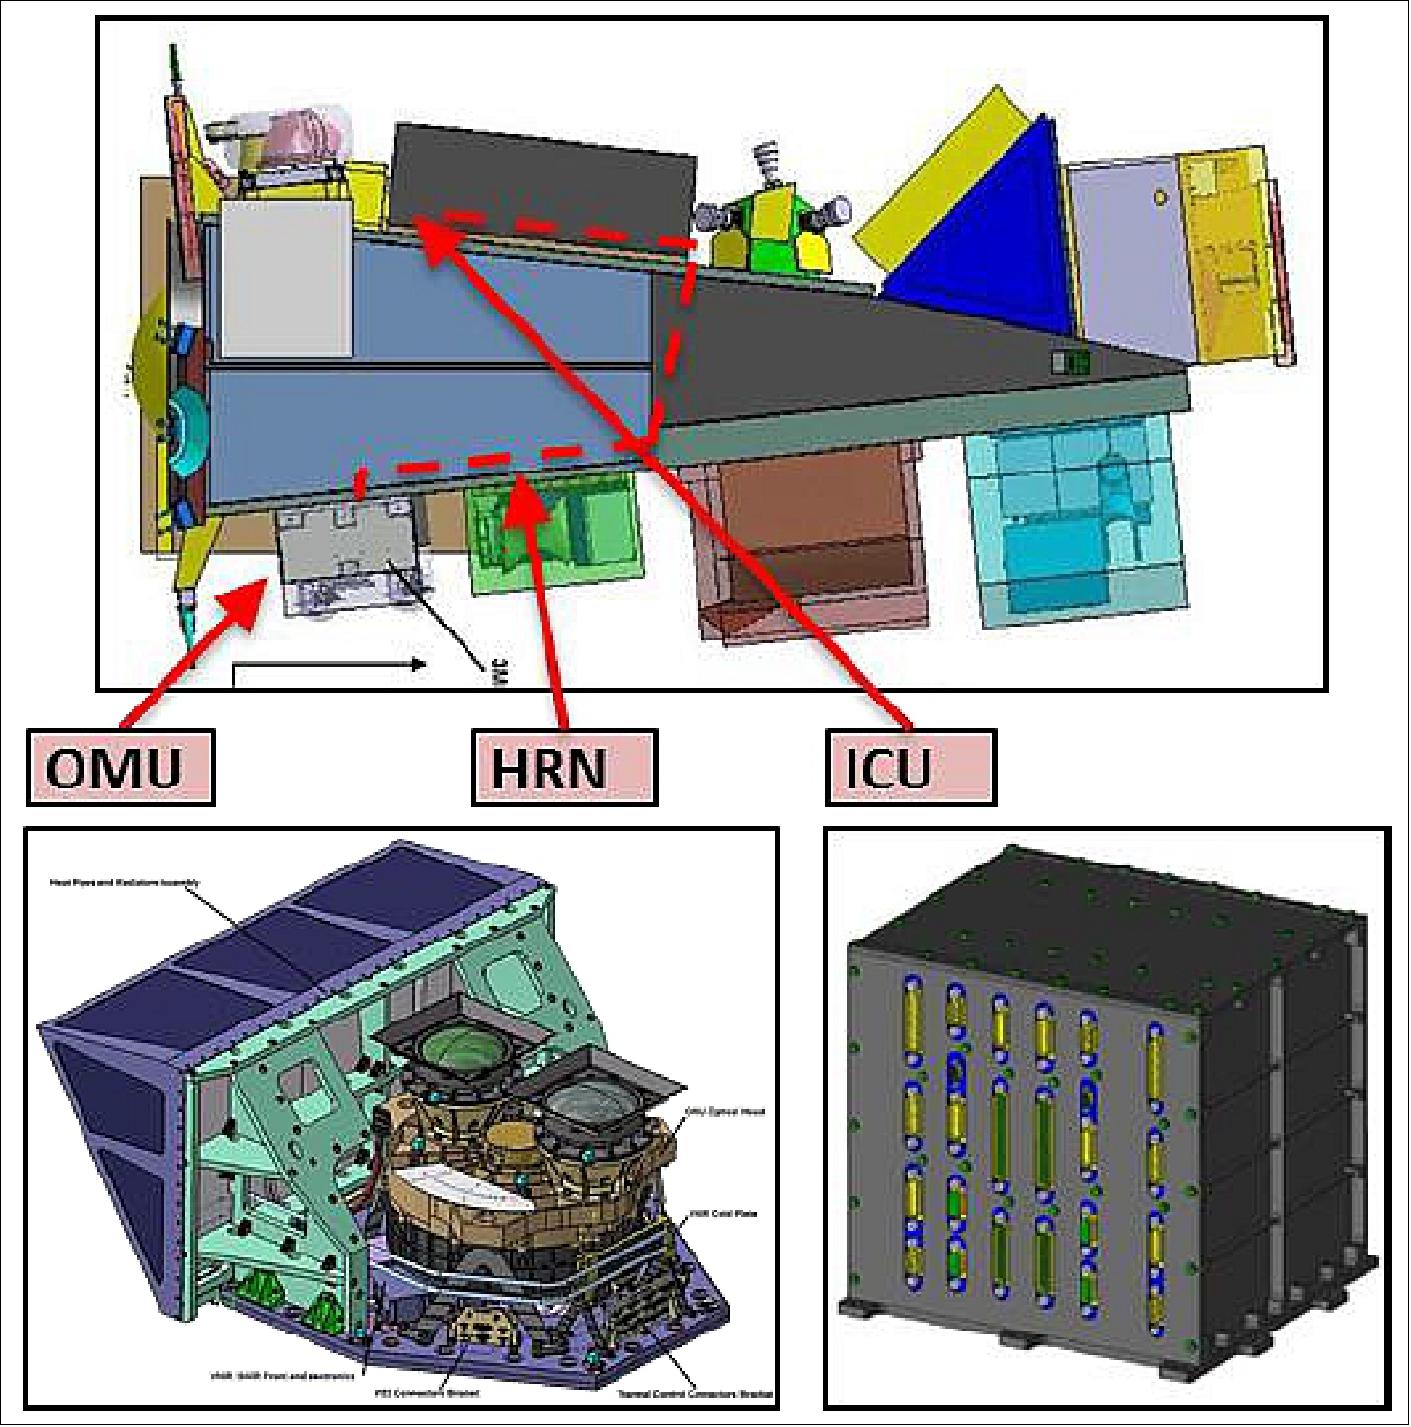
Parameter | Requirement |
Envelope (mm) | OMU: 970 x 1088 x 514, ICU: 250 x 240 x 245 |
Mass (kg) no margins | OMU: 72.6, ICU: 6.8, Harness: 11.3 |
Power (W) no margins | Operational mode: 75.1, Safe mode: 45.2 |
Data rate (Mbit/s) | Day: 7.5 (average.), 9.5 (peak), Night: 0.12 (average) |
Optical design: VNIR and SWIR objectives are designed to provide wide angle FOV unvignetted images: ±57º for VNIR and ±53.5º for SWIR. Material selection has been optimized in order to have freedom of longitudinal chromatic aberration images in the waveband 400-920 nm for VNIR and 900-2150 nm for SWIR. Both objectives are telecentric in image space over the whole FOV. The main design drivers for VNIR and SWIR objectives are:
- throughput uniformity control up to 50° FOV
- distortion and spectral uniformity of distortion
- polarization sensitivity performance
- minimization of stray-light (ghosts).
The design concept is schematically described in Figure 44 and it is based on a Galilean Telescope coupled to a Focalizer group. The aperture stop, placed in between, is located in such a way that the system is telecentric in image space. The system exhibits a fine control of the entrance pupil size as a function of the FOV, low distortion and correction of lateral chromatic aberration.
Polarization related performances are achieved by low polarization sensitivity and low retardance anti-reflection coatings, as well as by a proper selection of glass material properties.
Parameter | Requirement |
Focal length (mm) | VNIR: 5.52±0.05, SWIR: 6.37±0.06 |
On axis F-number | 4.2 |
FOV (unvignetted) | VNIR:±57º, SWIR: ±53.3º |
Exit pupil position | Telecentric in image space |
Telecentricity error | <0.3º |
Waveband (mm) | VNIR: 400 to 920, SWIR: 900 to 2150 |
Aperture stop | Circular shape, inside optical path |
Distortion | <8%, Ftan(θ) mapping law |
Distortion sign | Negative for FoV>50.152º |
Distortion spectral uniformity | <5% (VNIR, SWIR) |
Optical quality | Transmittance WFE <140 nm rms |
Beam deviation | Each channel w.r.t. average position <3 µm |
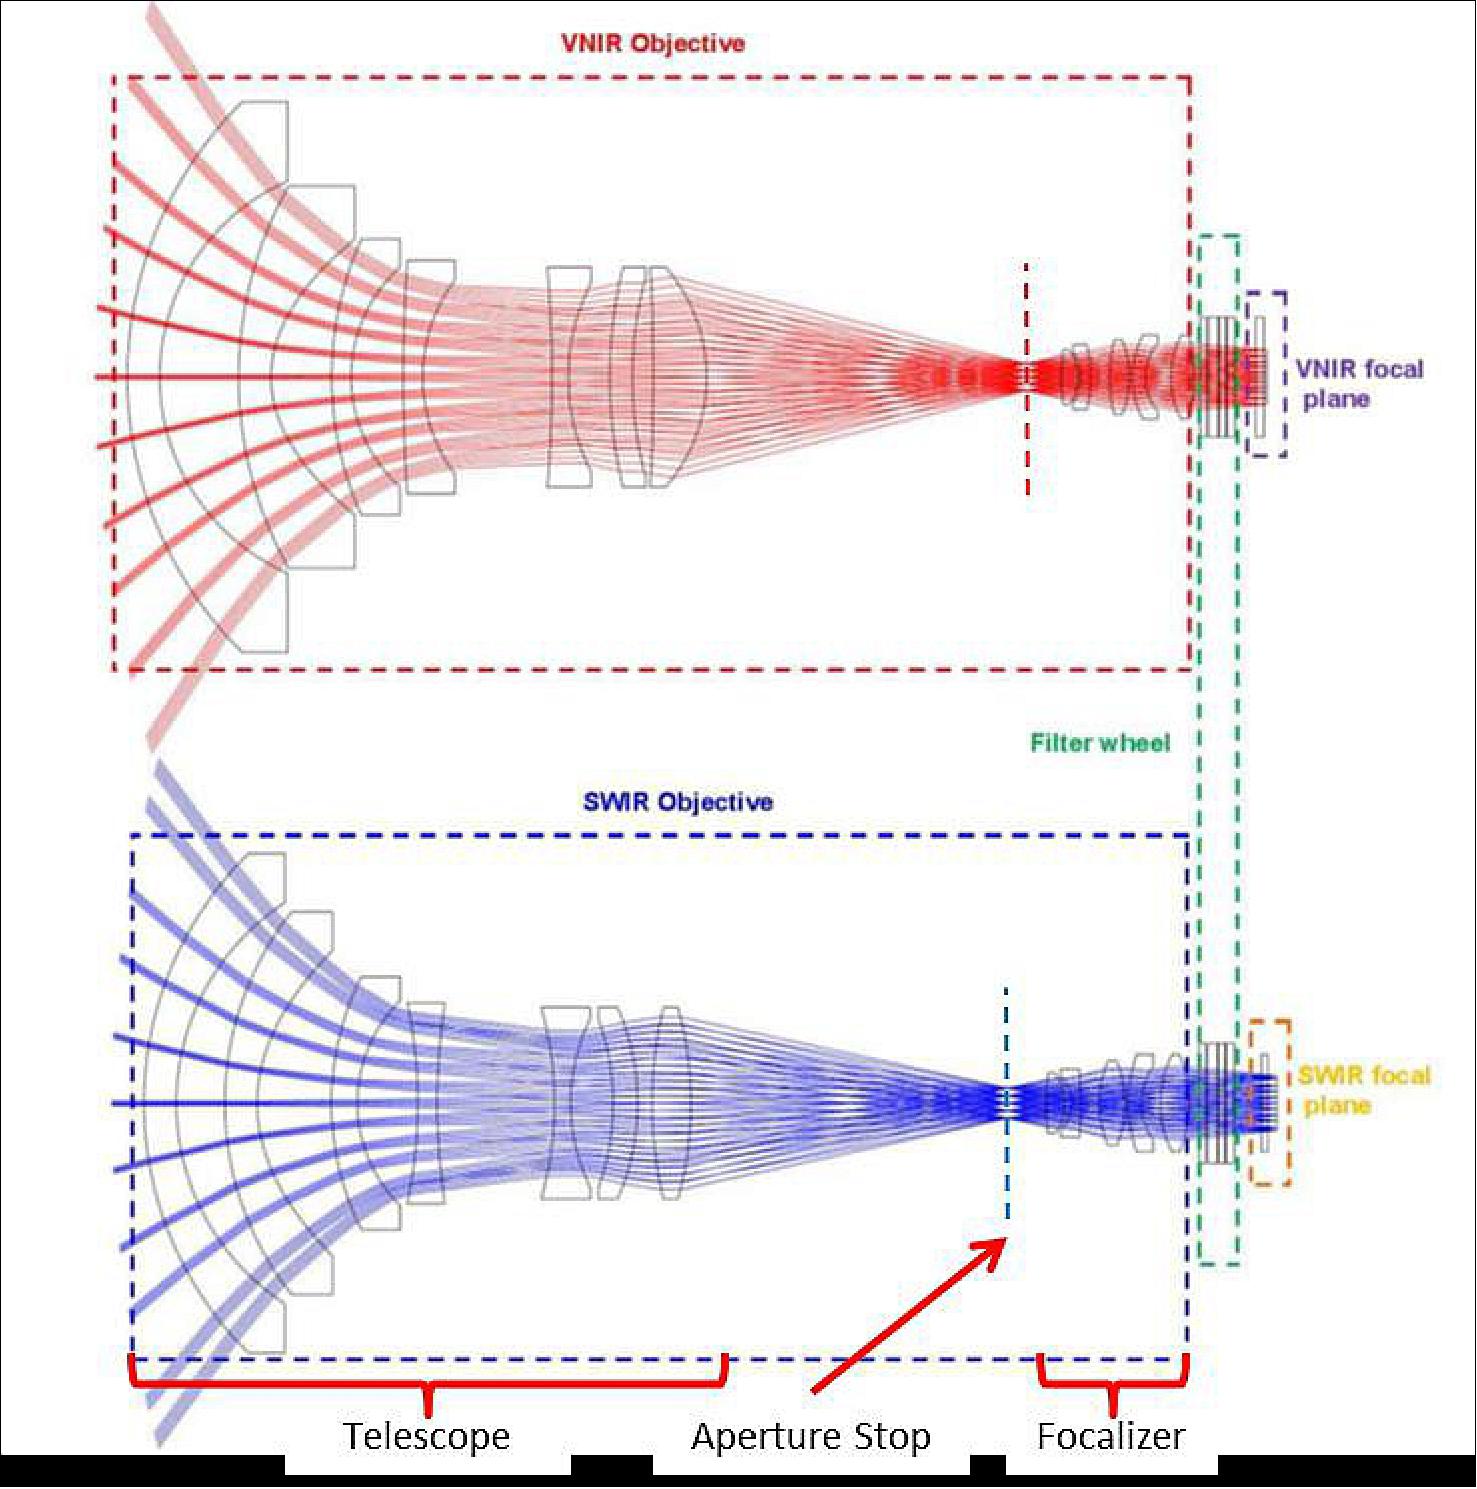
The band and polarization state selection is performed by the FWS, each slot of the VNIR and SWIR rings accommodates a filter stack composed of the following items:
• OPC (Optical Path Compensator): needed to recover the optical path length difference, and consequent defocusing, between each spectral channel, introduced by the other components of the stack
• BP (Band Pass) filter: its design is mainly driven by the spectral template requirement together with the constraints related to stray-light minimization in particular the in-band reflectance and out of band integrated signal
• POL (Linear Polarizer) for polarized channels (substituted by optical path compensator for non-polarized channels): it allows the selection of the polarization direction to be analyzed (-60°, 0° and +60°), the contrast ratio, angular tolerance and knowledge among the three polarization direction are key drivers for POL selection and mechanical accommodation
• ND (Neutral Density) filter: needed to adjust the transmission of each spectral channel, it is also beneficial for stray-light reduction being able to provide shielding of VNIR/SWIR objective elements from the reflection coming from the VNIR/SWIR focal plane.
The optical design and performances have been fully demonstrated for the VNIR objective (and by similarity for the SWIR) in the frame of the OPD (Optics Pre-Development) activity in which an Elegant Breadboard of the 3MI VNIR lens (representative in terms of form, function and performance) was foreseen as a de-risking activity for the instrument development.
Thermo-mechanical design: The 3MI instrument (Figure 45) is assembled on a unique baseplate designed to be connected directly with the satellite panel. To this aim the baseplate is made of a sandwich CFRP structure, with an aluminum honeycomb core, mainly for stiffness and mass constraints, and to match with the mounting surface of the satellite panel, limiting the thermo-elastic stresses and distortions.
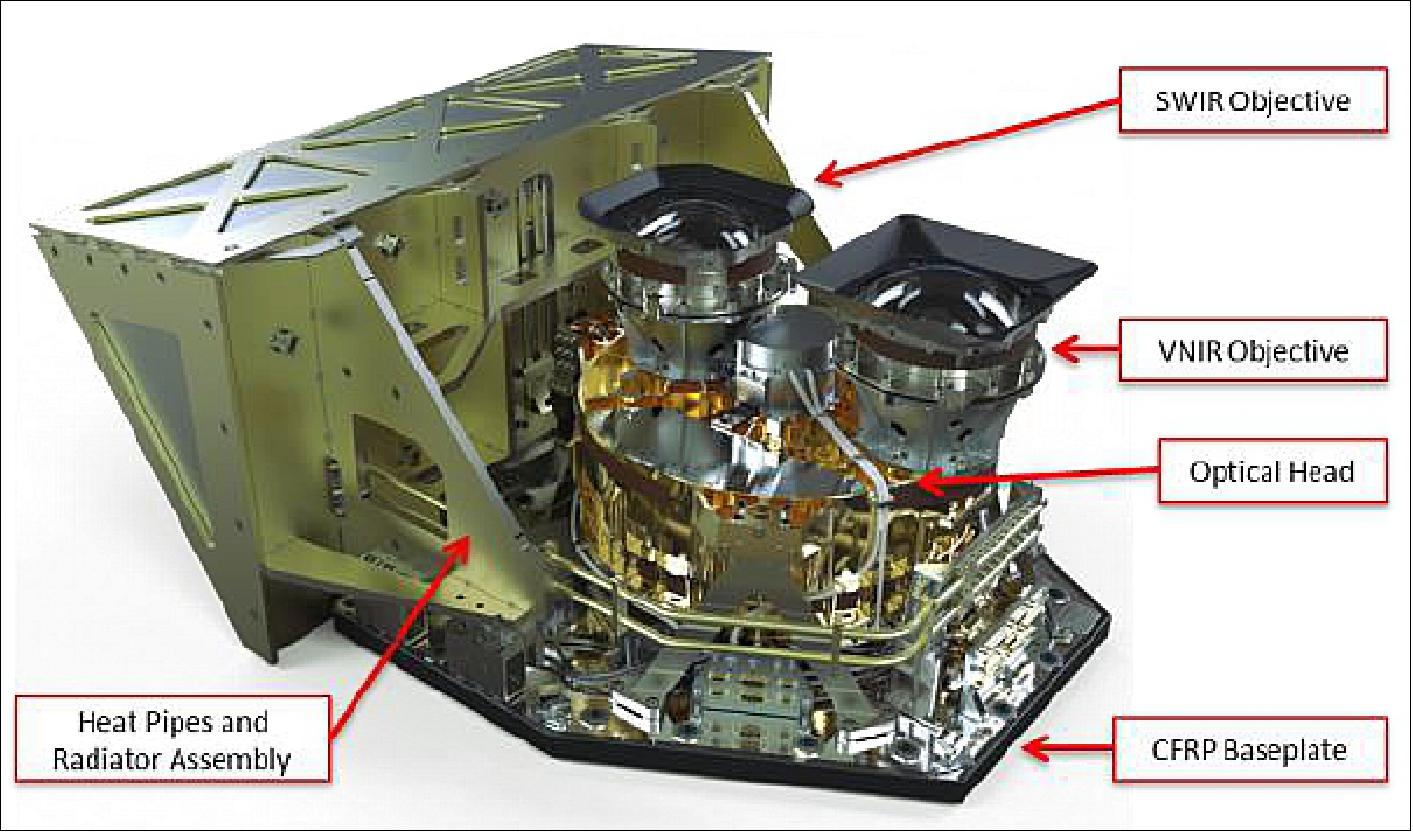
The CFRP (Carbon Fiber Reinforced Polymer) baseplate supports the following items: OMU Optical Head; HPRA (Heat Pipes and Radiators Assembly); VNIR and SWIR FEEs and their cold plate; FWC (Filter Wheel Controller); VNIR Cold Plate; Connectors Brackets.
The OMU Optical Head (Figure 46) supports all the optical elements of the instrument and is isostatically mounted on the CFRP baseplate. Isostatic mounting is achieved by means of three titanium flexible bipods. This is a well proven configuration that is adopted when the position accuracy of the optical elements has to be guaranteed maintaining the structural strength.
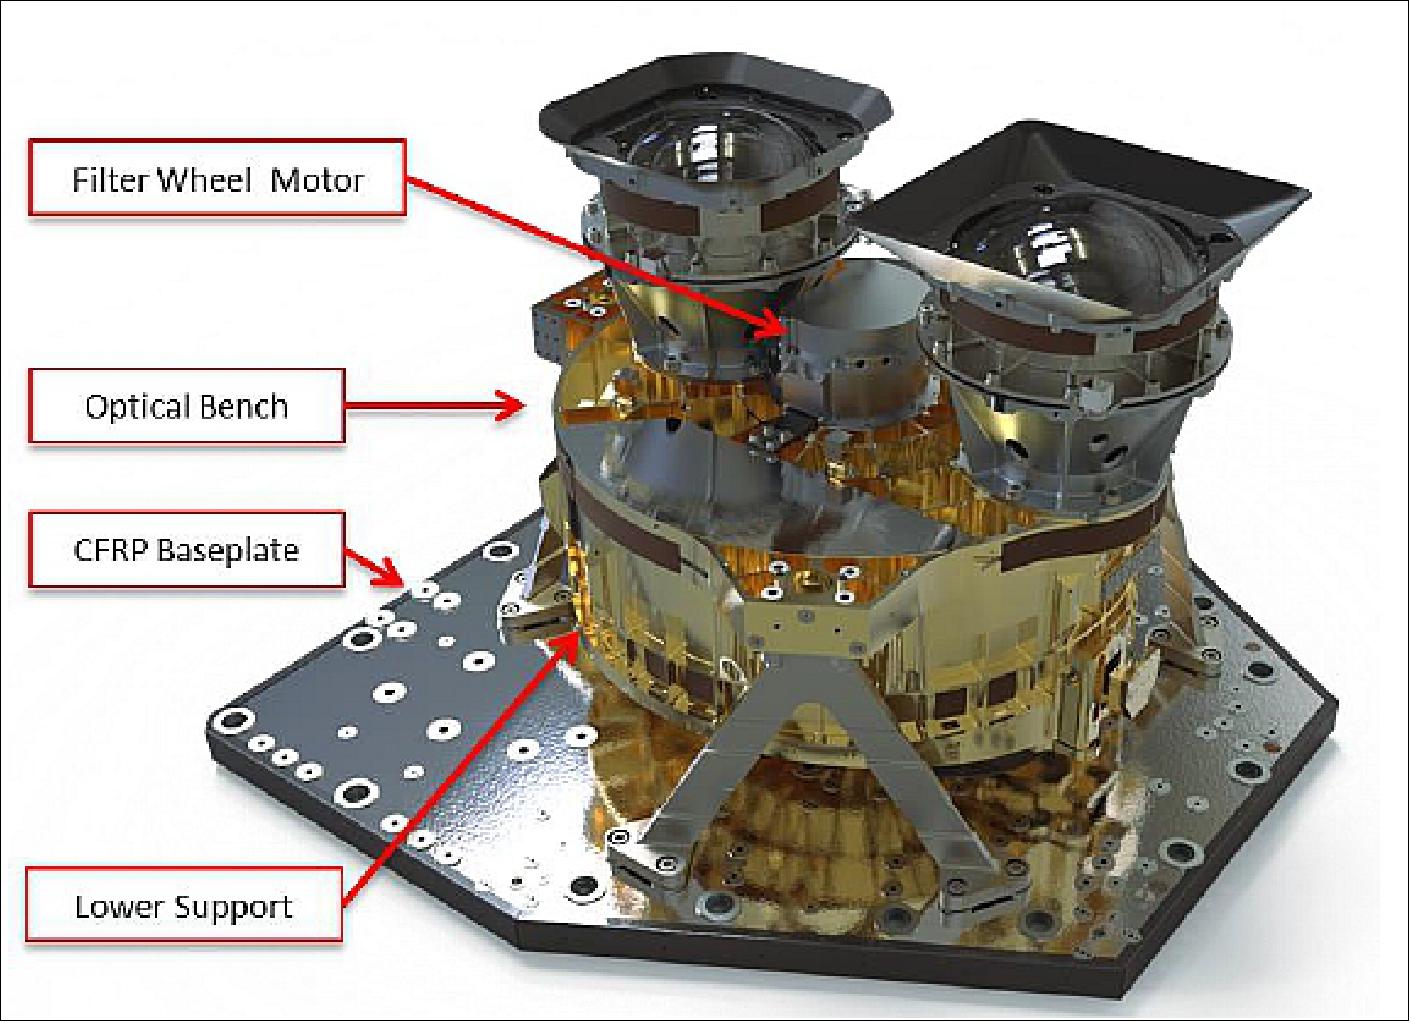
The bipod design guarantees the necessary stiffness to achieve suitable first eigenfrequency of the suspended mass in order to avoid coupled modes with satellite structure. At the same time the bipods allow different thermal elongation between the Optical Bench and the CFRP baseplate thus limiting the thermo-elastic stress and the consequent distortion that could affect the pointing stability of the optical system.
The Optical Bench is the interface for bipods, Lower Support and Filters Wheel Assembly, it supports the SWIR and VNIR Objectives by means of dedicated barrel supports, providing the necessary pointing accuracy and stability during the different operating condition. The baseline material, selected for Optical Bench, Lower Support and SWIR and VNIR Objectives Barrel Supports is aluminum that represents the best compromise thanks to its mechanical and thermal features.
The Lower Support is provided with two apertures suitable to allow the mounting of both FPAs. Proper positioning of each part to ensure the alignment between the objectives and the related Focal Plane is achieved by means of precise mechanical references on the interface planes.
The main structural part of the SWIR and VNIR FPA is the DSA (Detector Support Assembly), which is needed to support the unit with the required precision and stability with respect to the mechanical interfaces. In detail, the 2 FPAs are composed of the following main items/subassemblies: VNIR and SWIR detectors; DSA to support and guarantee the needed working conditions; temperature sensors with wires; flex ribbon cable to connect the VNIR and SWIR detector to the relevant FEE; thermal strap to thermally link the FPA with its radiator/cold plate.
The FWA (Filter Wheel Assembly) is directly attached to the Optical Bench which, together with the Lower Support, defines a closed volume surrounding the Filter Wheel disk and FPA where temperature control of the Filter Stack is achieved to guarantee the required spectral stability of the BP filters central wavelength. This configuration, where the objectives carrying the optical elements and the FPAs are not directly connected together, is due to the need to interpose the filters/polarizers in the optical path between the last lens and the FPA detector. Such mechanical architecture requires a high precision and stable mechanical design and construction of the whole assembly in order to maintain the relative alignment of the FPAs and the objective.
The VNIR and SWIR objective assemblies are manly composed by the following mechanical parts: external baffle; Telescope main body and lenses with their holders; Focalizer lenses with their holders. Further to the selection of the material to be used for the optical elements, defined in the frame of optical design, all other materials have been selected taking into account their adequacy to CTE excursions to minimize the thermo-elastic stresses. The support of the lenses into the objectives is achieved with two different kind of mounting: adhesive bonding between lenses and supports; pure mechanical mounting based on the use of spacers, bushes and threaded rings.
The radiators mounted on the baseplate’s side oriented toward the cold space guarantee, by means of passive cooling, the SWIR and VNIR FPA nominal operating temperatures. The VNIR FPA is thermally linked, by means of a thermal strap, to the VNIR aluminum cold pate, acting as interface for thermal straps coming from VNIR focal plane and heat pipes, fixed, on the opposite side, to the dedicated radiator. The aluminum plate is supported by one titanium support and one titanium bipod. This configuration allows to achieve the needed temperature decoupling/insulation between the aluminum plate and the CFRP base plate, limiting the parasitic heat flux coming from base plate, and, at the same time, to provide the needed mechanical strength to support the aluminum plate.
The HPRA is composed of 5 separate radiators, working at different temperature according to the different operational and non-operational range of the unit they serve, namely: SWIR detector; VNIR detector; SWIR and VNIR FEE; FWC; Optical Bench and Filter Wheel Mechanism Assembly. The radiators are made from aluminum plates and have machined stiffeners on the internal side which will provide the necessary rigidity and the interface area to screw them to the supporting structure and heat pipes. The radiator array, together with the thermal Earth shield, is supported by dedicated honeycomb structure capable to guarantee the necessary thermal insulation and structural stability.
The TCS (Thermal Control System), composed of operational heaters and thermistors distributed on the structure of the Optical Bench, Lower Support and Optical Barrels, guarantee a stabilized thermal radiative environment for the filter wheel and for the optical elements, within the prescribed operational range. The temperature of the filter wheel is controlled through its radiant heat coupling with the internal Optical Bench cavity. The Optical Bench acts also as a conductive sink for the internal power dissipation of the Filter Wheel Mechanism. Moreover, the closed cavity made by the coupling of the Optical Bench and Lower Support provides protection against contamination of the sensitive optical elements.
All OMU external surfaces directly exposed to space environment at exclusion of the radiative surfaces, the two external lenses and the baffle internal side are covered with the black kapton MLI (Multi-Layered Insulation).
Electrical design: The 3MI electrical block diagram is shown in Figure 47 and includes: ICU, FWC, VNIR and SWIR FEE, VNIR and SWIR detectors, operational and non-operational TCS.
The ICU is the main electronic unit and implements the following functions: platform communication for instrument TM/TC and mission data transmission; provision of HW resources for application SW execution; generation of the secondary power supply towards FEE; provision of SpaceWire links towards platform and internal subsystems; FEE, FWS and TCS command, control and housekeeping (HK) acquisition; instrument FDIR (Failure Detection Isolation and Recovery); video data reception, processing and data rate control; synchronism signal generation; thermal control.
The FWC is the electronic board in charge of the control of the filter wheel disk acceleration, velocity and position through cascaded position – speed – current control loop, synchronized to ICU timing signals. Main functions of FWC are: monitoring and control of the FWS; generation of FWS internal secondary voltages; generation of HK and TM. The FWC is powered directly by the platform via dedicated primary lines, so that it can be powered at launch when the ICU is OFF, this allows for active locking of the mechanism during launch in order to prevent damages due to the relevant mechanical environment.
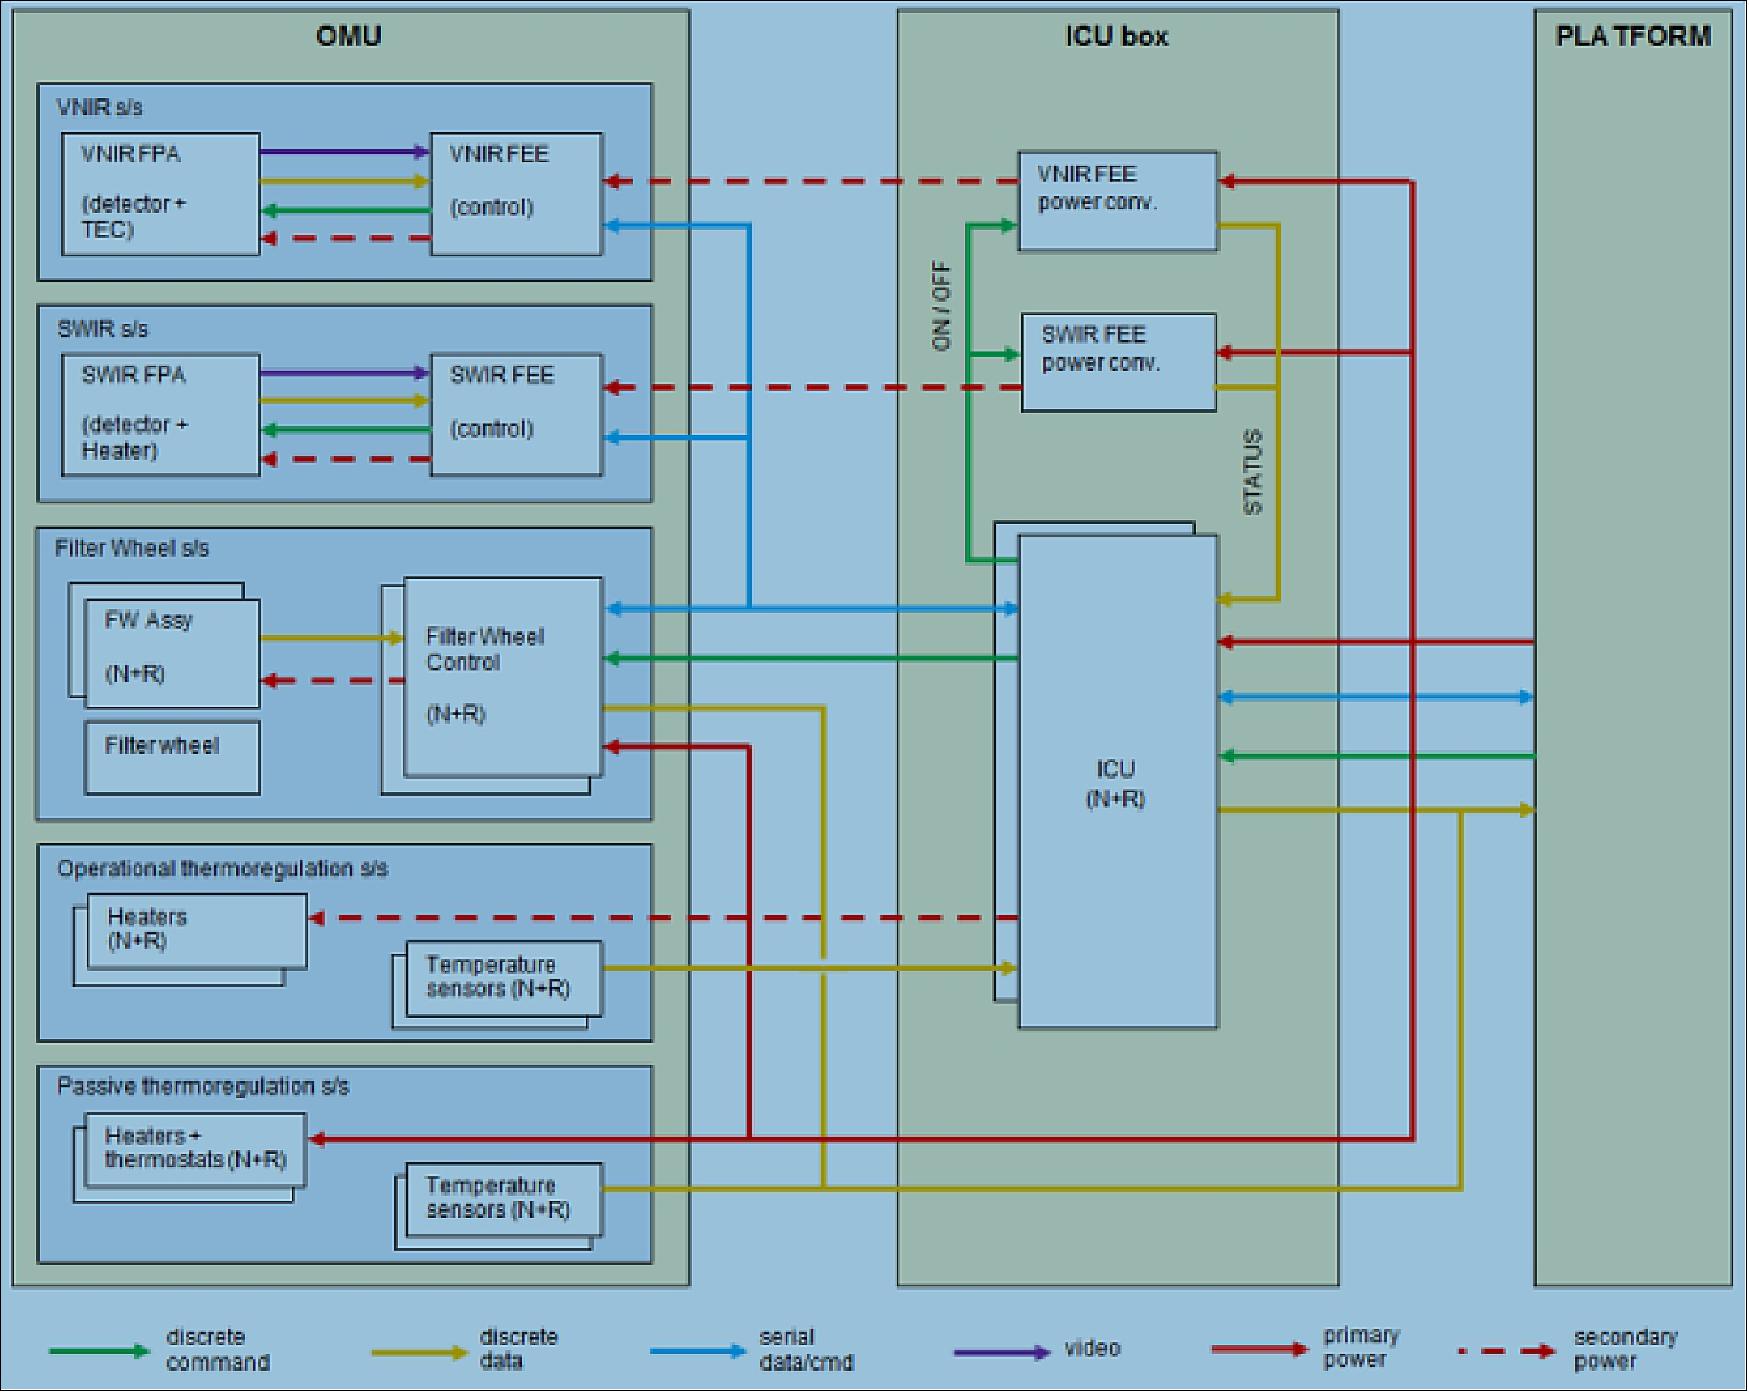
The VNIR and SWIR FEEs provide interfaces between the detectors and both nominal and the redundant ICU. The TM/TC and digitized video data are managed through a SpaceWire interface. The main functions of the two FEEs are: power supply filtering and regulation; detector biases conditioning and filtering; clock generation; sequencing, video processing and ADC conversion; detector temperature control and stabilization; telemetry signals acquisition; scientific data interface. The main performances of the two FEEs are reported in the following Table 19 and Table 20.
Parameter | Requirement |
Noise in darkness | < 2 LSB (Least Significant Bit) |
Linearity | < 1% |
SNR (Signal to Noise Ratio) | > 560 (@ 50% dynamic) |
Transfer function | > 2.74 x 10⁴ DN µm/W |
Cross-talk | <0.6% |
Parameter | Requirement |
Noise in darkness | < 3 LSB (Least Significant Bit) |
Linearity | < 1% |
SNR (Signal to Noise Ratio) | > 750 (@ 50% dynamic) |
Transfer function | > 4.8 x 10³ DN µm/W |
The VNIR detector is manufactured by e2v (UK). The CCD is composed by a matrix of 512 x 512 sensitive pixels with 26 µm square size. The CCD is back-side illuminated with an epitaxial layer close to 40 µm to enhance, respectively, the quantum efficiency and the response in the near-infrared region. The detector is of the frame transfer format type with split horizontal registers and two output ports. It is designed for Non Inverted Mode Operation to withstand full well capacity of 1.1 M eV and reduce smearing by fast vertical shifting. The image and memory section is arranged for 4-phase operation. The image pixel includes shielded anti-blooming drain. The horizontal register is 3-phase and includes gate controlled dump capability for fast cleaning. The case includes a 2-stage thermoelectric cooler and is made of low thermal expansion kovar, forming with the bonded window hermetic enclosure filled with Krypton gas.
The SWIR detector is manufactured by Sofradir (France). It is a matrix of 500 x 256 MCT (Mercury Cadmium Telluride) diodes hybridized to a companion ROIC (Read-Out Integrated Circuit) through indium bumps. The MCT material is optimized in order to have a cut-off wavelength large enough to comply with the longest 3MI band, but with the dark current sufficiently low to satisfy the challenging requirement of the instrument radiometric accuracy and stability. The detector is back-side illuminated. The photo-generated current is converted into voltage with an amplifier in each level and transferred to the edge of the array by switches, column amplifier and output buffer. The CTIA (Capacitive Trans-Impedance Amplifier) ROIC input stage is used for charge to voltage conversion and integration due to its properties of low noise, large bandwidth and excellent charge injection in small to moderate photon flux applications like 3MI. The case is made of low thermal expansion kovar, forming with the bonded window hermetic enclosure filled with He gas.
Parameter | VNIR | SWIR |
Format | 512 x 512 | 500 x 256 |
Pixel size (µm) | 26 x 26 | 30 x 30 |
Pixel pitch (µm) | 26 | 30 |
Operative temperature | -15ºC | 185 K |
Pixel frequency (kHz) | 2 x 1500 | 2 x 800 |
Global QE | 49 to 72% | > 73% |
PRNU (Pixel Response Non-Uniformity) | < 3% | < 3% |
Saturation charge (eV) | 1.1 x 10⁶ | 2.2 x 10⁶ |
Readout noise (eV) | < 20 | < 400 |
Dark current | < 6 keV/pixel | 0.08 pA/pixel |
Instrument performance: The main design drivers for the electrooptical performance is the combination of: wide field of view, that implies large angle of incidence on the lenses; polarization sensitivity and low reflectance of the coating to meet the stray-light requirement. In addition, the objective has been designed to compensate the reduction of signal due to cos θ4 law (introducing a controlled pupil aberration) and meet the SNR requirement.
The SNR performance has been evaluated (Table 22) at the reference scene radiance level (Lref) for each spectral channel from BOL (Beginning of Life) to EOL (End of Life) of the operative mission. The SNR performance is slightly higher at EOL because it is assumed that the Full Well capacity (FWc) of the detector is reached increasing the integration time, while for BOL 90% of FWc is considered to cover for uncertainties.
Channel | SNR @Lref [BOL] | SNR @Lref [EOL] | Requirement |
3MI-2 | 211 | 223 | >200 |
The polarization sensitivity performance of the instrument are calculated combining the Muller matrix element of the objective determined with Zemax, with the Muller matrix element of the filter stack optical components. Polarization sensitivity is computed with respect to the mechanical reference frame which is fixed with the baseplate of the instrument. Results are reported in Table 23 and simulation example for polarized and unpolarized channel reported in Figure 48.
Channel | Type | P.S. | Requirement |
3MI-2 | Pol | 0.945 | >0.93 |
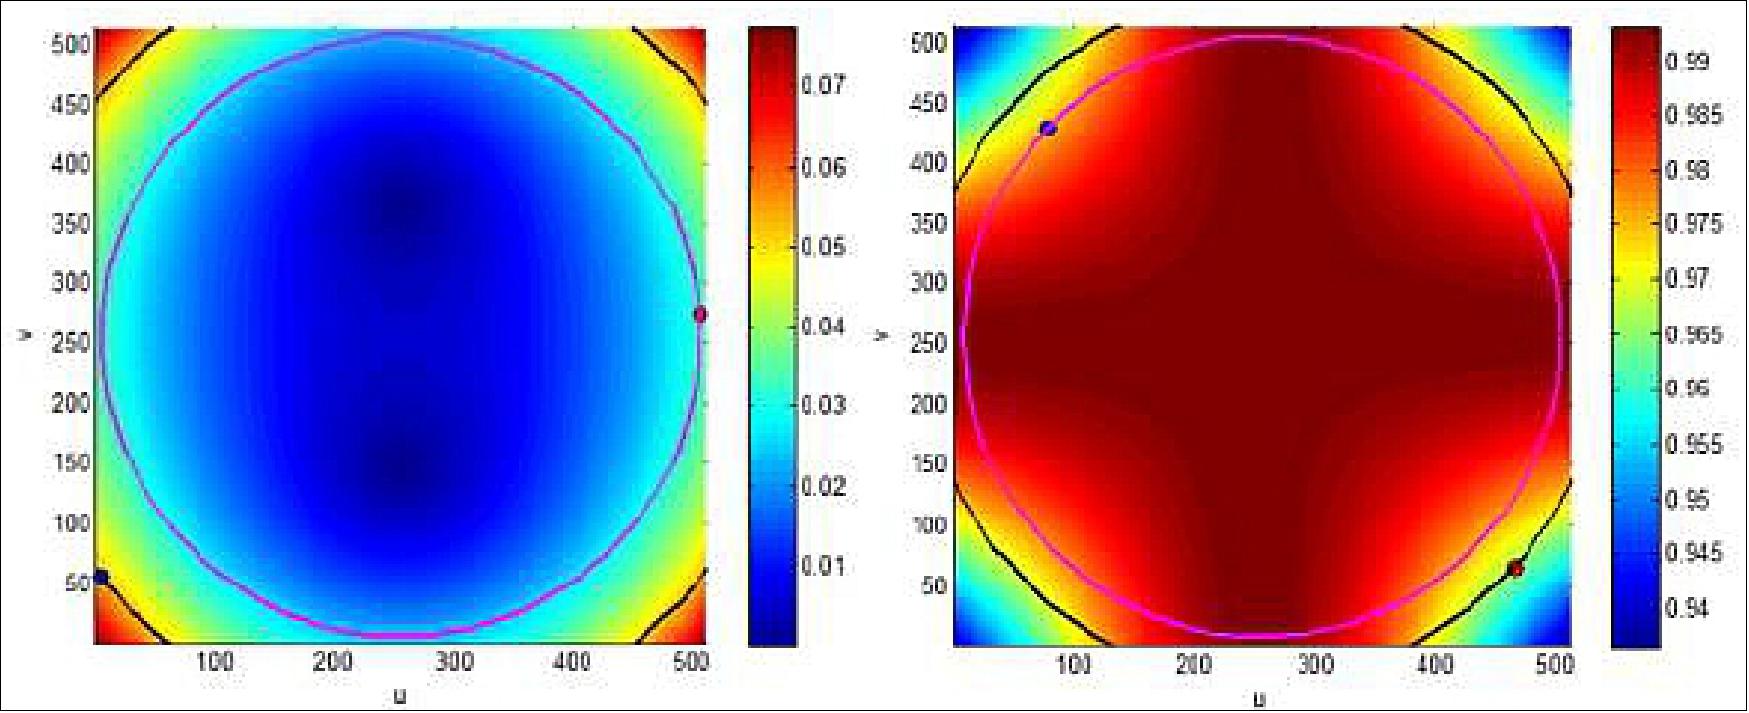
The straylight performance requirement is very demanding for 3MI because of the large FOV, it implies large AoI (Angle of Incidence ) on the coatings and, despite every coating has been optimized for each substrate and AoI range, it is not possible to have both low polarization properties and low reflectivity on the broadband wavelength anti-reflection coatings. As a consequence,the straylight is affected mainly by ghost
images which are multiple reflection among different optical surface. The straylight performance has been analyzed with ASAP and measured on OPD, an optical breadboard representative of the optical and mechanical design of the VNIR objective.
A comparison between the predicted performances and the measured ones is reported in Figure 49. The measurement characterization accuracy and resolution are very important because the straylight requirement is going to be corrected with a straylight correction algorithm currently under development. During the measurement campaign, Leonardo was able to resolve up to seven order of magnitude with respect to the primary image.
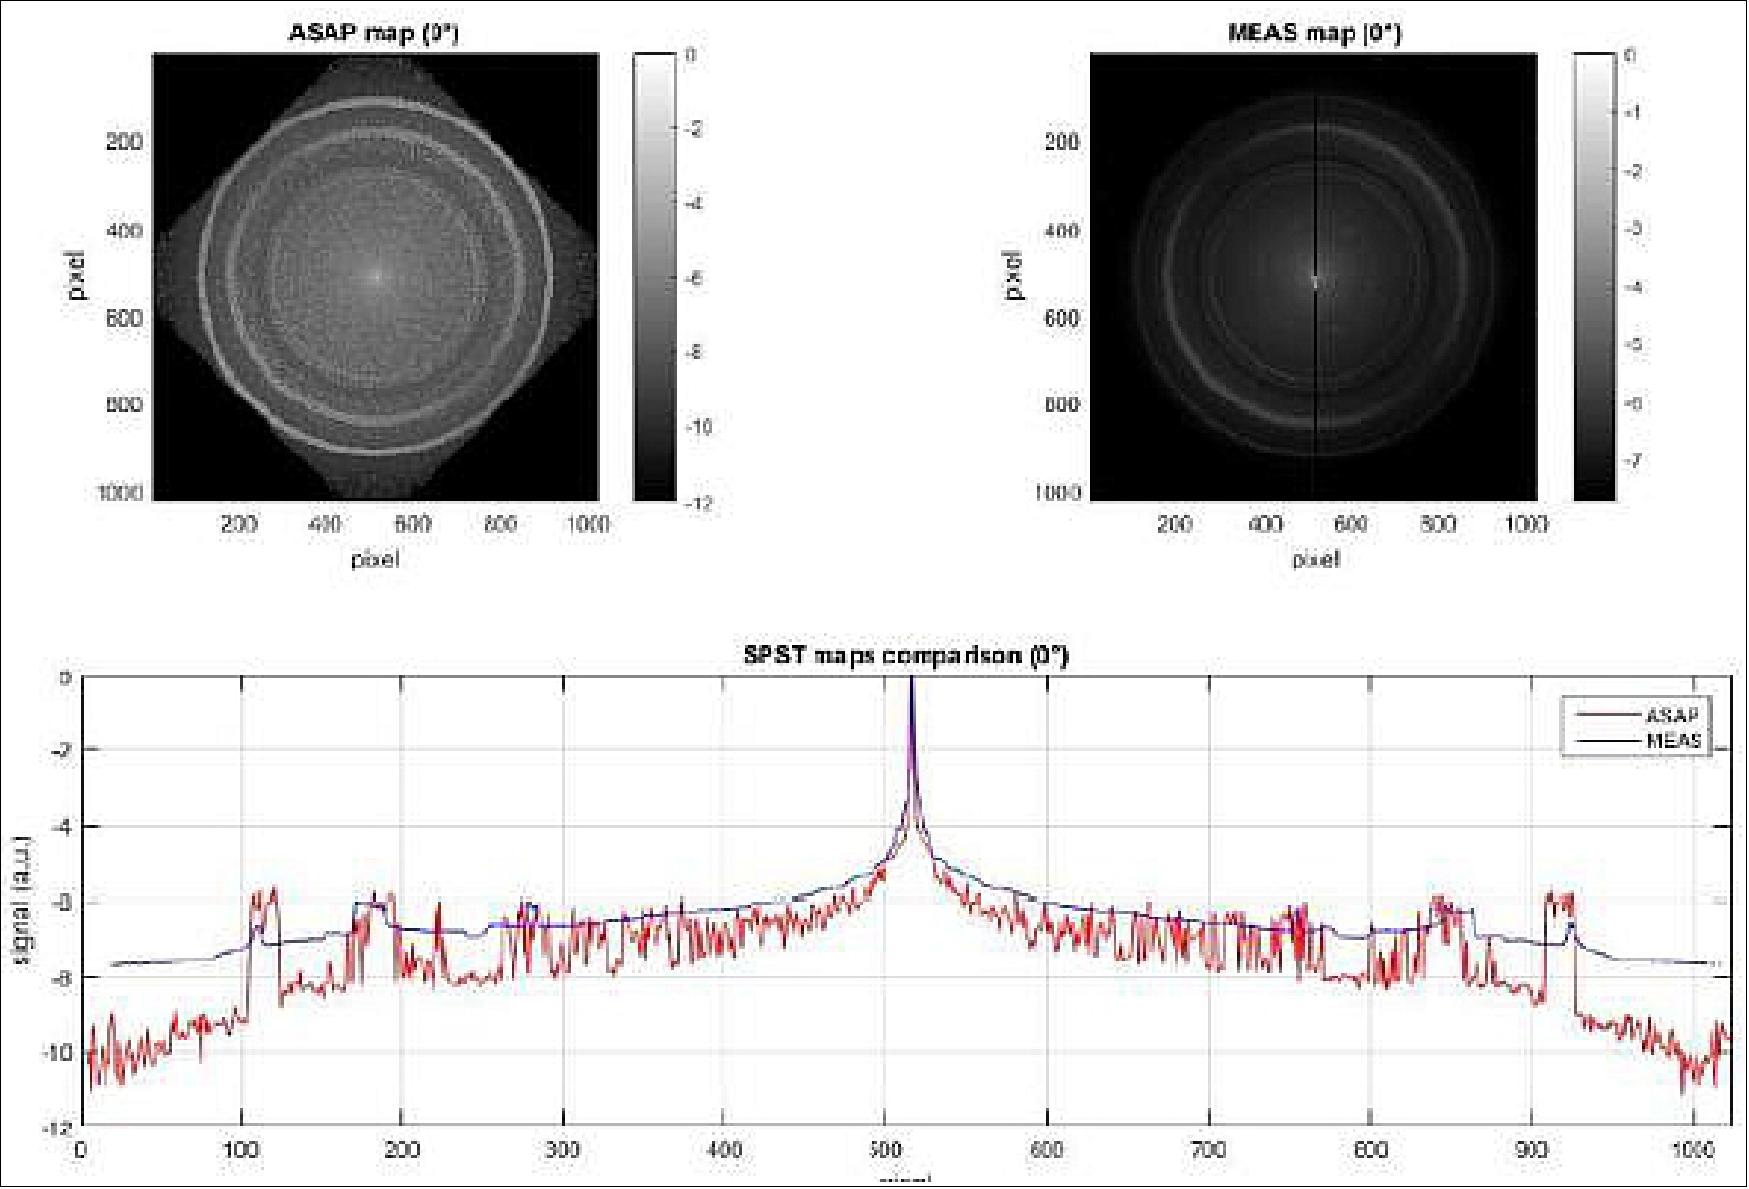
The system MTF(Modulation Transfer Function) was analyzed for all spectral channels and measured on the OPD breadboard. The analytical prediction was done considering all the possible contributors: Optical WFE (including tolerance, ground to orbit degradation and variation over the FOV leading to about 250 nm rms for VNIR and 280 nm rms for SWIR), detector MTF (including Charge Transfer Efficiency effect for CCD), FEE electronic crosstalk, satellite motion along track direction during the acquisition, instrument and S/C pointing stability. Some example of the analyzed PSF (Point Spread Function) is reported in Figure 50, where all the contributors, including the pixel spatial photo-response are considered and convolved.
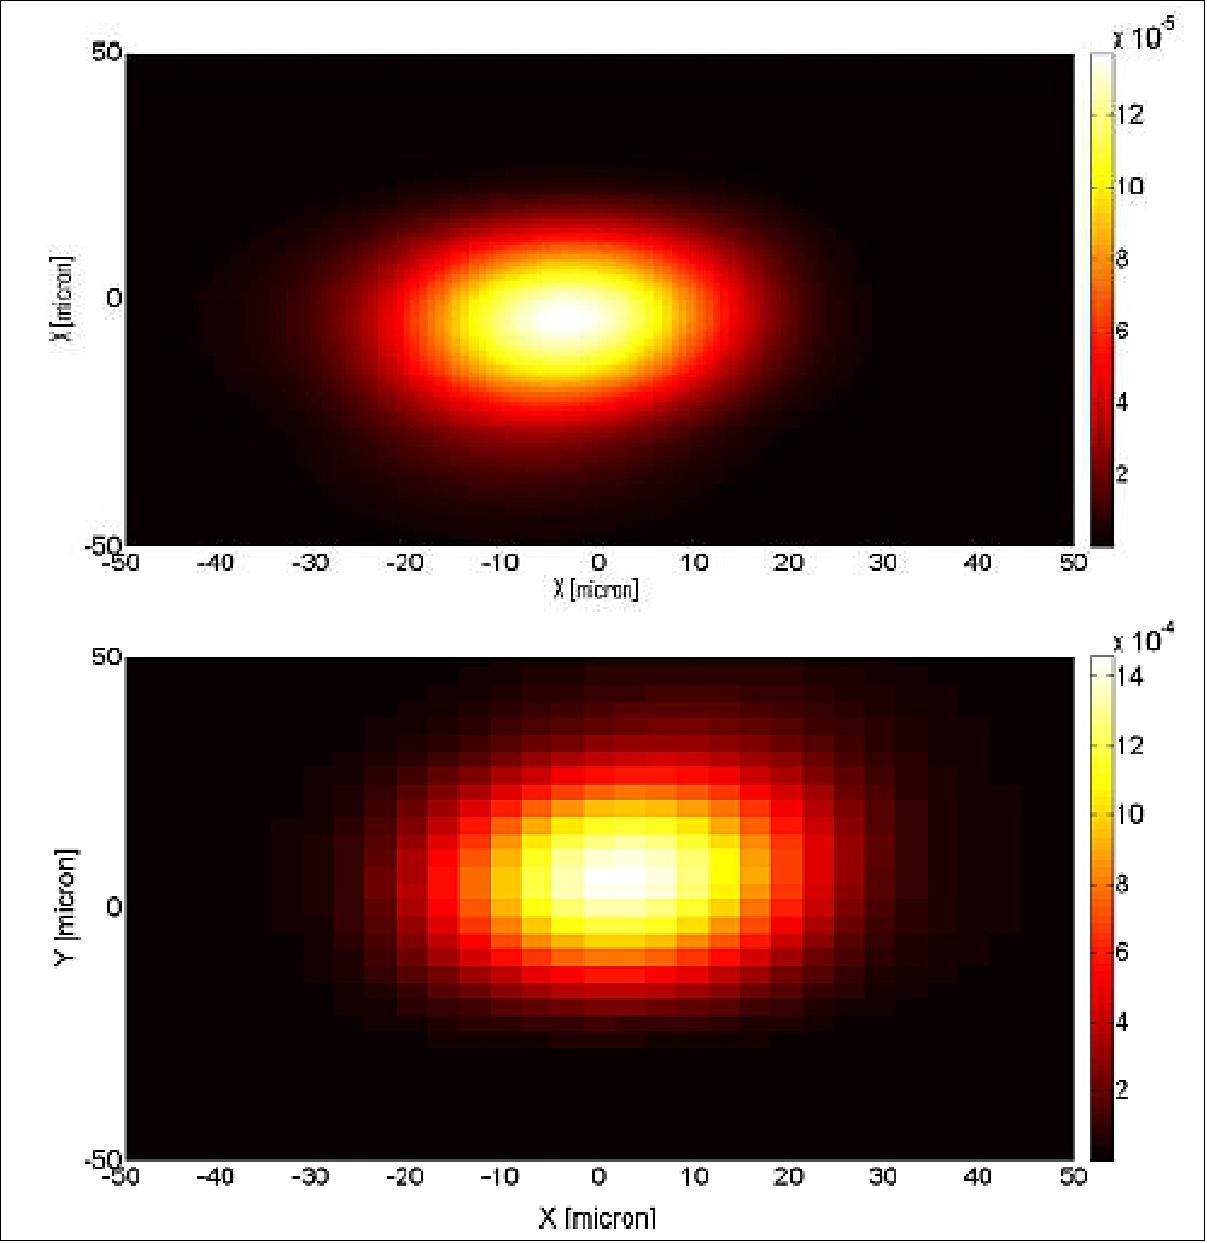
The associated MTF is reported in Figure 51, both for the in-orbit prediction and on-ground measurement, and it is compared with the requirement.
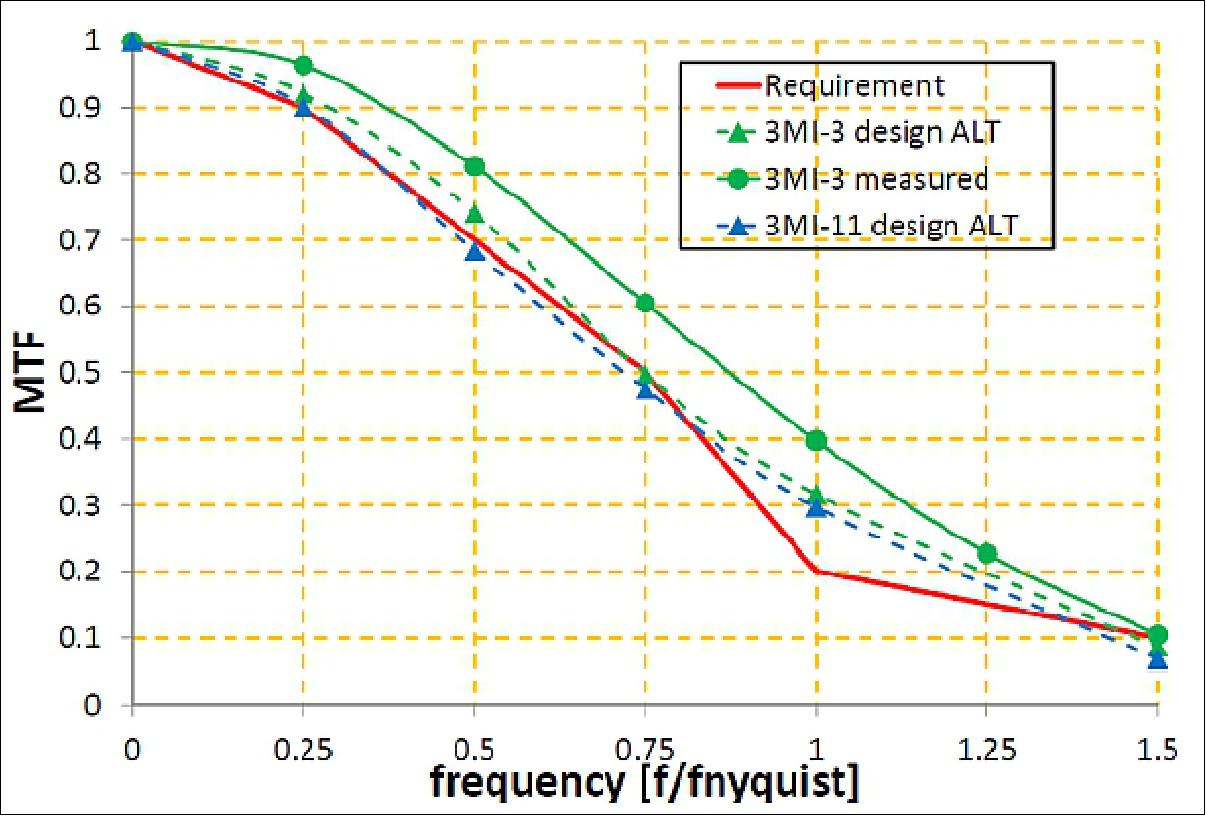
The in-orbit MTF predictions are marginal with the requirement for f<fnyquist while a good margin is present at f=fnyquist. The 3MI-3 channel on-ground measured MTF is in line with the expectation, well above the requirement and in-orbit simulation, confirming that margin are still present for ground-to-orbit degradation.
Development status of 3MI
• The 3MI instrument has completed the PDR (Preliminary Design Review) in October 2015 and is currently moving toward a CDR (Critical Design Review) scheduled in January 2018.
METimage (Meteorological Imager)
METimage, formerly known as VII (Visible and Infrared Imager), is an advanced multispectral medium-resolution imaging radiometer for meteorological applications to be integrated onto the MetOp-SG satellite series, formerly known as EPS-SG (EUMETSAT Polar System –Second Generation). The METimage instrument is mounted on the MetOp-SG-A satellite, which is planned to be operational in 2021.
Germany intents to provide the first flight unit of METimage as in-kind contribution to the MetOp-SG program of EUMETSAT. DLR (German Aerospace Center) awarded a study contract to Jena-Optronik in December 2008. Initial concept studies for METimage infrared detectors were already conducted in the timeframe 2007-2009 by AIM Infrarotmodule GmbH, Heilbronn. In November 2012, DLR awarded to Jena-Optronik a Phase-B2 design contract for METimage, funded by two German federal government ministries, BMWi (Bundeswirtschaftsministerium - Ministry of Economics and Technology) and BMVBS (Bundesverkehrsministerium - Ministry of Transport, Building and Urban Affairs). 46) 47) 48)
METimage is regarded a successor of the AVHRR-3 (Advanced Very High Resolution Radiometer) of NOAA flown on the current EPS/MetOp satellite series, and is the European counterpart of the VIIRS instrument on the USA new-generation weather satellite series (NPP and JPSS). 49) 50) 51)
In September 2016, EUMETSAT and DLR, signed a cooperation agreement for the development of the METimage instrument to be flown on three successive Metop-SG A satellites of the EUMETSAT Polar System Second Generation (EPS-SG) in the 2021-2042 timeframe. 52)
Also in September 2016, Airbus Defence and Space has been commissioned by DLR (German Aerospace Center) to develop and build three flight units of the innovative METimage weather instruments. 53)
The primary objectives for METimage of the MetOp-SG mission are to provide high quality imagery data for global and regional NWP (Numerical Weather Prediction), NWC (Now-Casting), and climate monitoring. To meet these objectives, METimage has to provide high resolution cloud products, aerosol products, sea- and ice surface temperature and others. Other mission objectives are to support the Post-EPS sounders by providing geolocation and cloud characterization, and to provide data continuity of other key imagers in support of long-term climate records. From these objectives the requirements for the METimage mission have been derived, among them:
- Global coverage within 12 hours
- Large number of spectral bands and wide spectral range
- Demanding figures for dynamic range and signal-to-noise ratio (SNR)
- Polarization insensitivity of 5% for the reflective solar bands (443 nm to 3 µm) and 11% for the thermal emission bands (3 - 13.35 µm)
- Spatial resolution of 500 m and 250 m for selected channels
- Coregistration of all spectral bands: spatial > 87%, temporal < 1 second.
Instrument Design
The main drivers for the METimage instrument design result directly from the mission requirements. To meet daily global coverage from an orbit of 830 km altitude, a large swath of 2670 km, corresponding to a cross-track scan angle of ± 53° about nadir, must be observed by the instrument. To cover the large FOV (Field of View), METimage is based on a mechanical scanner telescope (i.e., whiskbroom type), using reflective optics to cover the wide spectral range required to implement the 20 channels on two focal planes. 54) 55)
METimage achieves global coverage with 500 m square pixels by continuous scanning orthogonal to the flight direction. Due to the scan motion, the image moves sequentially over the detector channels. By proper timing of the sampling, a certain pixel in the image is measured sequentially by different spectral channels (Figure 52).
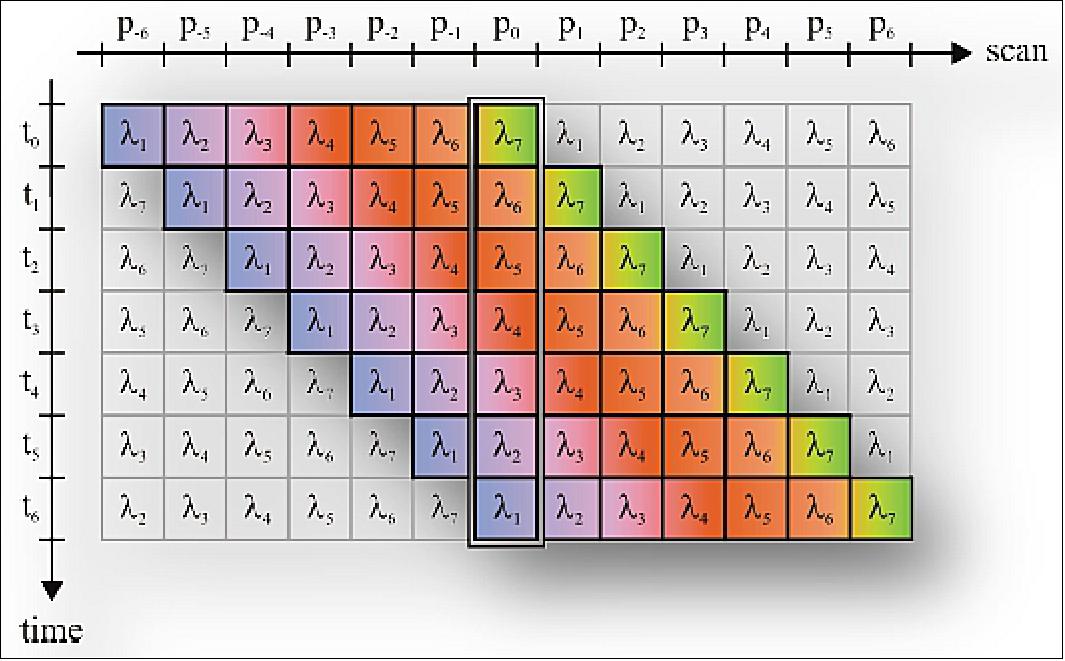

The products to be derived from the METimage mission are:
- Cloud observations including microphysical analysis
- Water-vapor imagery
- Aerosol observations
- Polar AMVs (Atmospheric Motion Vectors)
- Earth surface albedo
- Vegetation
- Cryosphere (snow observations, sea and land ice imagery)
- Fire observations
- Surface temperature (land and sea).
λ (nm) | Δλ (nm) | Cloud | Cloud top height | Water | Aerosol | Cirrus | Vegetation | Surface Temp. | Primary observations |
443 | 30 | x |
|
| x | x | x |
| Clouds and aerosol |
555 | 20 | x |
|
| x | x | x |
| Clouds, aerosol, and vegetation |
670 | 20 | x |
|
| x | x | x |
| Clouds, aerosol, and vegetation |
763 | 10 |
| x |
| x |
|
|
| Cloud and aerosol height assignment |
763 | 40 |
| x |
| x |
|
|
| Cloud and aerosol height assignment |
865 | 20 | x |
| x | x | x | x |
| Clouds, aerosol, and vegetation |
940 | 50 | x |
| x | x | x | x |
| Water vapor |
1.240 | 20 | x |
|
| x | x | x |
| Clouds, aerosol, and vegetation |
1,365 | 40 | x |
| x | x | x | x |
| High level clouds, aerosol, and water vapor imagery |
1,630 | 20 | x |
|
| x | x | x |
| Cloud phase and surface properties |
2,250 | 50 | x |
|
| x | x | x |
| Cloud microphysical analysis |
3,740 | 180 | x |
|
| x | x |
| x | SST (Sea Surface Temperature) |
3,959 | 40 |
|
|
|
|
|
| x | SST and fire |
4,040 | 60 |
|
|
|
|
|
| x | SST |
6,725 | 370 | x |
| x |
|
|
|
| Water vapor imagery and polar winds |
7,325 | 290 | x |
| x |
|
|
|
| Water vapor imagery and polar winds |
8,540 | 290 | x |
| x | x | x |
|
| Cirrus clouds |
10,790 | 500 | x | x | x | x | x | x | x | Water vapor imagery and polar winds |
12,020 | 500 | x | x | x | x | x | x | x | Water vapor imagery and polar winds |
13,345 | 310 | x | x |
|
| x |
|
| Cloud top height |
Optics: The rotating telescope scanner design consists of a three-mirror anastigmat, rotating at constant speed about an axis parallel to the line-of-sight, followed by a HAM (Half-Angle-Mirror), a plane mirror rotating at half of the telescope speed. Such a system provides a de-rotated image in the focal plane. Calibration sources are mounted at scan angles outside the ±53° Earth view (Figures 54 and 55). Compared to a two-mirror telescope, the three-mirror anastigmat design provides a high image quality over a larger FOV, allowing implementation of more detectors on the focal plane. With the in-field separation of spectral bands (see below), a large instantaneous FOV is essential for the number of spectral bands that can be implemented. In addition, the large FOV allows increasing the number of detectors per spectral band, leading to a larger footprint on ground. This allows a reduced rotation speed of the telescope and thus increases the integration time per pixel, resulting in improved radiometric performance. The scan period of 1.729 s is defined by the satellite orbit and the spatial resolution.
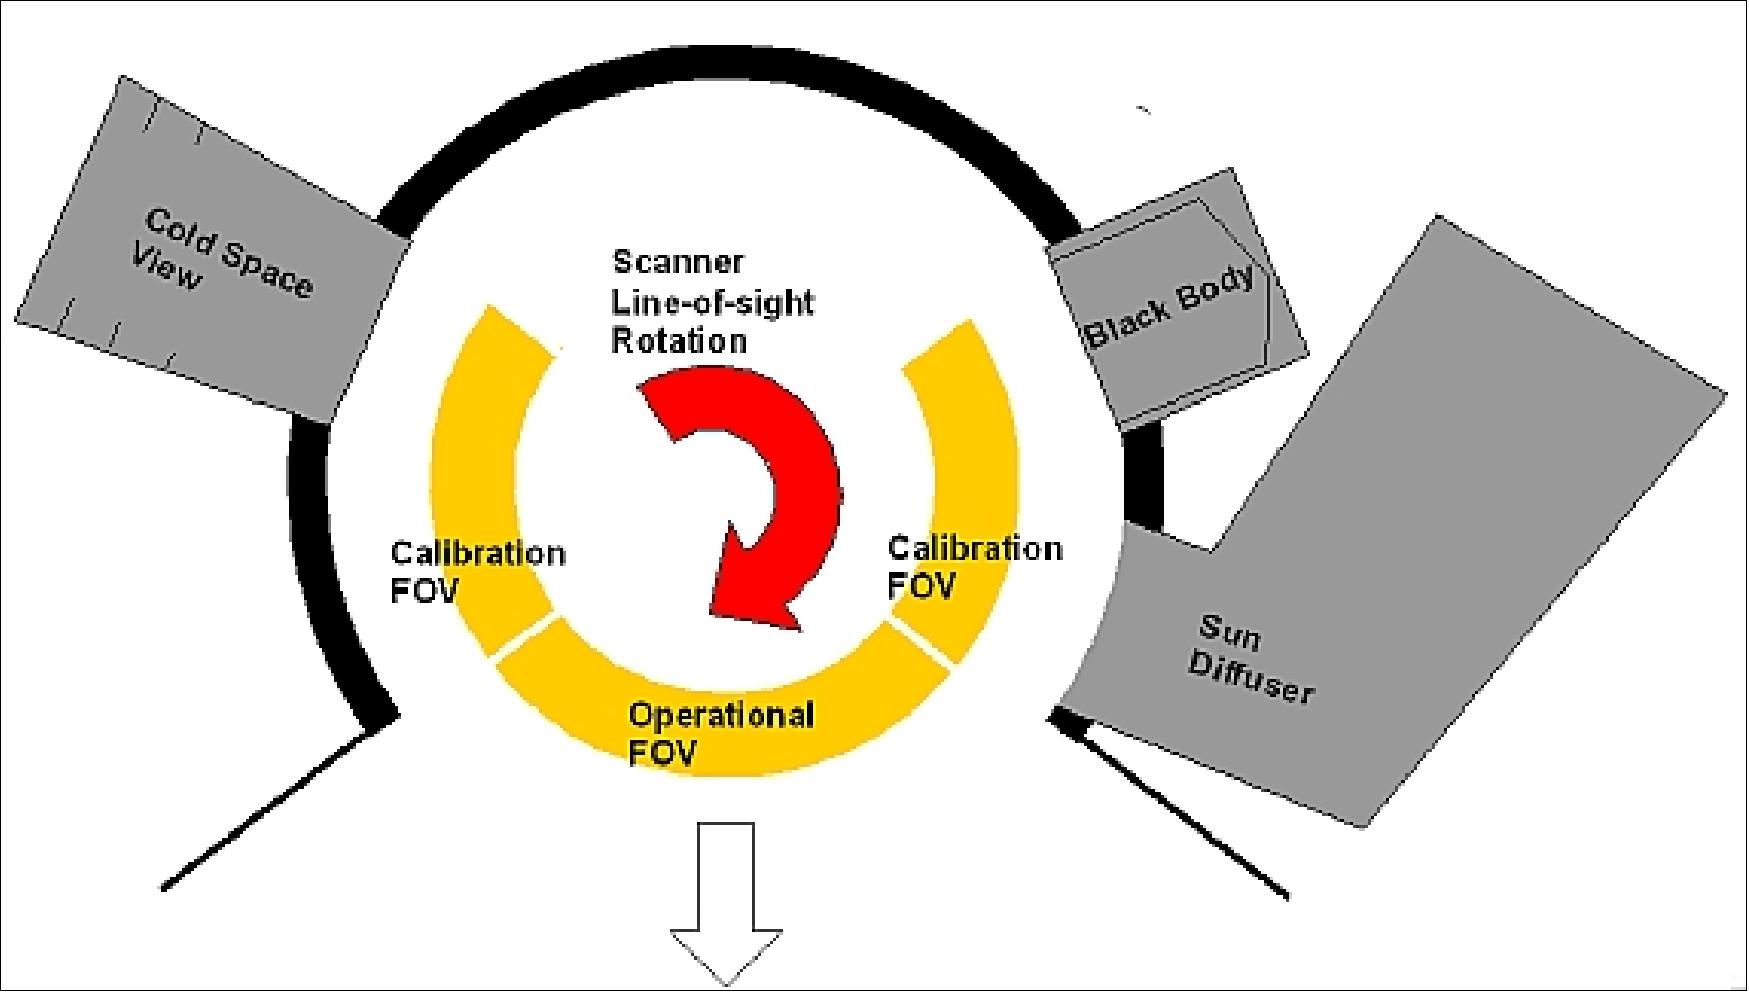
Legend to Figure 54: On-axis view of the rotating telescope. Downward facing is the large ±55° Earth view (nadir at center); the calibration sources are mounted at scan angles outside the Earth view. The telescope is rotating at constant speed, the calibration sources are sampled during each rotation.
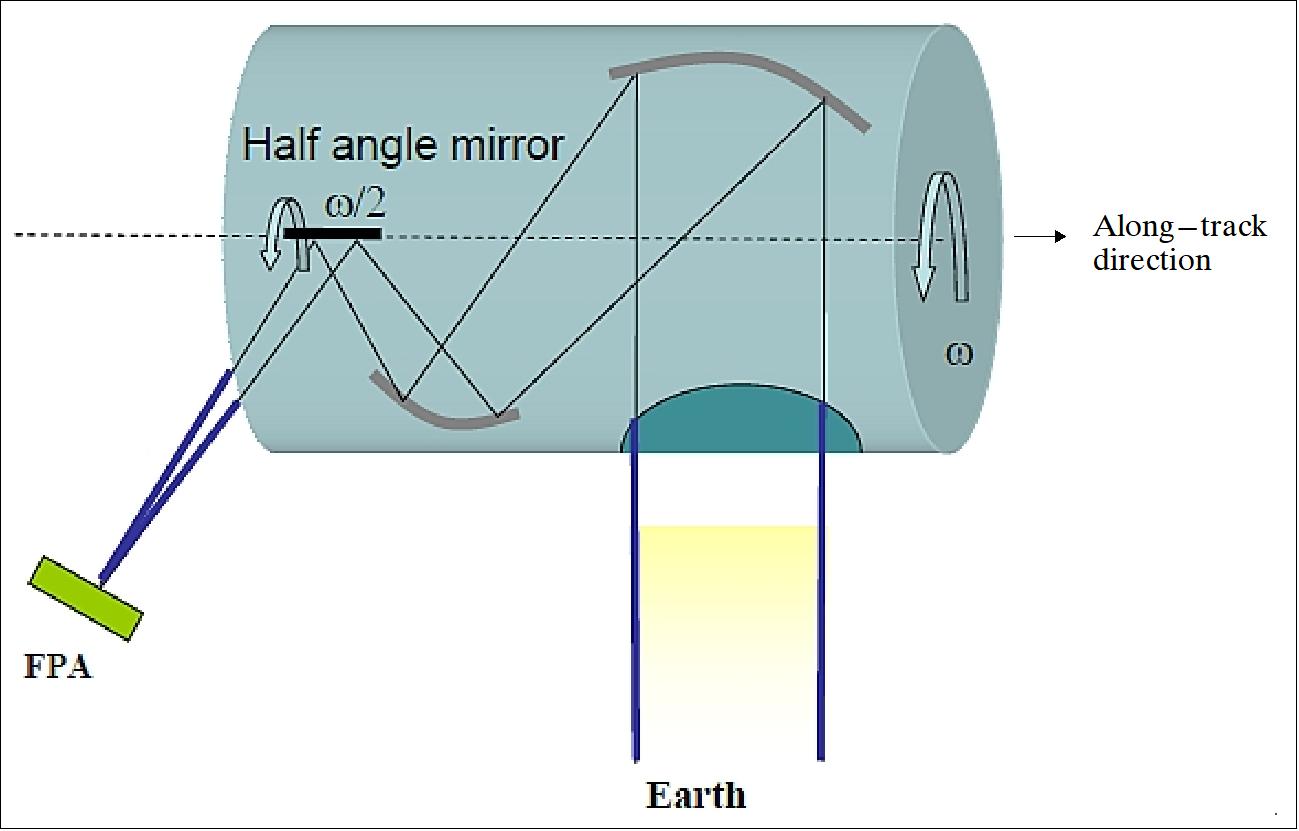
Legend to Figure 55: Along axis view of the rotating telescope. At the left side of the telescope is the half-angle-mirror, rotating at half the telescope speed, producing a de-rotated image in the focal plane.
Following the main optics is a compact, passively cooled secondary optics, providing both an aperture and a field stop, to minimize the impact of stray light and radiative input to the thermal channels. A beam splitter directs the visible and infrared parts of the incoming radiation to one of the two respective FPAs (Focal Plane Assemblies). The IR focal plane is actively cooled to cryogenic temperatures. Each focal plane accommodates detectors and filters for 10 or 11 spectral bands.
A common problem for most scanning systems is different incident angles on optical surfaces, which result in scan-angle dependent polarization properties. In practice, the polarization dependence will also result in a wavelength dependent change of mirror reflectivity. This effect directly adds to the radiometric error budget for all channels, especially when the calibration sources are at different scan angles than the earth view. For the thermal emissive bands there is an additional error contribution resulting from the angle dependent thermal emission of the HAM. It is therefore important for the optics not only to keep the polarization within the values specified in the polarization requirement, but also to keep the difference between different scan angles as small as possible to maintain radiometric accuracy and homogeneity.
FPA design: The spectral separation of individual spectral bands is done by in-field separation, where detectors for different spectral bands are located side-by-side in the focal plane. Due to the cross-track scanning, the image moves sequentially over all spectral bands on a focal plane (Figure 56). For each spectral band there is a row of detectors in along-track direction, so as for a whiskbroom scanner, the instrument records a number of image lines simultaneously during each scan.
Filters are mounted directly in front of the detectors and provide the required spectral shape and resolution. The number of spectral bands that can be accommodated on a focal plane is limited by the usable FOV and the mechanical size of a detector row and filter assembly. The usable FOV is not only limited by the image quality of the optics, but also by the co-registration budget: co-registration errors increase with the distance of detectors within a focal plane (image quality, rotation rate errors, alignment errors, thermal effects, satellite ground speed, and others). With the current design, about 10 or 11 channels can be implemented on each focal plane. The exact number depends on the radiometric requirements and performance of the selected channel combination: some spectral bands will need TDI (Time-Delayed Integration) to achieve the required SNR, thus using up more space on the focal plane.
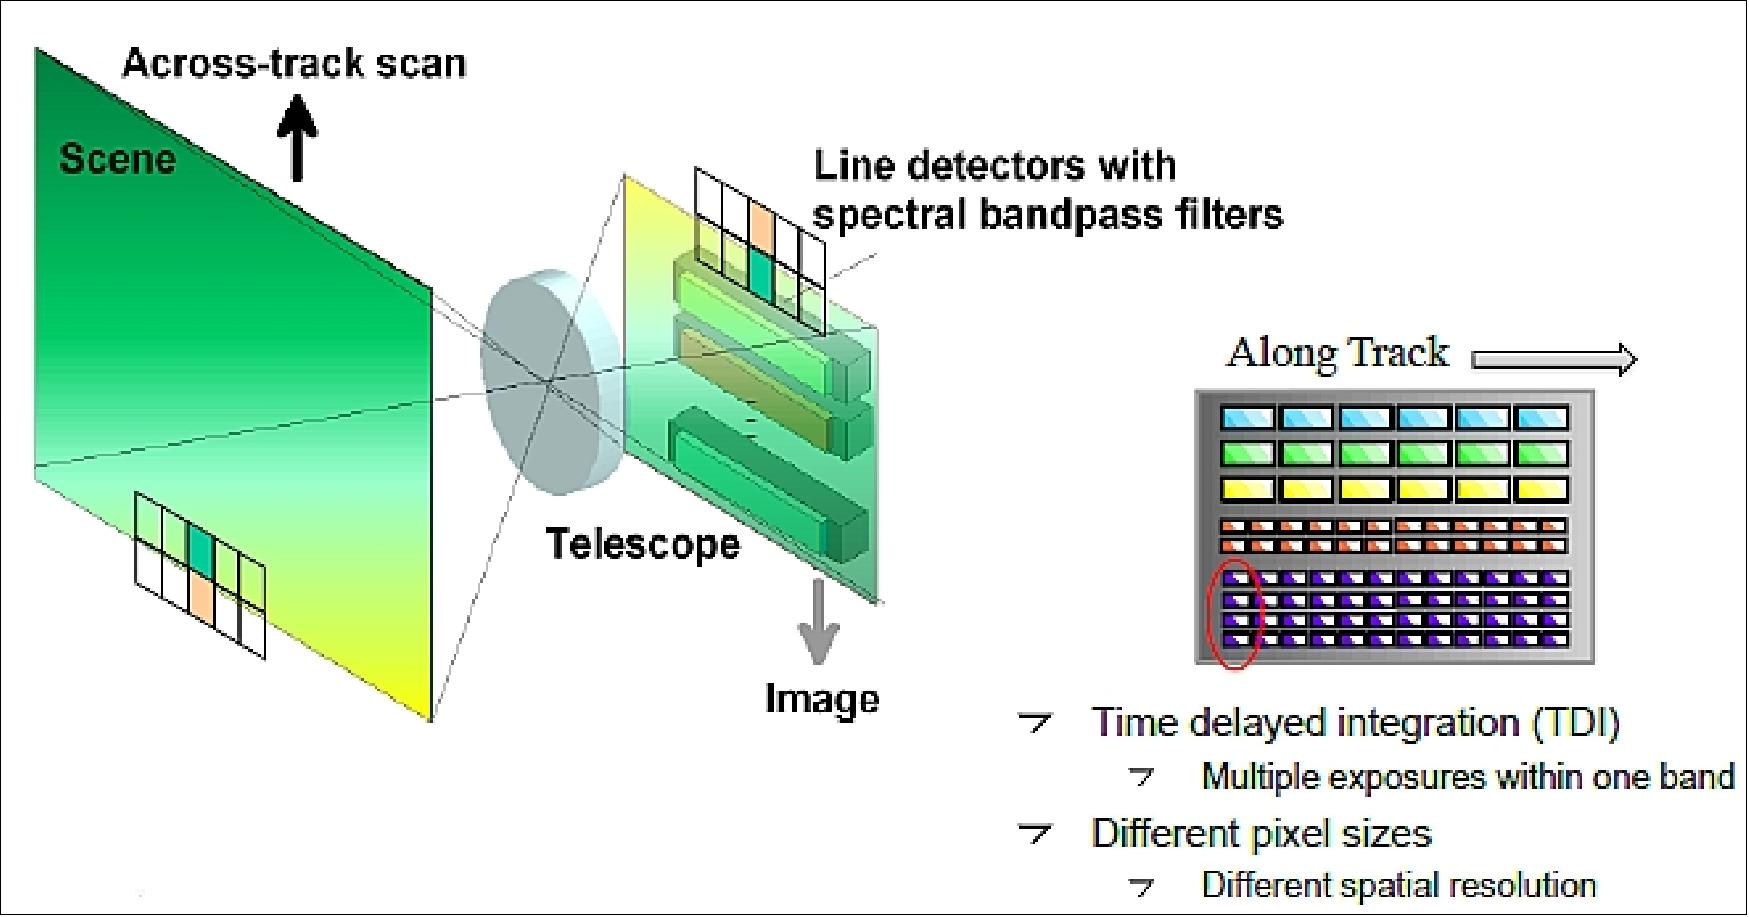
Detectors: Detectors are another crucial element in the imaging radiometer. The quality of the detection chain, consisting of detector plus read-out electronics, is decisive for the radiometric accuracy. To achieve the radiometric requirements, METimage will use detectors made from different semiconductor materials. As the spectral sensitivity is dependent on the material, it has to be matched to the target wavelength range. This is especially true in the infrared region. The long wavelength IR channels are the design driver of focal plane temperature and cooling needs. State of the art ROIC (Read-Out Integrated Circuits) with integration stages and amplifiers will be mounted directly on the focal plane arrays.
Calibration: The calibration for the thermal emissive bands is based on a two-point calibration, measuring "zero" by using a cold space view and a high temperature by looking at a high precision blackbody. The blackbody is operated close to instrument temperature, reducing errors due to non-perfect blackness and ageing effects of the black coating. Both calibration targets are scanned during every revolution of the telescope and calibrate all detectors on the cold focal plane. The blackbody can be heated to verify the linearity of the thermal emissive bands detection chains on a regular basis. Blackbody and the primary cold space view are located at opposite positions of the telescope (Figure 54) and are seen under the same scan angle in order to minimize scan-angle dependent effects. A second cold space view can be implemented at a different scan angle to monitor the scan-angle effects and temperature variations of the HAM.
The reflective solar bands are calibrated using the blackbody as optical zero and a solar diffuser as bright source. While the blackbody provides a suitable zero measurement during every revolution of the telescope, the solar diffuser is illuminated only for short time during each orbit (about once every 100 minutes) by the sun, so that a full calibration of the solar channels is only done once per orbit. A common problem with solar diffusers is their ageing under exposure to UV radiation. Even though the planned diffuser for METimage is exposed only for short times and shows relative little ageing under UV exposure, the overall degradation during eight years mission lifetime accumulates to much more than the required 1% lifetime stability. A diffuser monitor device that is well protected from UV radiation is used to calibrate the main diffuser on a regular basis so that the degradation of the main diffuser can be monitored and corrected.
Mechanical instrument design: The instrument consists of an optical head and detached electronics box. Figure 57 shows the optical head. The mechanical configuration is strongly influenced by the different FOV requirements for operational measurements, of the calibration sources and radiators for thermal conditioning. The need for high thermal stability is reflected in a structure that is well shielded. It is as far as possible closed to external radiation intake, which also benefits the stray-light suppression.
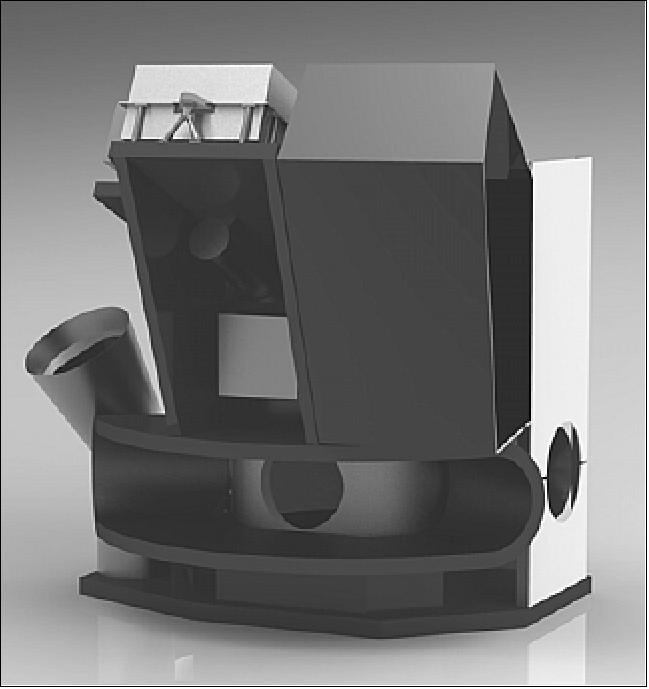
Legend to Figure 57: The front of the picture shows the large operational view (110° earth-view). The right side points toward deep space and shows the radiators and the deep space view for calibration. The baffle for the solar diffuser is visible on the left side of the instrument.
While the necessity for a well adapted optical design is easy to perceive, the intricacies of the mechanical design may not be so obvious. However, the accuracy and stability of the mechanical structure supporting the rotating telescope and the half angle mirror is crucial for core performances related to line-of-sight stability. The requirements for relative stability of subassemblies can be as low as a few arcsec. Figure 58 shows the schematic block diagram of METimage.
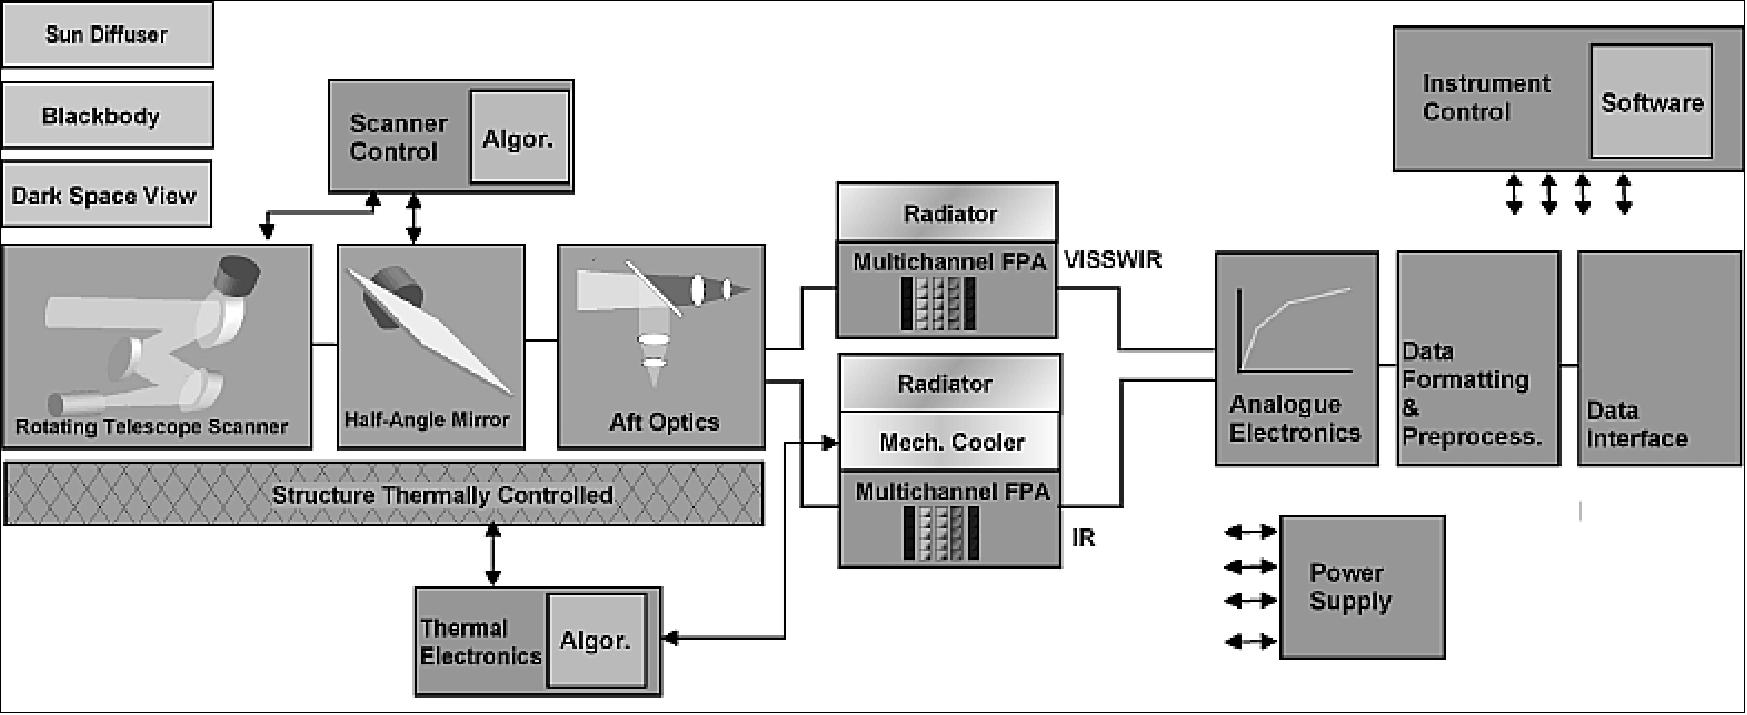
Scanning technique | Whiskbroom, rotating telescope, scan range: ±53º |
Telescope parameters | Input aperture: 170 mm, circular |
Swath width | 12 km ALT (Along-Track) x 2670 km ACT (Across-Track) |
Spectral range | 0.4 - 13.4 µm (20 bands, see Table 25) |
Spatial resolution | Changing with bands: 0.25 km, 0.5 km or 1.0 km at subsatellite point |
General GSD | 500 m at nadir |
Coverage / Cycle | Global coverage twice/day (long-wave bands) or once/day (short-wave bands) |
Detector parameters | VNIR: CMOS, 250 µm x 250 µm read-out pixel size 96 x 4 read-out pixels/band (ALT x ACT), ambient operational temperature |
Instrument mass | ~296 kg |
Instrument power | 465 W nominal operations mode, 287 W survival & LEOP mode |
Data rate | 18 Mbit/s during day observations, 9 Mbit/s in eclipse (VNIR channels off) |
Data volume | 82 Gbit over 1 orbit |
Legend to Table 25: SMWIR/SLWIR refers to the calibrated signals from the source in the MWIR (Mid-Wave Infrared) and the LWIR (Long Wave Infrared) bands, respectively.
The orbit and observational parameters together with the detector parameters lead to a TMA design for the telescope. The pupil stop is between the scanner mirror and M1, a field stop is placed on the intermediate image after M2 to limit the out-of-field stray light. The rotation of the scan mirror is compensated by a beam de-rotator following the telescope. The de-rotator is electrically synchronized with the scanner and rotates at half of the scanner frequency. It is implemented with as 5 mirror system to minimize polarization effects. A set of dichroic beam splitters separates the beam into 3 spectral bands and folding mirrors direct the beams to the VNIR detector and the IR intermediate images. At these intermediate images the spectral channels are spatially separated by filter stripes, and re-imaged onto the IR detectors to cope with the detector geometry (magnification of 0.135). Inside this re-imaging optics a cold pupil stop reduces slightly the aperture to remove the direct light coming from the (warm) entrance pupil stop. The overall METimage optical design is depicted in Figure 59.
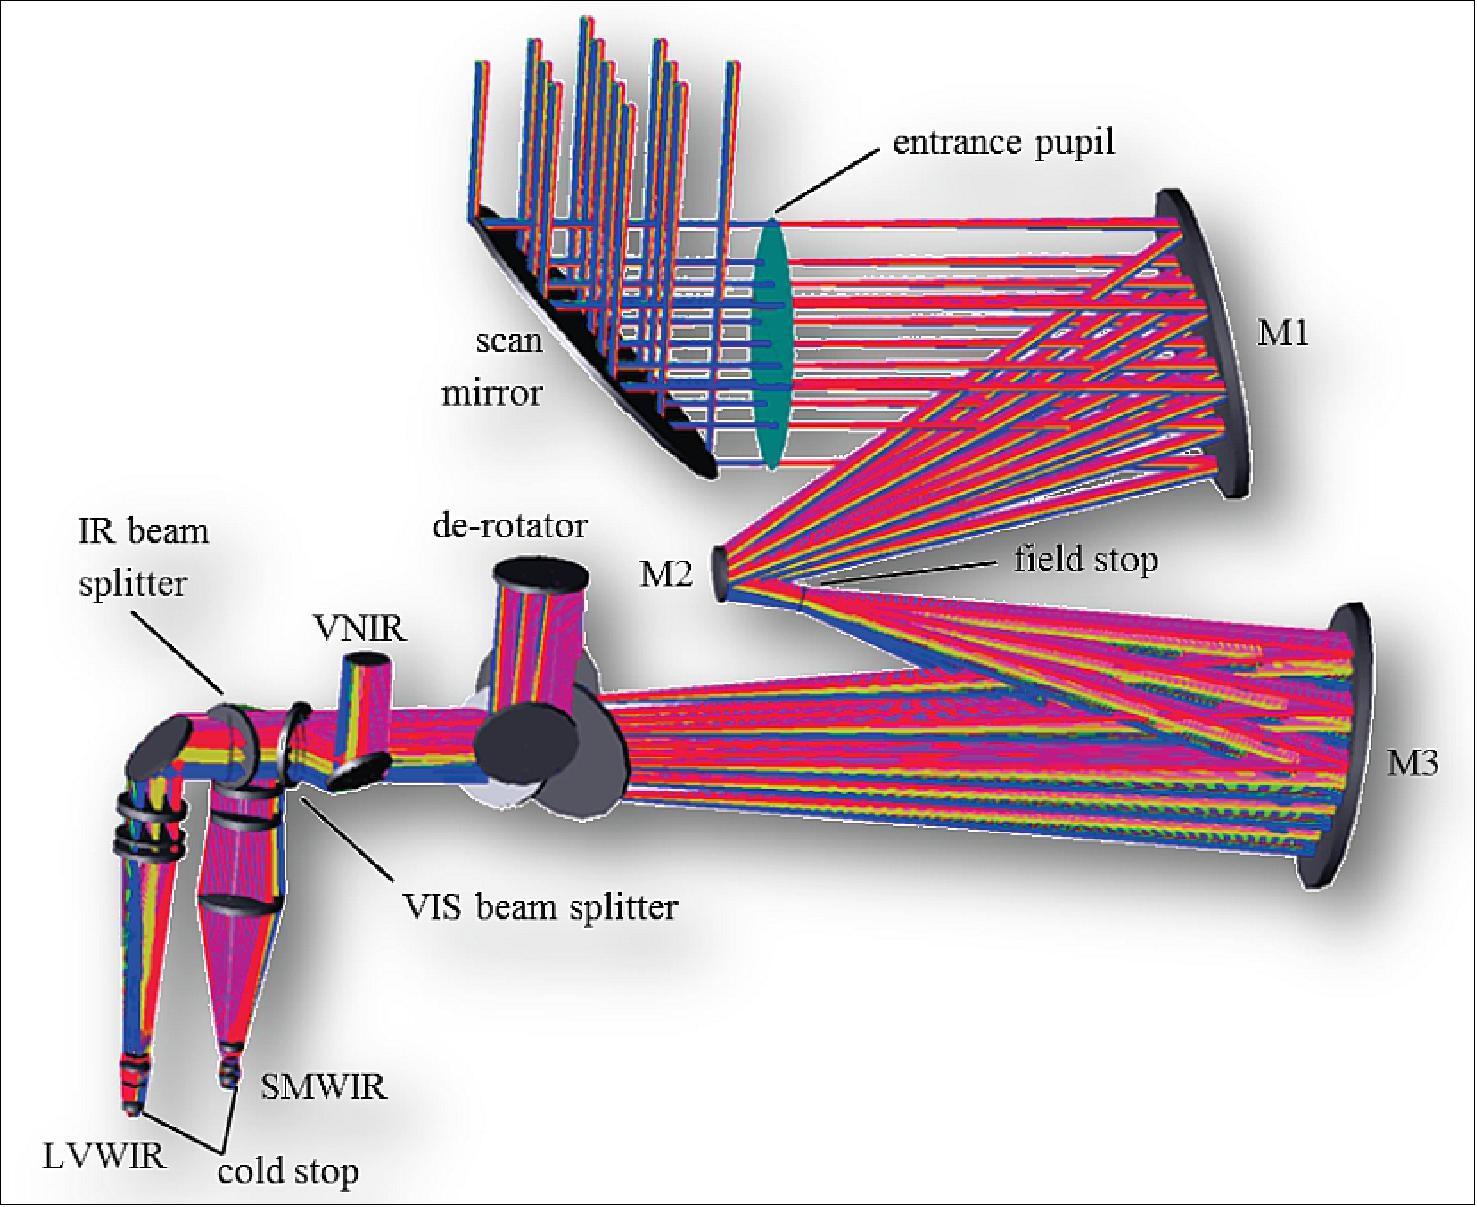
The instrument consists of the optical head as well as of the electronic units located inside the spacecraft’s payload equipment bay. The optical system is constituted of four major parts (Figure 60):
• A compartment at ambient temperature which is realized as a box-like structure supporting the calibration devices, the mechanisms, the optical elements up to the beam splitters, as well as the cryogenic subsystem.
• A cryogenic subsystem which includes the IR optics from the filters up to the detectors as well as the cryostat with the cold-redundant cryocoolers.
• An external electric assembly carrying the detectors front end electronics as well as the temperature acquisition electronics.
• A baffle for the solar calibration device to avoid any light entering from Earth or spacecraft.
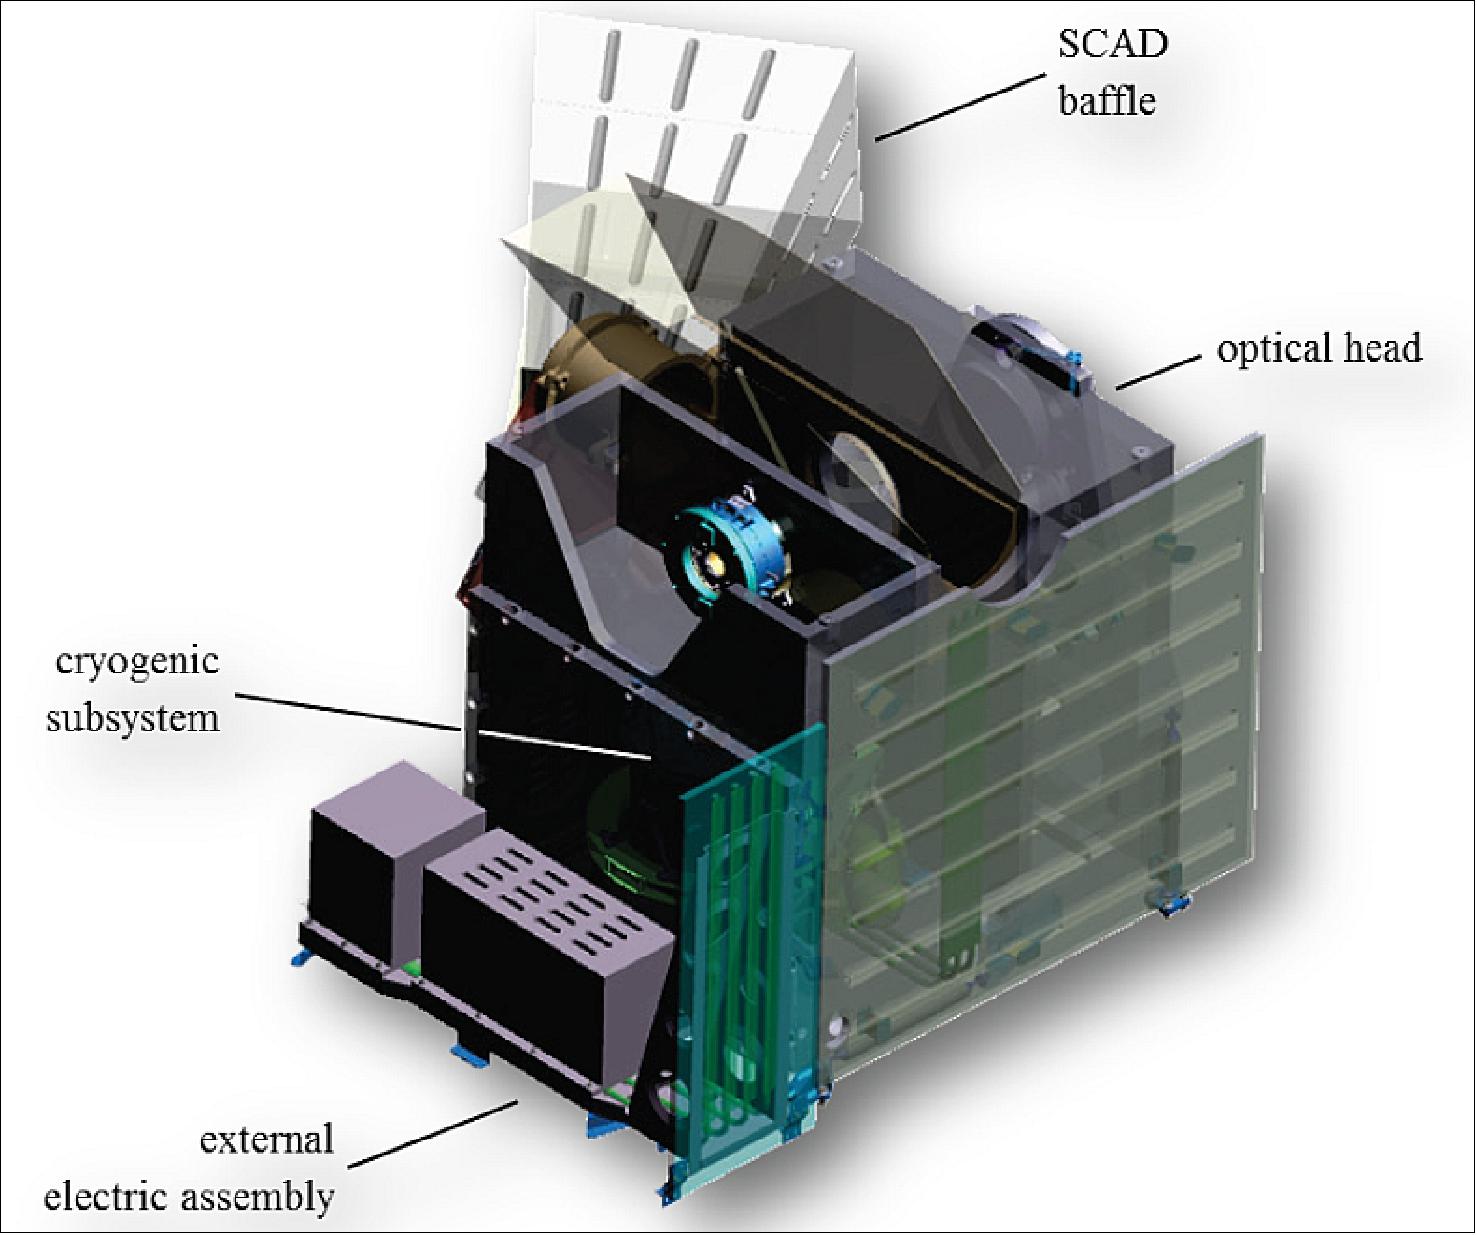
The instrument structure is made of Aluminum/CFRP sandwich panels and is actively thermal controlled. The Earth view baffle is defined by the instrument’s scan range and by the deep space view at -66.6º. - The TCAD (Thermal Calibration Device) is a black plate with well-known emissivity and high accuracy temperature control (sensors with 1 mK accuracy over lifetime). The SCAD (Solar Calibration Device) is implemented as a reflective diffuser made of Spectralon. To cope with aging effects, the diffuser is illuminated only once in several days. In addition a reference diffuser is available to determine the degradation over time.
The scan mirror and the de-rotator optical assembly are mounted on respective mechanisms, which are properly aligned and actively controlled to ensure the electrical synchronization. The telescope optics is implemented on a separate structure to allow for proper alignment.
The cryogenic subsystem is implemented on a separate structure to allow for a stand-alone integration and verification but also to ease the integration into the optical head structure (Figure 61). The cryostat design with 2 inner shields ensures a detector temperature of 60 K and temperatures of up to ~80 K for the re-imaging optics. Two windows allow the optical paths to enter the cryostat. The refractive re-imaging optics for each IR band is mounted inside a Titanium structure which interfaces the cryostat housing with GFRP (Glass Fiber Reinforced Polymer) struts to minimize the thermal loads. The IR detectors are coupled to the pulse tube cryocoolers via highly conductive thermal links. The cryocooler compressors are linked via heat pipes to the radiator.
The beam splitters and fold mirrors as well as the VNIR filter assembly and FPA are implemented on a separate bench. This bench is mounted on the cryostat to make feasible the alignment of the re-imaging optics to the beam splitters and to improve the spatial coregistration between the VNIR channels and the IR channels.
The proximity electronics are used for detector output signal pre-amplification. They are mounted as close as possible to the detectors and are interfacing the FEE (Front End Electronics), which is located in the external electric assembly. The FEE performs the analog to digital conversion and data serialization.
The data acquired from the Earth view and the calibration views is provided via the FEE to the MCE (METimage Central Electronics). The MCE controls the entire instrument, including thermal control, mechanism synchronization, cryocooler operation, and data handling. It performs SNR bit trimming to reduce the overall data volume. The MCE is located inside the payload equipment bay and is connected to the optical head via a harness of ~3m length. The TM/TC interface to the spacecraft is via SpaceWire.
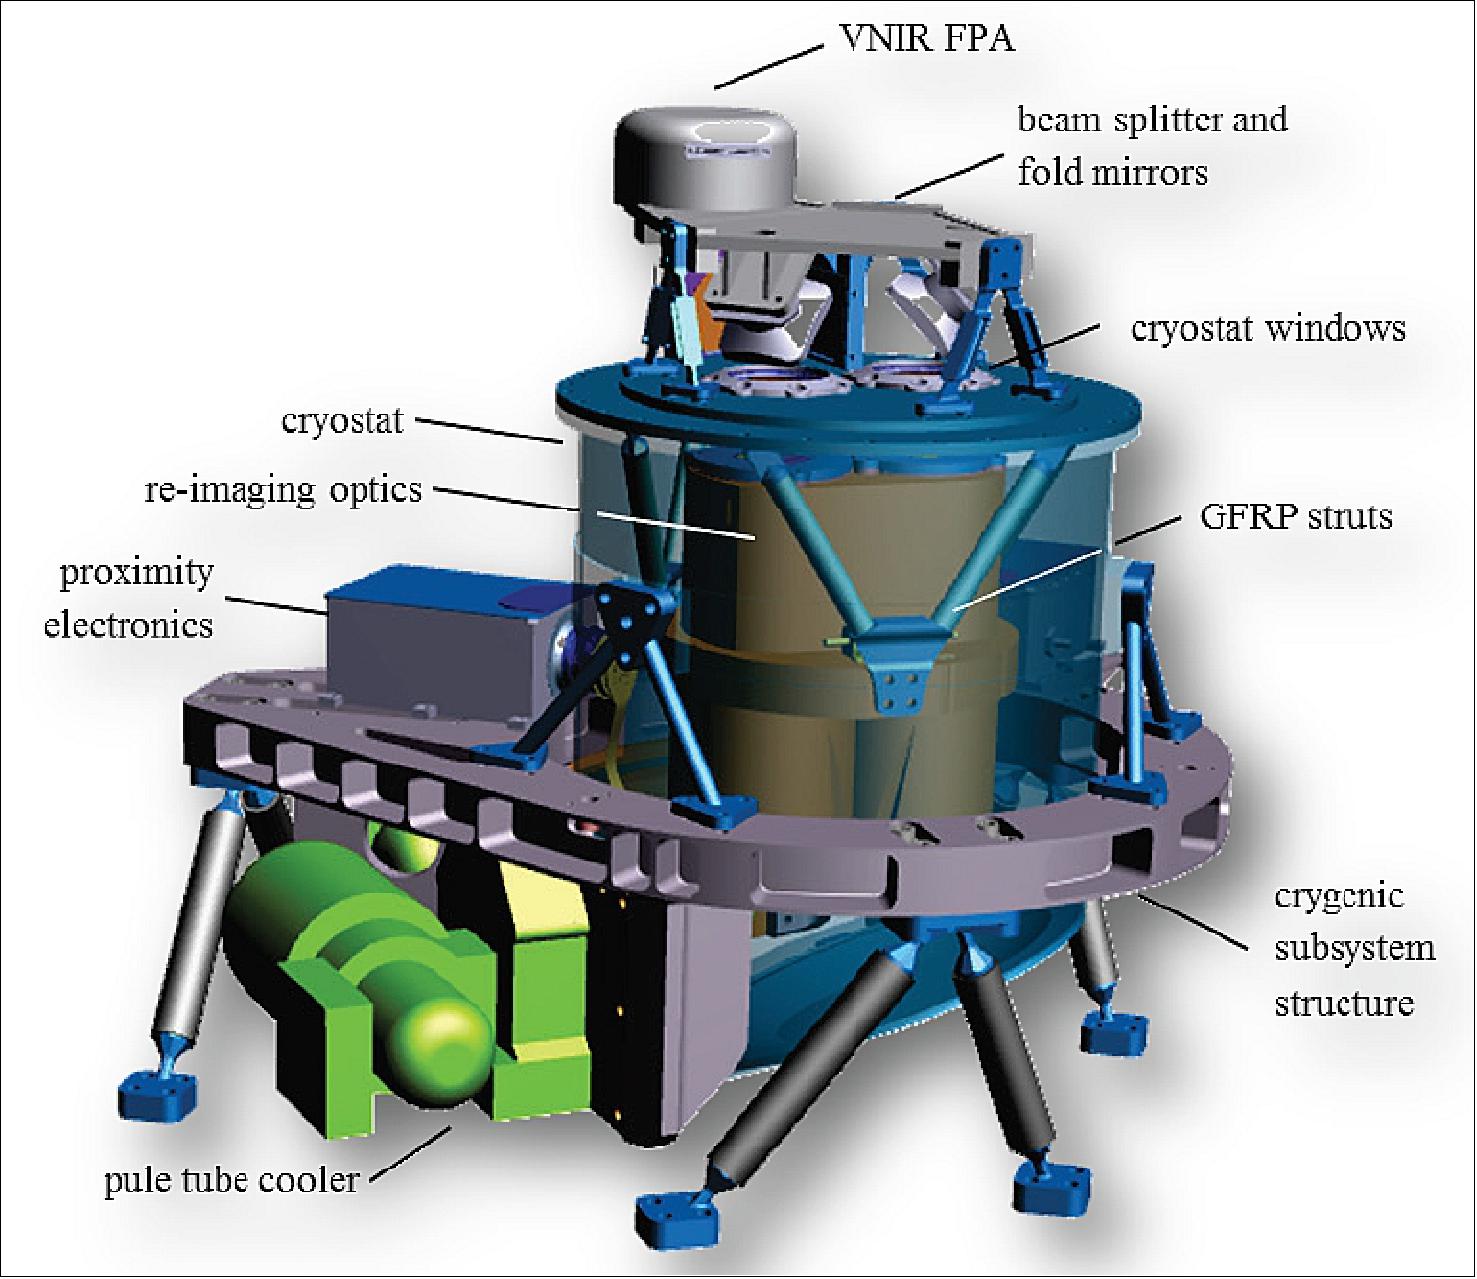
The key performance parameters of the METimage instrument are summarized in Table 26. The instrument is designed to fulfill these requirements in an optimum way.
• The inter-channel coregistration defines the spatial relation between the pixels in each image and each combination of spectral bands. It is critical to achieve and imposes stringent requirements on relative alignment and stability to the optics of the three spectral bands because this requirement has to be fulfilled without resampling. Field masks of 1 x 1mm in size are introduced at the telescopes focal plane to minimize the effect of aberrations of the IR re-imaging optics.
• In order to meet the polarization sensitivity requirement, dedicated optical design solutions and careful optical coating selection is required.
• The radiometric noise requirements are crucial for sizing the instruments optics aperture diameter and the detector integration capacitances. The critical parameters are the overall instrument transmission but also the knowledge of the various noise contributors. The dominant noise sources are shot noise and read out noise for the solar channels just as detector read-out noise and dark current related noise contributions for the infrared channels. TDI is implemented for some channels to meet the requirement.
• The radiometric accuracy is defined in terms of bias, inter-channel and inter-spatial accuracy. The bias accuracy defines the accuracy of the measurement, the inter-channel radiometric bias accuracy defines the uniformity within the various spectral channels of the same spatial sample, and the inter-spatial radiometric bias accuracy defines the uniformity within the various spatial samples of the same spectral channel.
Parameter | Solar bands (VNIR/SWIR) | Thermal bands (LWIR) |
Inter-channel co-registration | < 0.2 spatial samples |
|
Polarization sensitivity | <5% | < 0.5 K |
Radiometric noise | SNR up to 400 | NedT up to 0.05K |
Radiometric accuracies: |
|
|
A particular driver for the instrument performance is the on-ground storage of the second and third instrument flight model. The instrument is stored onboard the spacecraft and subject to yearly maintenance activities. A critical parameter is the particulate and molecular contamination during the storage period. The second and third flight models have to be re-calibrated prior to launch to ensure a proper instrument characterization.
IASI-NG (Infrared Atmospheric Sounding Interferometer – Next Generation)
IASI-NG is developed by CNES within the framework of the EUMETSAT Polar System Second Generation (EPS-SG) program. For the IA SI-NG program, a cooperation agreement is implemented between CNES and EUMETSAT. Under this agreement, CNES has technical oversight responsibility for the instruments, the Level 1 data processing software and the Technical Expertise Centre (TEC) developments. EUMETSAT is responsible for operating IASI- NG, archiving and distributing data to the users. 56)
This paper reports on latest status of IASI NG program development which achieved its Critical Design Reviews for Instrument and System aspects. Further 5 years of instrument definition consolidation and engineering models activities, all the instrument sub -system environment qualification and performance tests have been successfully completed. Early 2021, the alignment, integration and test phases have started on the first IASI-NG instrument Flight Model (PFM) with the coming final performances vacuum test before delivery early 2022. IASI-NG PFM instrument will be then mounted on the Metop SG A1 PFM Satellite under development by ESA to particip ate to the Satellite environment test campaign in 2022 and 2023.
To achieve global coverage, the IASI-NG instrument observes the Earth up to an angle of about 50° on both sides of the satellite track. This corresponds to 2 x7 mirror positions and a swath of about 2 x1000 km. Each instantaneous field-of view (100 km x 100 km at nadir) is composed of 4 x 4 circular pixels, each corresponding to a 12 km diameter footprint on the ground at nadir.
The first instrument flight model will be launched onboard the METOP-SG-A1. The second instrument will be embarked on the METOP-SG -A2 satellite. The third instrument should be embarked on the METOP-SG -A3 satellite.
The objectives of the mission are: 57) 58) 59) 60)
• To assure the continuity of IASI for NWP, atmospheric chemistry and climate applications.
• To improve the characterization of the lower part of the troposphere, the UT/LS region and, more generally, of the full atmospheric column.
• To improve the precision of the retrievals and to allow the detection of new species.
The IASI-NG instrument requirements call for:
- 16921 spectral channels between 645 and 2760 cm-1 (15.5 - 3.63 µm)
- with a spectral resolution of 0.25 cm-1 after apodization (0.50 cm-1 for IASI)
- a reduction of the radiometric noise by at least a factor of 2 as compared to IASI on MetOp (factor of 2 on the spectral resolution, sampling and the radiometric noise).
• Phase-A studies at CNES since January 2010, end in April 2012.
• Two industrial studies have been conducted in parallel (Airbus DS-France and Thales Alenia Space-France).
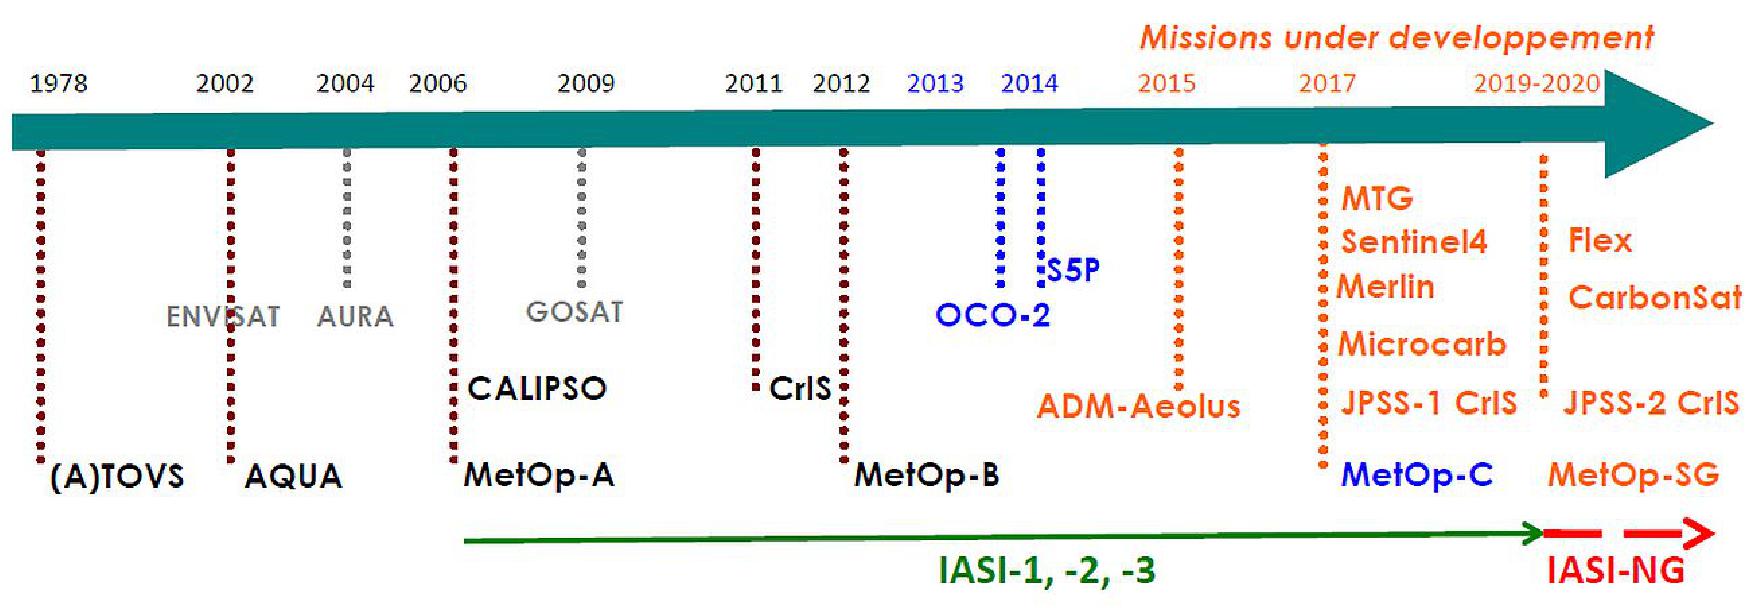
The Table 1 gives the main instrument requirements. These new needs exhibit a spectral resolution and a signal-to-noise ratio improved by a factor two compared with IASI. First idea to fulfill the requirements is, compared to IASI, to increase the interferometer OPD (Optical Path Difference) range (to obtain the desired spectral resolution and spectral sampling) and to increase the pupil size and/or the time observing the signal to cope with the radiometric noise.
Characteristic | Requirement | Value |
Geometry | sounding point size | IASI like (~12 km) |
Radiometry | radiometric calibration error | 0.25 K @ 280 K |
Spectral | continuous spectral covering | IASI (from 3.6 to 15.5 µm) |
Increasing pupil size is rapidly difficult due to mass and volume needs for the instrument. Increasing the time of observation is possible by increasing the instantaneous FOV (Field of View) of the instrument because we also want to have the same on ground spatial sampling as IASI. - However, it is well known that increasing the OPD range and increasing the FOV in a classical Michelson interferometer lead to increase the so-called self-apodization function of the instrument which will lead unavoidably in reducing the spectral resolution. Classical Michelson interferometer requires a compromise between FOV, spectral resolution and signal to noise ratio.
The only way to succeed in fulfilling the requirement is to compensate the self-apodization function due to the FOV. The IASI-NG instrument is based on a classical Michelson interferometer with a Mertz compensator, where a variable plate thickness is introduced in a pupil plane allowing to compensate for each OPD value the optical path difference between the on axis and the off axis rays which is a condition to master the field self-apodization function. This technique allows having a widened field interferometer. One of the originality of the instrument is in the implementation of the OPD and compensation mechanisms with a unique actuator (single motorization).
Instrument description: The overall layout on the instrument is illustrated in Figure 63. The instrument is composed of various subsystems, the following presents a summary of the instrument functions and operations. The beam coming from the observed point on Earth enters the instrument via a reflection on a pointing mirror. A two-axis scan mechanism provides the desired target direction and compensates for satellite velocity during the interferogram acquisition. The required swath (around 2000 km) is covered during a regular cycle which is repeated along the orbit.
In addition to the nominal Earth target acquisition, the scan mechanism allows five dedicated pointing directions to the three instrument calibrations systems:
- One internal blackbody and two deep space views for radiometric calibration
- A Fabry-Perot filter for spectral calibration. The spectral calibration is periodically performed by looking at the cold space through this filter which provides a reference spectrum comb which is used to check the calibration law of the instrument
- An interferometer wavefront calibration, named WFS (Wave Front monitoring System). It uses a source beam, provided by a laser source, sent from the edge of the field mask located in the entrance telescope towards the pointing mirror.
This latter is used in auto-collimation mode to send back the WFS beam into the instrument. The processing of the data acquired with the science detectors of one spectral band allows measuring the interferometer wavefront. These wavefront data are taken into account for ground processing. This operation is foreseen to be performed during commissioning phase and a few times during the mission to check the long-term stability of the interferometer.
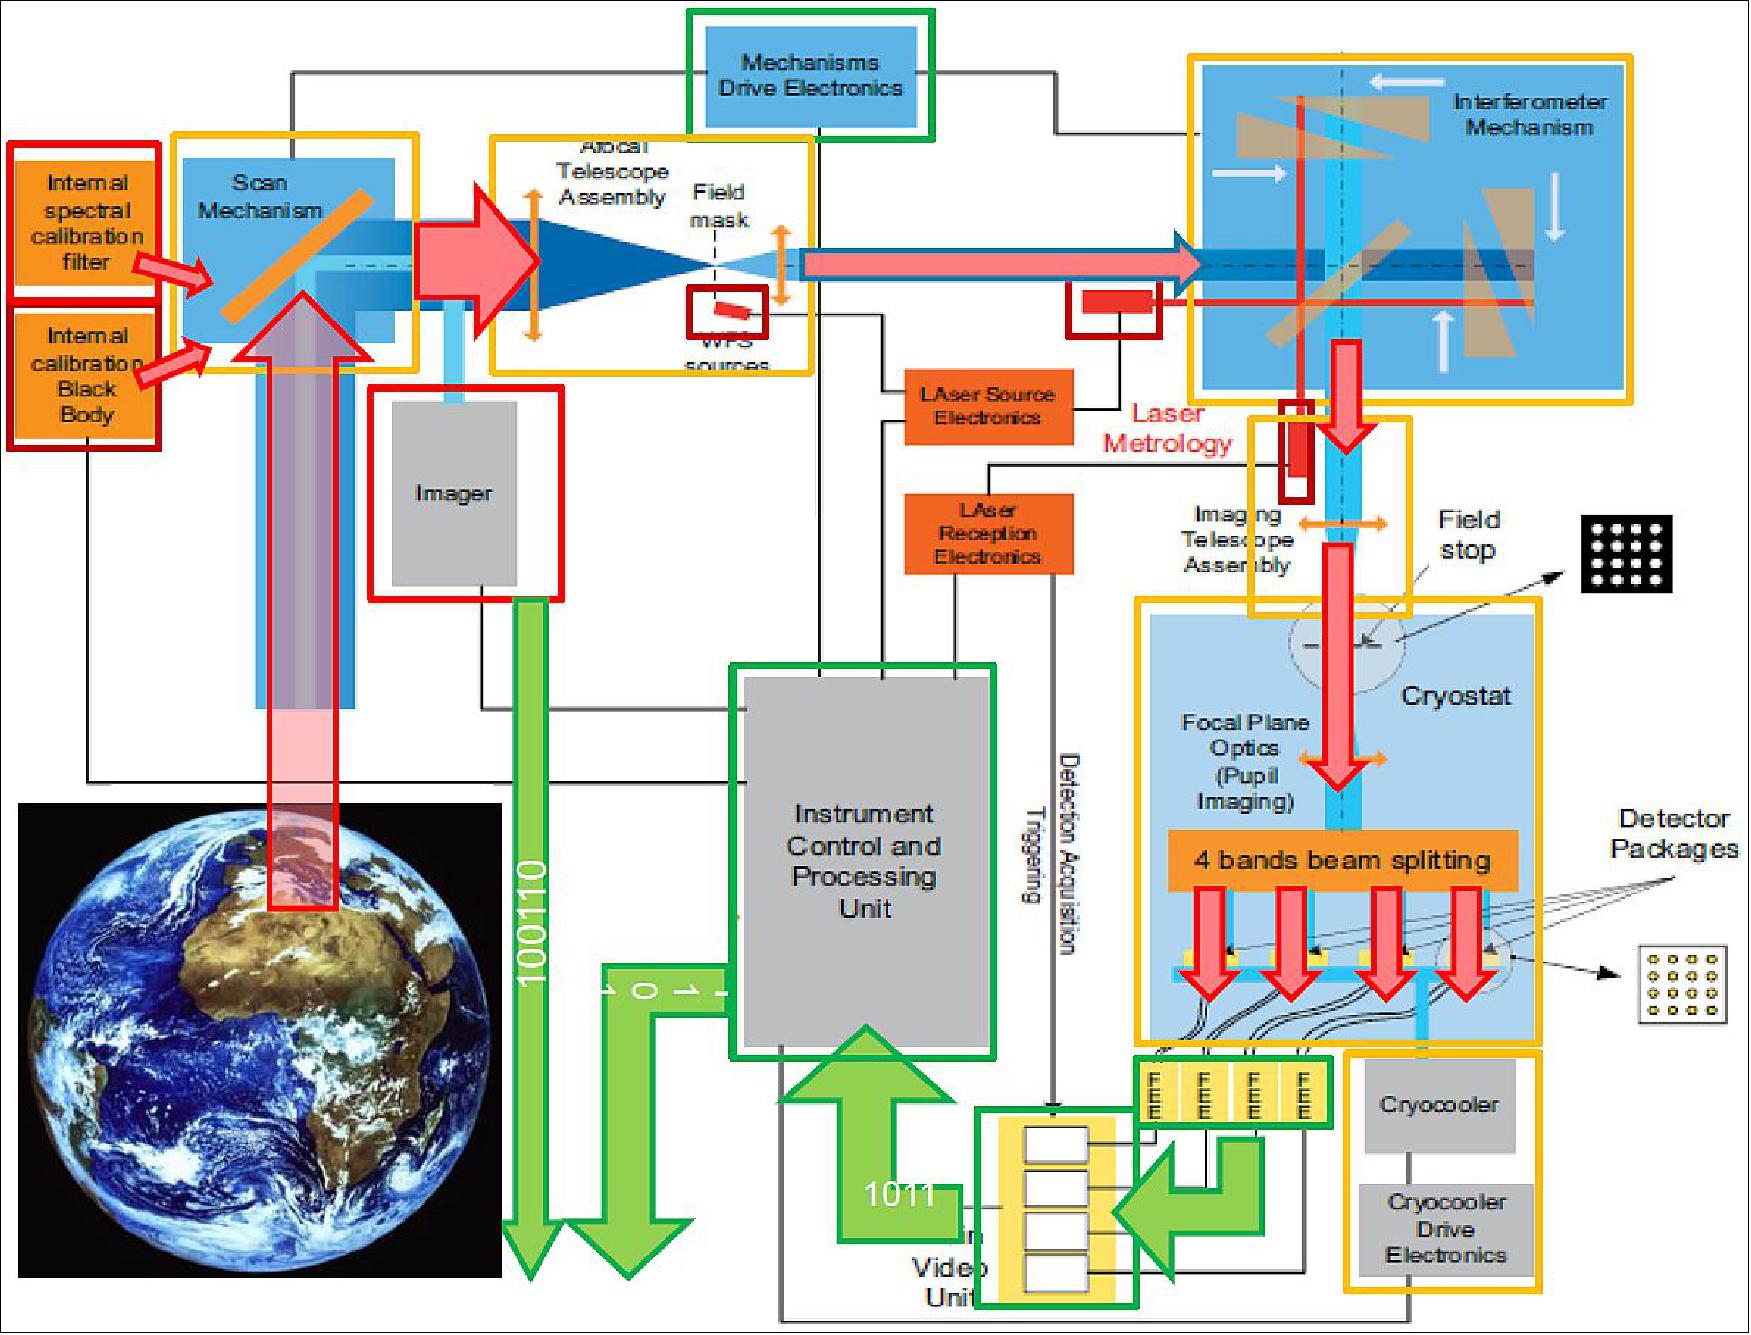
A typical observation sequence consists in pointing the scan mirror successively towards the 14 Earth views to cover the required swath (Figure 64). It is then switched towards two successive radiometric calibration positions, one aiming at a reference Blackbody and one aiming at the cold space. This cycle is then repeated automatically and the instrument performs continuous data acquisition throughout the mission lifetime.
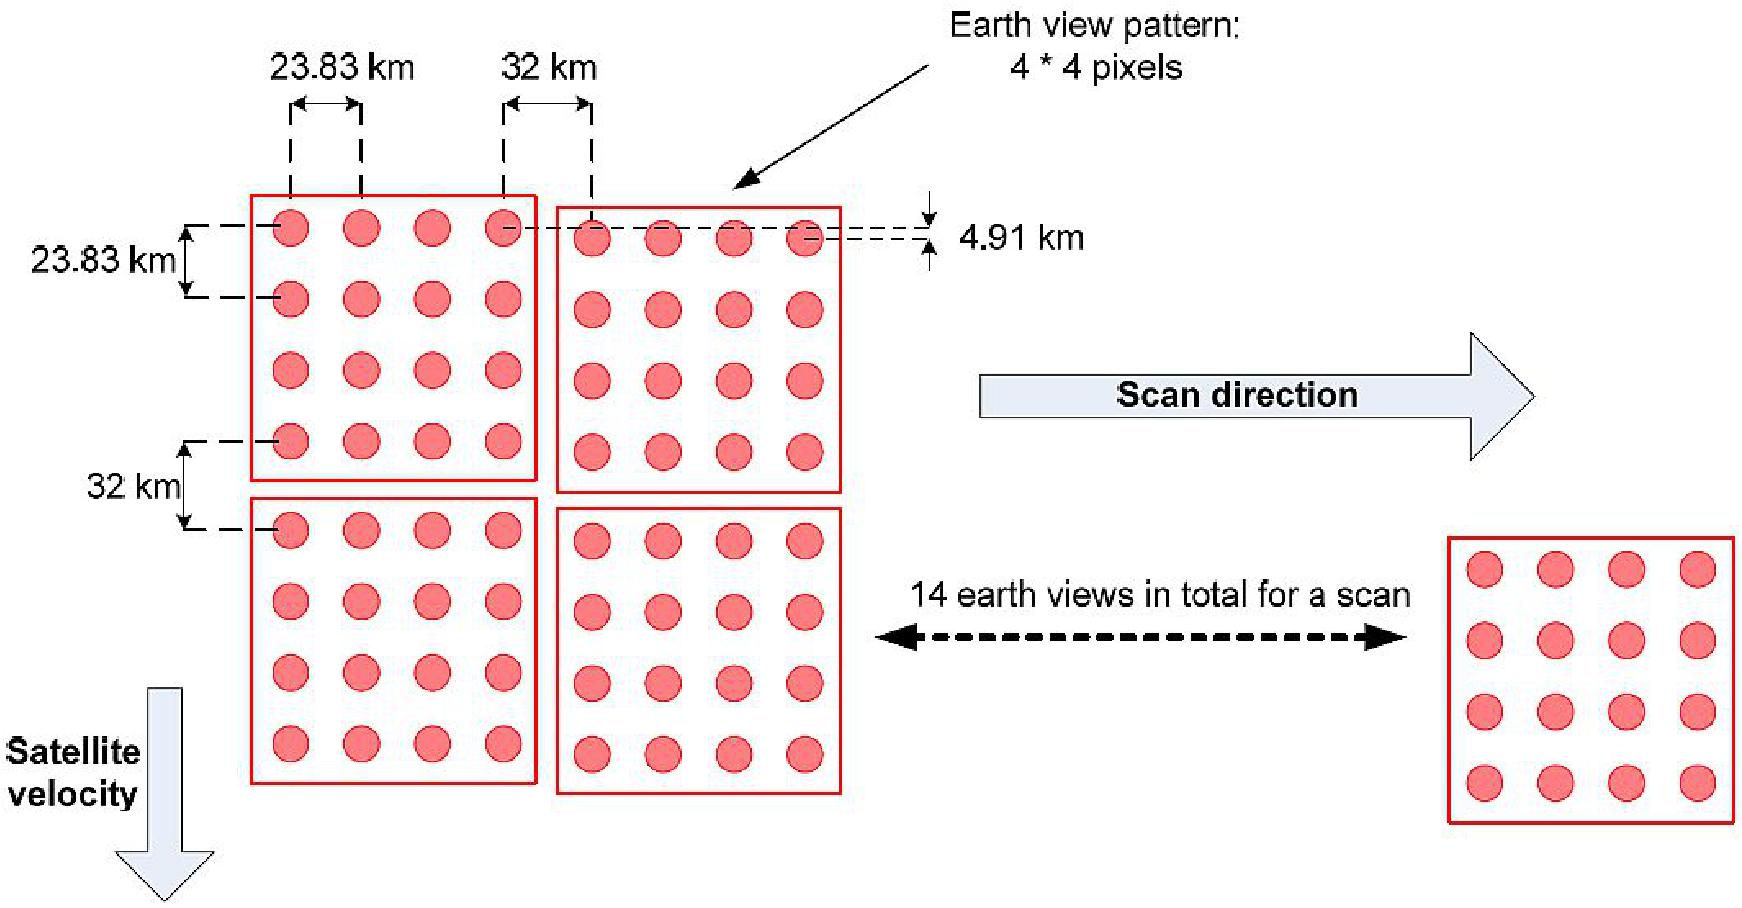
The 90 mm diameter beam then enters the ATA (Afocal Telescope Assembly) which reimages the entrance pupil inside the interferometer, providing a beam diameter reduction ratio of 2.25; the pupil size is reduced to 40 mm at the interferometer level. The resulting field increase is acceptable thanks to the Mertz compensation which allows wide field angles without compromising spectral resolution.
The optical path difference resulting of the interferometer mechanism motion is monitored by the Laser Metrology. A frequency stabilized laser source sends several beams into the interferometer: these beams undergo interferences in the interferometer in the same way as the science beams and specific detectors receive the resulting metrology interference signals. The Laser Reception Electronics acquires and processes these data. A computed OPD is used to synchronize the science detectors acquisitions so that interferogram data are acquired at constant OPD intervals. The laser signals are also used to derive the tilt of the differential wavefront which is used for on ground correction of the instrument spectral response function.
The outgoing beam of the interferometer is then focussed by the Imaging Telescope Assembly onto a field stop located at the cryostat input port: this stop consists in a pattern of four by four holes that define the sounder pixels size and relative positions. The cryostat includes the focal plane cold optics and the detectors. The focal plane optics transmits the signal to arrays of 4 x 4 detectors in a pupil imaging mode. These optics also include three spectral beam splitters in order to separate the beam into the four IASI-NG spectral bands. Table 28 provides the band separation. Compared to IASI a fourth band is needed to fulfil the radiometric noise requirement between 2200 cm-1 and 2760 cm-1.
Band | Wavelength range (λ) | Wave number range (σ) |
B1 | 8.70 - 15.5 µm | 645 – 1150 cm-1 |
B2 | 5.13 - 8.70 µm | 1150 - 1950 cm-1 |
B3 | 4.35 - 5.13 µm | 1950 - 2300 cm-1 |
B4 | 3.62 - 4.35 µm | 2300 - 2760 cm-1 |
The cryostat allows cooling down of the detectors at the operating temperature of 75 K thanks to a pair of redundant active cryocoolers. The signals from the detectors are then read and formatted thanks to an analog FEE (Front End Electronics) before been digitized in the MVU (Main Video Unit) and sent to the ICPU (Instrument Control and Processing Unit).
On board data processing is part of the IPCU. Most of the processing is performed on ground for better flexibility and optimal accuracy. The on-board processing is mostly a “compression” processing to cope with the allocated data rate between the instrument and the platform (6 Mbit/s, the raw instrument data rate being ~120 Mbit/s). So, the on-board processing includes correction of the non-linearities and determination of the ZPD (Zero Path Difference) position on the interferograms prior to the FFT (Fast Fourier Transform) giving real and imaginary terms of the radiance spectrum. After a lossless compression, the spectra are downlinked together with the metrology tilt data. The sequence of on-ground processing performs the self-apodization correction using the metrology tilt data, spectral calibration using the Fabry-Perot views and radiometric calibration using the blackbody and cold space interferograms. The ICPU contains also the control electronics of the instrument. It provides the power distribution function, the TM/TC interfaces and the interface with the satellite SpaceWire bus. It also performs the instrument FDIR (Failure Detection, Isolation and Recovery) management, the thermal control and the sequencing of the activities.
The IASI-NG instrument needs also to geolocate the sounding points. This is done thanks to the use of the geo-localization of METimage instrument images (multiband imager present on METOP-SG ) and co-registration with IASI-NG sounding pixels. The coregistration is ensured by a dedicated integrated infrared imager (IMA) inside the IASI-NG instrument. This imager uses an uncooled microbolometer in the 10.5-12.5 µm band.
Interferometer description: The interferometer is a Michelson interferometer modified to introduce a compensation of field self-apodization. The principle of the compensation technique is to introduce in one arm of the interferometer a thick plate to limit the evolution of the OPD (Optical Path Difference) range in the field (which is the aspect to be suppressed). 62)
It is easy to show that there is a relation between the OPD, the mirror displacement D, the plate thickness (e) and the optical index (n) of the plate.
On axis this relation is: OPD = 2 [D + e(n-1)] → Equation (1)
The paraxial condition of the compensation is fulfilled when D, e, n vary simultaneously like: D = e (n-1)/n → Equation (2)
For a classical Michelson at OPD=0, the interferometer has no field effect and it is so equivalent for the Mertz to D=0, and so to e=0. The technical challenge is to be able to continuously adapt the plate thickness (e) with the displacement mirror variation (D), that is to say somewhere to synchronize two mechanisms: one for the displacement mirror and another one to adapt the plate thickness to the considered displacement. In the proposed concept the compensation is performed simultaneously with the displacement mirror scan thanks to a dedicated interferometer mechanism principle called the DSM (Dual Swing Mechanism).
This interferometer principle is based on an alternate translation of two pairs of optical prisms in opposite directions (dual swing motion). Each arm contains an IP (Internal Prism) and an EP (External Prism). IP and EP are mounted head to toe and by the way, the set IP+EP could be considered as a parallel face blade. A reflective coating will be deposited on the outside face of the EP, so the outside face of EP could be considered as a plane mirror for the interferometer.
The OPD is obtained by moving EP (the mirror on the outside face) in one side in an arm and in the other side in the other arm (this also reduces the need of stroke for the mechanism). The movement is in the plane of the hypotenuse of EP. To cope with the compensation condition, the IP movement must be such that the images of each outside mirrors are always at the same position at the exit of the interferometer.
OPD is obtained by moving EP (the mirror on the outside face) in one side in an arm and in the other side in the other arm (this also reduces the need of stroke for the mechanism). The movement is in the plane of the hypotenuse of EP. To cope with the compensation condition (Eq. 2) the IP movement must be such that the images of each outside mirrors are always at the same position at the exit of the interferometer.
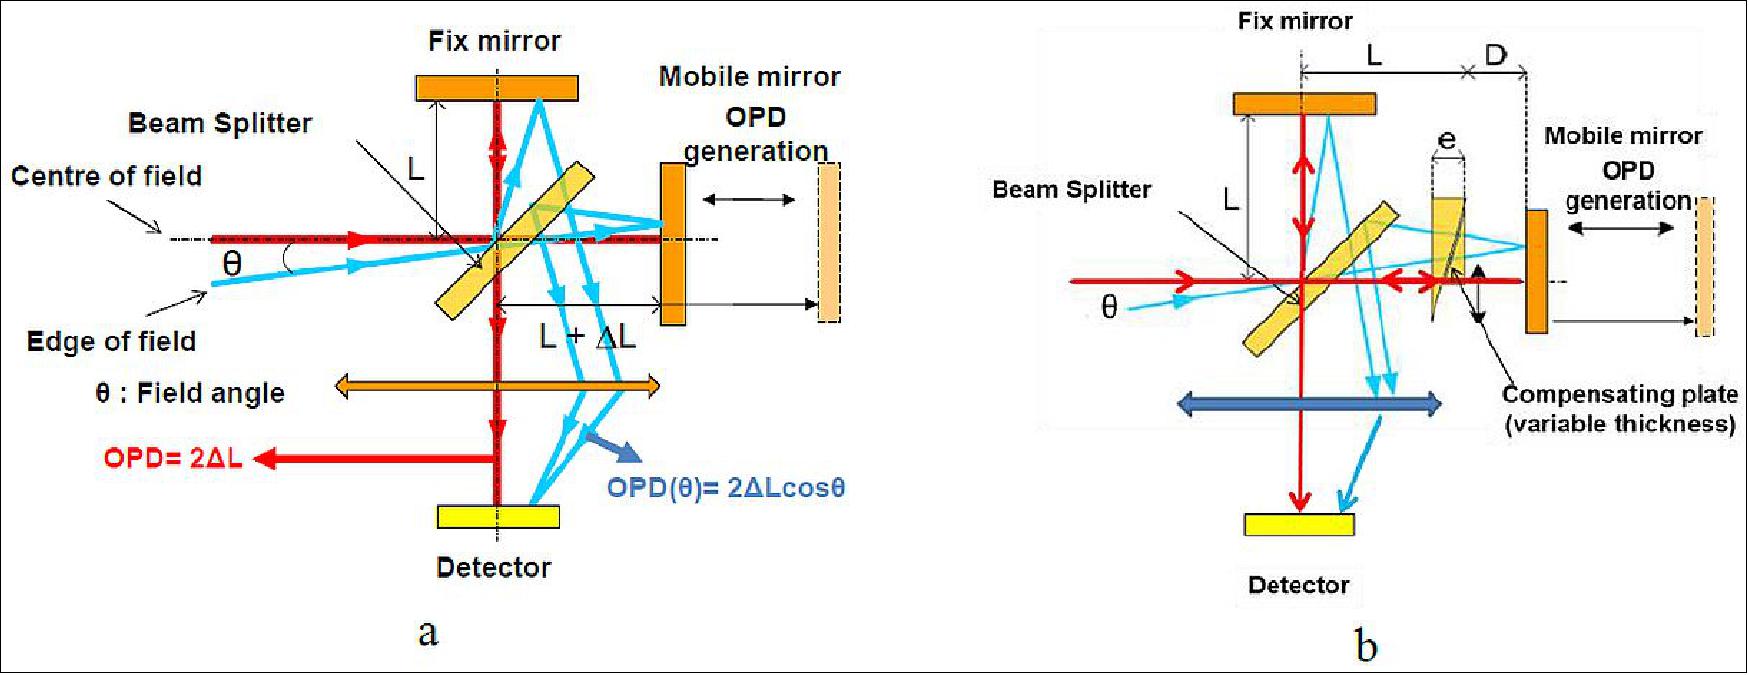
Hence, to do that, in the arm where the EP goes backward (distance increase between EP mirror and beam splitter), the plate thickness has to increase and in the arm where the EP goes forward (distance decrease between EP mirror and beam splitter) the plate thickness has to decrease (Figure 66).
To implement the mechanical displacement, two IPs are mounted on the same supporting frame head to toe (first swing) and the two EPs are mounted on another frame (second swing) head to toe (and of course each IP is mounted head to toe wrt its EP). The adequate movement of translation between the prisms is provided by deformable parallelogram principle. Composed of four articulated levers, the parallelogram provides by its deformation a differential translation between two of its levers, the frames supporting the optical parts as represented on Fig. 6. The resulting frame motions translate the prisms transversely to the optical beam, generating the variation of both mirror and plate thickness. The ratio of thickness variations being obtained by the ratio of the actuation radius of the two frames, and so the accuracy of the compensation, that is to say the synchronization of the mirror displacement and the plate thickness variation, is obtained purely by mechanical considerations. The circular motion of the lateral panels also generates a pure translation (transverse motion) of the prisms which has no effect on the optical performance because the variation is identical on both interferometer arms.
Hence, the design employs a plane mirrors interferometer, where the DSM has to ensure a dual swing motion of the prisms with minimum parasitic tilts together with a sufficient high kinematic stability along the stroke.
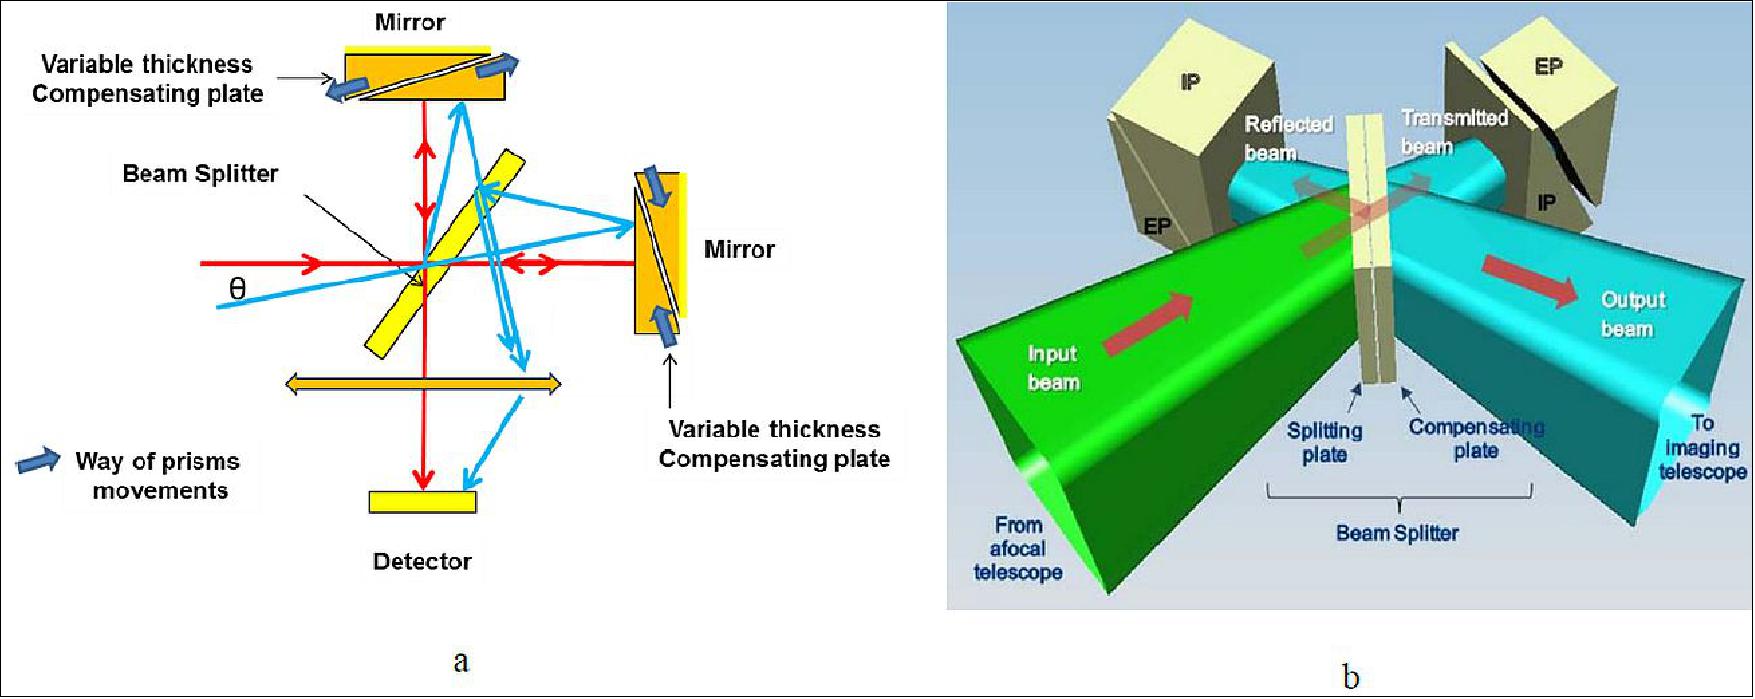
Acquisition chain: In parallel with the development of the optical chain, the development of the detection chain has also to be conducted to master the overall instrument development plan. The IASI-NG detection chain may seem comparable to IASI’s one, but it is quite different in its operating point and implementation.
General organization: The detection chain is composed of DP (Detector Packages), analog FEE (Front End Electronics) and the MVU (Main Video Unit). The science domain has been divided into 4 bands and there will be 4 x 4 detectors in each band. In order to minimize the mission unavailability in case of a failure, the detection chain architecture is organized to lost non- adjacent pixels and no more than 25% of the useful pixels in case of failure of an equipment in the chain. That is to say, that the chain is divided into 4 groups of 2 x 2 pixels in each band, each group being independent of the others and composed of non-adjacent pixels as illustrated in Figure 67.
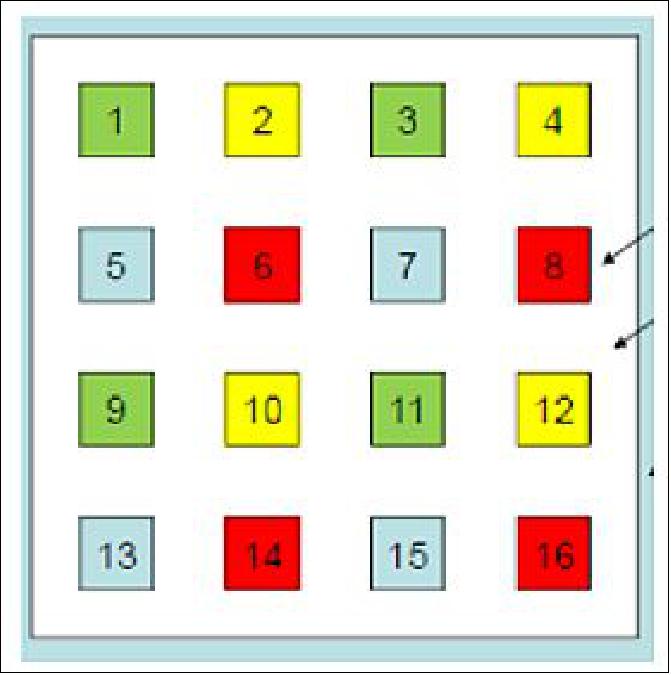
B1 chain: The B1 band will be made with an array of 4 x 4 PC MCT (Photoconductive Mercury Cadmium Telluride) detectors. To improve the responsivity each monolith detector will be “multi-striped” (Figure 68) to increase impedance and thereby reduce the need for very low noise floor of the downstream electronics. Use of this kind of detectors is made possible thanks to the pupil imaging. Use of PC detectors for band B1 also allows getting the right detectivity with reasonable cooling. Several mock-up have already been fabricated and tested and show preliminary performances in line with the needs.
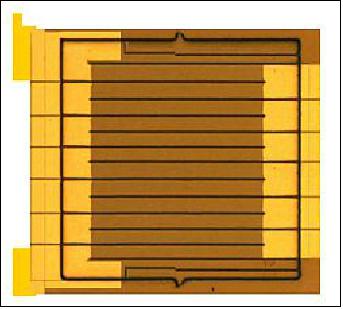
Instrument budgets: The IASI-NG instrument will be composed of two modules:
• An Optical Head (called I-OH) that mainly includes optomechanical parts of IASI-NG instrument, for the sounder and the imager
• An Electronics Module (called I-EM) that includes most of the electronics, except for the FEE, kept close to cryostat, the Imager Video Electronics located in the vicinity of the imager optics and the LASE (Laser Source Electronics), which is located inside the I-OH to avoid having optical fibers between the two modules.
The volume of the two modules is given in Figure 69. The mass allocation for the overall instrument is 360 kg and the power budget is about 500 W.
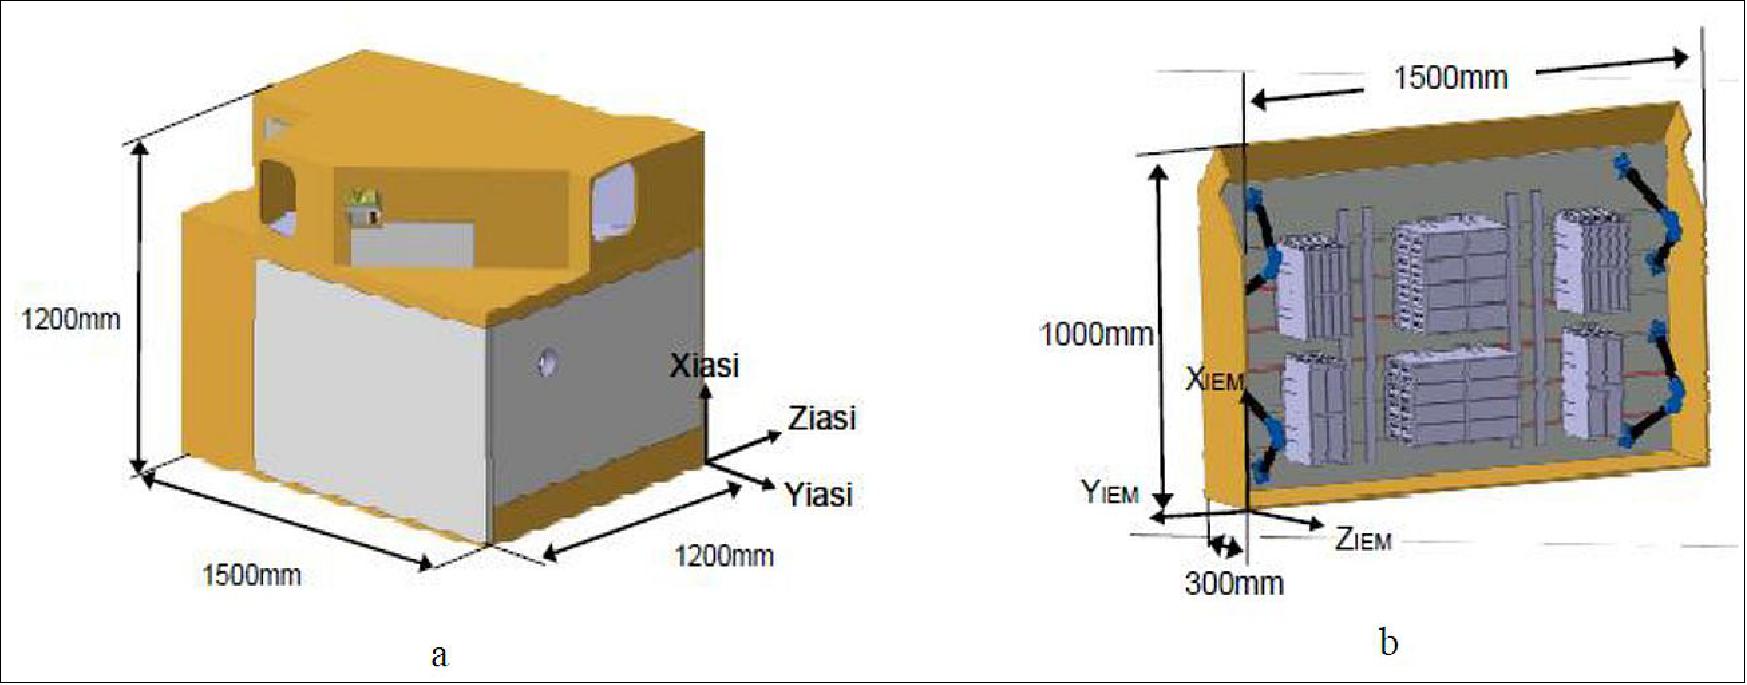
Parameter / characteristic | Description |
Instrument principle | Bilateral Michelson interferometer with a Mertz compensator |
Swathwidth coverage | 99.4º |
Instrument FOV (Field of View) | 4 x 4 pixels in a box of 100 km x 100 km |
Sounding pixel size | Equivalent to circle of 12 km in diameter at nadir |
Pupil size | 90 mm (40 mm in IFM, reduction ratio 2,25) |
Cycle scan | 14 EW + 2 calibrations + 3 transitions, cycle duration: ~15.6 s |
Spectral sampling | Constant OPD (Optical Path Difference) sampling |
Radiometric calibration | 1 BB (Blackbody) and 1 CS (Cold Space) on each line |
Spectral calibration | Fabry-Perot and associated Model of the instrument |
Optics | Input telescope and imagery telescope: TMA (Three Mirror Anastigmat) optical design |
Detector package | PC mono-elements in B1. |
Cryocooling | Active redundant cryocooler. Focal plane at 75 K |
On-board metrologies | Several lasers: OPD & tilt measurement |
Imager | Integrated and based on microbolometers |
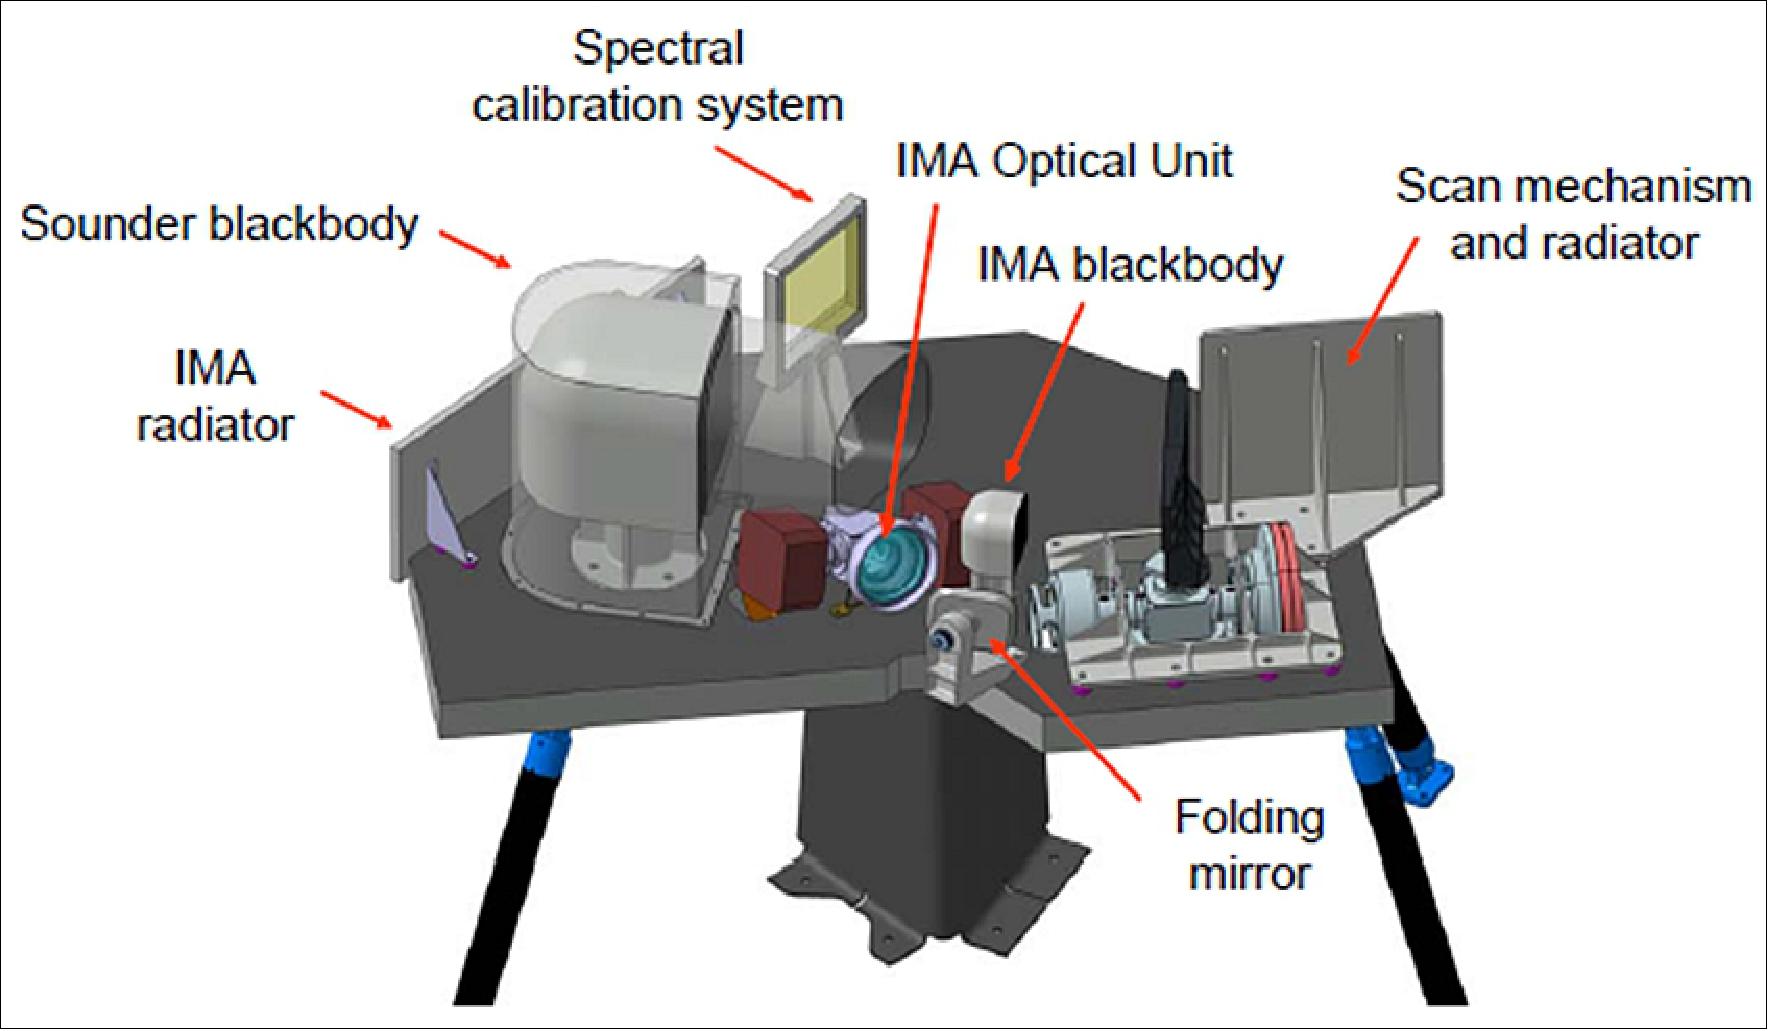
IASI-NG Instrument
IASI-NG instruments will be 2 times more performing than its predecessor IASI, on radiometric noise and spectral resolution performances. Users’ applications in meteorology, atmospheric chemistry and climatology will be improved noticeably by these enhanced instrument performances (Ref. 56).
This induces technological innovations. The IASI-NG instrument concept is not a direct follow-up of IASI on a technological point of view. Due to volume and mass constraints it was not possible to improve IASI radiometric performances by increasing the pupil size. The chosen solution is to increase the Field Of View (FOV) size and thus the integration time. The resulting FOV is in the order of 100 x100 km2. The spectral resolution and sampling are divided by two by doubling the Optical Path Difference (OPD) of the interferometer to about 8 cm in total (± 4 cm).
Unfortunately, Michelson interferometers present a so called self-apodisation effect which reduces the signal level when one increases the FOV and the OPD range. Contrarily to the previous IASI instrument, this effect would reduce the signal to null before reaching the extreme OPD with the IASI -NG parameters. It is thus mandatory to compensate this effect to get a sufficient signal level. IASI -NG instrument concept proposed by Airbus D&S and selected by CNES is based on a Mertz Interferometer allowing to assess the Self Apodization issue by a Field Effect Compensation.
The chosen solution consists in putting in the optical path a refractive material which thickness changes with the OPD (Ref. 62). This is made by having two opposite prisms moving synchronously with the OPD change. A patented mechanism allows performing simultaneously the OPD scan and the compensation using a single actuator. IASI-NG will be the first implementation for a Space Mission of a Mertz Interferometer concept.
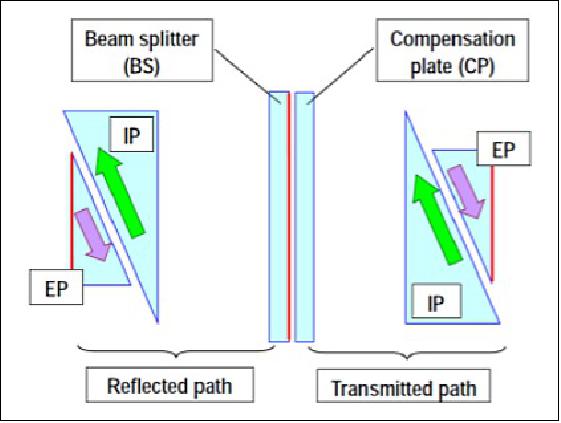
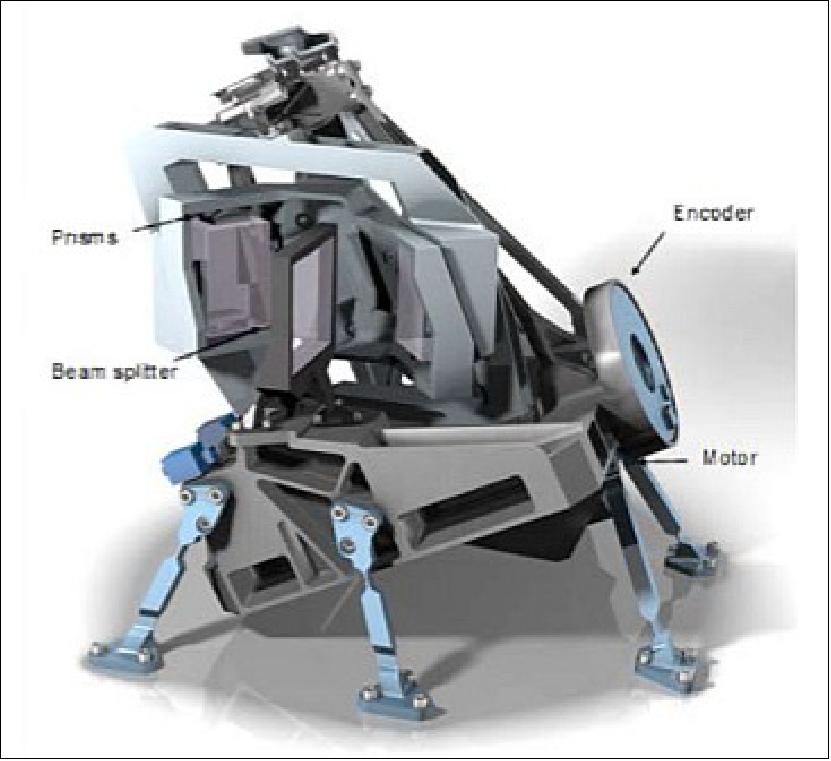
Instrument status: Major milestones of the Instrument development have been already achieved. The Critical Design Review of the instrument has been successfully concluded early 2020 with consolidation of instrument definition. The performances estimation is in line with the specification. A complete test campaign has been completed on the EM (Engineering Model) model decomposed as follows:
- Mechanical Qualification of the Interferometer
- Integration of Optical module and Electrical Module
- Functional and EMC tests
- Micro Vibration characterization.
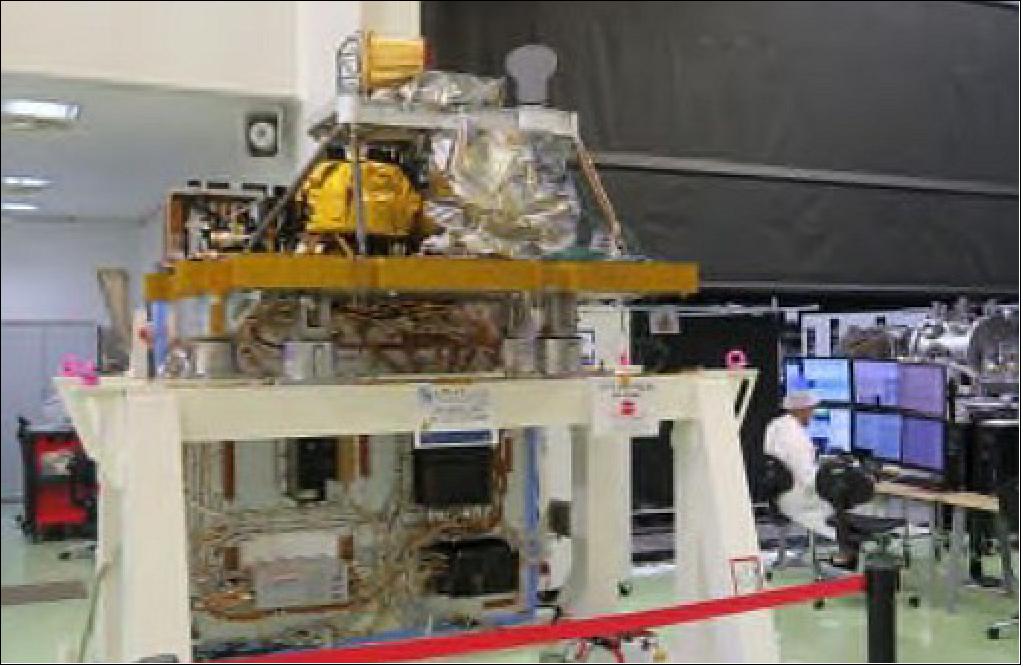
A first successful consolidation of the microvibration performances based on tests at subsystem and EM instrument level has been achieved according to the following objectives:
- Verification of the frequencies and levels of the sources at instrument level with transfer functions measurements
- Verification of the interferometer sensitivity to micro vibrations: ratio between Pupil Wave Front Tilts and internal sources levels
- Verification of the micro vibrations correction at ISRF level.
These micro vibration test campaign allowed to characterize the level of micro vibration generated by instrument sub system (as mechanism or cryocooler) and confirmed our capacity to correct these effects.
Further to complete functional tests campaign a conducted EMC qualification was also successfully performed on the EM instrument in summer 2021 with no major concern on EMC susceptibility raised.
On the first flight model of the instrument, different qualification and performances tests at subsystem level have been already performed:
- On the Focal Plane Cryostat Assembly subsystem equipped with the Infra -red detectors, the cold optics, the cryocoolers and the detection chain electronics
- On the Interferometer with the device mechanism electronics.
These tests showed very promising Instrument performances level 64)
The integration of the instrument flight model already started and is near completion. On one side, the sub-systems of the Optical module have been integrated and aligned. This phase corresponds to the positioning of the various sub-systems on the instrument baseplate, as well as intermediate optical verification of Pupil & field determination, or metrology alignment verification.
On the other side, the integration and coupling of all the sub systems of the Electronics Module is ongoing. The overall instrument integration sequence will be completed in fall 2021.
The test sequence on the PFM (Proto-Flight Model) instrument will then start with the mechanical environment acceptance tests, the Radiated EMC test campaign and the final full instrument performance test under vacuum early next year. During this test campaign, performances will be checked in vacuum with the highest level of accuracy through the instrument internal calibration sources: black bodies, metrology lasers or Fabry-Pérot interferometer but also with external calibration sources as lasers in different bands, black bodies at different temperature, gas cell and so on. Acquisition of sun spectra in real atmospheric condition is also considered.
The conclusion of the flight model test campaign is expected early 2022 for a mounting onto the MetOp-SG A1 PFM satellite platform.
The IASI-NG PFM instrument will participate in 2022 and 2023 to the full campaign testing with the other instruments embarked on MetOp-SG-A payload: Mechanical and Thermal vacuum testing, micro vibrations and electromagnetic emissions compatibility with the platform and other instruments will be checked.
Finally, further to a launch campaign and a launch from Kourou Space Center, CNES will perform the In Orbit Verification and then the Calibration and Validation phase before dissemination of data to the users which are eager to receive these new generation data.
In summary, the IASI-NG program already achieved some major development milestones as consolidation of instrument definition, validation of data algorithm processing and assessment of promising mission performances.
The completion of the exhaustive flight model instrument qualification and performances test campaign is expected early 2022. IASI-NG PFM instrument will then participate in 2022/2023 to the MetOp-SG-A1 Satellite campaign testing.
CNES will perform the In Orbit Verification and the Calibration and Validation phase after the launch.
References
1) Peter Schlüssel, “Post-EPS user and mission requirements for future sounders,” EUMETSAT, Oct. 25, 2010, URL: http://airs.jpl.nasa.gov/nasa-sounder-workshop/slides/Schluessel_Post-EPS.ppt.pdf
2) “ESA takes first steps towards MetOp Second Generation,” ESA, March 9, 2011, URL: http://www.esa.int/esaLP/SEMKVNXTVKG_index_0.html
3) “EUMETSAT - Monitoring weather and climate from space,” ESCON (European Space Components Conference) 2011, Noordwijk, The Netherlands, March 15-17, 2011, URL: https://escies.org/download/webDocumentFile?id=49181
4) “EUMETSAT Council approves EPS-SG Preparatory Programme and extends Indian Ocean service,” EUMETSAT Press Release, Nov. 16, 2012, URL: http://www.eumetsat.int/Home/Main/News/Press_Releases/825429?l=en
5) “Taking Weather forecasting into the future,” ESA, May 20, 2014, URL: http://www.esa.int/Our_Activities/Observing_the_Earth/The_Living_Planet_Programme/Meteorological_missions/Taking_weather_forecasting_into_the_future
6) Rob Oremus, ”MetOp-SG – Polish Industry Day,” Warsaw, Poland, May 7, 2015, URL: https://www.nauka.gov.pl/g2/oryginal/2015_05/a6ebbace78f15a6275e32df6897bdd67.pdf
7) “MetOp Second Generation instruments,” ESA, March 9, 2011, http://www.esa.int/esaLP/SEM95PXTVKG_LPmetop_0.html
8) Peter Schlüssel, “EUMETSAT Polar System – Second Generation,” ITSC-18 (International TOVS Study Conferences), Toulouse, France, March 21-27, 2012, URL: http://cimss.ssec.wisc.edu/itwg/itsc/itsc18/program/files/Schluessel-EUMETSAT-Polar-System-Second_Generation.pdf
9) “Europe secures new generation of weather satellites,” ESA, October 16, 2014, URL: http://www.esa.int/Our_Activities/Observing_the_Earth/The_Living_Planet_Programme/Meteorological_missions/Europe_secures_new_generation_of_weather_satellites
10) ”EUMETSAT and NOAA sign Polar System Program Implementation Plan,” EUMETSAT, Dec. 21, 2016, URL: http://www.eumetsat.int/website/home/News/DAT_3319255.html
11) Rob Oremus, “MetOp-SG: consortia, planned tender actions and possibilities for Polish entities,” Earth Observation Industry Day, Warsaw, Poland, 07 May 2015, URL: http://www.nauka.gov.pl/g2/oryginal/2015_05/a6ebbace78f15a6275e32df6897bdd67.pdf
12) M. Betto, H. Barré, G. Mason, D. Pawlak, P. Damilano, M. Pendaries, U. Schull, R. Fayard, ”MetOp Second Generation - System Overview,” EUMETSAT 2016 Meteorological Satellite Conference, Darmstadt, Germany, Sept. 26-30, 2016, URL: http://www.eumetsat.int/website/home/News/ConferencesandEvents/DAT_2833302.html
13) “Airbus Defence and Space signs MetOp-SG meteorological satellites prime contract with ESA,” Airbus DS, Oct. 17, 2014, URL: http://absenteeism/airbus-Defence-and-space-signs-metop-sg-meteorological-satellites-prime-contract-with-esa/
14) ”Monitoring Weather and Climate from Space,” EPS-SG Overview for CSPP / IMAPP User’s Group Meeting, April 15, 2015, URL: http://www.ssec.wisc.edu/meetings/cspp/2015/Agenda%20PDF/Wednesday/Schluessel_EPS-SG_CSPP_IMAPP.pdf
15) ”MetOp-SG-B scatterometer antenna deployment test,” ESA Applications, 06 April 2022, URL:
16) ”Weather satellite MetOp-SG B rockets ahead,” Airbus Press Release, 07 October 2021, URL: https://www.airbus.com/en/newsroom/press-releases/2021-10-weather-satellite-metop-sg-b-rockets-ahead
17) "Made in Zurich: Basic structure for new generation of weather satellites,” RUAG, 06 May 2021, URL: https://www.ruag.com/system/files/media_document/2021-05/210506_MM_MetOp-SG1B_EN.pdf
18) ”Testing time for MetOp Second Generation,” ESA, 25 November 2019, URL: http://www.esa.int/Enabling_Support/Space_Engineering_Technology/Test_centre/Testing_time_for_MetOp_Second_Generation
19) ”The SENER Group achieves a mission milestone in MetOp-SG,” Sener, 30 May 2019, URL: http://www.aerospace.sener/press-releases/senerachievesmissionmilestoneinmetopsg
20) Veronica Magan,”CPI to Support New Generation Of Meteorological Satellites,” Satellite Today, Nov. 18, 2016, URL: http://www.satellitetoday.com/technology/2016/11/18/cpi-support-new-generation-meteorological-satellites/
21) ”METimage – Next-generation weather forecasts,” DLR, Sept. 20, 2016, URL: http://DLR's/DLR/en/descriptively/tabid-10081/151_read-19352/year-all/#/gallery/24393
22) ”METimage: New Weather Data Every 1.7 seconds,” Airbus DS, Press Release, Sept. 20, 2016, URL: https://airbusdefenceandspace.com/newsroom/news-and-features/metimage-new-weather-data-every-1-7-seconds/
23) ”EUMETSAT and CNES sign agreement for IASI-NG instrument,” EUMETSAT, Dec. 8, 2015, URL: http://www.eumetsat.int/website/home/News/DAT_2869085.html
24) ”EUMETSAT and ESA sign cooperation agreement on MetOp-SG satellite,” EUMETSAT, Oct. 5, 2015, URL: http://www.eumetsat.int/website/home/News/DAT_2804093.html
25) Chung-Chi Lin, Ville Kangas, Salvatore D’Addio, Ilias Manolis, “MetOp-SG studies: Instruments,” 3rd Post-EPS User Consultation Workshop , 29-30 September 2011, Darmstadt, Germany, URL: http://www.eumetsat.int/groups/pps/documents/document/pdf_peps_ucw3_06.pdf
26) Ilias Manolis, Jean-Loup Bézy, Maurizio Betto, Hubert Barré, Graeme Mason, “Metop Second Generation 3MI mission,” Proceedings of the 2012 EUMETSAT Meteorological Satellite Conference, Sopot, Poland, Sept. 3-7, 2012, URL: http://www.eumetsat.int/Home/Main/AboutEUMETSAT/Publications/ConferenceandWorkshopProceedings/2012/groups/cps/documents/document/pdf_conf_p61_s1_02_manolis_v.pdf
27) Marc Loiselet, Ville Kangas, Ilias Manolis, Franco Fois, Salvatore d’Addio, “MetOp Second Generation Payload,” ESA Poster, URL: http://seom.esa.int/LPS13/383b07d3/MetOp-SG_Payload_LVP_poster_4-P-328.pdf
28) Bertrand Thomas, Hugh Gibson, Achim Walber, Michael Brandt, Martin Philipp, Jan Ceru, Oleg Cojocari, Byron Alderman, Harald Czekala, Thomas Rose, “Submillimeter Wave Transmitter/Receiver Devices and Test Equipment For the ICI Instrument Onboard MetOp-SG,” Proceedings of the 3rd Workshop on Advanced RF Sensors and Remote Sensing Instruments (ARSI), Noordwijk, The Netherlands, Sept. 13-15, 2011, URL: http://www.congrex.nl/11c11/ARSI%20papers/THOMAS_ARSI_Paper.pdf
29) N. Cavan, M.E. Humphries, S.D. Lewis, “Preliminary Development of a Long-Life Contactless Power and Data Transfer Module for Next Generation Radiometry Devices,” Proceedings of the 14th European Space Mechanisms & Tribology Symposium – ESMATS 2011, Constance, Germany, Sept. 28–30 2011 (ESA SP-698)
30) Susanne Crewell, Stefan Bühler, Catherine Prigent, “Potential of the Ice Cloud Imaging Instrument within the EUMETSAT Polar System –Second Generation,” URL: http://www.eumetsat.int/groups/pps/documents/document/pdf_peps_ucw3_19.pdf
31) Raquel González Sola, Marc Bergadà Pujades, Massimo Labriola, Miguel Ángel Palacios Lázaro, “The Ice Cloud Imager for Metop-SG: the development challenge has started,” Proceedings of the Advanced RF Sensors and Remote Sensing Instruments &Ka-band Earth Observation Radar Missions, (ARSI'14 & KEO'14), ESA/ESTEC, Noordwijk, The Netherlands, Nov. 4-7, 2014
32) S. A. Buehler, C. Jimenez, K. F. Evans, P. Eriksson, B. Rydberg, A. J. Heymsfield, C. J. Stubenrauch, U. Lohmann, C. Emde, V. O. John, T. R. Sreerekha, C. P. Davis, ”A concept for a satellite mission to measure cloud ice water path, ice particle size, and cloud altitude,” Querterly Journal of the Royal Meteorological Society, Vol. 133, 2007, pp: 109-128, DOI: 10.1002/qj.143, URL: http://www.sat.ltu.se/members/sab/publications/ciwsir_concept/buehler07_ciwsir_qjrms.pdf
33) http://www.wmo-sat.info/oscar/instruments/view/342
34) ”Small but perfectly formed high-frequency radio testing,” ESA, April 10, 2017, URL: http://www.esa.int/Our_Activities/Space_Engineering_Technology/Small_but_perfectly_formed_high-frequency_radio_testing
35) Giulia Pica, G. Alberti, A. Memoli, M. R. Santovito, S. Varchetta, B. Buralli, S. D’Addio, V. Kangas, “MetOp Second Generation: a joint ESA/EUMETSAT mission for weather forecast and climate monitoring with an imaging radiometer,” Proceedings of the 63rd IAC (International Astronautical Congress), Naples, Italy, Oct. 1-5, 2012, paper: IAC-12-B1.3.10
36) Andrea Sacchetti, Tito Lupi, Christian Tabart, Carine Bredin, Franck Bayle, Enrico Vetrano, Nikolas Sidiropoulos, Salvatore D’Addio, “Microwave Imager Instrument for MetOp Second Generation,” Proceedings of the Advanced RF Sensors and Remote Sensing Instruments &Ka-band Earth Observation Radar Missions, (ARSI'14 & KEO'14), ESA/ESTEC, Noordwijk, The Netherlands, Nov. 4-7, 2014
37) “OHB AG: CGS signs contract for the realization of the MWI,” OHB Press Release, Nov. 10, 2014, URL: http://www.dgap.de/dgap/News/corporate/ohb-cgs-signs-contract-for-the-realization-the-mwi/?companyID=408&newsID=823374
38) George Tennant, Graham Sykes, Mike Buckley, Mike Hutchinson, “Microwave Sounder for MetOp-SG,” Proceedings of the Advanced RF Sensors and Remote Sensing Instruments &Ka-band Earth Observation Radar Missions, (ARSI'14 & KEO'14), ESA/ESTEC, Noordwijk, The Netherlands, Nov. 4-7, 2014
39) Ville Kangas , Salvatore D'Addio , Maurizio Betto, Hubert Barre , Marc Loiselet, Graeme Mason, “Metop Second Generation microwave sounding and microwave imaging missions,” Proceedings of the 2012 EUMETSAT Meteorological Satellite Conference, Sopot, Poland, Sept. 3-7, 2012, URL: http://www.eumetsat.int/Home/Main/AboutEUMETSAT/Publications/ConferenceandWorkshopProceedings/2012/groups/cps/documents/document/pdf_conf_p61_s1_09_kangas_v.pdf
40) Franco Fois , Chung-Chi Lin, Hubert Barré, Maurizio Betto, Marc Loiselet Graeme Mason, “MetOp Second Generation Scatterometer Mission,” Proceedings of the 2012 EUMETSAT Meteorological Satellite Conference, Sopot, Poland, Sept. 3-7, 2012, URL: http://www.eumetsat.int/Home/Main/AboutEUMETSAT/Publications/ConferenceandWorkshopProceedings/2012/groups/cps/documents/document/pdf_conf_p61_s1_01_fois_v.pdf
41) Q. Garcia, J. Martinez, M. J. Martin, M. Gutierrez, A. Bernal, A. Trastoy, F. Cespedosa, J. Cardenal, J. Lopez-Mateos, L. Martinez, C. Palacios, C. Limiñana, A. Østergaard, S. Appel, F. Rostan, U. Rauscher, ”MetOp-SG SCA antenna subsystem design,” Proceedings of the TTC 2016 Workshop, ESA/ESTEC, Noordwijk, The Netherlands, 13-16 Sept. 2016
42) Salvatore D'Addio, Ville Kangas, Maurizio Betto, Hubert Barre , Marc Loiselet, Graeme Mason, “Metop Second Generation: Radio Occultation Sounding Mission,” Proceedings of the 2012 EUMETSAT Meteorological Satellite Conference, Sopot, Poland, Sept. 3-7, 2012, URL: http://www.eumetsat.int/Home/Main/AboutEUMETSAT/Publications/ConferenceandWorkshopProceedings/2012/groups/cps/documents/document/pdf_conf_p61_s1_07_daddio_v.pdf
43) Ilias Manolis, Jérôme Caron, Semen Grabarnik, Jean-Loup Bézy, Maurizio Betto, Hubert Barré, Graeme Mason, Roland Meynart, “The MetOp Second Generation 3MI mission,” Proceedings of the ICSO (International Conference on Space Optics), Ajaccio, Corse, France, Oct. 9-12, 2012, paper: ICSO-027, URL: http://congrex.nl/icso/2012/papers/FP_ICSO-027.pdf
44) Ilias Manolis, Semen Grabarnik, Jérôme Caron, Jean-Loup Bézy, Marc Loiselet, Maurizio Betto, Hubert Barré, Graeme Mason, Roland Meynart, “ The MetOp second generation 3MI instrument,” Proceedings of SPIE, Vol. 8889, 'Sensors, Systems, and Next-Generation Satellites XVII,' 88890J, Desden,Germany, October 16, 2013, doi:10.1117/12.2028662
45) Umberto Bruno, Carmine Mastrandrea, Paolo Mosciarello, Riccardo Gabrieli, Franco Boldrini, Massimiliano Porciani, Marie-Noelle Langevin, ”3MI: Muilti-viewing, Multi-channel, Multi-polarization for MetOp-SG,” Proceedings of the 68th IAC (International Astronautical Congress), Adelaide, Australia, 25-29 Sept. 2017, paper: IAC-17-B1.3
46) “DLR und Jena-Optronik unterzeichnen METimage-Vertrag,” DLR, Nov. 15, 2012, URL: http://www.dlr.de/dlr/desktopdefault.aspx/tabid-10081/151_read-5667//year-all/
47) “METimage: Machbarkeitsuntersuchung zu IR-Detektoren,” URL: http://www.dlr.de/rd/Portaldata/28/Resources/dokumente/re/Datenblatt_IR-Detektoren.pdf
48) Matthias Alpers, Christian Brüns, Isabel Zerfowski, “Status of METimageDesign and DevelopmentAn Innovative Imaging Radiometer for the Post-EPS VII Mission,” Post-EPS User Consultation Workshop, Darmstadt, February 3-4, 2009, URL: http://www.eumetsat.int/groups/pps/documents/document/pdf_peps_ucw2_15.pdf
49) F. Schmülling, I. Zerfowski, A. Pillukat, R. Bonsignori, “"METimage : a multispectral imaging radiometer for the EUMETSAT Polar System follow-on satellite mission", Proceedings of SPIE, Vol. 7826, 'Sensors, Systems, and Next-Generation Satellites XIV,' 78260P, Toulouse, France, October 13-20, 2010, doi:10.1117/12.869272; URL: http://www.dlr.de/rd/Portaldata/28/Resources/dokumente/re/SPIE_2010_Toulouse__7826-22_METimage_instrument_paper__6.pdf
50) Isabel Zerfowski, Frank Schmülling, Christian Brüns, “Status of METimage studies,” 3rd Post-EPS User Workshop, Darmstadt, Germany, September 29-30, 2011, URL: http://www.eumetsat.int/groups/pps/documents/document/pdf_peps_ucw3_10.pdf
51) http://www.wmo-sat.info/oscar/instruments/view/603
52) ”EUMETSAT and DLR sign agreement for METimage instruments to fly on Metop-Second Generation satellites,” EUMETSAT, 20 Sept. 2016, URL: https://web.archive.org/web/20200808152231/https://www.eumetsat.int/website/home/News/DAT_3204715.html?lang=EN
53) ”METimage: New weather data every 1-7 seconds,” Airvus DS, 20 Sept. 2016, URL: http://company.airbus.com/news-media/press-releases/Airbus-Group/Financial_Communication/2016/09/METimage--New-Weather-Data-Every-1-7-seconds.html
54) ”The METimage concept,” DLR, URL: http://www.dlr.de/rd/en/desktopdefault.aspx/tabid-2440/3586_read-10140/
55) Oswald Wallner, Thido Reinert, Christoph Straif, ”METimage – A Spectro-Radiometer for the VII Mission onboard MetOp-SG,” Proceedings of the ICSO 2016 (International Conference on Space Optics), Biarritz, France, 18-21 October, 2016, URL: http://esaconferencebureau.com/custom/icso/2016/index.htm
56) F. Bermudo, E. Jurado, A. Penquer, C. Le Fèvred, ”IASI-NG Program Development Status: General Overview,” Proceedings of the 72nd IAC (International Astronautical Congress), 25-29 October 2021, Dubai, UAE (United Arab Emirates), paper: IAC-21-B1.2.2, URL: https://iafastro.directory/iac/proceedings/IAC-21/IAC-21/B1/2/manuscripts/IAC-21,B1,2,2,x63736.pdf
57) Vincent Guidard, URL: http://www.eumetsat.int/groups/pps/documents/document/pdf_peps_ucw3_13.pdf
58) Cyril Crevoisier, Cathy Clerbaux, Vincent Guidard, Thierry Phulpin, Raymond Armante, Brice Barret, Claude Camy-Peyret, Jean-Pierre Chaboureau, Gaelle Dufour, Juliette Hadji-Lazaro, Hervé Herbin, Nicole Jacquinet, Lydie Lavanant, Sébastien Payan, Eric Péquignot, Clémence Piérangelo, Didier Renaut, Claudia Stubenrauch, “IASI-New Generation onboard EPS-SG: Expected impact on accuracy and vertical resolution for atmospheric variables,” ITSC-18 (International TOVS Study Conferences), Toulouse, France, March 21-27, 2012, URL: http://ara.abct.lmd.polytechnique.fr/oral_pub/2012/2012_itsc18_iasing_crevoisier.pdf
59) “IASI-NG (Next Generation),” CNES, URL: http://smsc.cnes.fr/IASI-NG/index.htm
60) ”IASI-NG Mission,” CNES, Feb. 9, 2017, URL: https://iasi-ng.cnes.fr/en/IASI-NG/GP_mission.htm
61) Cyril Crevoisier, Cathy Clerbaux, Vincent Guidard, Thierry Phulpin, Raymond Armante, Brice Barret, Claude Camy-Peyret, Jean-Pierre Chaboureau, Gaelle Dufour, Juliette Hadji-Lazaro, Hervé Herbin, Nicole Jacquinet, Lydie Lavanant, Sébastien Payan, Eric Péquignot, Clémence Piérangelo, Claudia Stubenrauch, “The IASI-NG mission: Scientific objectives and expected results,” 3rd IASI Conference Hyères, France, 4-8 February 2013, URL: http://ara.abct.lmd.polytechnique.fr/oral_pub/2013/2013_iasi_conf_crevoisier.pdf
62) Clement Luitot, Joël Boyadjian, Christian Buil, Frederick Pasternak,”Optical architecture of the new generation infrared atmospheric sounder interferometer (IASI-NG),” Proceedings of SPIE, Vol. 8841, 'Current Developments in Lens Design and Optical Engineering XIV,' San Diego, August 2013, doi: 10.1117/12.2025236
63) ”IASI-NG Imager,” CNES, Feb. 9, 2017, URL: https://iasi-ng.cnes.fr/en/IASI-NG/imager.htm
64) E. Baldit, A. Penquer, F. Bernard, F. Bermudo, F. Faure, B. Calvel, J.F. Pasquier, S. Thomas, V. Crombez “IASI NG instrument performance status” ICSO (International Conference on Space Optics), 30 March- 2 April 2021, URL: https://www.spiedigitallibrary.org/conference-proceedings-of-spie/11852/1185227/IASI-NG-instrument-performance-status/10.1117/12.2599628.full?SSO=1
65) "First version of EPS-SG test data in BUFR format", EUMETSAT, March 8, 2023, URL: https://www.eumetsat.int/first-version-eps-sg-test-data-bufr-format
Spacecraft Development Status Launch Sensor Complement References Back to Top