Meteosat Second Generation
EO
ESA
Atmosphere
Ocean
Meteosat Second Generation (MSG) is a series of climate and forecasting missions developed by ESA and EUMETSAT.
Quick facts
Overview
| Mission type | EO |
| Agency | ESA, EUMETSAT |
| Mission status | Operational (nominal) |
| Launch date | 28 Aug 2002 |
| Measurement domain | Atmosphere, Ocean, Land |
| Measurement category | Cloud type, amount and cloud top temperature, Liquid water and precipitation rate, Atmospheric Temperature Fields, Radiation budget, Surface temperature (land), Vegetation, Surface temperature (ocean), Atmospheric Humidity Fields, Ozone, Atmospheric Winds |
| Measurement detailed | Cloud top height, Downward long-wave irradiance at Earth surface, Cloud cover, Precipitation intensity at the surface (liquid or solid), Cloud type, Cloud imagery, Upward short-wave irradiance at TOA, Upward long-wave irradiance at TOA, Vegetation type, Short-wave Earth surface bi-directional reflectance, Atmospheric specific humidity (column/profile), O3 Mole Fraction, Land surface temperature, Sea surface temperature, Cloud top temperature, Wind profile (horizontal), Atmospheric stability index |
| Instruments | MSG Comms, SEVIRI, GERB |
| Instrument type | Imaging multi-spectral radiometers (vis/IR), Earth radiation budget radiometers, Communications |
| CEOS EO Handbook | See Meteosat Second Generation summary |
Related Resources
Summary
Mission Capabilities
MSG satellites consist of the Spinning Enhanced Visible and Infra-red Imager (SEVIRI) which is a multi-spectral radiometer that is utilised for the monitoring of climate. The instrument monitors atmospheric humidity and temperature fields, atmospheric wind, cloud type, amount and temperature, precipitation rate, ozone, radiation budget and vegetation.
The Geostationary Earth Radiation Budget (GERB) is another instrument on MSG-1 and 2 that functions as an absolute radiometer. The main objective of GERB is to monitor Earth’s radiation budget in terms of climate change, food production, and natural disaster prediction. It achieves this by measuring the top layer of the atmosphere (continuous temporal sampling) or, more specifically, measuring the shortwave and emitted longwave regions of the spectrum. The instrument is composed of two elements, the Instrument Optical Unit (IOU) and the Instrument Electronics Unit (IEU), which function as an imager and data-handling device, respectively.
MSG contains a Geostationary Search and Rescue (GEOS&R) communications payload system with a relay function for search and rescue operations. There is also an onboard data collection system (DCS) that significantly increases the number of relayed message channels.
Performance Specifications
The Spinning Enhanced Visible and Infra-red Imager (SEVIRI) contains 12 spectral channels inclusive of the High Resolution Visible (HRV). Depending on the channel, the Spectral Band Resolution (SBR) ranges from 0.4 to 14.40 um. The instrument has an imaging cycle of 15 minutes, with a swath width of 9km (east-to-west) and 42 active detectors.
The Geostationary Earth Radiation Budget (GERB) instrument has 2 spectral bands, one shortwave solar band (0.32 - 4.0 um) and one longwave total band (0.32 - greater than 100 um). These bands collectively provide a pixel size (resolution) of 44.6 km x 39.3 km at nadir, and include coverage of the Earth by all channels in 15 minutes.
All four satellites are in geostationary orbit with orbit longitudes of 41.5o for MSG-1, 4.5o for MSG-2, 9.5o for MSG-3, and 0o for MSG-4.
Space and Hardware Components
MSG Satellites MSG-1 and MSG-2 relay to the MSG ground segment, which is composed of the Mission Control Centre (MCC), the Primary Ground Station (PGS), and the Backup and Ranging Ground Station (BRGS). Collectively, each ground station provides calibration and data management functions that allow MSG satellites to generate products from constituent instruments (SEVIRI & GERB).
There are also numerous Satellite Application Facilities (SAF) that are maintained by European Union members and utilise MSG data. The SAF on Ocean and Sea Ice is hosted by France, the SAF on support nowcasting is hosted by Spain, the SAF on climate monitoring is hosted by Germany, the SAF on numerical weather prediction is hosted by the United Kingdom, and the SAF on land surface processes is hosted by Portugal. Together, data points generated by each member allow for the cohesion of the MSG satellites in producing reliable and accurate data for end-users.
Meteosat Second Generation (MSG) Spacecraft Series
Spacecraft Launch Mission Status Sensor Complement Ground Segment References
The first generation Meteosat series (Meteosat-1 to -7) of EUMETSAT is gradually being replaced by a second generation series (MSG) with a launch of the first satellite MSG-1 on Aug. 28, 2002, to be followed by three more satellites, ensuring operational continuity in GEO for at least 16 years. MSG-1 became Meteosat-8 on Jan. 29, 2004 when the mission was declared “operational” (i.e., commencement of routine operations after the end of the commissioning phase).
Note: Prior to launch, the satellite series is referred to as MSG. EUMETSAT assigns a new name, namely “Meteosat-x” after launch and after on-orbit commissioning starting with the commencement of routine operational services
The MSG program definition started in 1993, the phase C/D began in 1995. The program is funded by the European Space Agency (ESA) and the European Organization for the Exploitation of Meteorological Satellites (EUMETSAT) according to the following share of responsibilities:
• ESA is responsible for designing and developing the first of the four satellites in the MSG program (the fourth S/C of the MSG series was approved in 2003).
• EUMETSAT has overall responsibility for defining the end-user requirements, developing the ground segment and procuring the launchers. EUMETSAT is also the operator of the MSG system. EUMETSAT is contributing about 30% of the development costs for MSG-1 and fully financing the three subsequent flight units (MSG-2, MSG-3, and MSG-4).
The MSG program is planned as a two-satellite operational service, like the first-generation Meteosat system, where one satellite is available in orbit as a spare. The MSG system provides the user community with continuity of services from the first-generation Meteosat system, but with significantly enhanced services and products.
MSG is designed to support nowcasting, very short and short range forecasting, numerical weather forecasting and climate applications over Europe and Africa, with the following mission objectives:
• Multispectral imaging of the cloud systems, the Earth surface and radiance emitted by the atmosphere, with improved radiometric, spectral, spatial and temporal resolution as compared to the first generation Meteosat
• Extraction of meteorological and geophysical fields from the satellite image data for the support of general meteorological, climatological and environmental activities
• Data collection of data from data collection platforms (DCP)
• Dissemination of the satellite image data and meteorological information upon processing to the user community in a timely manner for the support of nowcasting and very short range forecasting
• Support to secondary payloads of scientific or pre-operational nature (GERB) and Search & Rescue (called GEOSAR) in supporting operations which are not directly relevant to the MSG program
• Support to the primary missions (e.g. archiving of data generated by the system MSG, for successful operation of the system etc.).
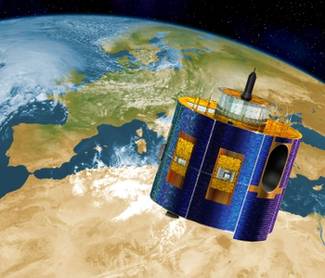
Spacecraft
The MSG satellites are being built by a European industrial consortium led by Alcatel Space Industries (ASI) of France. MSG satellites are spin-stabilized (cylindrical in shape, similar to the first generation S/C series) with a rotation speed of 100 rpm. The S/C body is a cylindrical-shaped solar drum, 3.2 m in diameter and 3.7 m in height (2.4 m body height) with stepped cylinder. The major subsystems of the platform are: AOCS (Attitude and Orbit Control Subsystem), EPS (Electrical Power Subsystem), UPS (Unified Propulsion Subsystem), and DHSS (Data Handling Subsystem). 1) 2) 3) 4) 5)
• AOCS: Attitude is measured by means of Earth sensors and sun sensors. AND (Active Nutation Damping) is used during GTO; there is no AND in the GEO phase. In addition, AOCS provides synchronization signals to keep the SEVIRI, GERB, and the electronically de-spun antenna Earth-pointing.
• EPS (Electrical Power Subsystem): Solar power of 600 W EOL is provided to the S/C bus 28 V power bus. Two NiCd batteries provide 1200 Wh for ecliptic operations support. The solar array is composed of 8 body mounted panels, based on CFRP (Carbon Fiber Reinforced Panel) substrate. The solar network utilizes 7854 Silicon High Eta cells delivering a beginning of life power of 740 W. 6)
• UPS: A bi-propellant unified propulsion system of two 400 N apogee engines are used for a 3-burn insertion from GTO into GEO. Four tanks hold up to 976 kg of propellant. About 810 kg are used for the GEO insertion of MSG.
• DHSS: The system consists of three units: CDMU (Central Data Management Unit) and two RTUs (Remote Terminal Units). CDMU and RTUs are interconnected via the serial standard OBDH (On-Board Data Handling) data bus of ESA.
The software design of the S/C provides a high level of onboard autonomy, the main requirement being spacecraft survival after a single onboard failure during 24 hours without ground intervention.
This implies an elaborate FDIR (Failure Detection, Isolation and Recovery) capability, allowing to detect any malfunction and perform the necessary recovery/reconfiguration action autonomously. It also implies a high level of robustness against failure of the CDMU proper, which requires the autonomous switch-over of the processor unit and a restart with context saving of the onboard software. Special emphasis was also put on the possibility to easily modify the monitoring parameters and thresholds and the corrective actions triggered by the monitoring, without having to resort to software patches. Instead, specific telecommands were introduced for the modification of these parameters.
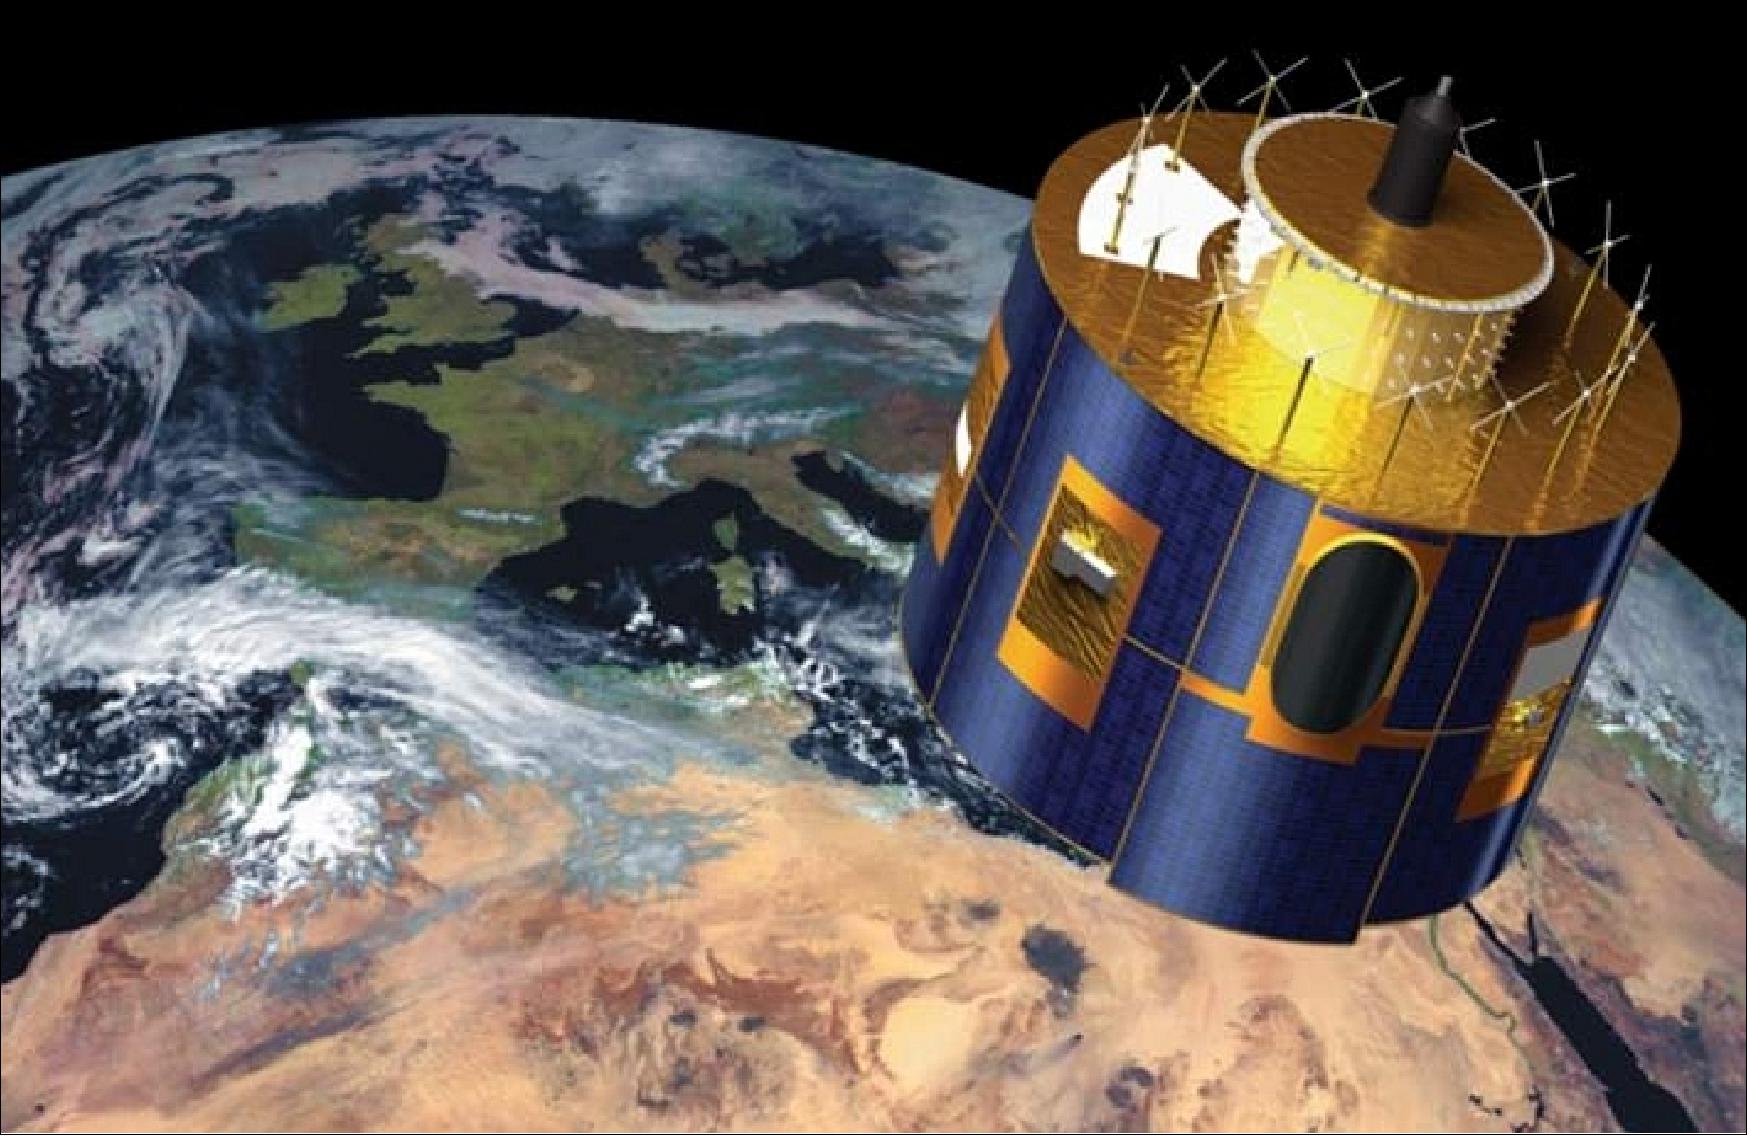
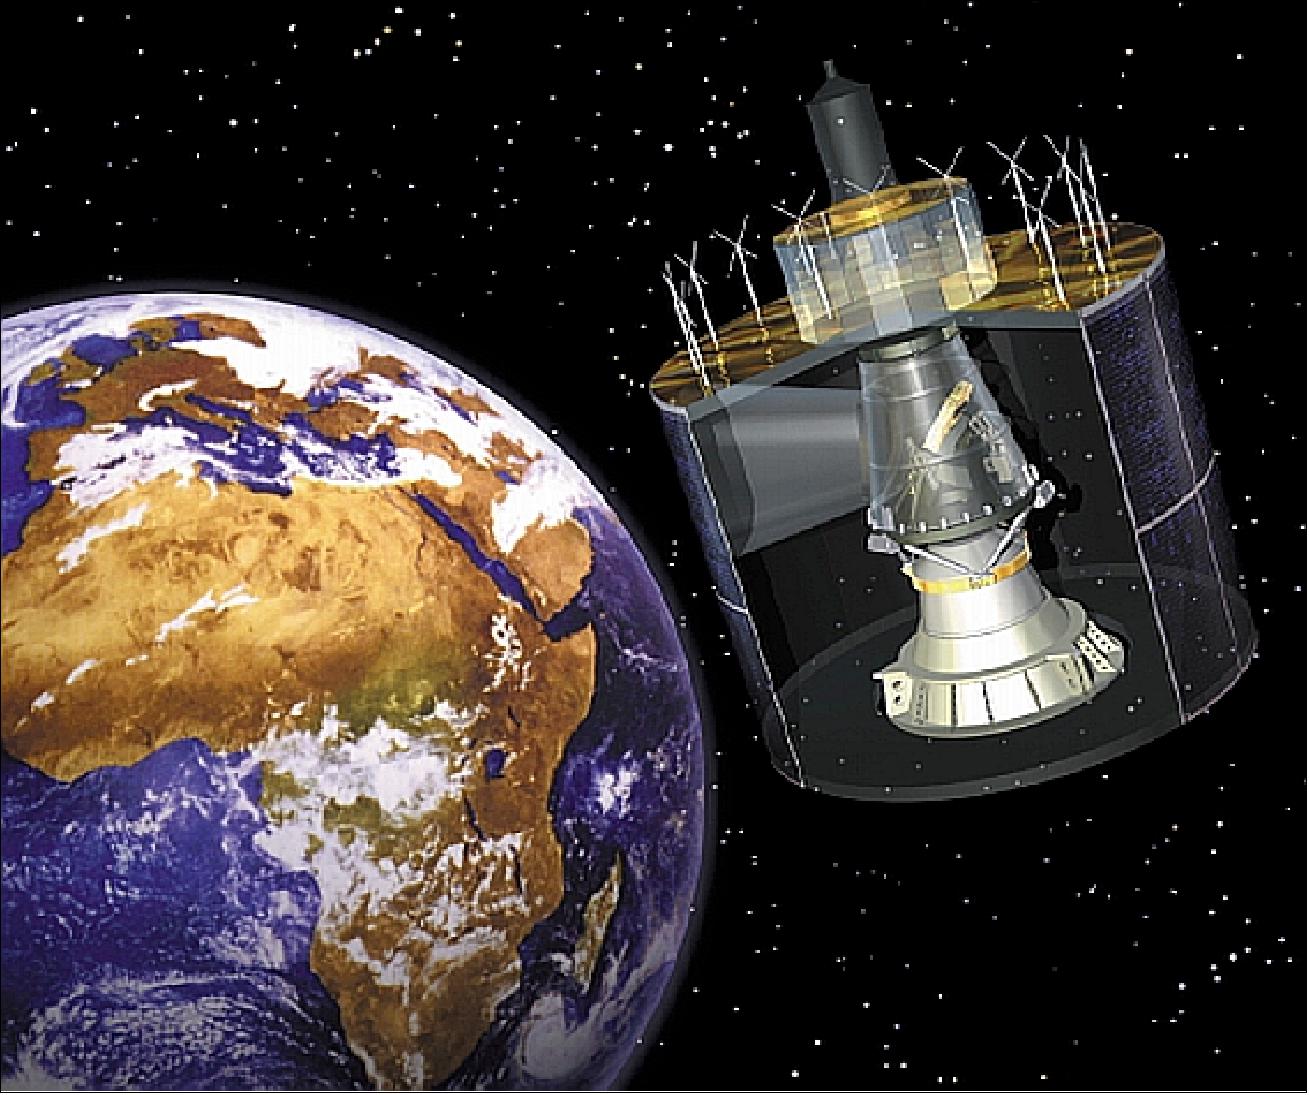
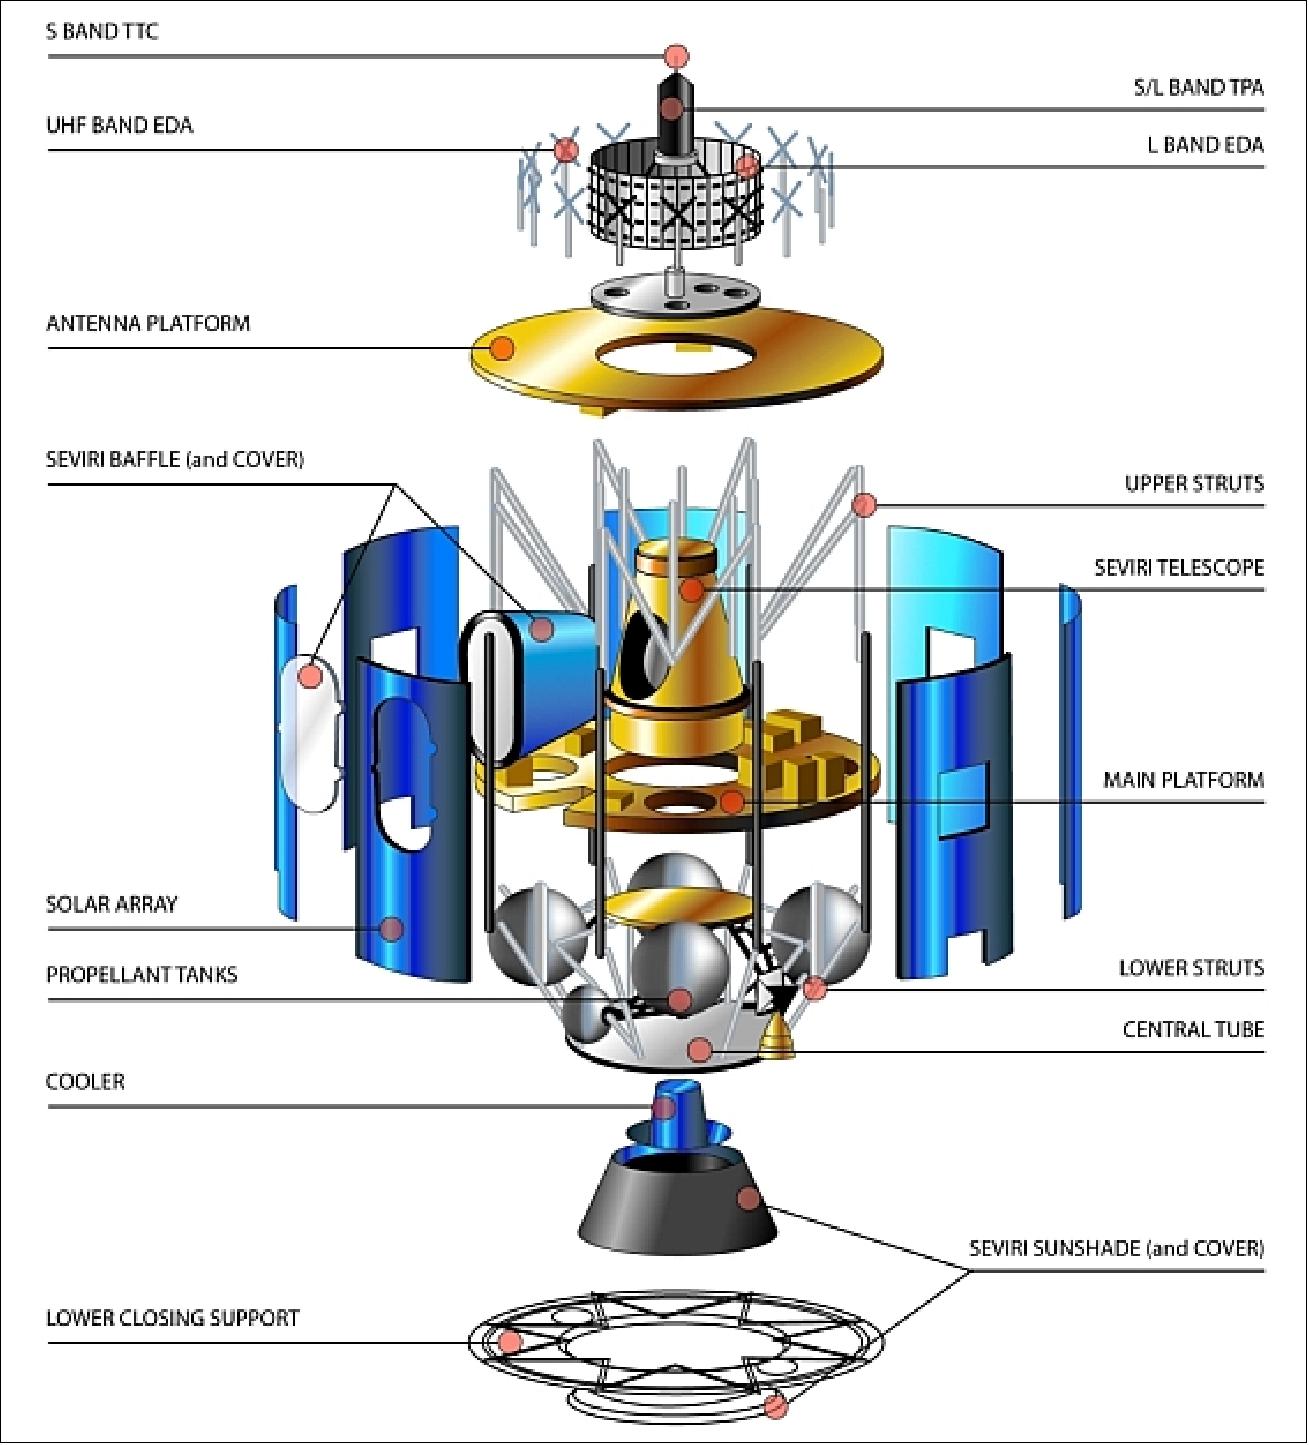
The satellite itself is built in a modular way around three main sub-assemblies: The SEVIRI instrument is located in the central compartment; the communication payload, including antennas and transponders, are positioned in the upper compartment; while the platform support subsystems are located in the lower compartment. The S/C design life is seven years. Total S/C mass = 2040 kg, power = 600 W (EOL).
Launch
MSG-1 was launched on Aug. 28, 2002. Ariane-5 launch from Kourou along with the Eutelsat communications satellite Atlantic Bird 1.
Orbit: Geostationary orbit at 3.5º W longitude (held to within 1º by thrusters) over the equator.
Launch: MSG-2 was launched on Dec. 22, 2005 to provide a two-satellite operational system [two satellites are simultaneously in orbit (one operating and one in cold redundancy) to assure availability].
Application: Operational meteorology and climate monitoring. The Meteosat program is part of WWW (World Weather Watch) satellite network of WMO (World Meteorological Organization), the largest and most important technical and research program of WMO. Besides improving weather forecasting, all fields of human endeavor which depend upon meteorological phenomena (agriculture, oceanography, hydrology, air traffic, civil engineerin ...) profit by the Meteosat imagery.
Spacecraft launch mass | 2040 kg |
Spacecraft power | 600 W (EOL) |
Spacecraft dimensions | 2.4 m (cylinder height), 3.7 m total height, 3.2 m diameter |
Spacecraft design life | 7 years |
Bi-propellant unified propulsion system | Two 400 N apogee engines for S/C transport from GTO into GEO |
Launch: The MSG-3 spacecraft (~2000 kg) was launched on July 5, 2012 on Ariane-5 ECA from Kourou along with EchoStar-XVII (6100 kg), a broadband Ka-band S/C for the American operator Hughes Network Systems. The objective of MSG-3 is to replace the ageing Meteosat-8 and secure continuity of the operational services from the geostationary orbit. 7)
Launch: MSG-4, the last weather satellite in Europe’s highly successful MSG (Meteosat Second Generation) series lifted off on an Ariane 5 launcher at 21:42 GMT (23:42 CEST) on 15 July 2015 from Europe’s Spaceport in Kourou, French Guiana (Ref. 53).
After launch, MSG-4 will be stored in orbit. It will be named Meteosat-11 when it becomes operational to bridge the gap between Meteosat-10 and the initial MTG-1 (Meteosat Third Generation-1) spacecraft – which are scheduled to be orbited in 2019 and 2021.
Mission Status
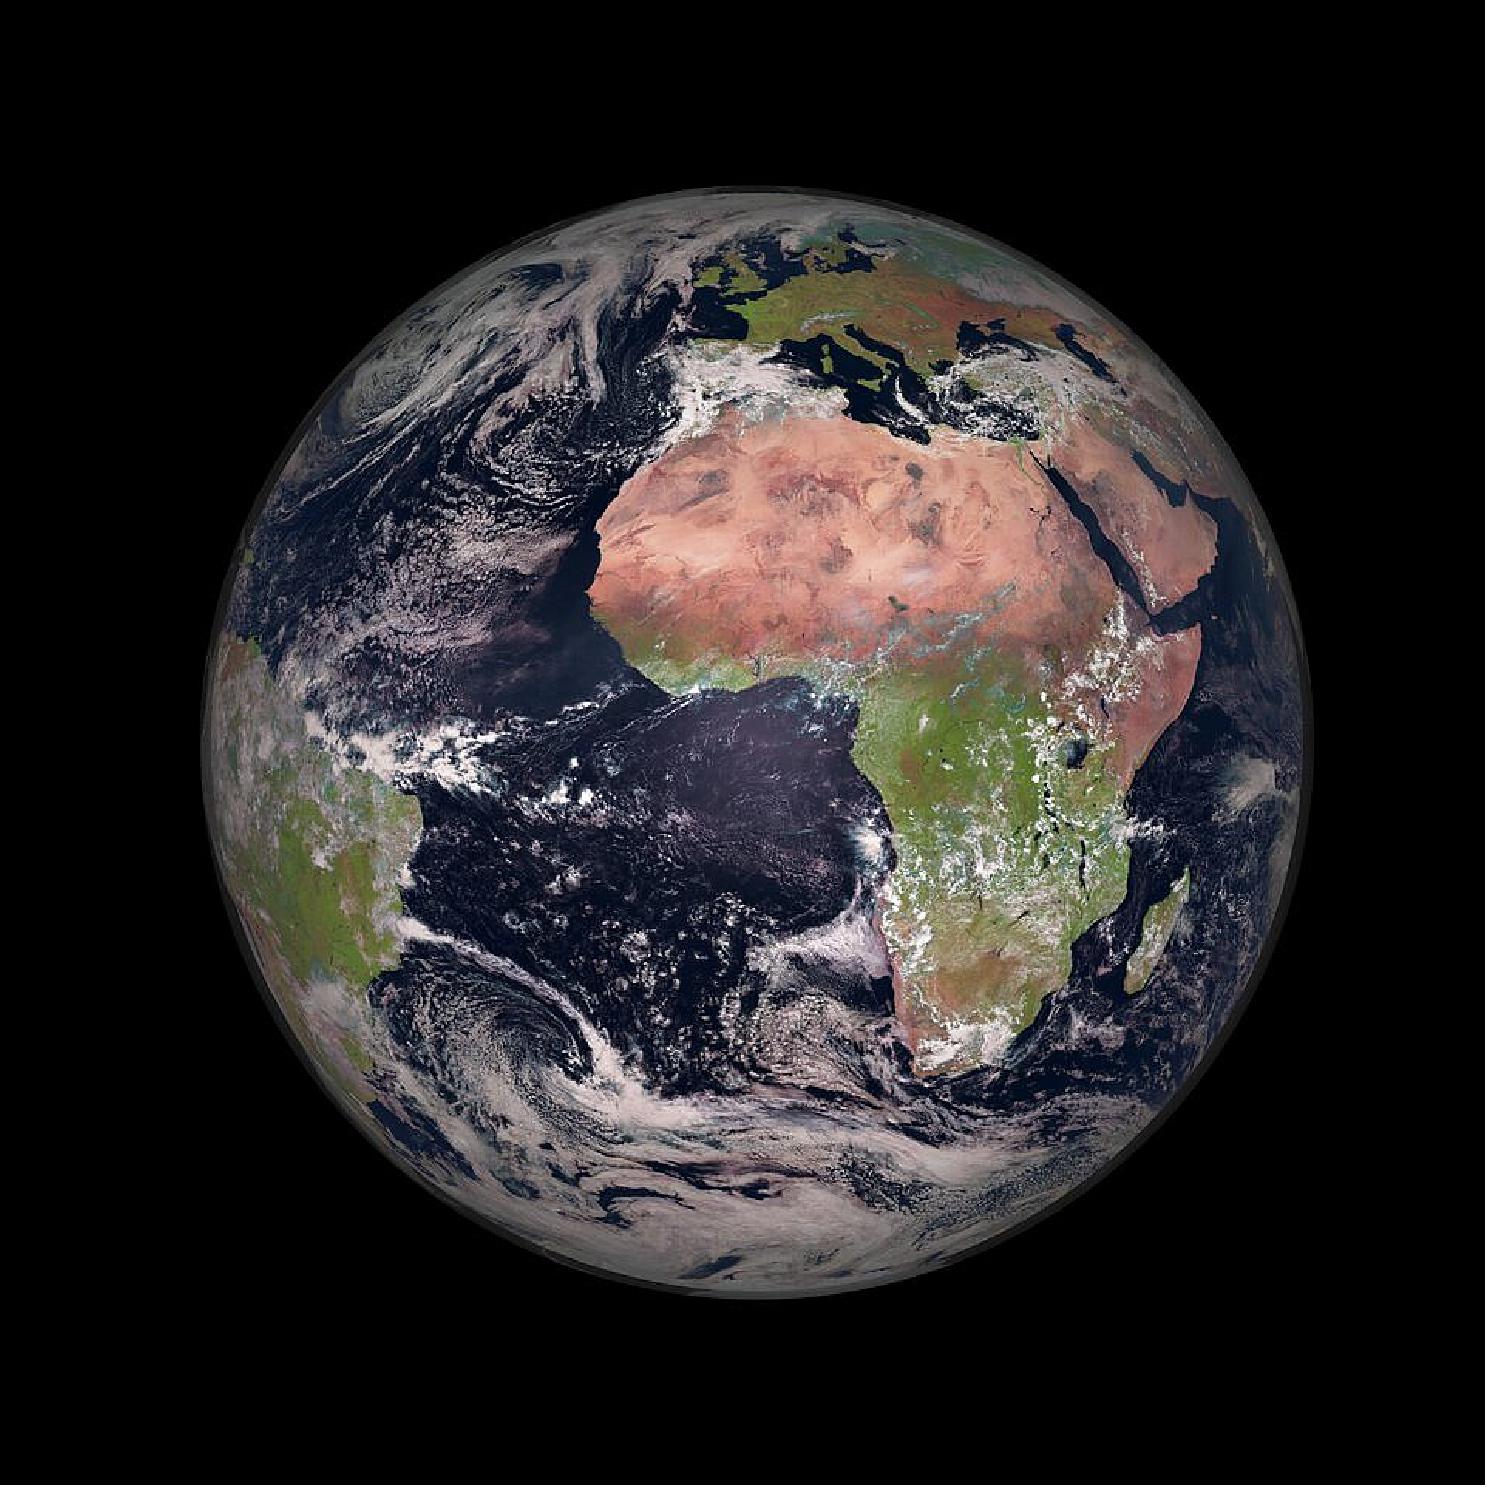
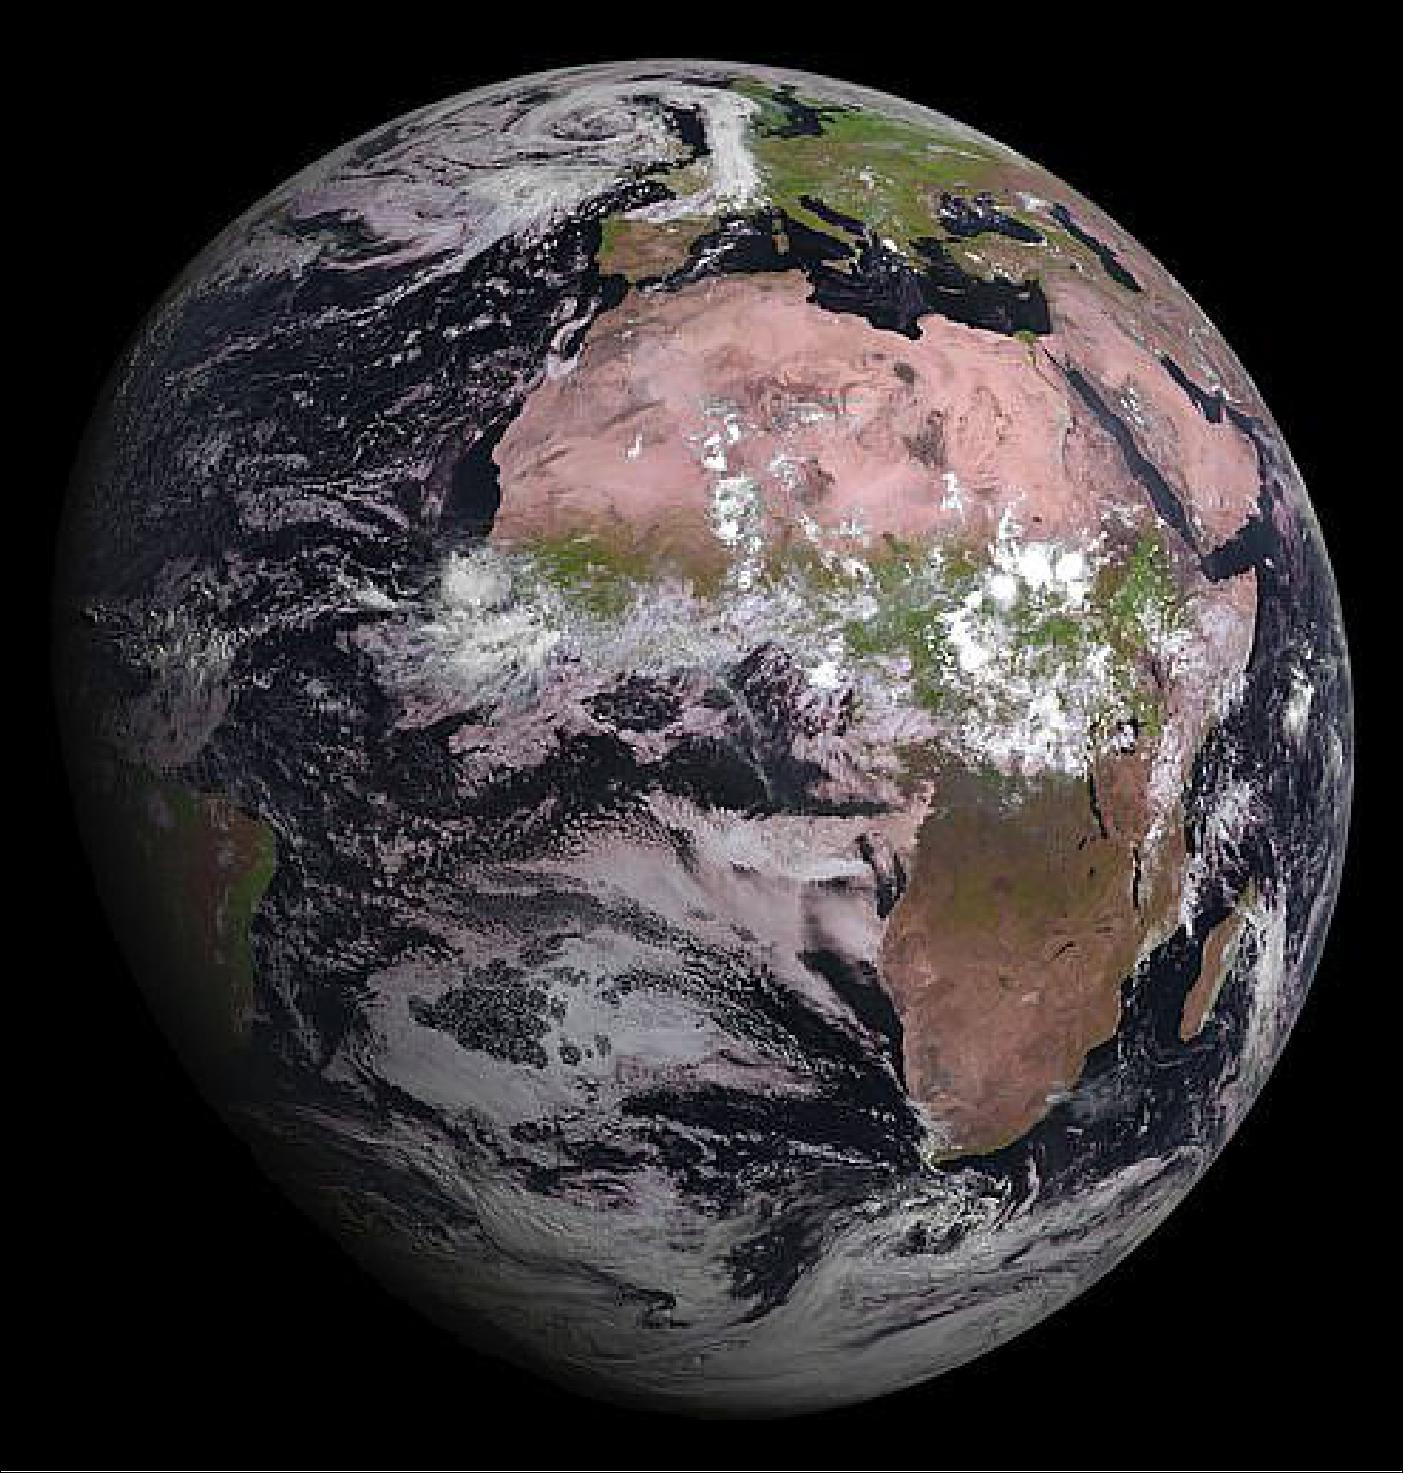
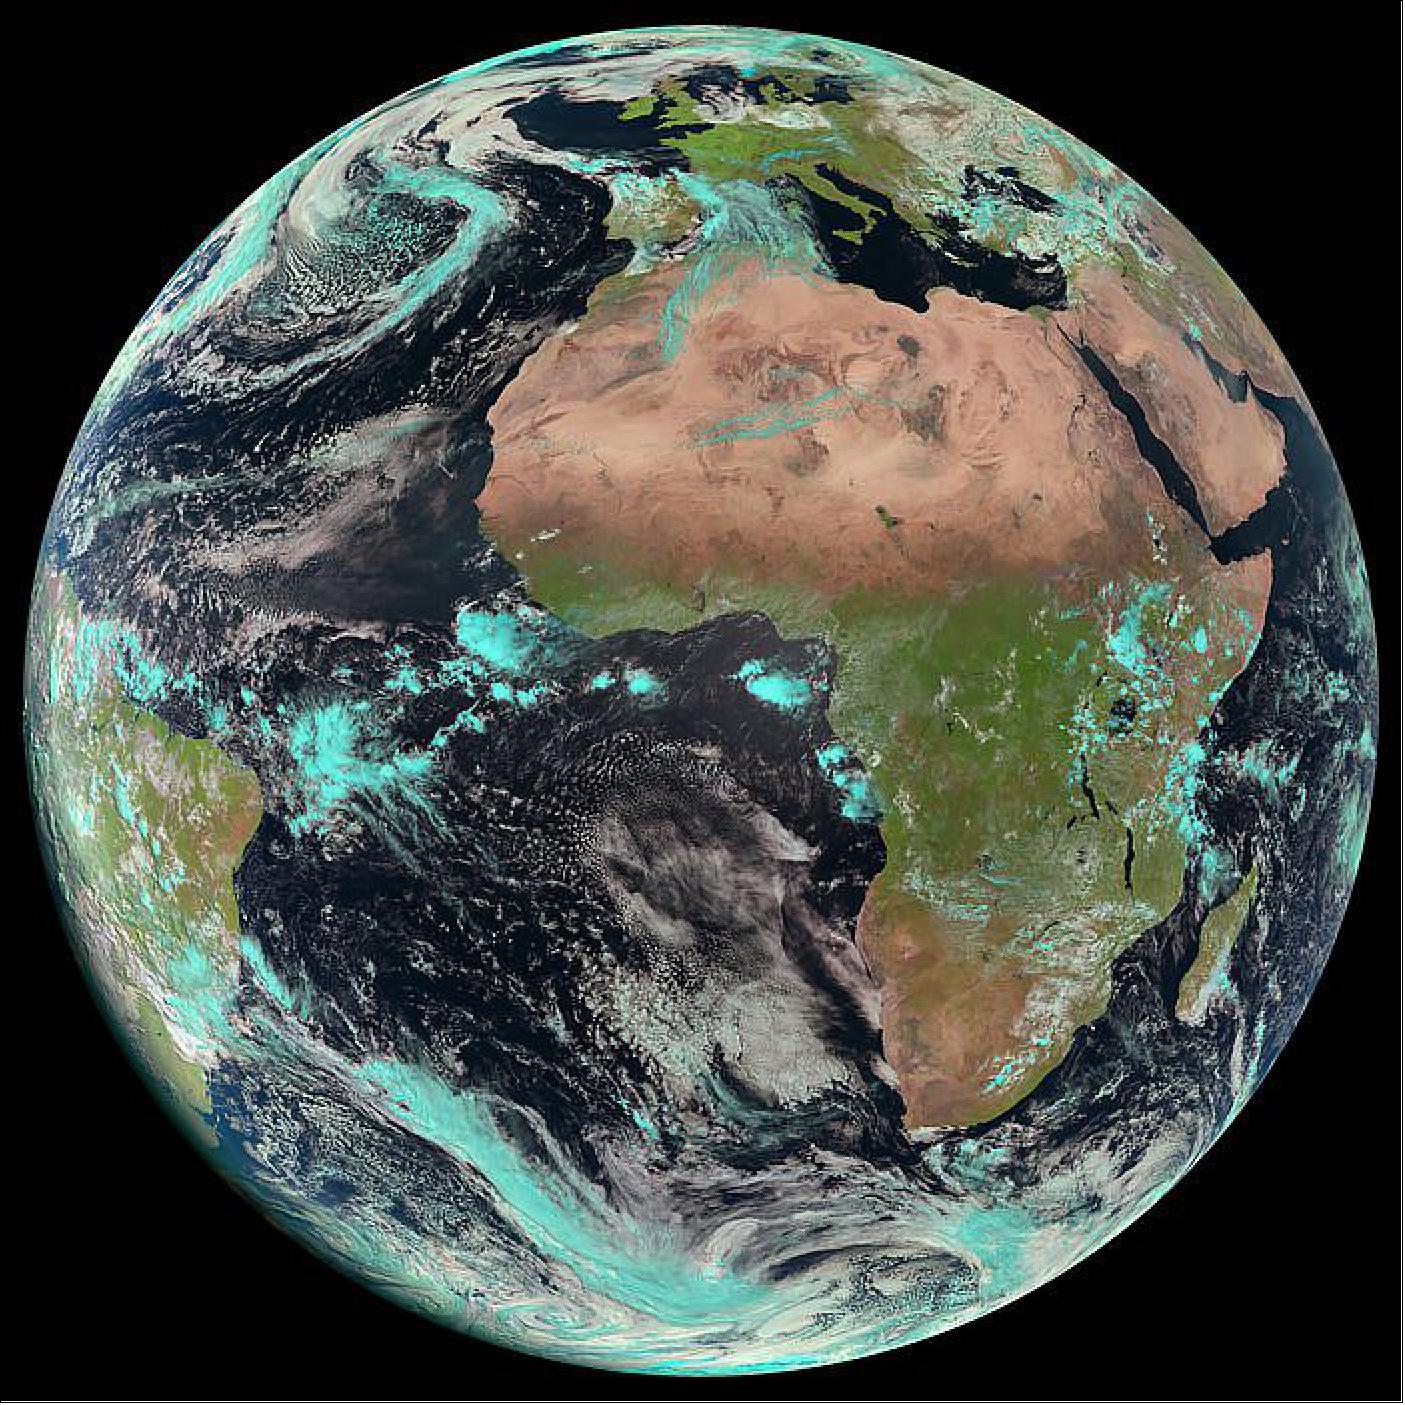
• April 22, 2022: Each year on 22 April, people across the planet join forces to raise awareness about the depleting quality of the environment, the unequivocal effects of climate change and the importance of protecting our planet for future generations. We celebrate Earth Day every day at ESA. This week, this spectacular image of Earth is brought to you by the Meteosat Second Generation series of missions. 8)
- Thanks to satellites in orbit, we can understand the intricacies of the Earth system and answer important questions on how natural processes are changing due to the everyday pressure of human activity. Satellites provide essential information for everyday applications, improving agricultural practices, to help when disasters strike, and thanks to the Meteosat series, provide crucial data for weather forecasting.
- The image of Figure 4 is crucial for nowcasting, which is about detecting rapidly high impact weather and predicting its evolution a few hours ahead, in support of the safety of life and property. These observations are also used for weather forecasting and climate monitoring.
- The Meteosat missions have guaranteed the continuous flow of data for weather forecasting since 1977, and later this year, we will soon begin a new era in weather and climate monitoring with Meteosat Third Generation (MTG).
- The third generation will not only guarantee the continuity of data for weather forecasting, but offer significant enhancement of the current imager capabilities, an all-new infrared sounding capability and real-time lightning imaging for early detection of severe storms as they develop.
- For the overall MTG mission two types of satellite are being developed; the Imaging satellite (MTG-I) and the Sounding Satellite (MTG-S). MTG-I1 is currently at Thales Alenia Space’s facilities in Cannes, France, undergoing an extensive testing campaign to ensure that the satellite will survive the rigours of the launch and the hostile environment of space.
- MTG is a cooperation between ESA and the European Organisation for the Exploitation of Meteorological Satellites (Eumetsat). ESA is responsible for the definition and implementation of the MTG satellites and procurement of recurrent hardware, while Eumetsat is in charge of operating the spacecraft throughout its lifetime as well as data retrieval, processing and distribution.
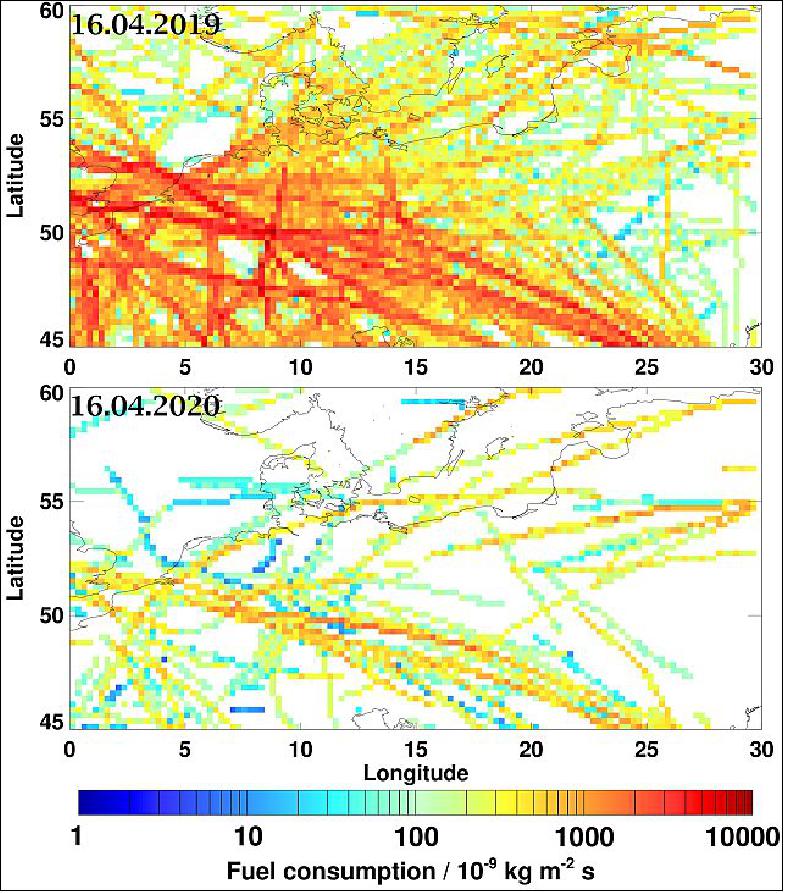
• May 20, 2020: Travel restrictions put in place to stem the COVID-19 (Coronavirus Disease-19) pandemic have led to a massive decline in global air traffic since mid-March 2020. The European air traffic control authority, EUROCONTROL has reported that the volume of European air traffic in April 2020 declined by almost 90 percent compared to the beginning of the previous month.
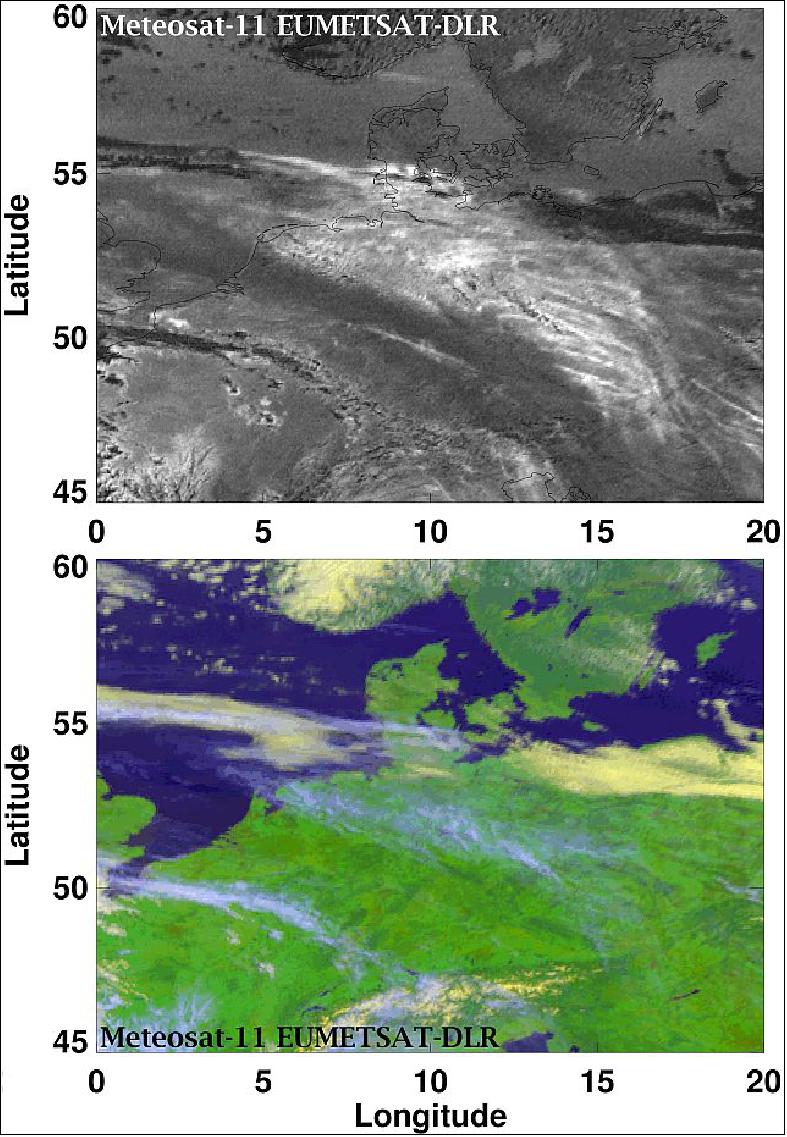
Researchers at the German Aerospace Center (Deutsches Zentrum für Luft- und Raumfahrt; DLR) have now analyzed the impact of reduced air traffic on the formation of condensation trails over Europe by measuring cloud properties. They used data acquired on 16 April 2020 by the ‘Spinning Enhanced Visible and Infrared Imager' (SEVIRI) sensor on a Meteosat Second Generation (MSG) weather satellite for this purpose. On that day, the atmosphere over Europe was cold and humid enough for long-lasting condensation trails to form behind aircraft. The analyses show a decrease in the number of contrails formed to about one tenth, compared to normal operations. 9)
- "Observations of the now-reduced condensation trail coverage allow us to verify the accuracy of the data analyses afforded by MSG weather satellites and the models that we use, so that we can determine the climate impact of condensation trails in greater detail in future," explains Christiane Voigt of the DLR Institute of Atmospheric Physics in Oberpfaffenhofen.
"Since, in addition to carbon dioxide emissions, condensation trails are responsible for approximately half of the climate impact of air transport, we would expect that so little air traffic would result in a marked decrease in the climate impact." Regular global air traffic has hitherto been responsible for approximately five percent of global warming.
- The researchers compared the satellite measurements with a model developed at the DLR Institute of Atmospheric Physics, which calculates the coverage made up of natural clouds and cirrus clouds produced by aircraft contrails, based on current air traffic movements and weather data.
Luca Bugliaro and Ulrich Schumann from the DLR Institute of Atmospheric Physics explain: "The findings based on the satellite imagery were largely consistent with the model data, and the model reflects the regional structures and gives a good representation of the measured values of the optical thicknesses of clouds." In addition, the scientists used the model to calculate a scenario with an air traffic volume 10 times higher, as it would have been on the same day in 2019, with the meteorological conditions kept the same in order to pinpoint the effect of traffic levels alone. The calculations clearly show far greater coverage from contrail cirrus clouds, with an increased optical thickness of the ice clouds. Weighted with the optical thicknesses, the degree of coverage of the partially overlapping contrails would be four times greater.
- Over the coming months, scientists want to determine more precisely how the reduced coverage due to contrails and the related cirrus clouds will affect Earth's radiation budget, using more satellite data and analyses. To do this, measures include comparing the thermal radiation emitted by Earth, measured from space, with the incident solar radiation.
"In this special situation, when there is very little air traffic, we hope to be able to directly demonstrate the effect of the decrease in condensation trails on Earth's heat balance through a large number of measurements," explains Markus Rapp, Director of the DLR Institute of Atmospheric Physics.
Tiny ice crystals in cold air
- Condensation trails consist largely of tiny ice crystals that form in cold air (at temperatures below approximately minus 42 degrees Celsius) from the exhaust gases of aircraft. First, water vapor condenses on soot particles in the exhaust gases, forming tiny water droplets. As they mix with the air, the droplets quickly cool and freeze to form ice crystals. If the surrounding air is sufficiently damp (oversaturated with ice), the ice crystals absorb water from their environment, grow, spread out and take on cloud-like shapes, which wrap around Earth like a scarf.
- These contrail cirrus clouds keep some of the Earth's heat radiation within the atmosphere and thus have a warming effect on the climate. However, as they also reflect sunlight, they have a cooling effect at times. At present, the degree to which contrail cirrus clouds contribute towards the overall radiative forcing by air traffic is of a similar magnitude to the effect of carbon dioxide, which has been emitted by aircraft since the very beginning of aviation.
Unlike carbon dioxide, which has a lifetime of over 100 years within the atmosphere, contrails usually dissipate within a matter of minutes or hours, so their climate impact is rapidly reduced if there is a decrease in air traffic. DLR is also investigating how contrails can be avoided by routing flights around areas of humid air.
- Changes to the chemical composition of the atmosphere due to reduced air traffic are also to be researched during an upcoming aircraft mission with the Falcon and HALO research aircraft.
• September 2018: In geostationary orbit of ~36,000 km above the equator, the Meteosat satellites — Meteosat-8, -9, -10 and -11 — operate over Europe, Africa and the Indian Ocean. These services are vital to ensure the safety of lives, property and infrastructure, particularly in situations of severe weather. 10)
- Meteosat-11 is the prime operational geostationary satellite, positioned at 0 º and providing full disc imagery every 15 minutes. It also provides Search and Rescue monitoring and Data Collection Platform relay service.
- Meteosat-10 provides the Rapid Scanning Service, delivering more frequent images every five minutes over parts of Europe, Africa and adjacent seas. It also provides Search and Rescue monitoring.
- Meteosat-9 provides a backup service to Meteosat-11 Full Earth scanning and a gap filling service to Meteosat-10 Rapid Scanning.
- Meteosat-8 operates over the Indian Ocean performing Full Earth scanning. It also provides Search and Rescue monitoring and Data Collection Platform relay service (which includes relay of Tsunami warnings).
- Each Meteosat satellite is expected to remain in orbit, in an operable condition for at least seven years. The current policy is to keep two operable satellites in orbit and to launch a new satellite close to the date when the fuel in the elder of the two starts to run out. After the end of the MSG lifetime there will be a follow-on series — MTG (Meteosat Third Generation).
Satellite | Lifetime | Position | Services |
Meteosat-11 | 15/07/2015 – Availability | 0º | 0º Service including Data Collection Service and Web Imagery. |
Meteosat-10 | 05/07/2012 – Availability | 9.5º E | Rapid Scanning Service. Replaced Meteosat-9 |
Meteosat-9 | 22/12/2005– | 3.5º E | Rapid Scan Service gap filling and |
Meteosat-8 | 22/12/2005– | 41.5º E | Indian Ocean Data Coverage Service including Data Collection |
• February 20, 2018: The newest of EUMETSAT’s MSG (Meteosat Second Generation) spacecraft – Meteosat-11 – has been moved to its new position at 0° longitude is now sending images of the full disc, or hemisphere, every 15 minutes. 11)
- The reason for the repositioning of Meteosat-9, -10 and -11 is to ensure the best possible configuration of the satellites, which monitor severe weather over Europe and Africa, and provide crucial data about the climate.
The maneuvers and mission swaps involved
• Meteosat-11 moving to 0° longitude, where it has taken over responsibility for the prime “full disc” service which has been performed by Meteosat-10. This service provides an image of the whole of Europe and Africa and parts of the Atlantic and Indian oceans every 15 minutes. This also includes the GERB instrument data collection, the search and rescue service, the data collection platform service, and low rate information (Image) transmission service.
• Meteosat-10 has already started moving from 0° to 9.5°E, where it will take over the Rapid Scan Service from Meteosat-9. The Rapid Scan Service provides an image of Europe only, every five minutes. This will also include taking over the search and rescue service.
• Meteosat-9 will move from 9.5°E to 3.5°E, where it will act as a back-up to the other two satellites
Meteosat-11 (launched on 15 July 2015) is the last of EUMETSAT’s MSG satellites. Preparations are well underway for the deployment of the first of the MTG (Meteosat Third Generation) satellites in 2021, which will herald a new era in operational meteorology and climate monitoring.
• December 6, 2017: At its 88th session, the EUMETSAT Council agreed to exploit the Meteosat second generation (MSG) and EUMETSAT Polar System (EPS) satellite systems for another seven years and opened the votes enabling the 30 Member States to formalize associated financial commitments in the course of 2018. 12)
- These decisions reflect the substantial impact of observations from Meteosat and MetOp satellites on weather forecasts at all ranges and take into account the latest assessment of the performances and foreseen lifetime of all satellites in orbit and the forthcoming launch of the last Metop satellite (MetOp-C) planned in the autumn 2018.
- The Council also approved two ground segment contracts for the next generation Meteosat Third Generation and Jason-CS/Sentinel-6 systems currently under development.
- The IDPF-S (Instrument Data Processing Facility-Sounding) will process data from the IRS Infrared sounder and the Copernicus UVN/Sentinel-4 ultraviolet and near infrared sounder embarked on the Meteosat Third Generation sounding (MTG-S) satellites. The first of these satellites, MTG-S1, will be launched in 2023, two years after the first MTG imaging satellite, MTG-I1.
- The PDAP (Payload Data Acquisition and Processing) component of the Jason-CS ground segment will acquire data from the Copernicus Jason-CS/Sentinel-6 satellite and perform end-to-end processing. The development of the PDAP is funded by the EUMETSAT Jason-CS program, the organization’s contribution to the cooperative development of Copernicus Jason-CS/Sentinel-6 mission, involving also ESA, NASA, NOAA and the European Union through its Copernicus program. The first Jason-CS/Sentinel-6 satellite is planned for launch at the end of 2020.
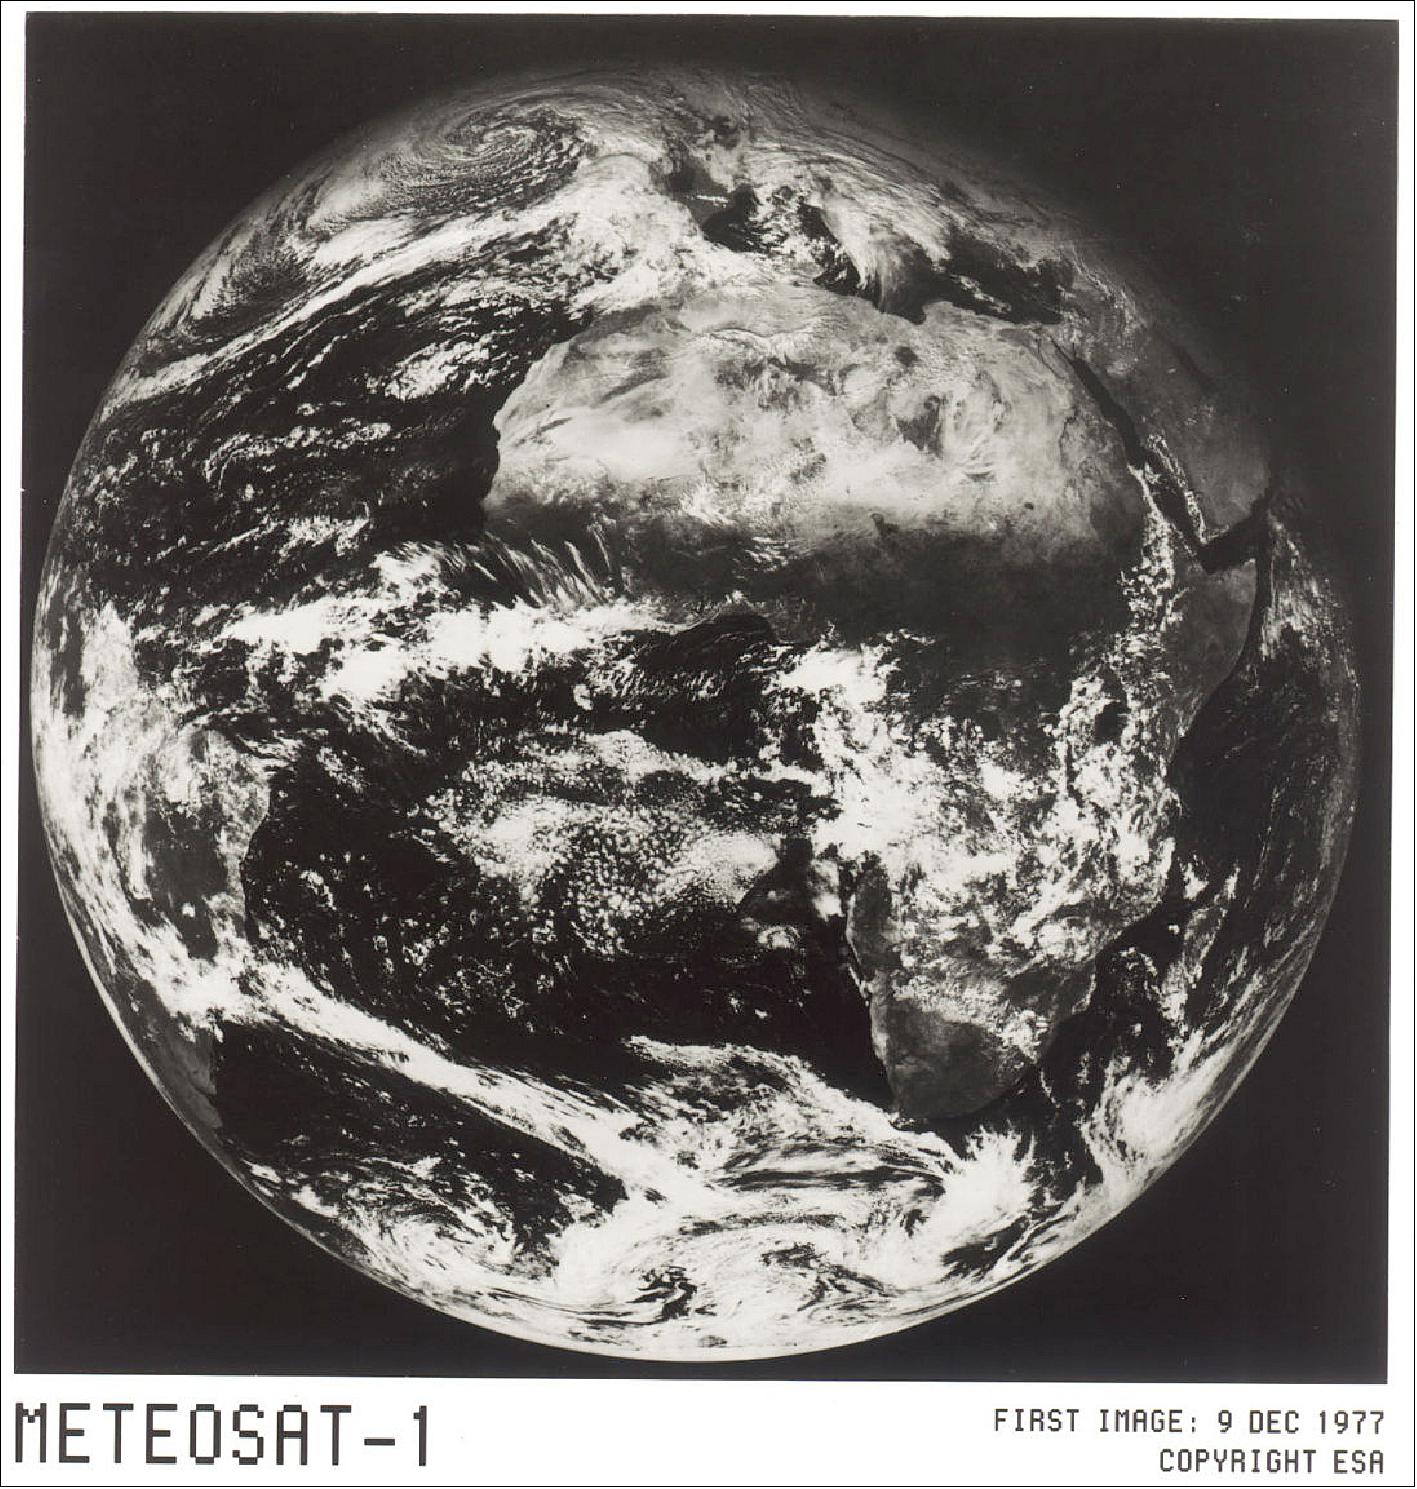
• Forty years of Meteosat — On 23 November 1977, ESA’s first Earth observation satellite was launched on a Delta 2914 Vehicle from Cape Canaveral, FL. When Meteosat-1 satellite took its place in the sky, it completed coverage from geostationary orbit and laid the foundations for European and world cooperation in meteorology that continues today. 13) 14) 15)
- A succession of Meteosats: The Meteosat program always has one satellite in the operational position at 0° longitude. Additional satellites are currently over Africa and the Indian Ocean, while the last of the MSG (Meteosat Second Generation) satellites is being stored in orbit.
The MSG spacecraft kept the drum-shaped design of the original but is two and a half times larger and offers improved resolution, 12 spectral channels as opposed to three on the original system, and faster scanning. Meanwhile, on the ground, the MTG (Meteosat Third Generation) is in development, with new capabilities such as lightning detection, and will guarantee continued European monitoring of the atmosphere from space from 2021 onwards into the 2030s.
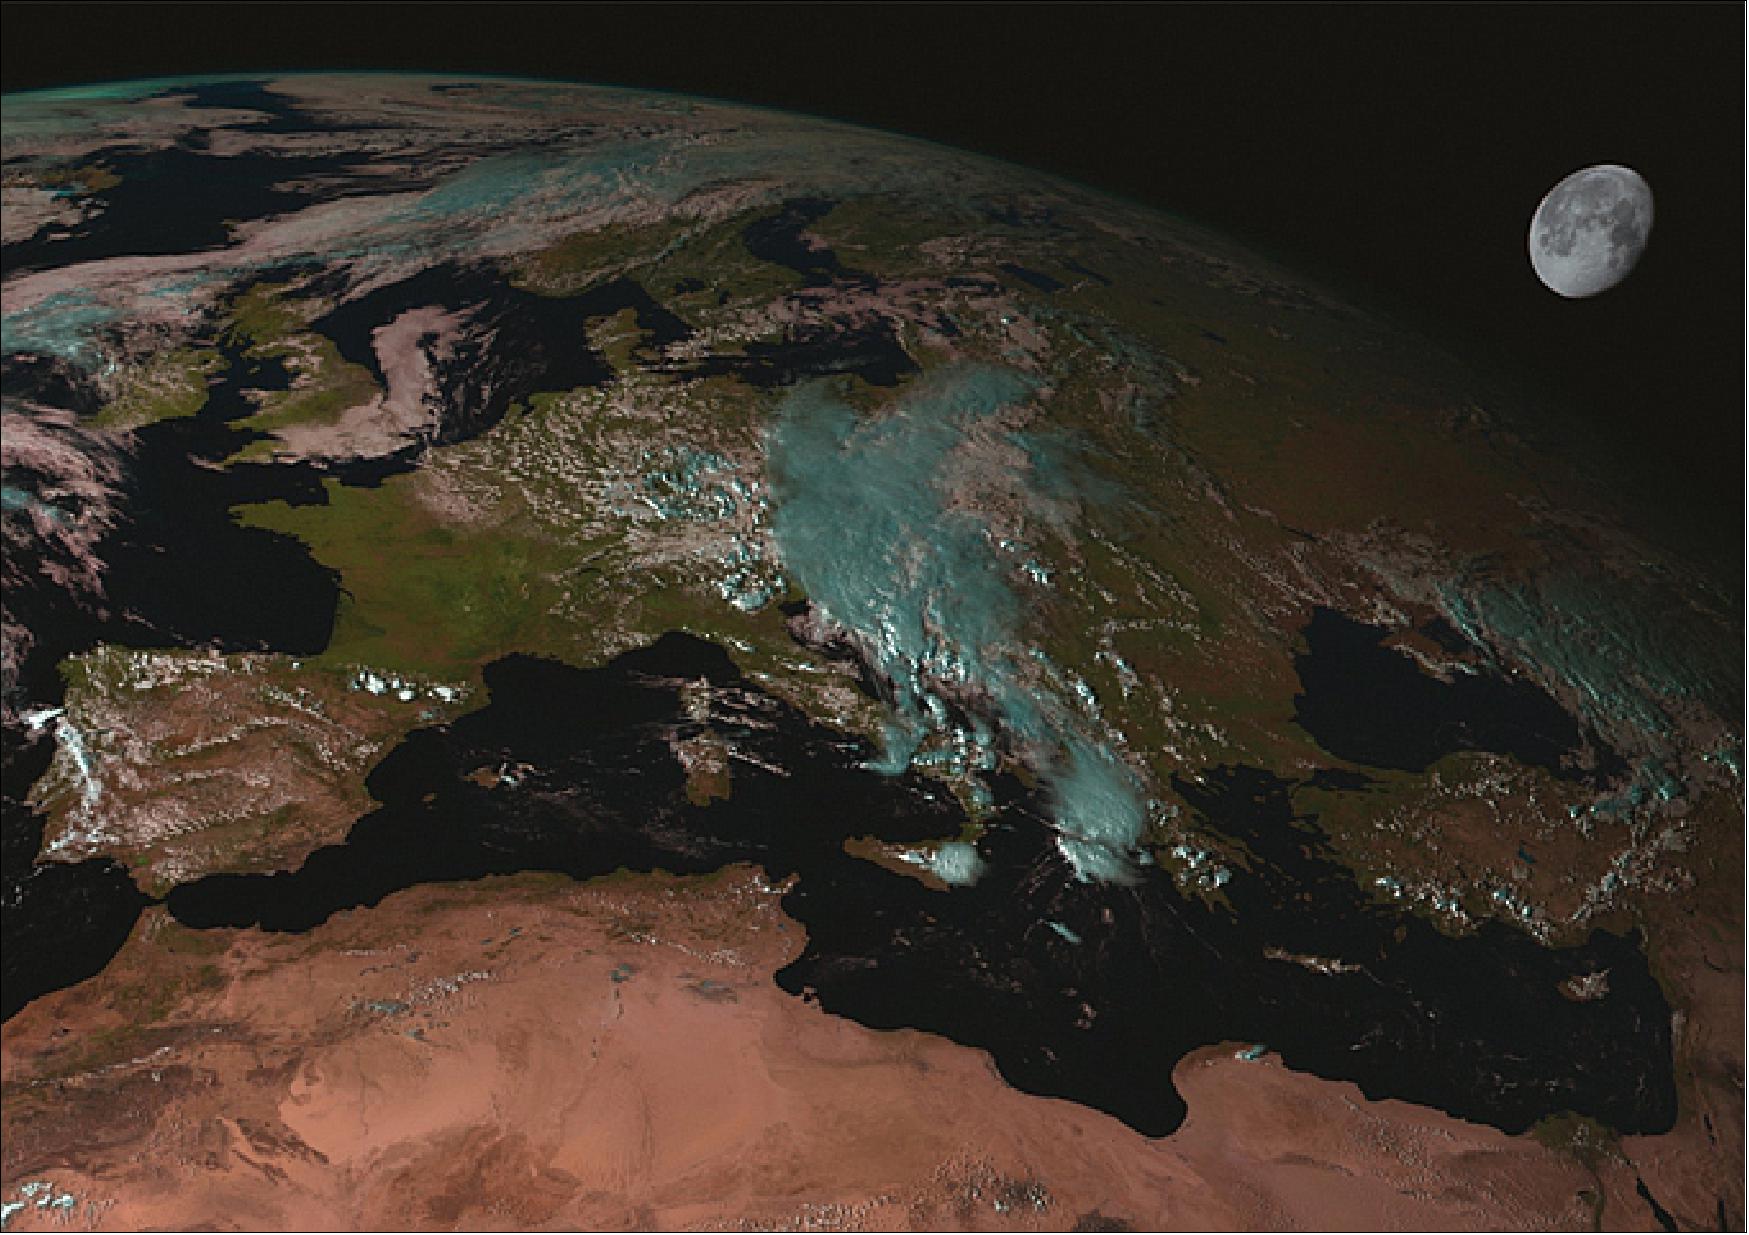
• April 28, 2017: When American astronaut Alfred Worden, who was the command module pilot for the Apollo 15 lunar mission in 1971, was asked what he was feeling at that time, he replied: “Now I know why I’m here. Not for a closer look at the moon, but to look back at our home, the Earth.” 16)
- Need for accuracy: EUMETSAT operates a fleet of meteorological and climate monitoring satellites and processes and disseminates data and products from the instruments they carry to users such as the National Meteorological Services of its Member States, researchers and to users of the EU’s (European Union) flagship environmental program, Copernicus.
- These users require highly accurate data. EUMETSAT Remote Sensing Scientist in charge of calibration of visible and near-infrared bands Dr. Sébastien Wagner said that, in the case of monitoring and detecting the signatures of climate change, small radiometric signals can have large policy implications.
For this purpose, it is crucial that satellites’ instruments are calibrated with high accuracy – ideally within a few tenths of a percent. As satellites’ onboard instruments degrade over time, real changes on the Earth’s surface must be distinguished from changes in a sensor’s response, Wagner said.
- Why use the Moon as a calibration target? Features including the Moon’s lack of atmosphere and the stability of the lunar surface give it a number of advantages over using sites on Earth to calibrate instruments in space.
“The Moon is a target that is extremely stable and for which you can really predict its illumination,” Wagner said. “You can model the signal that will come from the Moon and that gives you the possibility to monitor the way your instruments are degrading with time.” The Moon’s changes in brightness are periodic and predictable, and it can also be observed from any Earth orbit, although some maneuvers might be required of low-Earth-orbiting satellites. However, to use the Moon as a calibration target, a model is needed to predict its brightness under any observational conditions.
- The Lunar Calibration Reference: To develop such a model, continuous observations of the lunar cycle, under clear observational conditions, and the ability to control in time the calibration of the telescopes making the observations, are necessary.
USGS (United States Geological Survey) developed the ROLO (Robotic Lunar Observatory) to support NASA’s Earth observation missions, using two telescopes with 32 spectral bands altogether over a period of about eight years. This USGS ROLO model is the current standard for lunar calibration. To take another step forward towards using a common and agreed lunar calibration reference based on the USGS ROLO model has been an international effort.
- In December 2014, EUMETSAT hosted a workshop involving 14 agencies from Europe, America and Asia to work towards common implementation of the model (the so-called GSICS Implementation of the ROLO model, or GIRO), share expertise, provide a validated and traceable version of the model and, for the first time, generate a reference dataset for validation and comparisons, the GLOD [GSICS (Global Space-Based Inter-Calibration System) Lunar Observation Dataset].
- Data from at least 30 instruments from European, American and Asian satellites have been provided for the dataset. These include imagers, such as EUMETSAT’s SEVIRI (Spinning Enhanced Visible and Infrared Imager), which provides data crucial for models nowcasting severe weather events, and instruments measuring ocean color and aerosols, among others.
- Although EUMETSAT has taken on a major role in the project, keeping it moving forward and developing the source software code for the GIRO and collecting the datasets for the GLOD, the work has been a truly international team effort, Wagner said. Together, they have developed the GIRO, an agreed international reference for lunar calibration, traceable to the USGS ROLO model.
- The benefits in practice: Wagner said one of the major advantages of this international approach has been the sharing of data and understanding of the issues relating to lunar calibration. With all of the partners having an agreed reference, the level of uncertainty in relation to data can be reduced to very low levels.
- In March 2017, a major milestone in the project was reached when EUMETSAT made the source code of the GIRO and the GLOD available to its international partners. Analysis of the resulting observation datasets will be used to improve the lunar irradiance model. This will be discussed at a follow-on workshop to be held in Xi’an, China in November 2017, which aims to address the increasingly challenging calibration needs for the next generation of satellite instruments.
• On April 11, 2017, EUMETSAT decommissioned Meteosat-7, the last first generation of Meteosat geostationary spacecraft, after almost 20 years of service. The final command was sent at 09:00 UTC, ending the exceptional service record not only of one spacecraft but of the whole Meteosat first generation mission started by ESA in 1977. 17)
- During the past four decades, the series of seven successive Meteosat first generation satellites established the foundations for the products and services EUMETSAT delivers today from the geostationary orbit in support of nowcasting of high impact weather and built up an archive of over 36 years of observations, an invaluable asset for climate change monitoring.
- The mission also supported large scale international research programs, in particular the Mesoscale Alpine Program and the INDOEX (Indian Ocean Experiment) investigating the impacts of natural and anthropogenic aerosols on regional and global climate.
- Over the last ten years, Meteosat-7 has been delivering observations of the Indian Ocean from geostationary orbit. This heritage mission has been provided by Meteosat First Generation satellites ever since 1998. After the December-2004 Indian Ocean Tsunami, Meteosat-7 became an essential part of the Tsunami warning system, acting as a relay spacecraft for the Tsunami warning buoys that were put in place.
- EUMETSAT’s Director-General, Alain Ratier, said: “This last maneuver puts a safe end to a foundational program. Not only did the successful Meteosat first generation mission give birth to EUMETSAT in 1986 and made it a true satellite operator in 1995, but it shaped satellite meteorology in Europe, testing concepts such as rapid scanning of thunderstorms and extraction of wind vector products from the tracking of water vapor patterns across successive images.”
• On 3 April 2017 at 22:25 UT, the thrusters of Meteosat-7 started firing, the first in a week of maneuvers that will take the satellite to its ultimate resting place into a graveyard orbit, about 300 km above the geostationary ring. 18)
- Meteosat-7 is the last of the first generation Meteosats, geostationary weather satellites that shaped the success story of satellite meteorology in Europe. Modern weather forecasting began 40 years ago, with the launch of Meteosat-1. In 2016, when the EC approved the Space Strategy for Europe, it recognized the Meteosat program as a key European success story.
- Meteosat-7 (launched on 2 September 1997) was developed under the MTP (Meteosat Transition Program). It was designed to fill the gap between the Meteosat Operational Program (encompassing Meteosat-4 to -6) and the first satellite of the second generation, Meteosat-8 (launched on 28 August 2002).
- The satellite provided the prime 0º longitude Full Earth Scan Service from 3 June 1998 until it was replaced by Meteosat-8 on 16 May 2006. On 11 July 2006, Meteosat-7 moved to the Indian Ocean where it arrived on 10 October 2006. It became the prime provider of the Indian Ocean Data Coverage (IODC) Service at 57.5º East on 5 December 2006 until 1 February 2017, when Meteosat-8 took over.
• March 15, 2017: Today, Alain Ratier, Director-General of EUMETSAT and Wu Yanhua, Vice Administrator of CNSA ( China National Space Administration) signed an agreement that provides the policy framework for the continuation and expansion of EUMETSAT’s cooperation with China on monitoring the atmosphere, oceans and climate from space. 19)
- The policy framework established by this agreement will facilitate the implementation and extensions of the agreements already in force with CMA (China Meteorological Administration) and the NOSAS (National Ocean Satellite Application Center).
- The cooperation encompasses data exchange, scientific cooperation and coordination of respective observation systems in the context of the WMO (World Meteorological Organization), the GCOS (Global Climate Observing System) from space, the CGMS (Coordination Group for Meteorological Satellites) and CEOS (Committee for Earth Observation Satellites).
- It will capitalize on the long term, multi-satellite programs approved by China and the EUMETSAT Member States.
• As of February 1, 2017, Meteosat-8 replaced Meteosat-7 as the EUMETSAT geostationary satellite observing the Indian Ocean. The Meteosat-8 satellite belongs to the second generation of Meteosats and is much more capable than the first generation Meteosat-7 — delivering imagery from 12 instead of 3 spectral channels, with higher spatial resolution and with an increased frequency, every 15 instead of every 30 minutes.
Of the 12 spectral channels, 11 provide measurements with a resolution of 3 km at the subsatellite point. The twelfth, so-called HRV (High Resolution Visible) channel of SEVIRI (Spinning Enhanced Visible and Infrared Imager), provides measurements with a resolution of 1 km. 20)
- In the context of the World Meteorological Organization's IGOS (Integrated Global Observation System) and in partnership with India, Russia and China, EUMETSAT thus continues its best effort contribution to observations of the Indian Ocean from geostationary orbit.
- The partnership provides more resilient, integrated IODC (Indian Ocean Data Coverage) services with optimum regional coverage, including a joint suite of essential meteorological products made available to all users worldwide.
- For optimum synergy with the Indian INSAT-3D satellite, located around 82° East and with Meteosat-10 located at 0°, Meteosat-8 operates at 41.5°East, instead of 57.5° East. The synergy with Meteosat-10 brings additional benefits to EUMETSAT users in Africa and Central and Eastern Europe.
- The Meteosat-8 image data is delivered in real time over Europe and Africa via EUMETCast, EUMETSAT’s flexible dissemination system for environmental data, and are exchanged with the IODC partners.
- Hans Peter Roesli of EUMETSAT said:” Central Eastern Europe, the Indian Ocean region, including the Indian sub-continent, is now in the focus of a multispectral imager which will deliver much needed observations of the numerous weather and weather-related features that plague these regions, like tropical cyclones, dust transport/storms, severe convection and monsoons.”
• December 2016: The end-of-life and re-orbiting of the Meteosat-7 (the last Meteosat first generation satellite), which is currently supporting EUMETSAT’s IODC (Indian Ocean Data Coverage) service, is foreseen in the first quarter of 2017. It is planned to continue the IODC service with Meteosat-8, which is a MSG (Meteosat Second Generation) satellite (MSG-1). The usage of Meteosat-8 will significantly improve the IODC service by scanning the full Earth disc every 15 minutes in 12 spectral channels along with a full suite of MSG meteorological products, which will be disseminated via EUMETCast to Europe and Africa.
Additionally a subset of the derived meteorological products will be disseminated to the GTS (Global Telecommunication System). Apart from the change in the Satellite family (MSG using the SEVIRI instrument), the Satellite rectification position will change from the current position of Meteosat-7 at 57.0°E to 41.5°E for Meteosat-8.
This change in position may impact the collection of measurements from some DCP (Data Collection Platform) at the easterly locations, however it is planned to switch these DCPs to the JMA (Japan Meteorological Agency) satellite. Introduction of the Meteosat-8 supported IODC service started with a parallel dissemination phase in the period November 2016 to March 2017. 21)
- Sometime in early 2017, Meteosat-8 is expected to take over the operational IODC service and as from April 2017, Meteosat-8 will be the only EUMETSAT satellite providing this service which is foreseen to continue until 2019.
- Due to the length of service time Meteosat-8 satellite has been in, its orbit inclination is at 4.3º in July 2016 and will grow by 0.62 º/year. A study performed by industry confirmed that the satellite can support the imaging mission up to 6 º inclination. Another study focussing on the Image processing system is ongoing to further investigate this for inclination orbits up to 10º.
- The Meteosat-8 satellite contains liquid fuel which is used to maintain its orbital position at 41.5°E. This fuel can migrate between tanks resulting in a wobbling of the spacecraft and with that can impact the geometrical quality of the rectified Level 1.5 image product. These effects are mitigated by dedicated operations the spacecraft’s tank heaters by the image processing algorithms to allow the production of nominal image and products.
- The SSU (Sun Sensor Unit) on Meteosat-8 is used as timing reference for satellite and image processing operations. Due to a seasonal unavailability of the SSU the ESU (Earth Sensor Unit) is used as a mitigation which might impact the Level 1.5 image product completeness and impact the HRV window appearance at its East/West image edges. The GERB (Geostationary Earth Radiation Budget)image rectification is also impacted during the ESU usage and an algorithm to mitigate this is under development in the GGSPS (GERB Ground Segment Processing System).
- The Meteosat-8 satellite suffers from a design weakness of the SSPA (Solid State Power Amplifier) resulting in a loss of its direct LRIT dissemination capability. This may impact also the DCS (Data Collection System) with a reduced redundancy of the MCP (Mission Communication Payload) and with that may impact the DCP mission operability.
- Meteosat-8 image data and products are derived from the Meteosat ‘Full-Earth Scan’, performed at 41.5°E for 15 minutes Repeat Cycles in 12 spectral channels. From the 41.5°E location, the scan region for Full-Earth scanning spans from approximately 40°W to 120°E and covering the full European continent, Africa and central Asia. In the East the image contains the western parts of Indonesia (Figure 11). Additionally Meteosat-8 DCS (Data Collection System), GERB and S&R missions covering the same longitude range.
- The SEVIRI Level 1.5 Imagery Mission is performed with 15 minutes timeliness and availability baseline>95% (Operational Performance Target: >99%) similar to MSG FES (Full Earth Scan) 0° longitude service. The meteorological products are provided with timeliness specific to the different products and availability baseline >95%, (operational performance target: >98.5%) similar to MSG Full Earth Scan 0° longitude service. The products are considered complete if they have been successfully generated from all input data.
- DCS (Data Collection Service): Since Meteosat-8 is located over the equator at 41.5ºE the DCS can be used by all DCP operators situated within its telecommunications FOV (Field of View). A realistic limit of this view is about 75º great circle arc of the subsatellite point and corresponding to a ground antenna elevation of 5º. The DCS will be provided with a timeliness of 10 minutes from arrival at the EUMETSAT Mission Control Center at Darmstadt and Availability Operational Performance Target: >98% similar to MSG FES 0° longitude service. Meteosat-8 will also support HRDCP (High Rate DCPs).
- S&R (Search & Rescue): The S&R transponder on Meteosat-8 at 41.5ºE will be validated to ensure its functionality. It will only be used as a backup on request by COSPAS-SARSAT. Meteosat-8 will provice the EUMESAT contribution to the Indian Ocan Data Coverage (IODC) service within CGMS with the same services as the prime Meteosat Full-Earth-Scanning service at 0° longitude from February 2017 onwards with a current satellite lifetime assessment that indicates the possibility to provide the service until around 2020.
• December 2016: MSG has been a successful successor to and major improvement over the Meteosat First Generation satellites - to a large extent due to the superb performance of the SEVIRI instrument. The careful work performed on ground in designing SEVIRI has been effective in ensuring a high quality in orbit instrument. SEVIRI has been proven to provide data with high availability, high geometric quality/accuracy and good radiometric quality, with an excellent signal to noise ratio - exceeded most specifications.
Furthermore, Meteosat-8 has so far, exceeded specified lifetime by a factor of two - and the other MSG satellites are expected to continue to provide valuable geostationary images to support operational meteorology and climate monitoring for many more years (Ref. 61).
• Sept. 23, 2016: Meteosat-8, the first of EUMETSAT’s MSG (Meteosat Second Generation) meteorological satellite series, will replace the soon-to-be-de-orbited Meteosat-7 satellite, the last of the first generation satellites, which had been providing the IODC (Indian Ocean Data Coverage)service but is approaching the end of its nearly 20-year-long lifetime in space. 22)
- Meteosat-8 was, until recently, stationed at 3.5°E, serving as a “hot back-up” for the satellites Meteosat-9 and -10. However, in early July, the EUMETSAT Flight Operations team set the spacecraft on an ~80-day drift journey to bring it to its new position at 41.5ºE and provide its service to the IODC (Indian Ocean Data Coverage). This crucial coverage function is provided together with India’s INSAT-3D, at 82°E, China’s FY-2E at 86.5°E and Russia’s Elektro L N2 at 77.8°E in an international, cooperative arrangement. The provision of better and more frequent observations by Meteosat- 8 from this new position will bring benefits to countries, such as Indian Ocean islands and the east African coast, which experience tropical cyclones.
Additionally, this arrangement will allow for better observations of severe weather over EUMETSAT Member States in Central Europe.
- Meteosat-8 arrived at 41.5°E on 21 September, 2016. The distribution of IODC Meteosat-8 data, in parallel to Meteosat-7 data, is planned to start on 4 October. In the first quarter of 2017, Meteosat-8 will eventually replace Meteosat-7 which will be moved to its graveyard orbit.
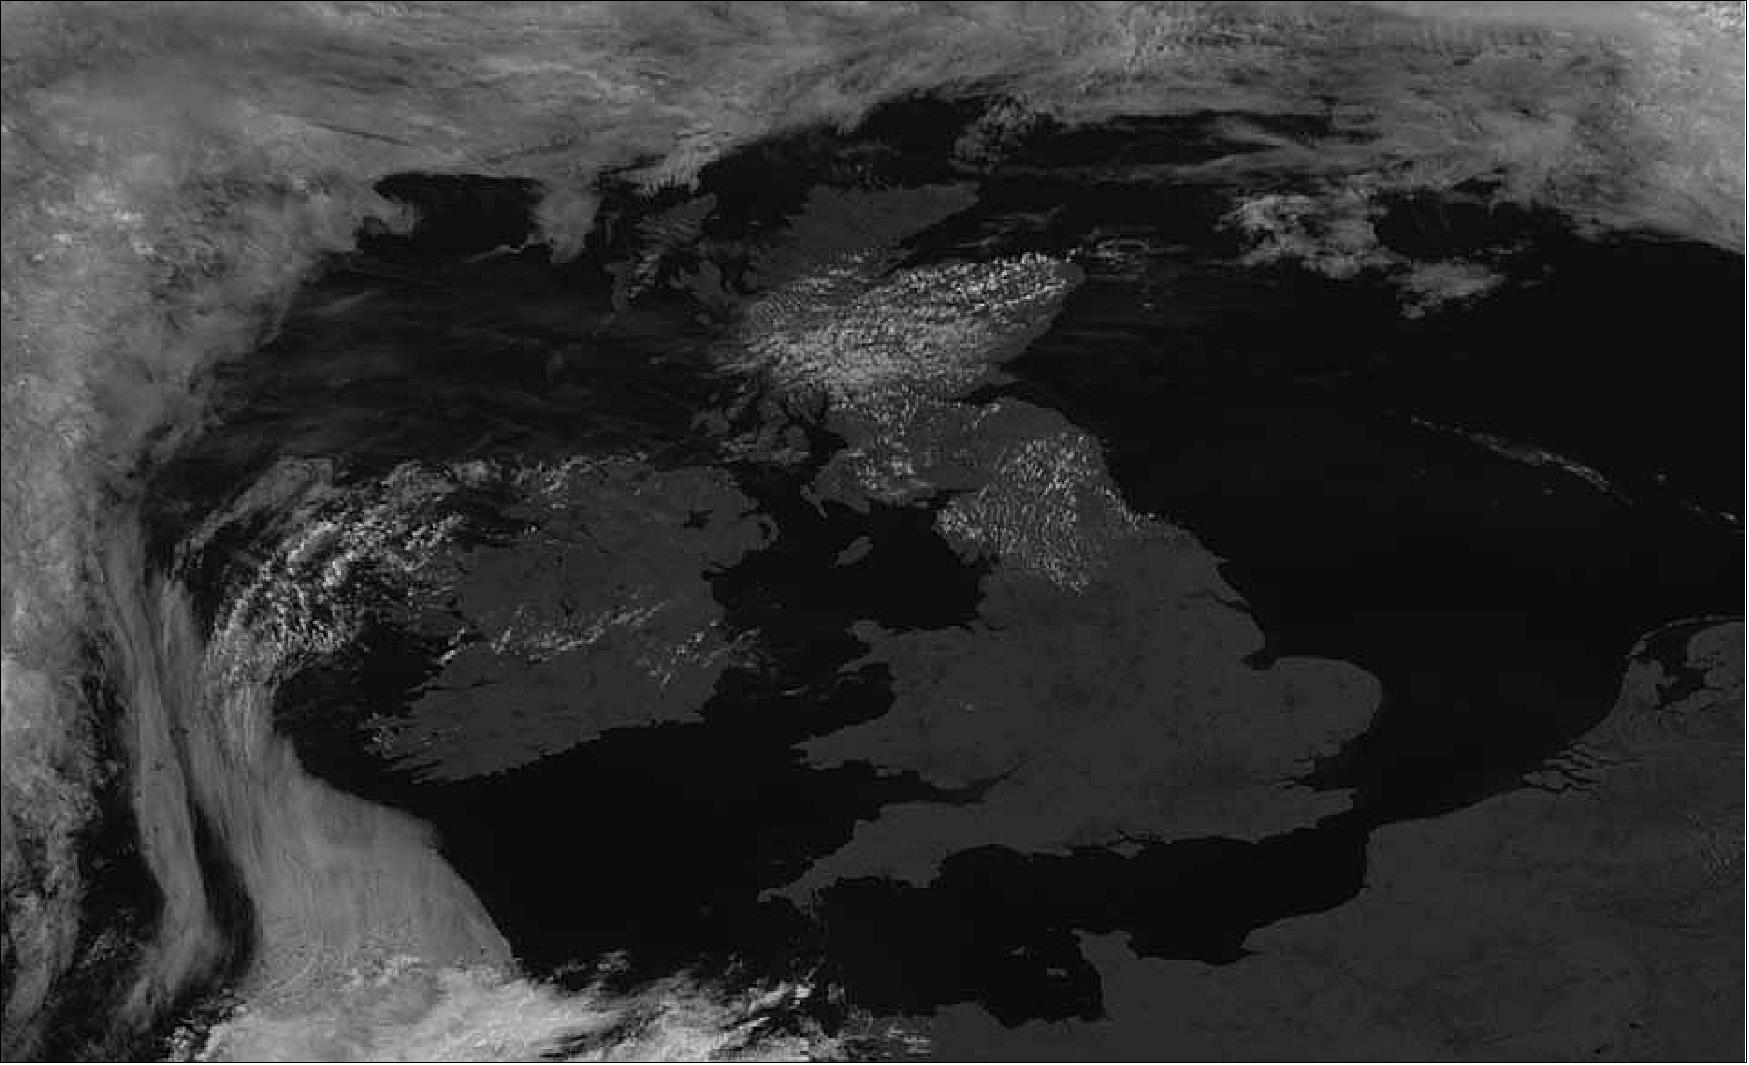
• July 19, 2016: The Meteosat-10 SEVIRI HRV (High Resolution Visible) image from 19 July 10:45 UTC (Figure 13) shows mainly clear skies over the UK, Brize Norton in Oxfordshire recorded the top temperature of 33.5 °C, — making it the hottest day of year so far. — But it was still a long way from the UK's record maximum temperature of 38.5°C, recorded on 10 August 2003 at Faversham in Kent. 23)
- In the southwest corner of the image (Figure 13), an area of cirrus moved north, heralding some heavy thunderstorms which spread north during the night across western and northern parts of the UK.
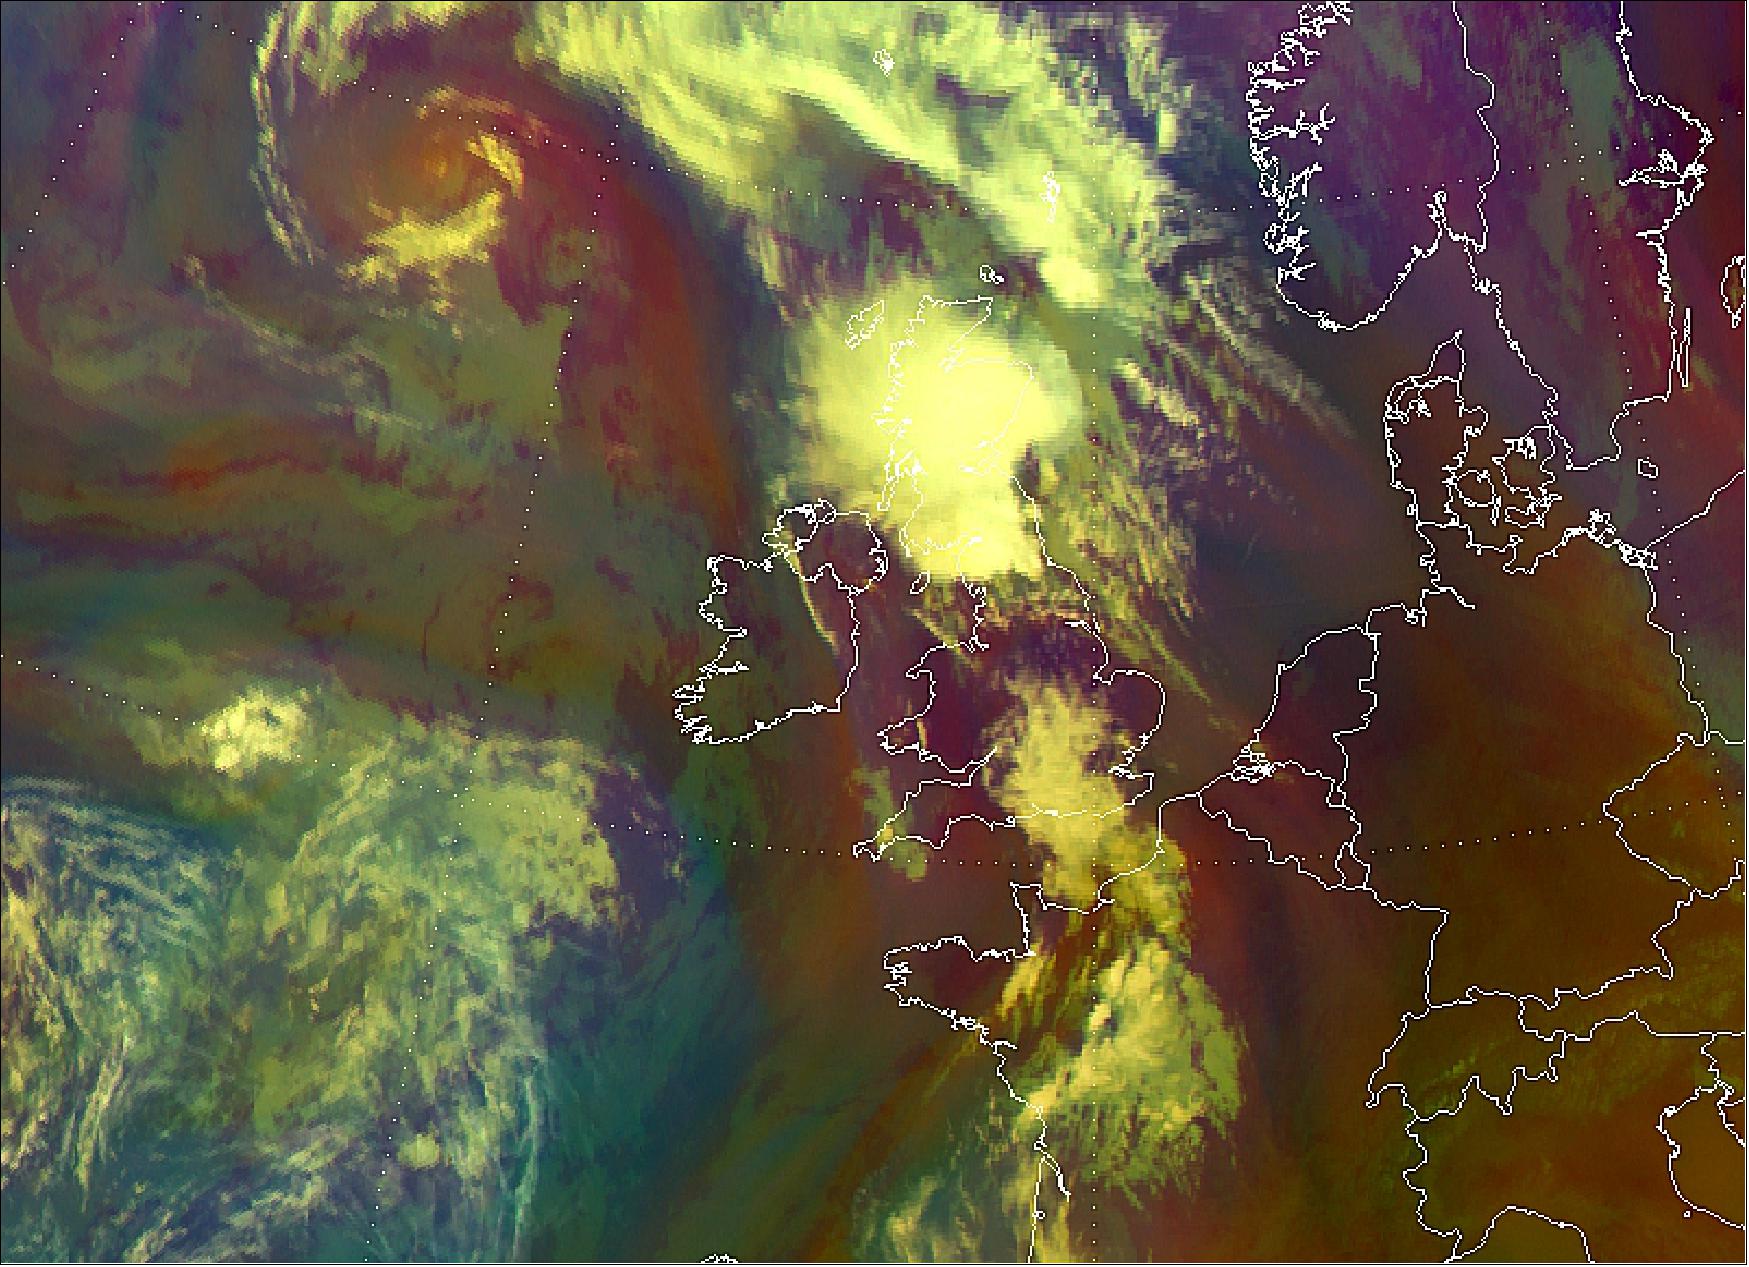
- The Airmass RGB image of Figure 14 shows a cold front moving northeast across the UK with heavy rain and thunderstorms breaking out over the northwest of England, Wales and Scotland.
• As of May 2016, EUMETSAT is operating the following geostationary satellites: Meteosat-7, -8, -9 and -10. Meteosat-7 is the only remaining MFG (Meteosat First Generation) operational spacecraft, located at 57ºE over the Indian Ocean. Meteosat-8 (in extended life since 2010), Meteosat-9 (in extended life since 2013) and Meteosat-10 are MSG (Meteosat Second Generation) series spacecraft (Figure 15). 24)
Satellite | Launch date | Longitude | Services |
Meteosat-11 (MSG4) | 15.07.2015 | 3.4º West | Back-up, In-orbit Storage until required |
Meteosat-10 (MSG3) | 05.07.2012 | 0º | Full-Disk Service, Real-time Imagery |
Meteosat-9 (MSG2) | 22.12.2005 | 9.5º East | Rapid Scan Service, Real-time Imagery |
Meteosat-8 (MSG1) | 28.08.2002 | 3.5º East | Backup service for 0º, RSS (Rapid Scanning Service) gap-filling |
Meteosat-7 (MTP) | 02.09.1997 | 57º East | IODC (Indian Ocean Data Coverage), Real-time Imagery |
• Dec. 16, 2015: After a comprehensive commissioning campaign started on 26 July 2015, involving testing of the MSG-4 satellite and evaluation of image and meteorological products, a series of formal reviews confirmed the full readiness of the MSG-4 satellite for routine operations, with all products in line with the quality requirements of operational service. 25)
- The satellite was handed over to the EUMETSAT Operations Department as Meteosat-11 and placed into in-orbit storage nominally for about two and a half years, until 2018, but is ready for activation for operations within one week, if needed.
- Meteosat-11, as the last of the successful MSG series of geostationary satellites, will provide continuity of service until MTG-I1, the first of the MTG (Meteosat Third Generation) imaging satellites, is commissioned - in 2020 - and will continue to be exploited in tandem with the new MTG-I satellites until 2025.
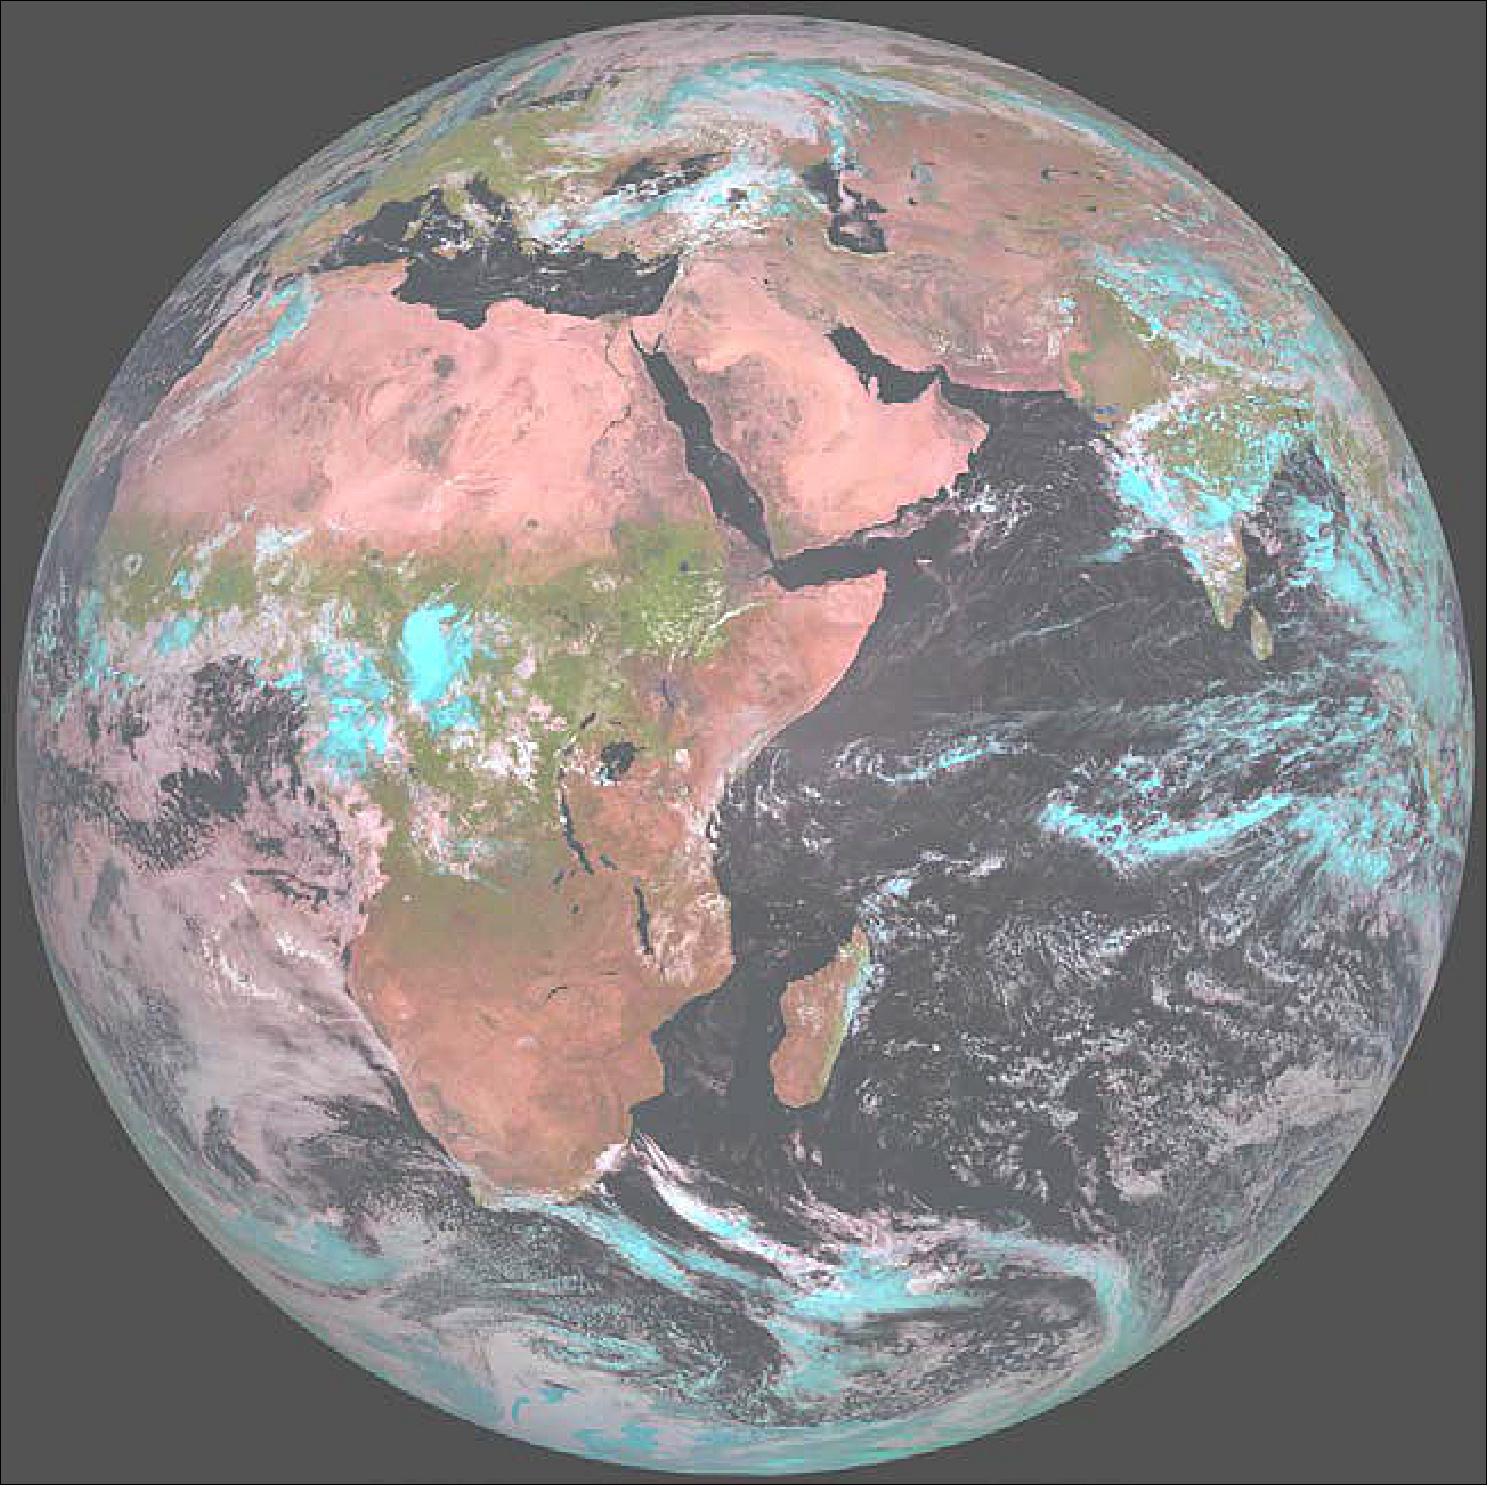
• On August 4, 2015, the SEVIRI instrument on MSG-4 (Meteosat-11) acquired its first image of Earth (Figure 16). This demonstrates that Europe’s latest geostationary weather satellite, launched on 15 July, is performing well and is on its way to becoming fully operational when needed after six months of commissioning. 27)
- ESA was responsible for the initial operations after launch (the so-called launch and early orbit phase) of MSG-4 and handed over the satellite to EUMETSAT on 26 July.
- The first image is a joint achievement by ESA, EUMETSAT and European space industry. For its mandatory programs, EUMETSAT relies on ESA to develop new satellites and procure the recurrent satellites like MSG-4. This cooperation model has made Europe a world leader in satellite meteorology by making best use of the two agencies’ expertise.
• On July 26, 2015, ESA handed control of Europe’s last Meteosat Second Generation weather satellite, MSG-4, to EUMETSAT. 28)
- After commissioning, MSG-4 will become Meteosat-11 and be ‘stored’ until it replaces one of its predecessors. It will then ensure the continuity of the data until the first Meteosat Third Generation (MTG) satellites enter service, expected in 2019 and 2021.
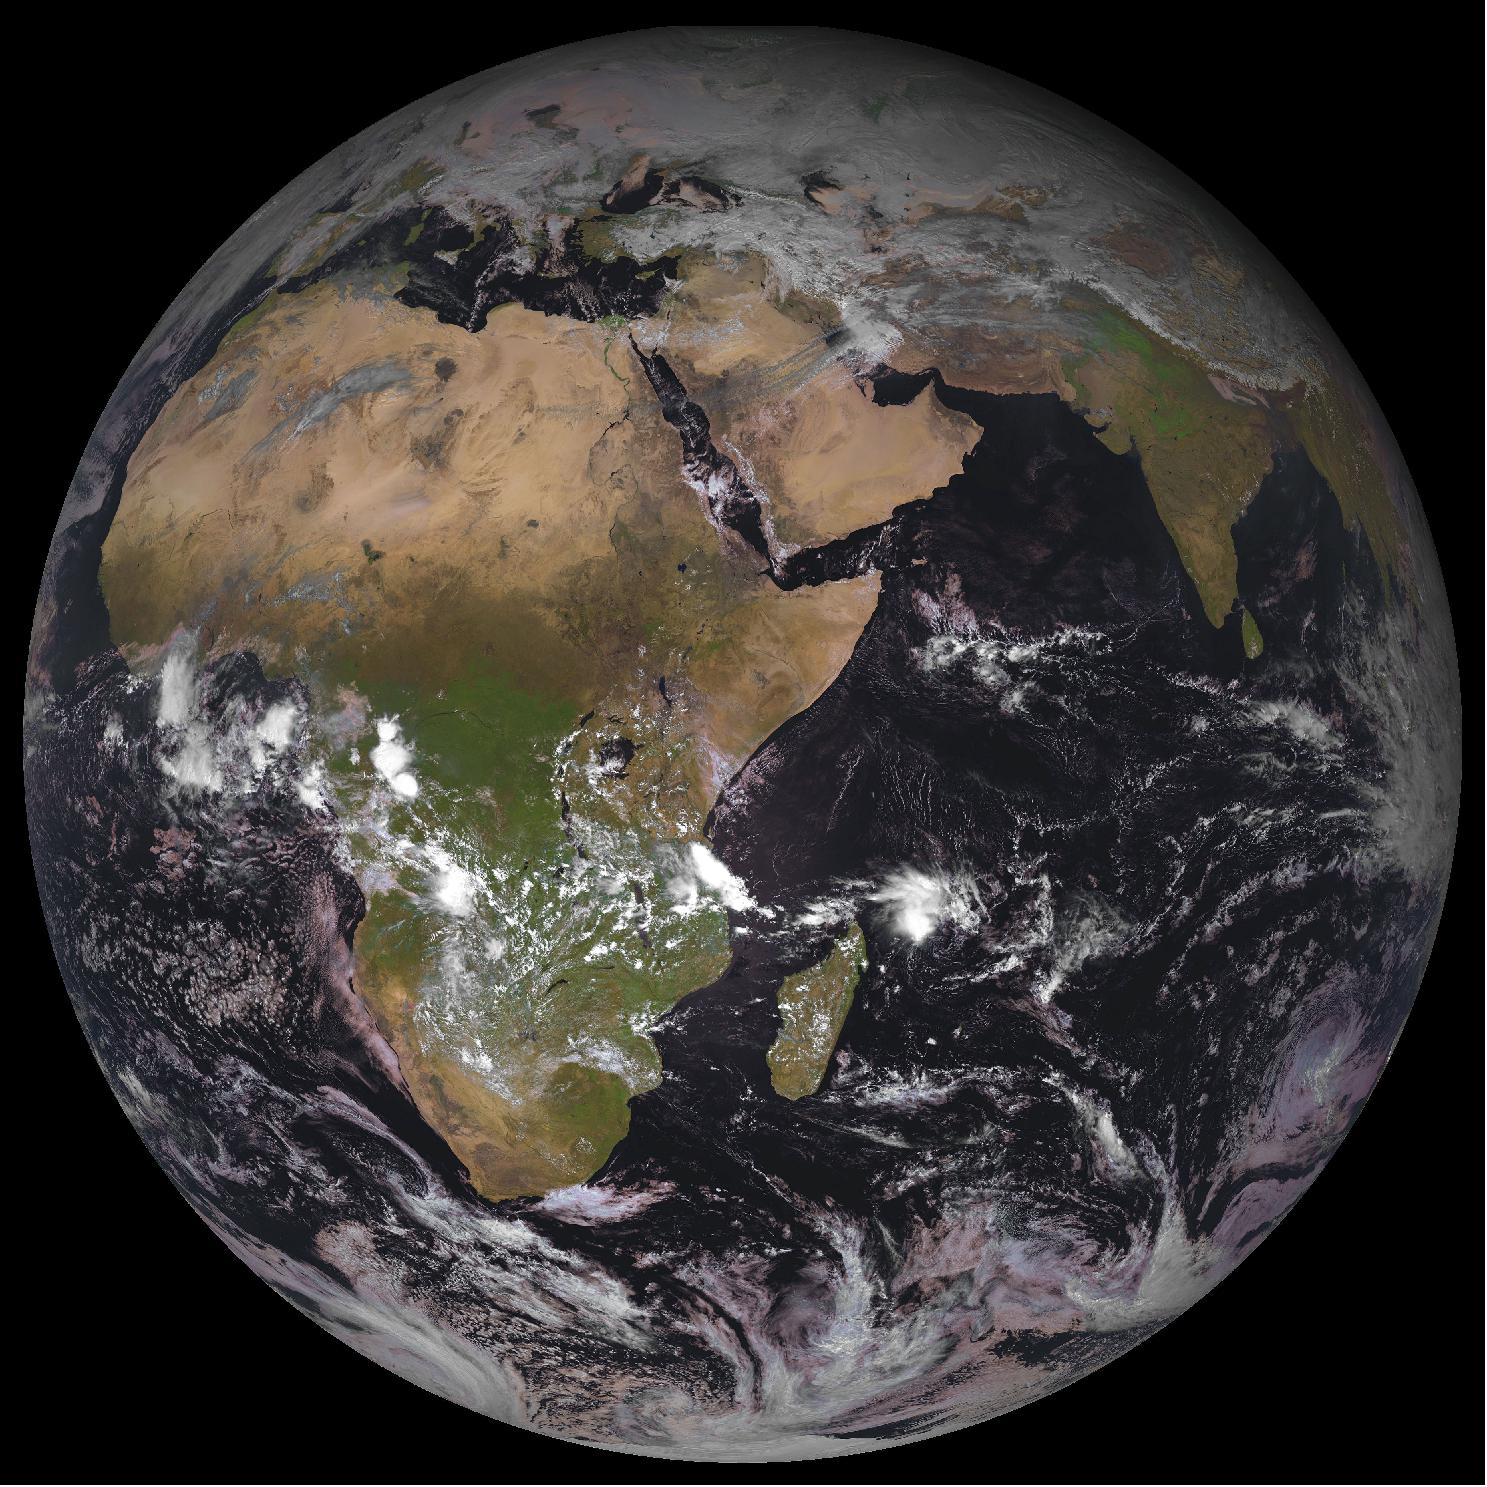
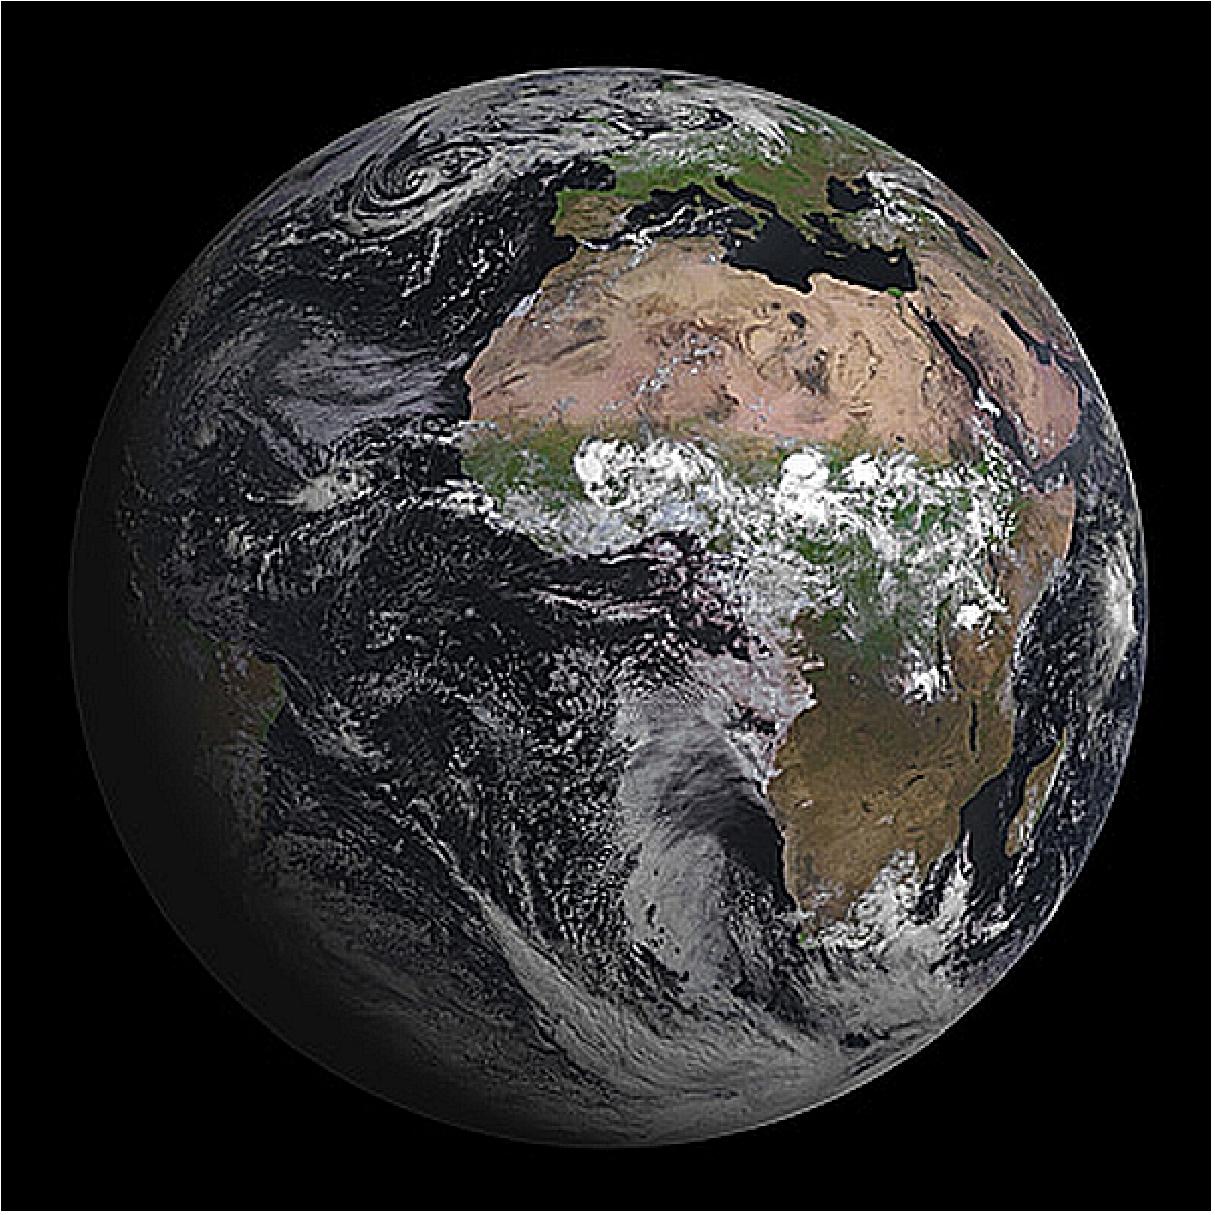
• April 22, 2015: A snapshot of our home planet captured on the morning of Earth Day by the MSG-3 (Meteosat-10) satellite of EUMETSAT. 29)
• On January 24, 2015, Meteosat-7 became the longest-serving operational satellite in EUMETSAT history, clocking up 17 years of monitoring the weather from space. When it was launched in September 1997, Meteosat-7 was the seventh and last in the Meteosat First Generation series of satellites, but was the first solely controlled by EUMETSAT. 30)
- Similar in design to its predecessors, Meteosat-7 was designated the primary operational satellite at 0° longitude in June 1998. The satellite had a design life expectancy of five years.
- An interesting development arose during Meteosat-7’s period as an operational satellite. The international scientific experiment, known as INDOEX (Indian Ocean Experiment), concluded there was a need for geostationary meteorological coverage over the Indian Ocean. EUMETSAT was the only satellite provider able fulfil this need, by moving Meteosat-5 to 63° East in 1998. Later, in July 2006, Meteosat-7 was moved to provide the IODC (Indian Ocean Data Coverage) function.
- Meteosat-7 still provides coverage over the Indian Ocean, located above the Equator at longitude 57.5 °E, at an altitude of ~35,786 km. It takes images every 30 minutes and provides a service relaying data from DCPs (Data Collection Platforms), such as buoys, in support of the tsunami warning system for the Indian Ocean. It has a good viewing angle, giving a good view of cloud systems over the Arabian Peninsula.
- Meteosat-7 is generally in good health, having suffered only a few anomalies over the years. There is approx 6.38 kg of fuel available on board — 3.9 kg is reserved for orbit raising (above GEO) at the end of the satellite’s life. The fuel budget and the in-orbit experience with Meteosat-5 and -6 gives sufficient confidence that Meteosat-7 should be able to support IODC until the end of 2016 or possibly the 1st quarter of 2017.
• June 2014: Scientists compared data from the SEVIRI (Spinning Enhanced Visible and InfraRed Imager) on board Meteosat with ground data from a thermal camera, to show the temperature of the lava lake at Nyiragongo, in the Democratic Republic of Congo. The technique was pioneered in Europe, and the researchers say it could be used to help monitor volcanoes in remote places all over the world. 31)
- The technique was first used in a study during a lava fountain at Mt Etna in August 2011. The team was surprised in finding a very similar radiant heat flux curve from the ground-based thermal camera, placed a few kilometers from Etna, and from SEVIRI on Meteosat at 36,000km above the Earth.
- Transferring the technique to Nyiragongo was important – partly because the exposed lava lake can yield data important for modelling shallow volcanic systems in general, but more importantly because advance warning of eruptions is necessary for the rapidly expanding city of Goma nearby. The research, published in the Journal of Geophysical Research: Solid Earth is the first time in which Nyiragongo’s lake has been studied using ground-based thermal images (FLIR camera) in addition to satellite data to monitor the volcano's radiative power record. 32)
- Gaetana Ganci and her colleagues from the INGV (Istituto Nazionale di Geofisica e Vulcanologia) in Italy developed an algorithm they call HOTSAT to detect thermal anomalies on the Earth’s surface temperature linked to volcanoes. They calculate the amount of heat energy being given out in a target area based on analysis of the SEVIRI images. Combining the frequent SEVIRI images with the more detailed but less frequent images from NASA’s MODIS (Moderate Resolution Imaging Spectroradiometer) instrument, they showed that temperature anomalies could be observed from space before an eruption is underway. They believe that spaceborne observations can be a significant help in the difficult task of predicting volcanic eruptions, but that providing advance warning will never be easy.
- The team developed HOTSAT with a view to making an automatic system for monitoring volcanic activity. They are now developing a new version of HOTSAT. This should allow the processing of all the volcanic areas that can be monitored by SEVIRI in near-realtime. Continuing ground-based observations will be needed for validation (Ref. 31).
• May 2014: The Meteosat- 8, -9 and -10 satellites, all from the second generation of European meteorological satellites, operate over Europe and Africa, while Meteosat-7, the last of the first generation, operates over the Indian Ocean, to fill a data gap over this region. It will be de-orbited in 2017. Meteosat-10 is the prime operational geostationary satellite, positioned at 0º and providing full disc imagery every 15 minutes. Meteosat-9 provides the Rapid Scanning Service, delivering more frequent images every five minutes over parts of Europe, Africa and adjacent seas. 33)
• On April 9, 2013, Meteosat-9 took over the rapid scanning imagery service (RSS) from Meteosat-8. This completes the reassignment of roles of the three Meteosat Second Generation (MSG) satellites following the launch of Meteosat-10 on July 5, 2012. 34)
- After being replaced in January by Meteosat-10 as the prime operational satellite supplying full disk images of Europe and Africa, Meteosat-9 now provides the RSS, delivering more frequent images every five minutes over Europe only. The two-satellite system continues the services previously delivered by Meteosat-8 and -9 in support of weather forecasters in one of their most challenging tasks, nowcasting, which involves detecting and monitoring rapidly developing high impact weather like thunderstorms or fog and issuing related warnings up to 12 hours ahead (Ref. 34).
• March 28, 2013: Ten years ago EUMETSAT revolutionized the way users can access satellite data, with the introduction of EUMETCast. EUMETCast is a data dissemination system which allows users to access numerous data streams via regular, ‘off-the-shelf’ satellite TV equipment and a PC. Every day more than 100 GB of data, from 37 data providers, are disseminated to the EUMETSAT users worldwide. 35)
For EUMETCast’s users ( > 3,000 in 2013), the system is ideal because it enables them to access various types of data via one station. It also offers:
- Secure delivery — multicast to a specific user, or group of users
- Handling of many file formats and both high and low volumes
- Quick delivery
- Worldwide coverage through the GEONETCast partnership.
• January 21, 2013: Meteosat-10 has replaced Meteosat-9 as EUMETSAT’s prime operational geostationary weather satellite after being moved to 0º. 36) — EUMETSAT provided products from Meteosat-10 in parallel with those from Meteosat-9 (which it eventually replaced) over several months. This allowed for a thorough cross-checking of data characteristics between the two satellites, and a very smooth transition for the operational use of the data.
• On Dec. 12, 2012, the MSG-3 satellite was declared ready to support the Meteosat operational services and renamed to Meteosat-10. This was done after the successful completion of in-orbit testing. 37)
In the next two months, Meteosat-10 and Meteosat-9 will deliver full Earth scan image and meteorological products in parallel, with Meteosat-10 scheduled to become the prime operational satellite on January 21, 2013 after moving to 0º. Parallel dissemination will allow users to prepare themselves before Meteosat-10 takes over.
• Oct. 23, 2012: EUMETSAT has started trial dissemination of MSG-3 image data and meteorological products to national meteorological services in the organisation’s Member and Cooperating States and to the ECMWF (European Centre for Medium-Range Weather Forecasts). 38)
• August 28, 2012: Tenth anniversary of MSG-1 (alias MeteoSat-8) on orbit. When the first MSG-1 satellite, namely MeteoSat-8, was launched on 28 August 2002, it heralded a new era of discovery for meteorologists. It became fully operational at 0º longitude at the equator on 19 January 2004 and, in addition to providing weather information in much more detail, it provided information on phenomena which had never been considered before. 39)
• On August 7, 2012, the SEVIRI instrument on MSG-3 (alias MeteoSat-10), launched on July 5, 2012, captured its first full disk image of the Earth. ESA was responsible for the initial operations after launch (the so-called launch and early orbit phase) of MSG-3 and handed over the satellite to EUMETSAT on 16 July, 2012. 40)
• July 16, 2012: Following the successful launch of the MSG-3 satellite on July 5, 2013 aboard an Ariane 5 from Europe’s Spaceport in French Guiana, and after 11 days of LEOP (Launch and Early Orbit Phase) by ESA/ESOC, EUMETSAT took control of the MSG-3 operations. 41) 42)
• In 2011, Meteosat-9 (MSG-2) is EUMETSAT's nominal operational satellite at 0º longitude, performing the full-disc mission (one image every 15 minutes on 12 spectral channels). Meteosat-8 serves as its back-up. Satellite and payload performances remain excellent.
- In 2011, the Meteosat-8 (MSG-1, backup) spacecraft and instruments are in good health. The last north/south stationkeeping maneuver was made at the end of October 2010, after which the satellite inclination will drift at a rate of about one degree/year. Provided there are no serious failures, at least six additional years of mission are possible (from a design life of seven years). Nevertheless, preparations for reorbiting operations at the end of its life have started. 43)
• Meteosat-8 (backup) and Meteosat-9 (primary service provision) are operating nominally in 2010. 44)
- The Meteor-8 spacecraft is in good health with instruments performing flawlessly. It is providing the Rapid Scan Service (RSS), complementing the 15-minute High Resolution Image data generated by the operational Meteosat-9.
- Meteosat-9 is Eumetsat’s nominal (primary) operational satellite at 0º longitude, with Meteosat-8 as its backup. Satellite and instruments performance are excellent.
• On 25 May 2009, Eumetsat extended the coverage of the AHRPT (Advanced High Resolution Picture Transmission) system on Eumetsat's Metop-A polar-orbiting satellite. The improved service provides additional coverage over the Gulf of Mexico and Indian Ocean regions. 45)
• On May 22, 2007, Meteosat-8 experienced an orbit change which was not the result of a commanded maneuver by EUMETSAT. The incident was initially detected by the Image Processing System as a change of satellite state; this orbit change event included a decrease in spin rate, a change in attitude, some nutation, a temperature change on thrusters and fuel lines, and a small drop in solar array power. A possible cause is that the spacecraft was likely hit by a micro-meteorite or space junk.
Investigations have shown that the propulsion subsystem, the thermal control subsystem, and to a lesser extent the electrical power subsystem have been affected by this incident. In particular, one of the nominal thrusters used for east-west station keeping maneuvers seems affected, possibly damaged. The redundant thruster for the same function has been tested and seems to be performing well. As the redundant branch of thrusters can be safely used, and as a new thermal configuration can be developed, there should be no impact on Meteosat-8's ability to serve as the in-orbit backup satellite, and to provide the Rapid Scanning service.
• On Jan. 3, 2006, control of the second Meteosat Second Generation (MSG-2) satellite has been passed from ESA/ESOC to EUMETSAT so that commissioning operations could start. MSG-2 became operational in July 2006 and was renamed at this point to MeteoSat-9.
• MSG-1 was declared operational on January 9, 2004 and renamed to Meteosat-8. In January 2004, at the end of the commissioning phase for MSG-1, it had been concluded that nearly all MSG mission objectives were met, and that the imaging performances are excellent, in many cases much better than the specifications. Moreover, image acquisition and the image rectification are still being achieved during the eclipses, or during the east-west maneuvers, leading to a very high mission availability. In particular: 46) 47)
- Image radiometric performance: All radiometric performances were met with significant margins.
- Image geometric performance: In all cases, including during eclipses and east-west maneuvers, the geometric performances of the rectified images are met with significant margins. In nominal cases, most of the geometric performances are met with a factor 2 to 3 better than the specification.
• MSG-1 commissioning got under way on Sept. 25, 2002. Then on Oct. 17, 2002, SSPA-C (Solid State Power Amplifier-C) failed just before switching on the SEVIRI instrument. It was to be used to re-broadcast the data that had been processed by the EUMETSAT control center.
Operational conditions of the satellite were nominal but the failure led to an automatic payload switch-off. All attempts to restart the SSPA failed and commissioning was suspended. A new satellite configuration was applied, and commissioning activities resumed on November 26, 2002.
In order to disseminate MSG-1 data, engineers extended EUMETCast, a multicast distribution system using commercial communications satellites. In this new approach, files are distributed using the DVB (Digital Video Broadcast) standard in the Ku-band for Europe via the Eutelsat Hot Bird-6 spacecraft, located at 13º East, and in the C-band for Africa via Eutelsat Atlantic Bird-3, located at 5º West (see EUMETCast heading at end of file).
• During the launch of MSG-1 in 2002 many unexpected issues were encountered that drastically affected the confidence in determining the satellite’s attitude and ultimately caused an extension to the originally foreseen timeline. Although MSG-1 was successfully delivered into the required orbit and handover attitude, ESOC’s Flight Dynamics Division had to considerably revise its attitude determination algorithms to account for the unforeseen spacecraft dynamics.
MSG-2 was therefore an opportunity to test the improvements made to the flight dynamics operational software and see whether the better understanding of the spacecraft’s dynamics would allow the operational timeline to be maintained. 48)
Prototype satellites of the preoperational program series | ||
Spacecraft | Launch date | Comments |
Meteosat-1 | 23.11.1977 | Service provision until Nov. 1979 when the imager failed prematurely. |
Meteosat-2 | 10.06.1981 | Service operation from Aug. 12, 1981 until Aug. 11, 1988 as prime satellite. |
Meteosat-3 | 15.06.1988 | Meteosat P2 was a refurbished prototype of Meteosat-2 - initially designated as Meteosat-P2 (Engineering Prototype model). |
MOP (Meteosat Operational Program) Missions | ||
Meteosat-4 | 19.04.1989 | MOP-1: First image of MOP-1 on April 19, 1989 |
Meteosat-5 | 02.03.1991 | MOP-2: Meteosat-5 acted as primary S/C for the 0º service over Europe from Feb. 1994 until 1997. |
Meteosat-6 | 20.11.1993 | MOP-3: Meteosat-6 provided image data for Europe; the S/C was retired from its regular duties in Jan. 2007. |
Meteosat-7 | 03.09.1997 | MOP-4: Meteosat-7 was part of the MTP (Meteosat Transition Program) toward MSG (Meteosat Second Generation). |
MSG (Meteosat Second Generation) Missions: | ||
Meteosat-8 | 28.08.2002 | MSG-1 became operational on 09.01.2004 and was renamed to Meteosat-8. |
Meteosat-9 | 22.12.2005 | MSG-2 became operational in July 2006 (and was renamed to Meteosat-9) providing a backup service for Meteosat-8 located at 0º longitude |
Meteosat-10 (MSG-3) | 05.07.2012 | - On July 16, 2012, ESA/ESOC handed control of the spacecraft over to EUMETSAT. Commissioning of the spacecraft and its payload at EUMETSAT consists of a two-month phase for satellite check-out and assessment, followed by a four-month phase for imaging and product testing, including calibration and validation activities. |
Meteosat-11 | 15.07.2015 | The last weather satellite in Europe’s highly successful Meteosat Second Generation (MSG) series lifted off on an Ariane 5 launcher at 21:42 GMT (23:42 CEST) on 15 July from Europe’s Spaceport in Kourou, French Guiana (Ref. 53). |
Sensor Complement
SEVIRI (Spinning Enhanced Visible and Infrared Imager)
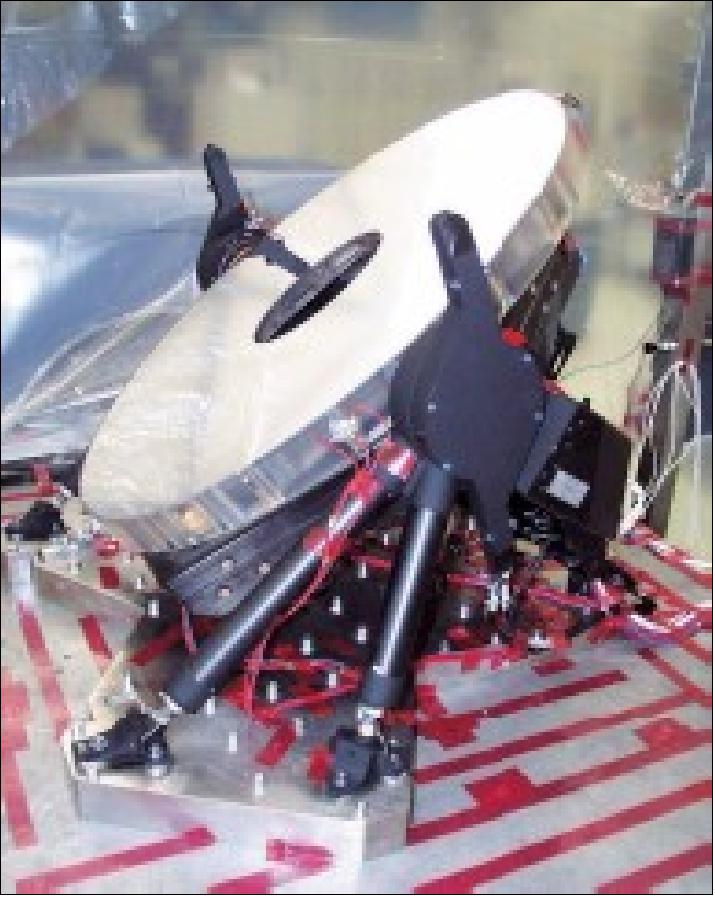
SEVIRI is the principal onboard instrument, an imaging radiometer for imaging and sounding (12 channel instrument as defined in Table 6). The instrument was designed and built by EADS Astrium SAS, France. Its operating principle is based on collecting radiation from a target area and focusing it on detectors sensitive to 12 different bands of the electromagnetic spectrum by means of a telescope. This is followed by the electronic processing of the signals provided by the detectors. Channels VIS 0.6 µm, VIS 0.8 µm, IR 1.6 µm and HRV (High Resolution Visible) are referred to as “warm”, while channels IR 3.9 to IR 13.4 µm are referred to as “cold.” The cylindrical instrument has a diameter of about 1 m and a height of 2.1 m along the spin axis of the satellite. Instrument mass = 270 kg, power = 123 W. The instrument functional architecture is based on four main assemblies: 55) 56) 57) 58) 59) 60) 61)
Background: SEVIRI is a new generation of geostationary orbit imaging instrument for meteorological applications succeeding the MVIRI instrument on the FGM (First Generation MeteoSat) spacecraft. SEVIRI studies started at the end of the 1980s. The development phase started in 1994. The first flight model was delivered in 1999 after less than 5 years of development and extensive testing. SEVIRI was then integrated into the MSG-1 spacecraft.
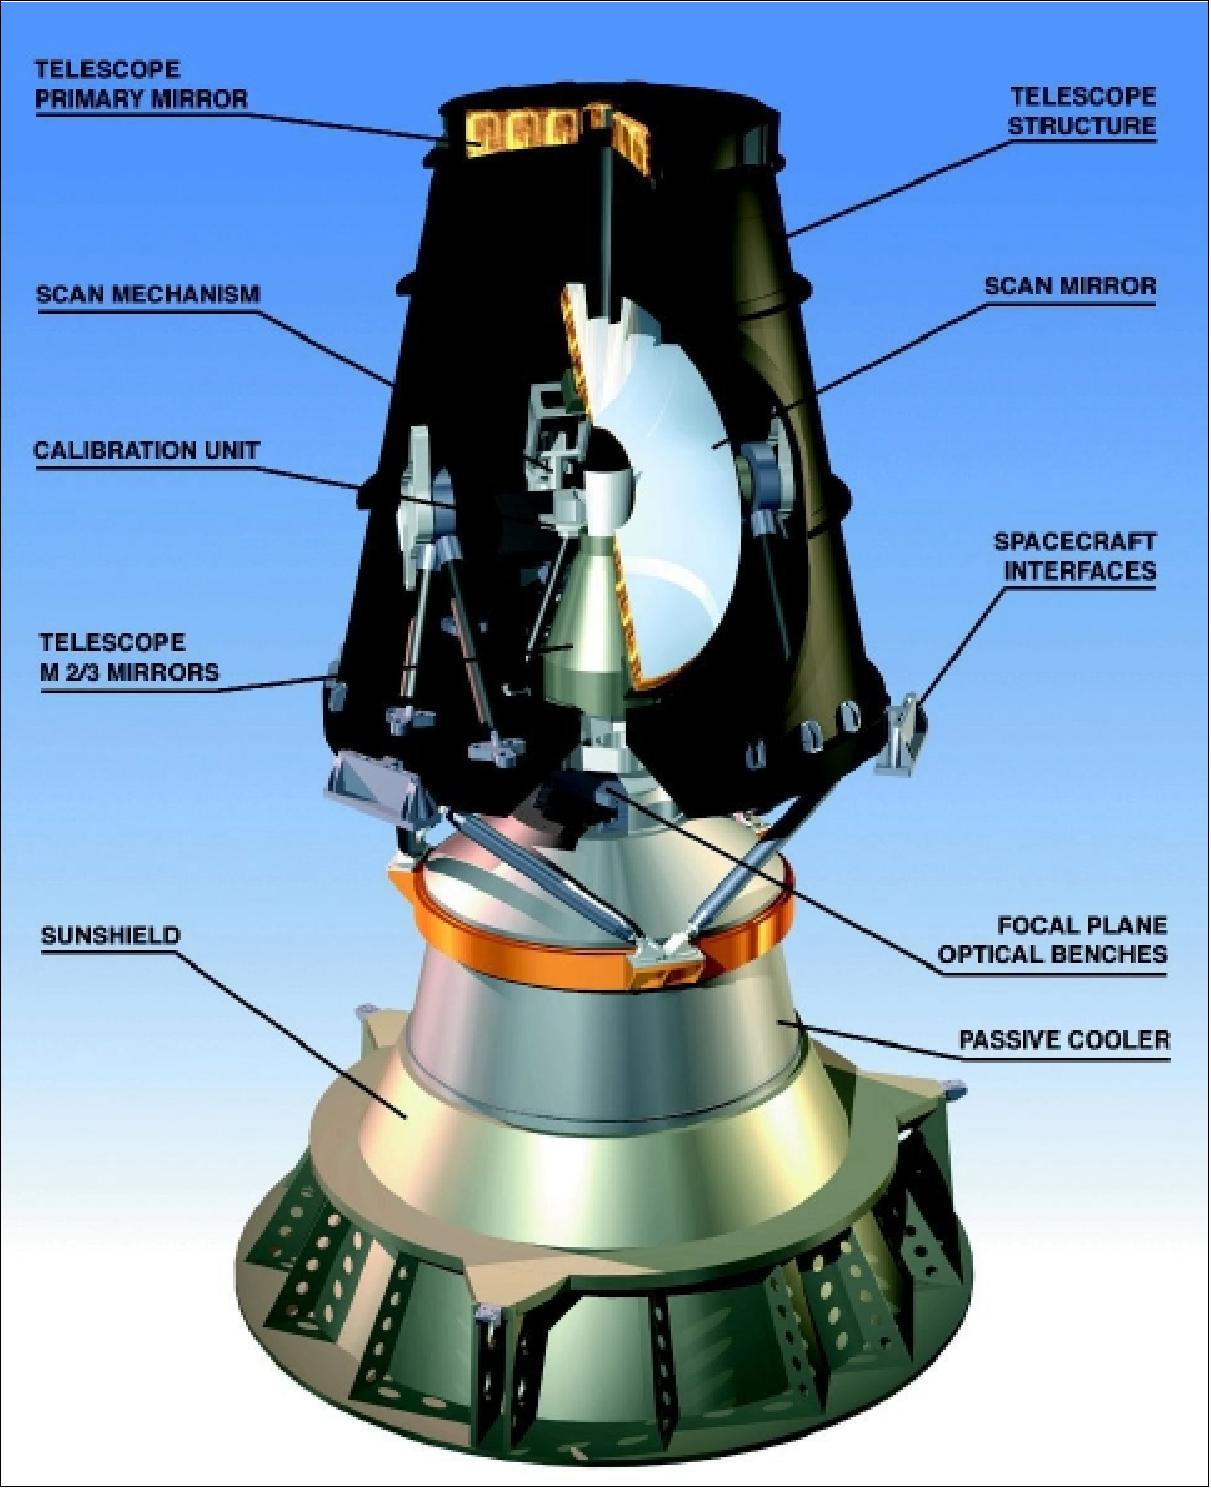
• TSA (Telescope and Scan Assembly) including the calibration unit and the refocusing mechanism. TSA employs a three-mirror telescope of compact design. The primary mirror is concave aspherical with a diameter of 510 mm. The secondary mirror is concave aspherical of 200 mm diameter. The tertiary mirror is convex a-spherical of 60 mm diameter. The total length of the telescope structure is 1.3 m. All mirrors are light-weighted and manufactured from Zerodur (Schott Glas, Mainz, Germany). The rotating scan mirror assembly uses a linear spindle drive with a stepping motor, providing continuous bi-directional image scanning.
- Scan assembly. North to south scan of the Earth: scan capability of 22º in N-S direction and 18º in E-W direction. At each satellite revolution, three image lines are acquired (9 lines for the High Resolution Visible channel) for a total of about 1250 lines in a repeat cycle of 15 minutes. Each nominal raw image consists of 3750 lines, each one containing about 3834 pixels except for HRV channel for which a nominal raw image consists of 3750 lines with 5751 pixels per line.
- REM (Refocusing Mechanism) permits for in-orbit focus adjustments. REM operates by moving the M2/M3 mirror assembly along the instrument's south-north axis.
- CALU (Calibration Unit) permits calibration of the IR channels by inserting a CRS (Blackbody Calibration Reference) source into the optical beam at the focal point of the primary mirror. A flip-flop type mechanism is employed based on a DC voice coil motor. A refocusing mechanism is included in the SEVIRI telescope to correct, on an occasional basis, for potential defocus after launch and during lifetime. It consists of a stepper motor, a transmission gear box and a roller screw to provide the translation. 62)
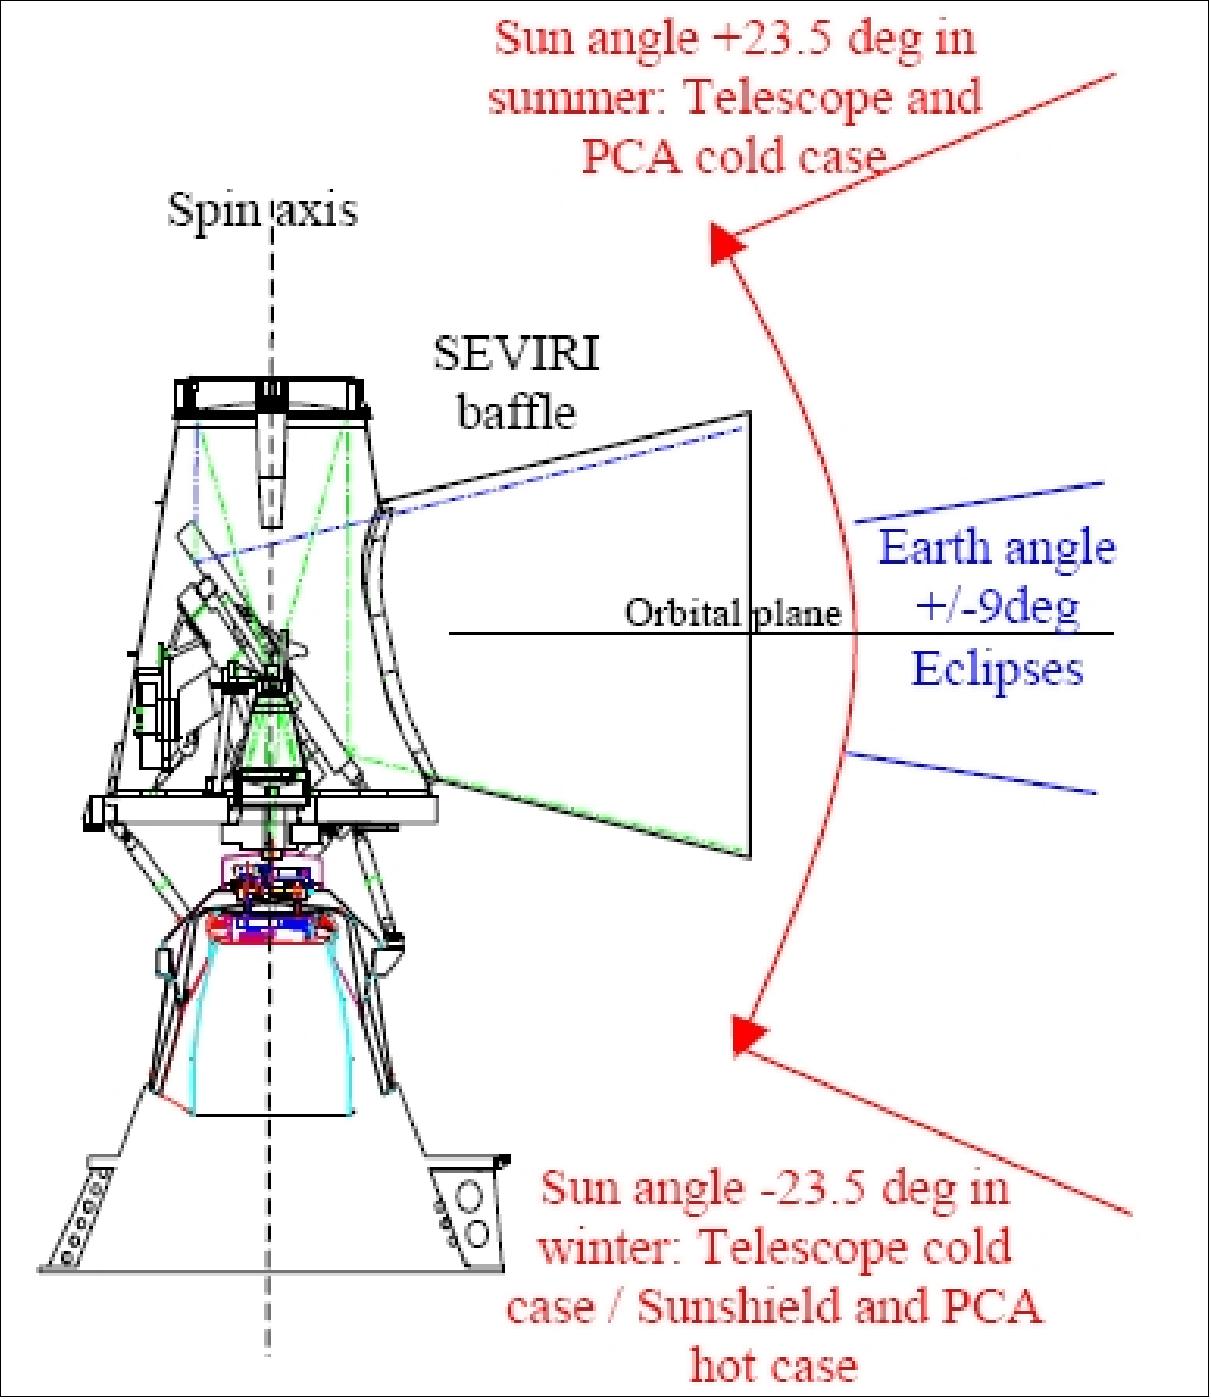
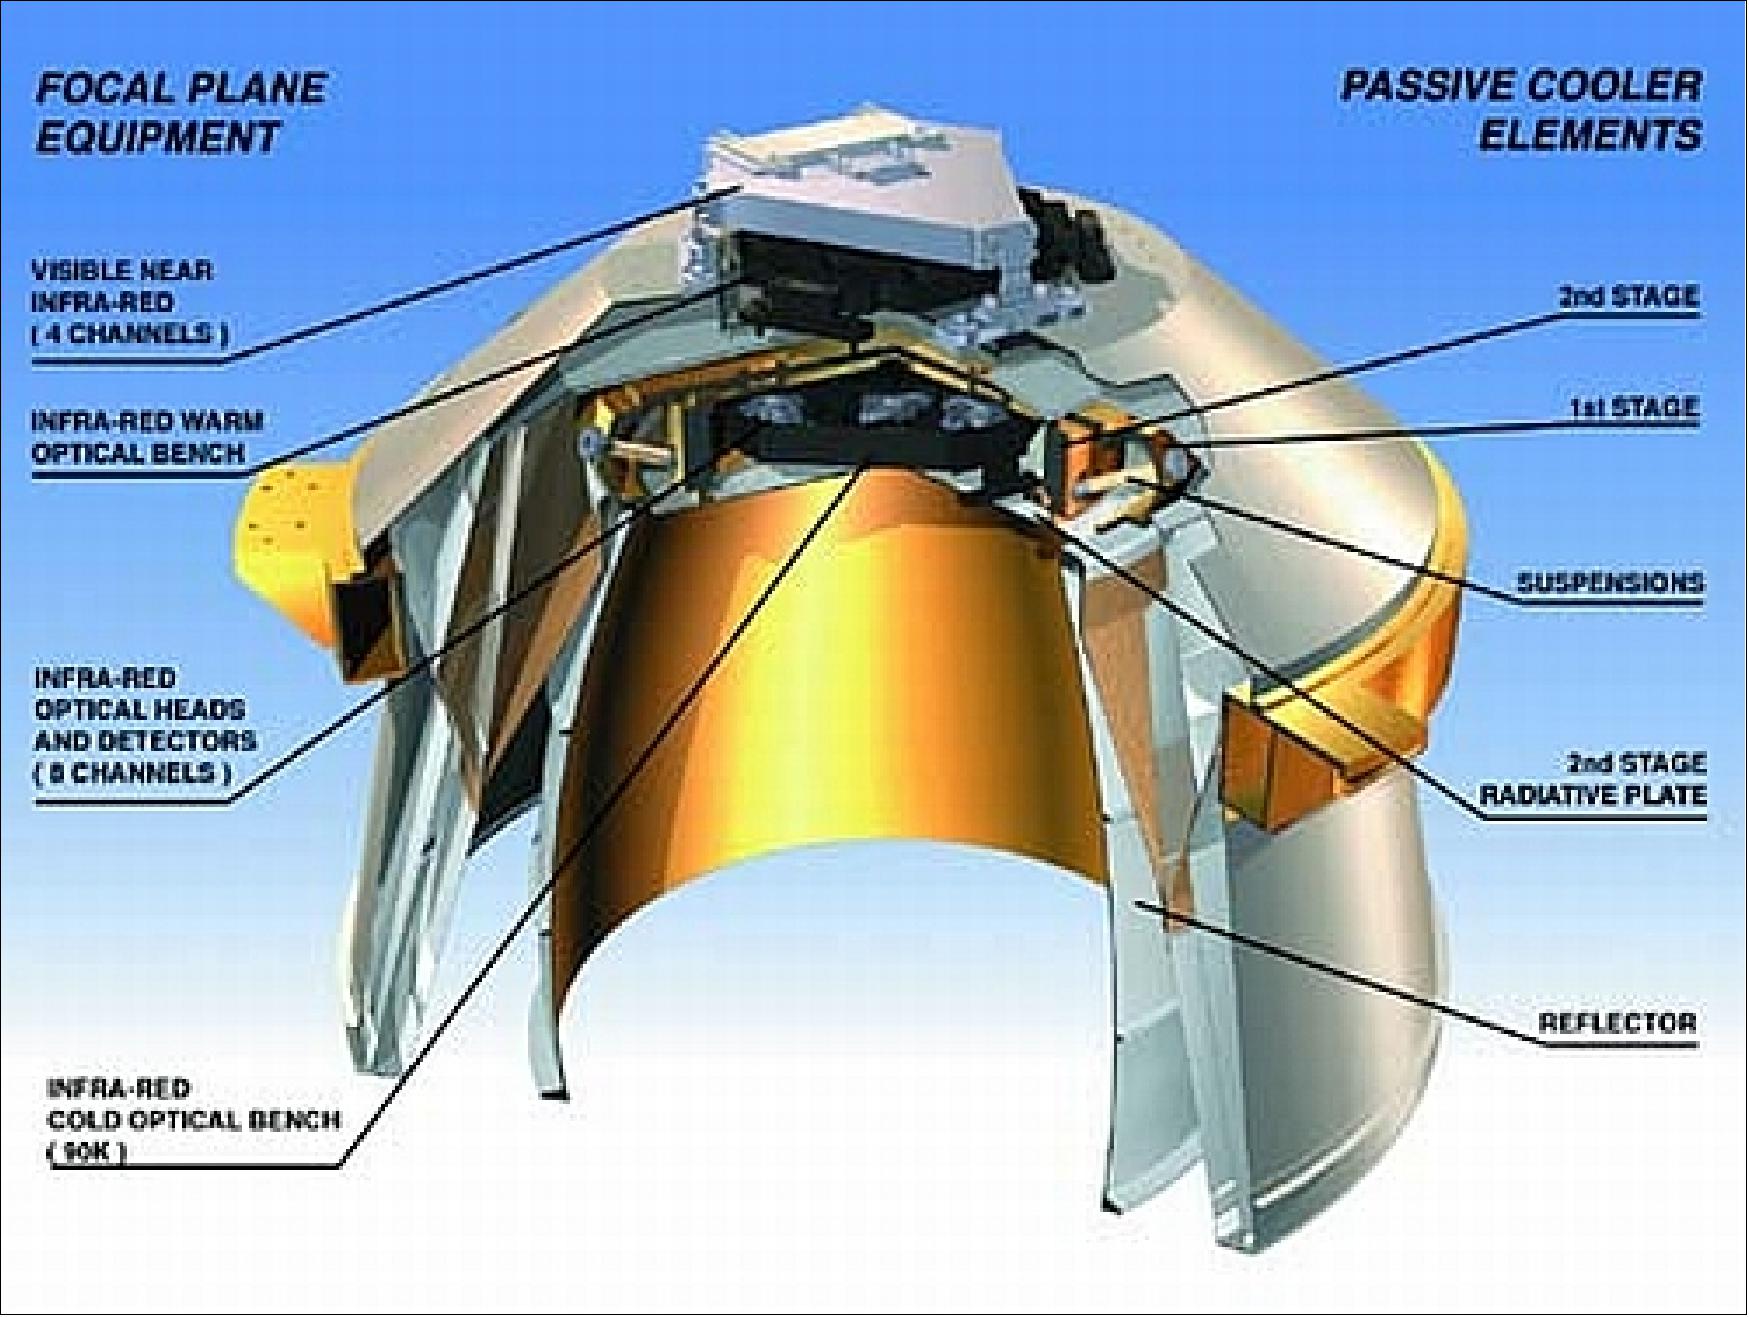
• FPCA (Focal Plane and Cooler Assembly). FPCA is a passive two-stage cooler providing an 85 K environment for the IR channels. The PCA (Passive Cooler Assembly) is a two-stage passive cooling device, composed of the radiator and the sunshield, which provide the IR detectors with a cryogenic environment. The sunshield is used to avoid direct solar radiation onto the first and second stages of the radiator.
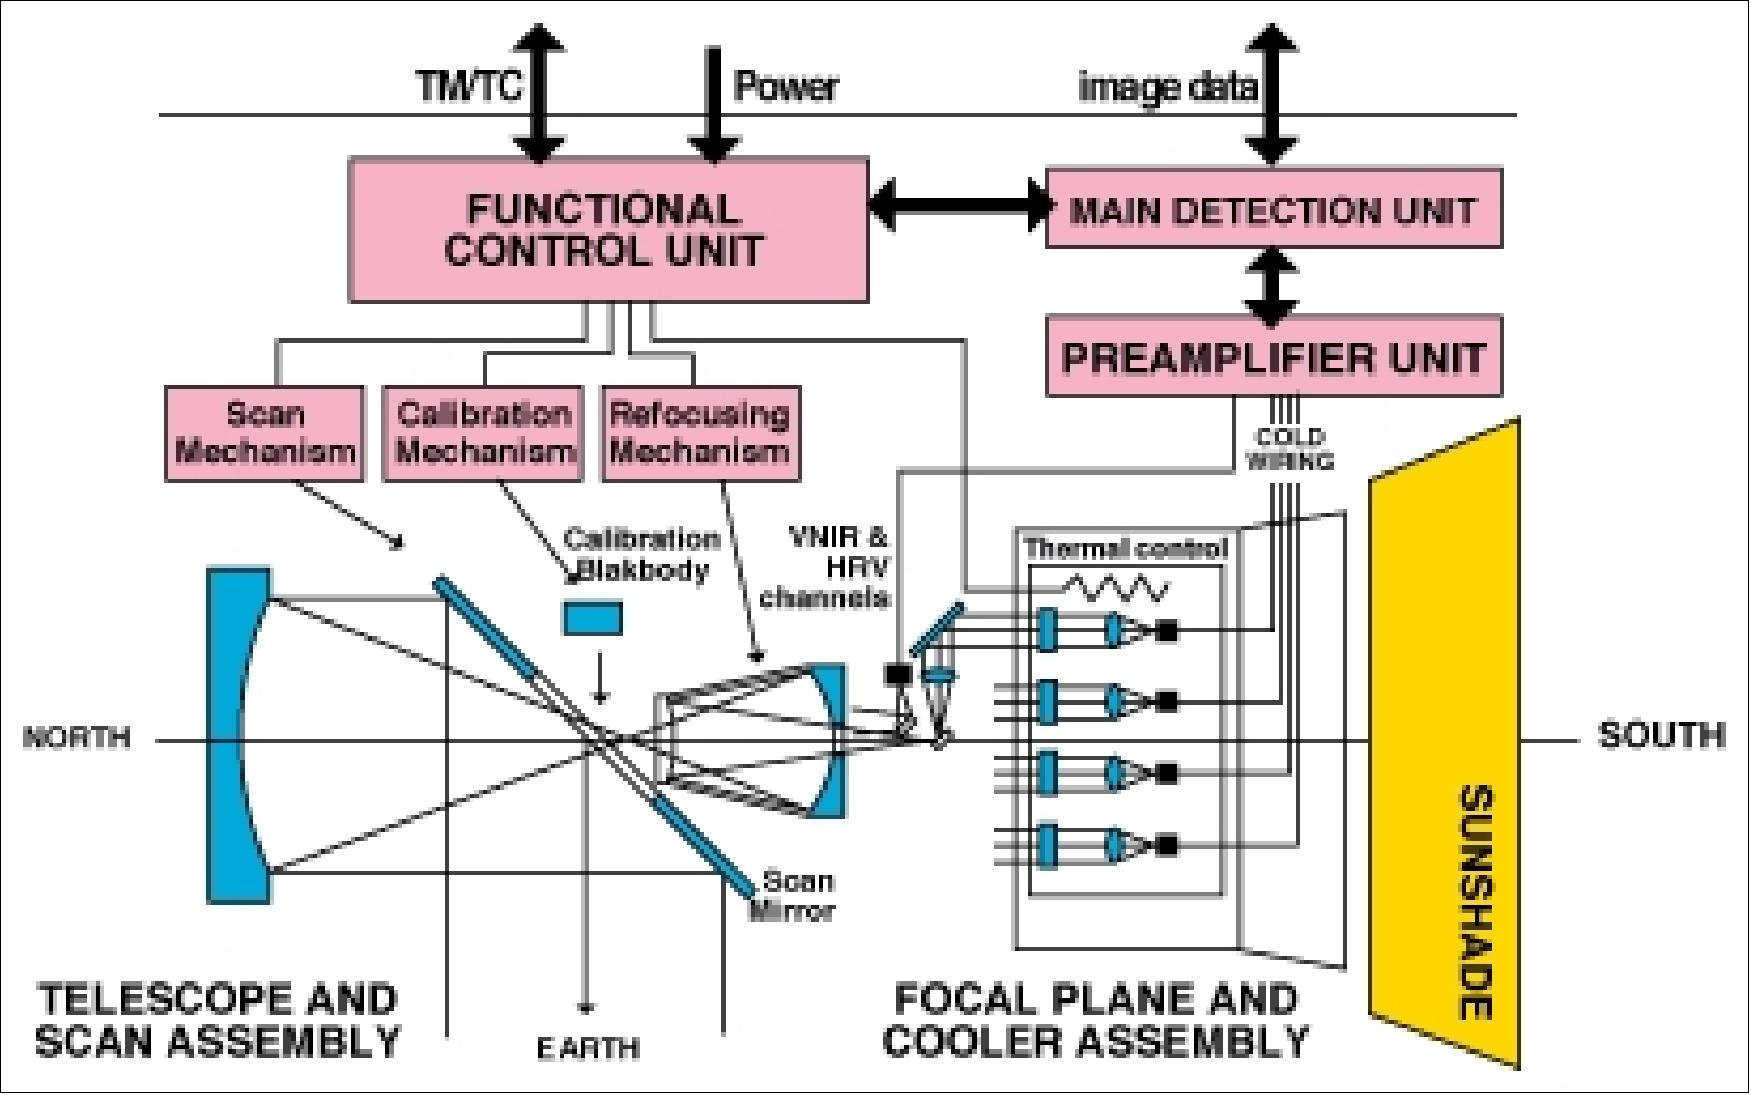
• EUA (Electrical Unit Assembly), consists of FCU (Functional Control Unit), DE (Detection Electronics) including the MDU (Main Detection Unit), the PU (Preamplifier Unit) and the detectors. EUA controls SEVIRI and processes its data. The DE consists of the detectors and the front-end electronics.
The overall SEVIRI design is based on a compact telescope and scan assembly, allowing the implementation of a large passive cooler which improves IR detector performances by lowering their operating temperature. The imaging SEVIRI radiometer is equipped with a patented three-mirror (3M) telescope of compact design (focal length of 5367 mm) which allows the insertion of a small black body for full-pupil calibration. The primary mirror (M1) is a concave circular ellipsoid (centered on the satellite axis). M1 is a 500 mm diameter mirror with a baffled central hole of 90 mm diameter. It is followed by a magnifying two-mirror assembly including the secondary mirror (M2) , which is a concave ellipsoid centered on the satellite axis, and the tertiary mirror (M3) which is a convex spherical mirror. The M2/M3 assembly is a compact ”light-tight” configuration allowing easy alignment. 63)
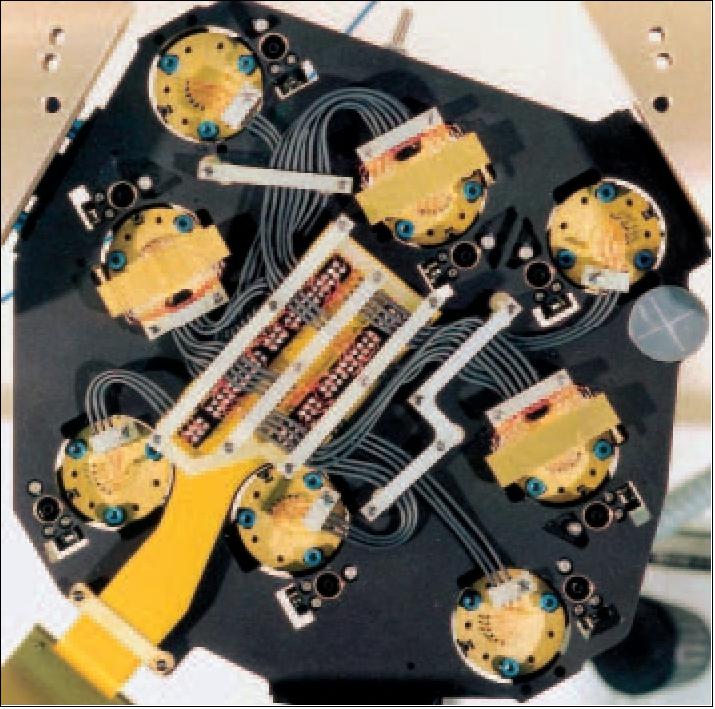
The main innovation of SEVIRI is the presence of 12 spectral channels geometrically co-registered and acquired simultaneously. The 12 channel detectors are positioned at the focal plane using a total of 42 detectors. Each channel has an array of 3 detector elements, with the exception of the HRV channel which has 9 detectors. The eight IR channels have HgCdTe detectors, they are passively cooled. The VIS channels feature photo-voltaic silicon diodes while the NIR channels have InGaAs photovoltaic diodes.
Data quantization is done inside the MDU (Main Detection Unit) by a 12 bit ADC, for an effective 10 bit resolution at the electronic outputs, after digital dynamic offset and fine gain correction. Auxiliary data are added to the detector data for image processing on ground.
Cha. No | Channel | Nominal spectral band (µm) | NEΔR or NEΔT | Max Dynamic range | |
Name | Center of λ (µm) | ||||
12 | HRV (High Resolution Visible) | Broadband (silicon response, about 0.4-1.1) | 1.07 W/(m2 sr µm) | 460 W/(m2 sr µm) | |
1 | VIS 0.6 | 0.635 | 0.56-0.71 | 0.53 W/(m2 sr µm) | 533 W/(m2 sr µm) |
2 | VIS 0.8 | 0.81 | 0.74-0.88 | 0.49 W/(m2 sr µm) | 357 W/(m2 sr µm) |
3 | IR 1.6 | 1.64 | 1.50-1.78 | 0.25 W/(m2 sr µm) | 75 W/(m2 sr µm) |
4 | IR 3.9 | 3.90 | 3.48-4.36 | 0.35 K at 300 K | 335 K |
5 | WV 6.2 | 6.25 | 5.35-7.15 | 0.75 K at 250 K | 300 K |
6 | WV 7.3 | 7.35 | 6.85-7.85 | 0.75 K at 250 K | 300 K |
7 | IR 8.7 | 8.70 | 8.30-9.10 | 0.28 K at 300 K | 300 K |
8 | IR 9.7 | 9.66 | 9.38-9.94 | 1.5 K at 255 K | 310 K |
9 | IR10.8 | 10.80 | 9.80-11.80 | 0.25 K at 300 K | 355 K |
10 | IR 12.0 | 12.00 | 11.00-13.00 | 0.37 K at 300 K | 335 K |
11 | IR 13.4 | 13.4 | 12.40-14.40 | 1.8 K at 270 K | 300 K |
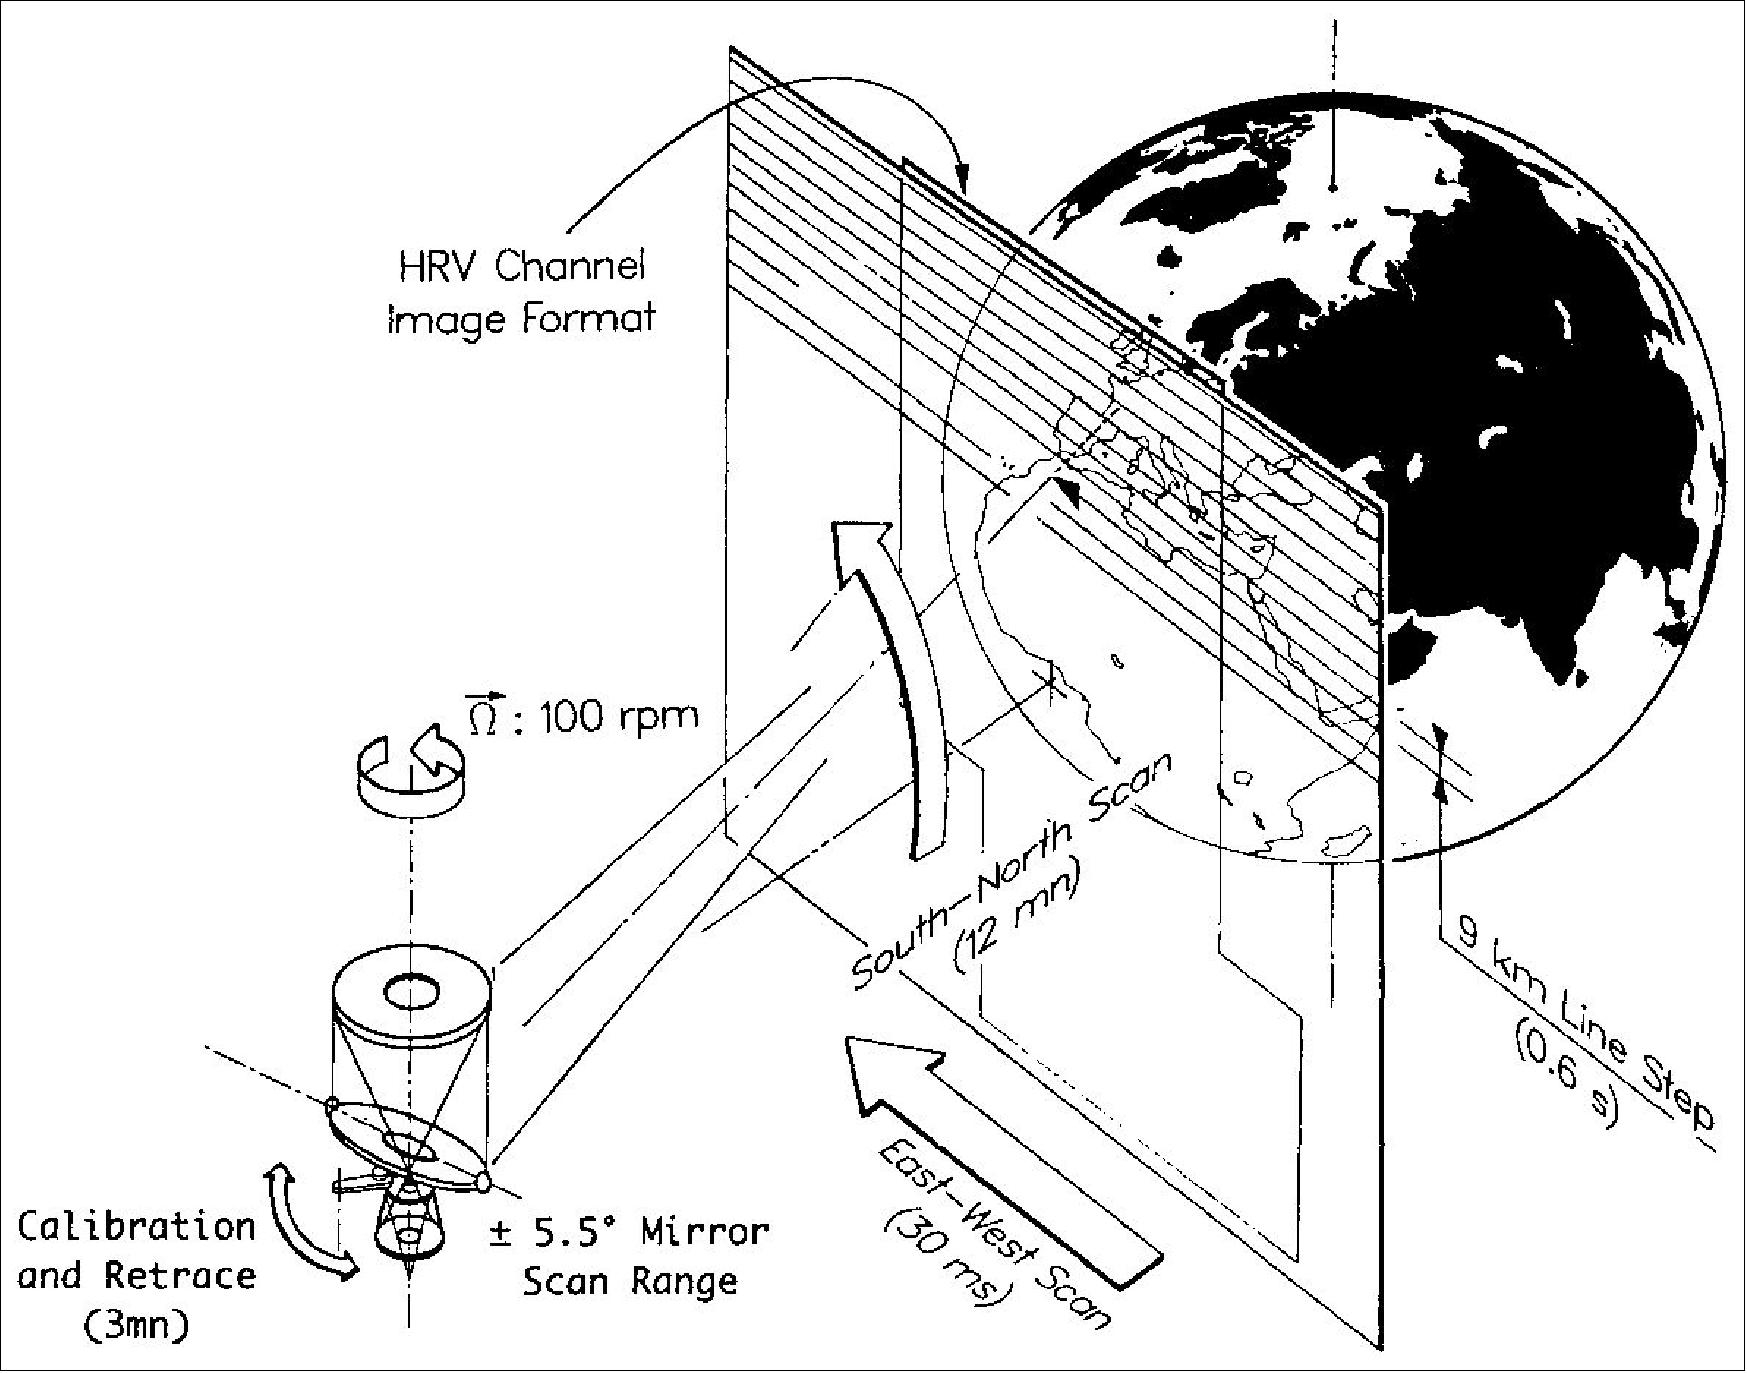
The Earth's radiation enters the instrument at every revolution through a 50 cm x 80 cm aperture. The nominal repeat cycle of 15 minutes was the driver in selecting the number of detectors per channel and the spin rate (100 rpm). Twelve minutes are allocated to the imaging phase, leaving three minutes for calibration, retrace and stabilization. The 1 km sampling at SSP of the HRV channel is achieved by using 9 broadband detection elements. The other channels are sampled at 3 km SSP by using 3 narrow-band detection elements per channel.
Spatial resolutions: SEVIRI observes the Earth-atmosphere system with a spatial sampling distance of 3 km at SSP in 11 channels while the HRV channel covers half the full disk with a 1 km spatial sampling at SSP. The actual IFOV of the channels is about 4.8 km (11 channels) and 1.67 km (HRV), respectively, at SSP. The detector sizes are:
- 5,625 pixels x 11,250 pixels for the 1 km sampling channel (HRV)
- 3,750 pixels x 3,750 pixels for the 3 km sampling channels
SEVIRI imaging is performed by combining S/C spin and rotation (stepping) of the scan mirror (optomechanical instrument). The images are taken from east to west. The E-W scan is achieved through the rotation of the S/C with a nominal spin rate of 100 revolutions/min. The spin axis is nominally oriented parallel to the north-south axis of the Earth. The scan from south to north is achieved through the scan mirror covering the Earth's disk with about 1250 scan lines; this provides 3750 image lines for channels 1-11 since three detectors are used for the imaging. A nominal repeat cycle is a full-disk imaging of about 12 minutes, followed by the calibration of the thermal IR channels with an onboard blackbody that is inserted into the optical path of the instrument. Then the scan mirror returns to the initial scanning position. 64)
Earth frame East-West | 18.40º (321.5 mrad.), HRV: 9.2º (160.7 mrad) |
Earth frame North-South | 18.01º (314.4 mrad.) |
Scan range North-South | 20.0º (384 mrad., 1527 steps) |
Scan line step | 51.88 arcsec (251.5 µrad., 9 km at SSP) |
Scan mechanism step | 25.94 arcsec (125.8 µrad., 9 km at SSP) |
Spin rate | 100 rpm |
Line cycle | 0.6 s |
Imaging time per line | 30.672 ms (5%); HRV: 15.336 ms |
Earth imaging time | 12.5 minutes |
Calibration, retrace and stabilization | 2.5 minutes |
Repeat cycle | 15 minutes |
Channel groups | Scanning parameters | Data rate before stretching | Data rate after |
3 VNIR channels | 3 detectors per channel | 11.25 Mbit/s | 0.5751 Mbit/s |
8 IR channels | 3 detectors per channel | 30.00 Mbit/s | 1.5336 Mbit/s |
1 HRV (High Resolution Visible) channel | 9 detectors per channel | 33.75 Mbit/s | 0.8627 Mbit/s |
Total |
| 75 Mbit/s | 2.9714 Mbit/s |
SEVIRI employs the classical calibration approach using deep space as cold source and a known onboard source as a warm reference. The onboard blackbody temperature is used to determine the correction factor accounting for the different levels of background flux. The deep-space view is performed via the full optical path by commanding the acquisition of a sufficient number of samples during that part of the S/C revolution, when neither the Earth nor the sun (or moon) is in the FOV of SEVIRI. 65)
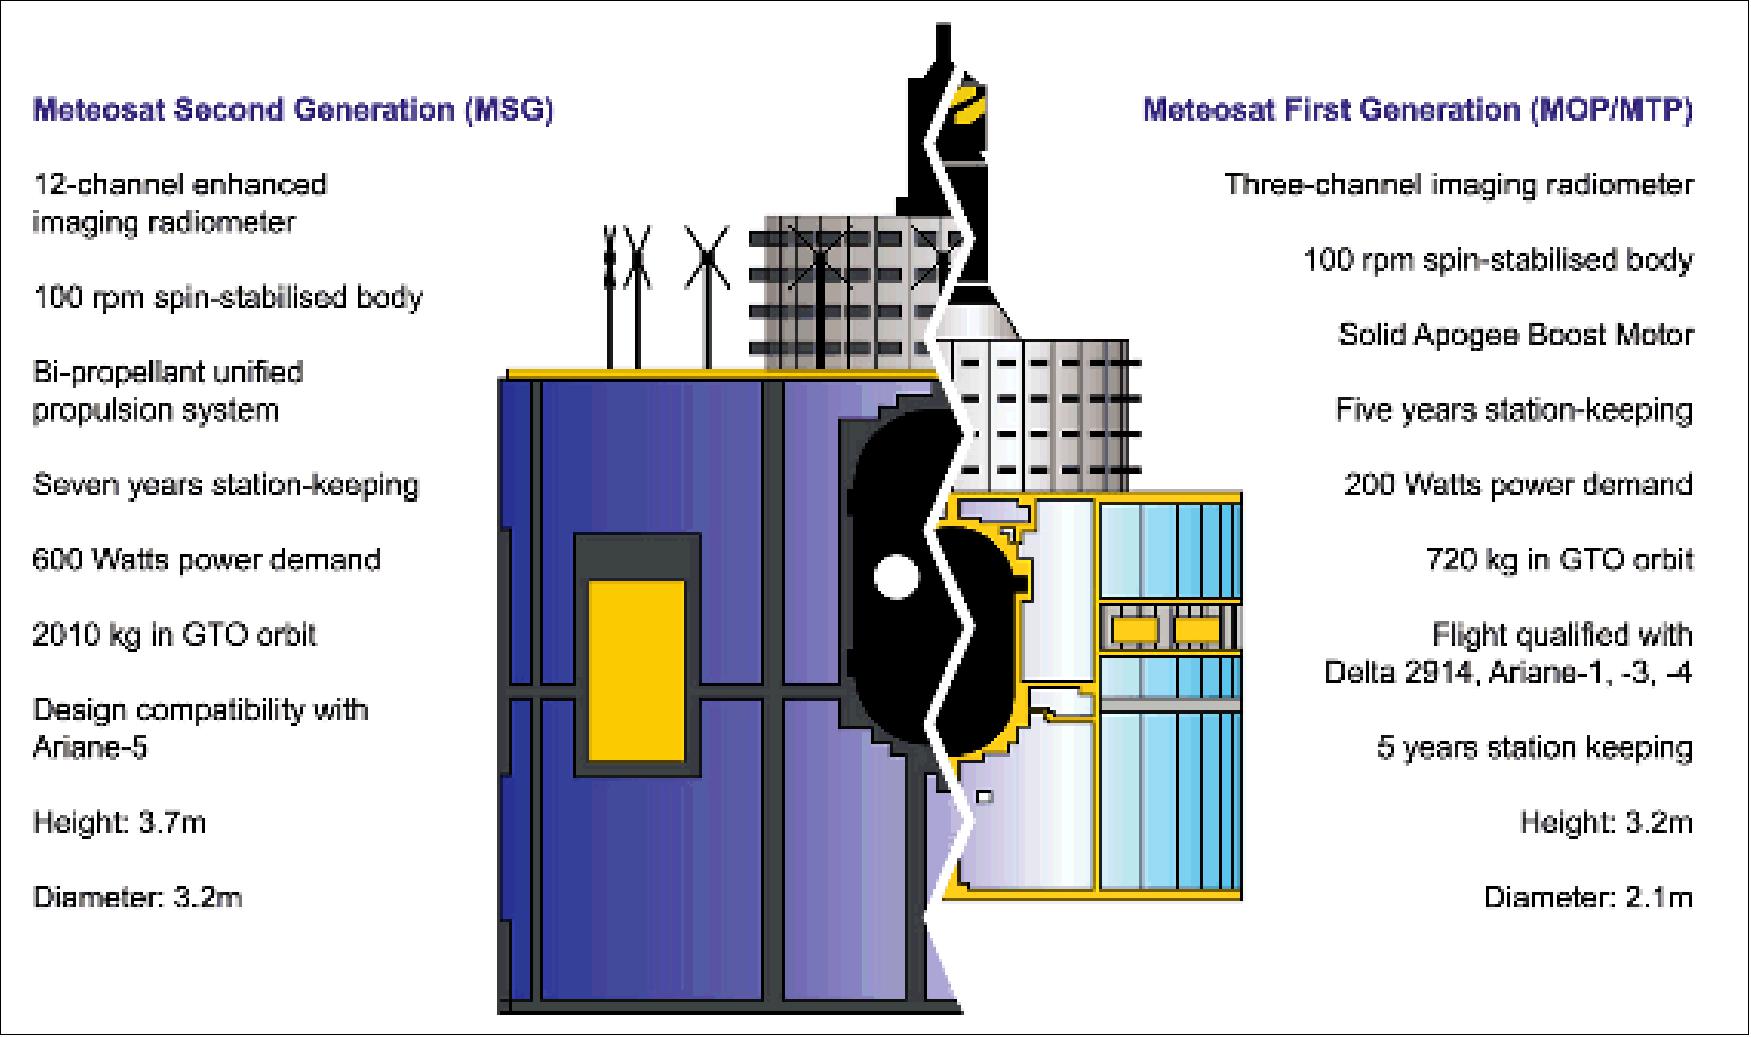
Parameter / Satellite-Instrument | MVIRI (Meteosat First Generation) | SEVIRI (Meteosat Second Generation) |
Imaging cycle | 30 minutes | 15 minutes |
Visible channels | 1 (0.5 - 0.9 µm) | 4 (0.4-1.6 µm) inclusive HRV |
Infrared channels | 2 (6.4 µm & 11.5 µm) | 8 (3.9-13.4 µm) |
Resolution of visible channels | 2.25 km | 1 km HRV |
Resolution of infrared channels | 5 km | 3 km |
Detectors | 4 | 42 |
Instrument mass, average power | 65 kg, 17 W | 260 kg, 150 W |
Instrument size (height/diameter) | 1.35 m / 0.72 m | 2.43 m / 1.5 m |
Instrument average data rate | 0.33 Mbit/s | 3.26 Mbit/s |
GERB (Geostationary Earth Radiation Budget)
GERB is an AO (Announcement of Opportunity) instrument, and provided on a national funding basis by a consortium led by the UK (NERC, RAL, IC), Belgium (OSTC, IRMB) and Italy (ASI). RAL of UK provides overall instrument management, systems engineering and other services (consortium lead). PI: J. Harries, Imperial College London (ICL). 66) 67) 68) 69) 70) 71) 72) 73) 74) 75)
GERB is an absolute radiometer of high measurement accuracy with the objective to monitor the Earth's radiation budget (global climate change, food production and natural disaster prediction) measuring at the top of the atmosphere (continuous temporal sampling), in particular the reflected shortwave and the emitted longwave regions of the spectrum, essential for the understanding of the Earth's climate balance.
The instrument is composed of two main elements, the IOU (Instrument Optical Unit) and the IEU (Instrument Electronics Unit), featuring the following basic design:
• Three-mirror anastigmatic system (TMA) + one rotating and one flat folding mirror
• Wide-band linear detector array (256 thermoelectric elements)
• Continuously rotating scan mechanism
• Channel separation via quartz filter
• Blackbody for thermal calibration
• Solar diffuser for shortwave calibration
• Passive thermal design
• Structure based on solid optical bench
Spectral bands (2) | 0.32 - 4.0 µm (Shortwave) | 0.32 µm to ≥ 100 µm (Longwave) |
Radiometry: |
|
|
IFOV or pixel size (resolution) | 44.6 km x 39.3 km (NS x EW) at nadir | |
Coverage, cycle time | Full Earth disk, all channels in 15 minutes | |
Co-registration | Spatial: 3 km with respect to SEVIRI at satellite sub-point | |
Spectral and MTF | Performance specified by templates | |
Instrument mass; power; size | 25 kg; 35 W average; 45 cm x 20 cm x 20 cm | |
Data rate | 50.6 kbit/s | |
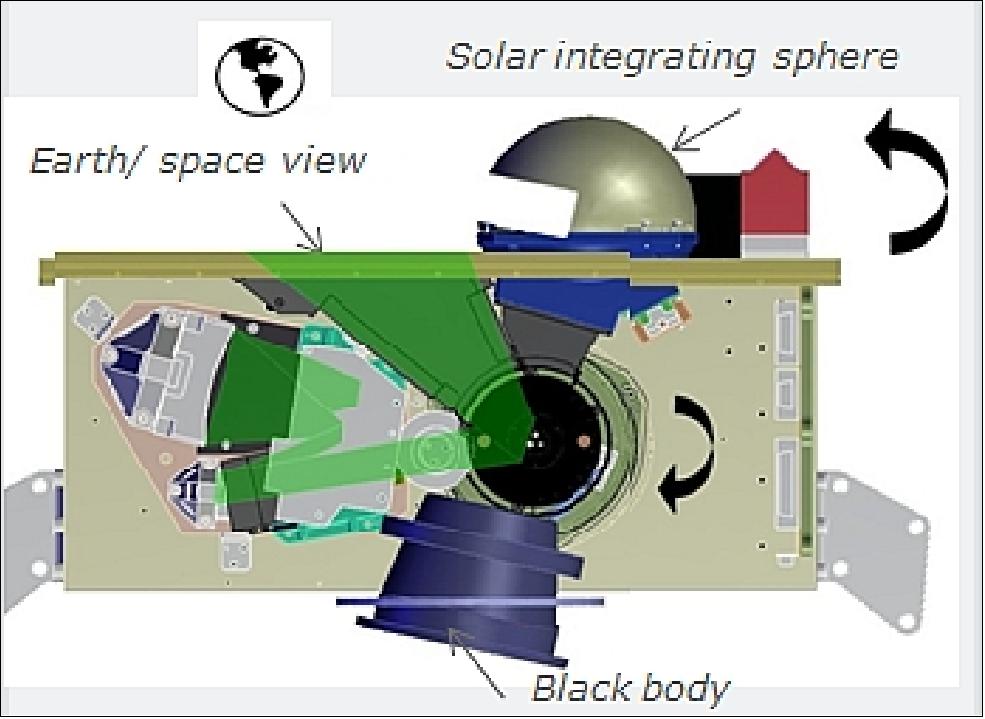
The IOU measures 450 mm x 200 mm x 200 mm and contains the imaging optics, detector system, de-spin mirror and driving mechanism, the quartz filter mechanism, the on-board blackbody and the short wavelength calibration monitor.
The IEU receives detector data, formats it and passes it on to the spacecraft data-handling system. It also provides regulated power to all the subsystems, thermal control of the IOU, command and data interfaces and instrument health monitoring and control.
At the core of the GERB instrument is a broadband, three mirror telescope housed in the IOU. This views the Earth with a black wideband detector array, providing measurements of the Earth's output radiation in a total band, and a shortwave band. Shortwave measurements are accomplished by using a quartz filter to block the wavelengths beyond 4 µm. The longwave band is obtained by subtraction. GERB removes the effect of S/C spin (100 rpm) by means of a rotating mirror, this increases the length of available exposure time per spin [use of a de-scanning mirror for staring at appropriate targets, continuously rotating at 50 rpm in the opposite direction the the satellite's rotation at 100 rpm, thus freezing the view of the Earth for a period of 40 ms].
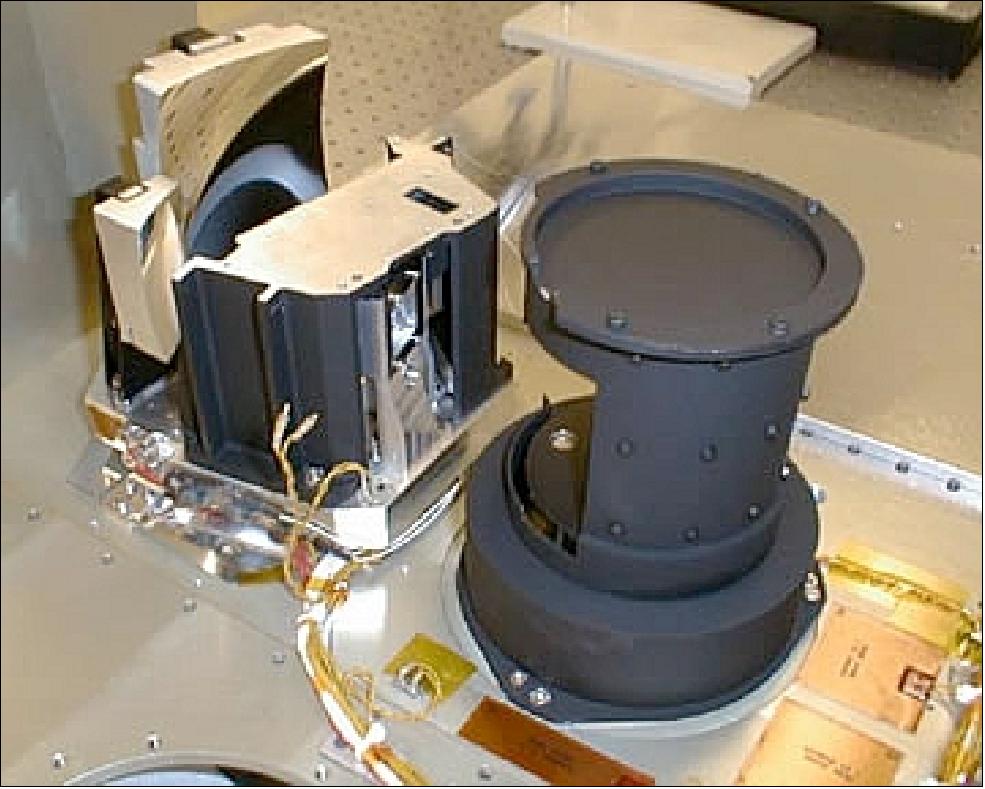
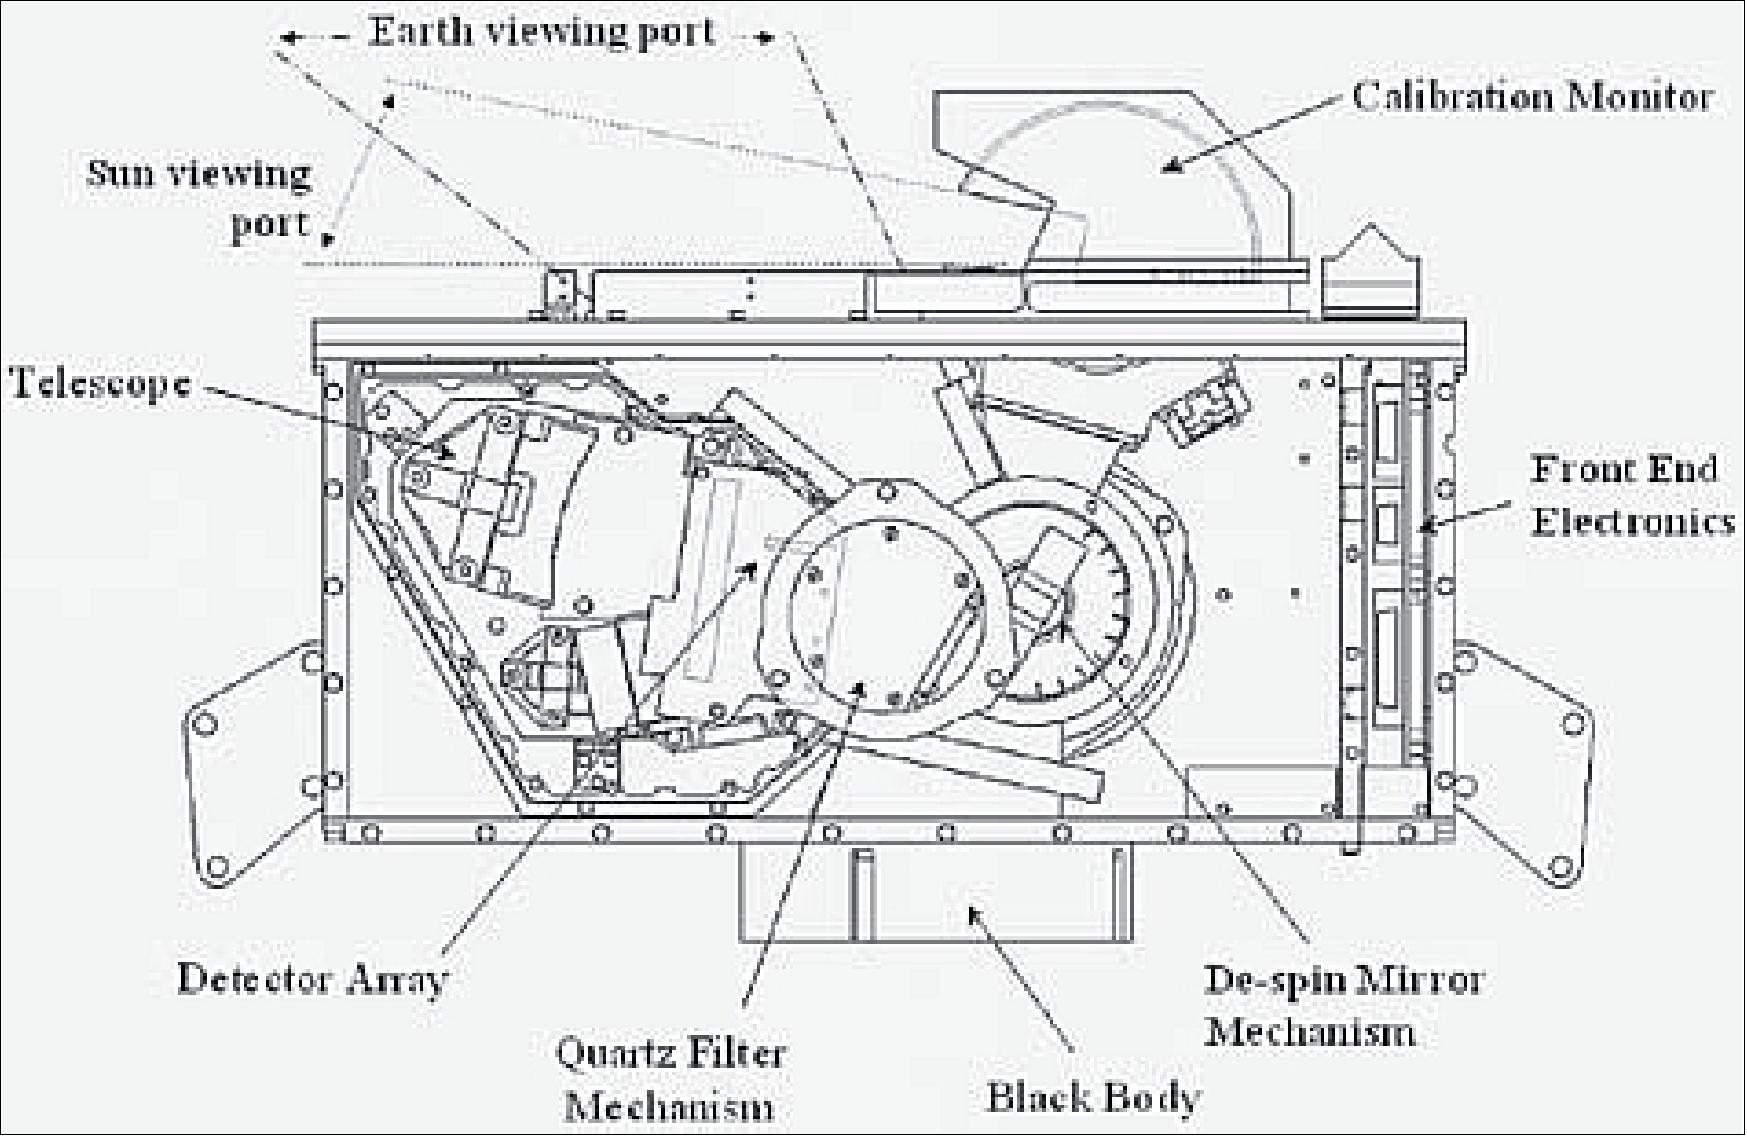
The detector consists of a 256-element blackened linear thermoelectric array, mounted in the N-S direction. This arrangement provides an image column per S/C rotation; a complete image is obtained by successive measurements of columns. Every 15 minutes a complete dataset of both, solar and total spectral band, is obtained for the entire area visible from geostationary orbit. The great advantage of GERB is its ability to sample a large region of the globe with high time resolution. GERB instrument data provides close synergies with other instruments such as CERES, ScaRaB, and with SEVIRI on MSG (observations from both geostationary and polar-orbiting satellites). 76)
ASIC (Application Specific Integrated Circuit) development for GERB detector: The SNR and timing requirements make it impossible to multiplex the detector pixel outputs. Also the low level of the detector output signals mean that at least part of the electronics chain needs to be in close proximity to the detector. Consequently, an ASIC solution was selected for the processing of the detector output pixels. The FPA design resulted in a complex composite focal plane structure making use of silicon and ceramic substrates and the integration of discrete semiconductor die. 77)
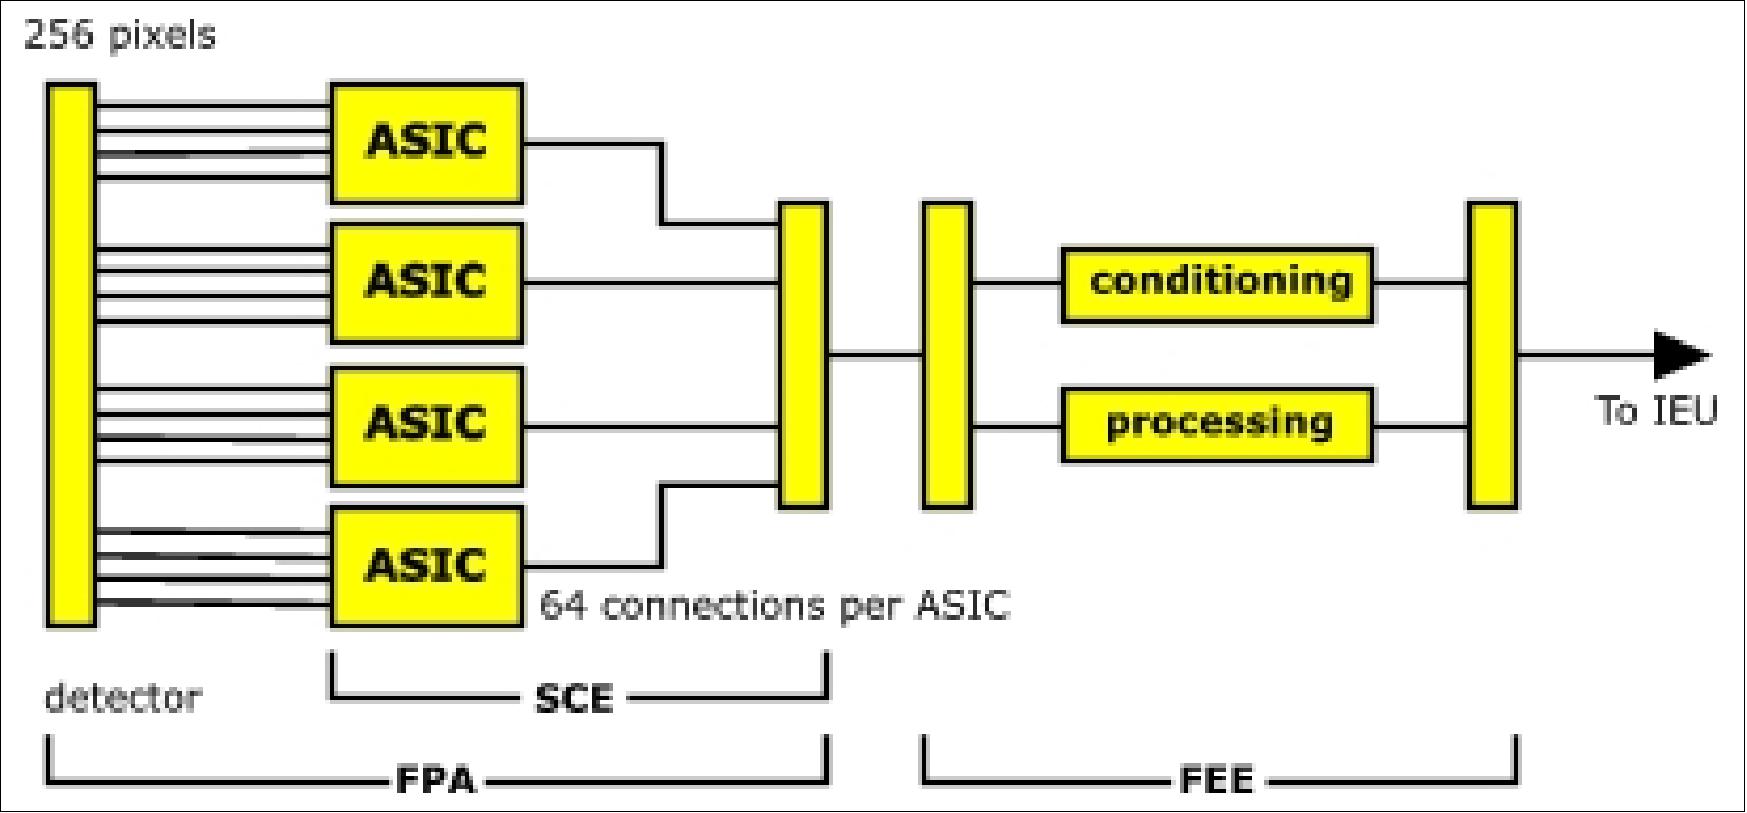
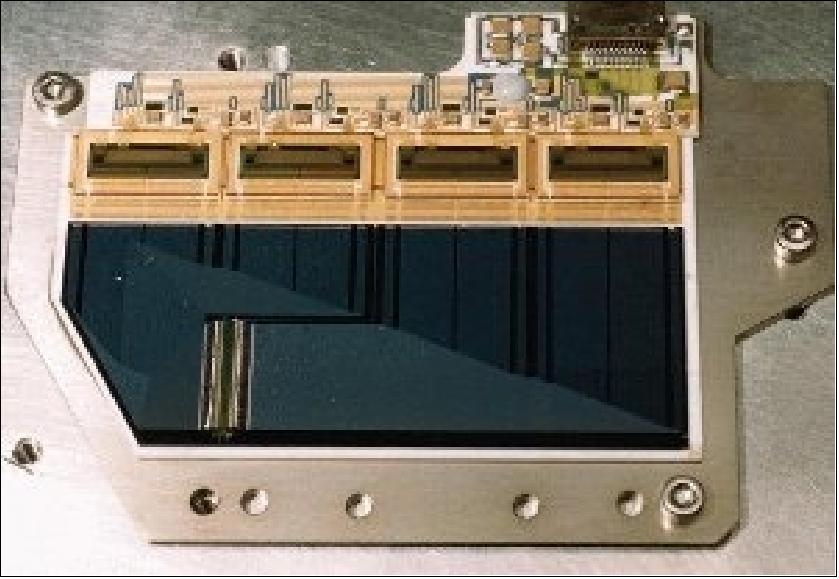
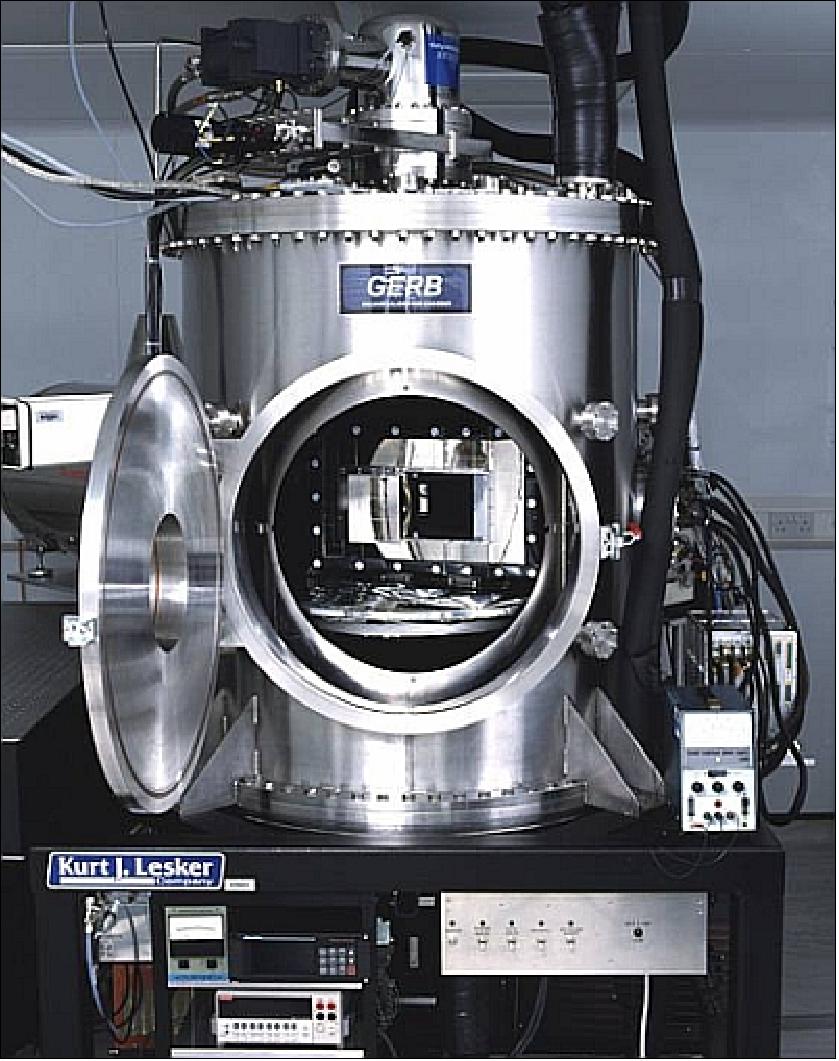
Instrument calibration: Extensive pre-calibrations were provided on the ground. In-flight calibration is provided by a blackbody source and a solar transmission diffuser. For zero reference space views are used. An image is obtained by measuring the signal difference between views of the on-board blackbody and the Earth-view at every rotation of the satellite using the thermoelectric detector. Possible degradation of the shortwave spectral response can be corrected by means of occasional comparisons with an onboard solar-illuminated integrating sphere. 78) 79) 80)
GERB-1 is the first ever Earth radiation budget/solar constant instrument in GEO. The analysis of simultaneous GERB and SEVIRI products provides the basis for new process studies. The first GERB image was received Nov. 28, 2002.
Parameter | LEO (Low Earth Orbit) | GEO (Geostationary Earth Orbit) |
Altitude | ~ 700 km | 35,786 km (~5.6 RE) |
Orbital period | 98.8 minutes | 24 hours |
Coverage | global | Not global: observes only one region of globe |
Sampling | Poor spatial and temporal sampling: each point on globe sampled just once every day on dayside, once nightside | High time resolution |
Resolution | Δx = 1.2 km for Δθ = 0.1º | Δx = 62 km for Δθ = 0.1º |
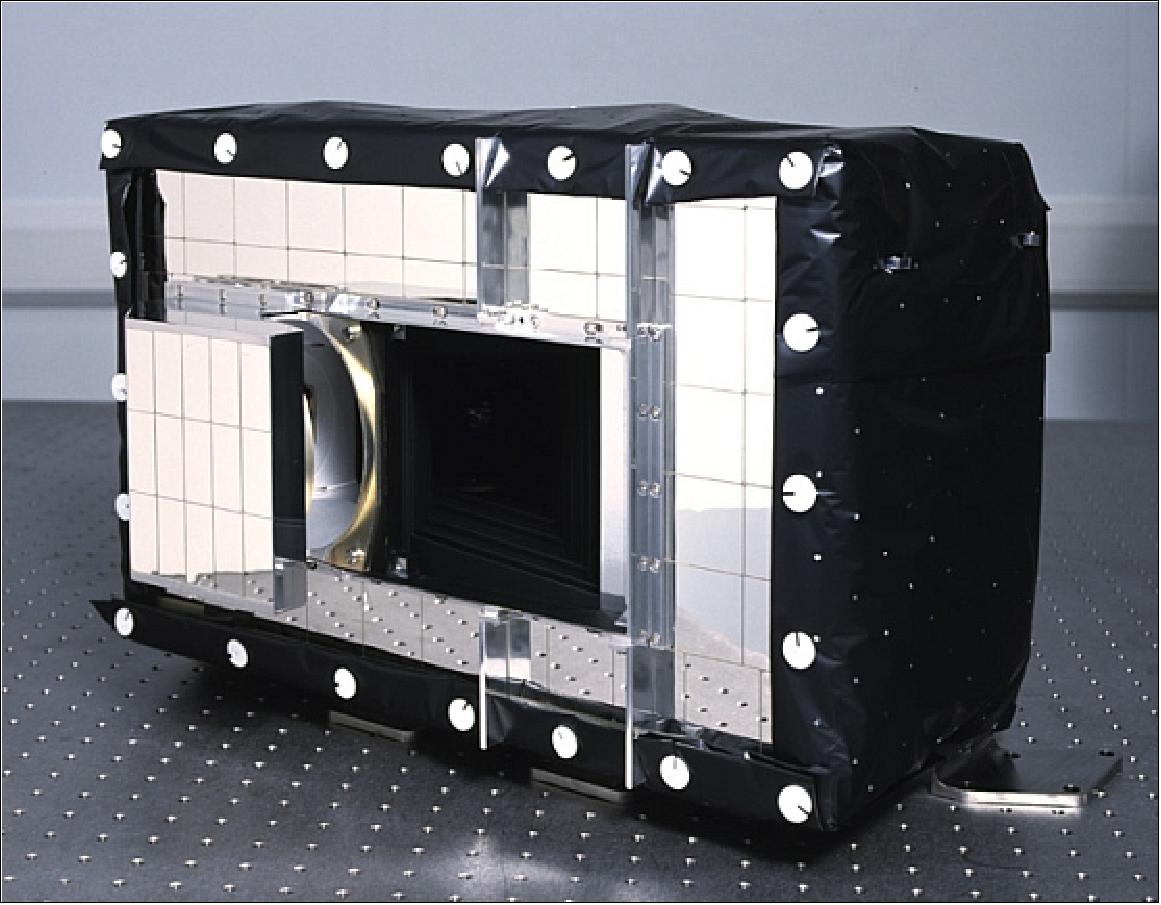
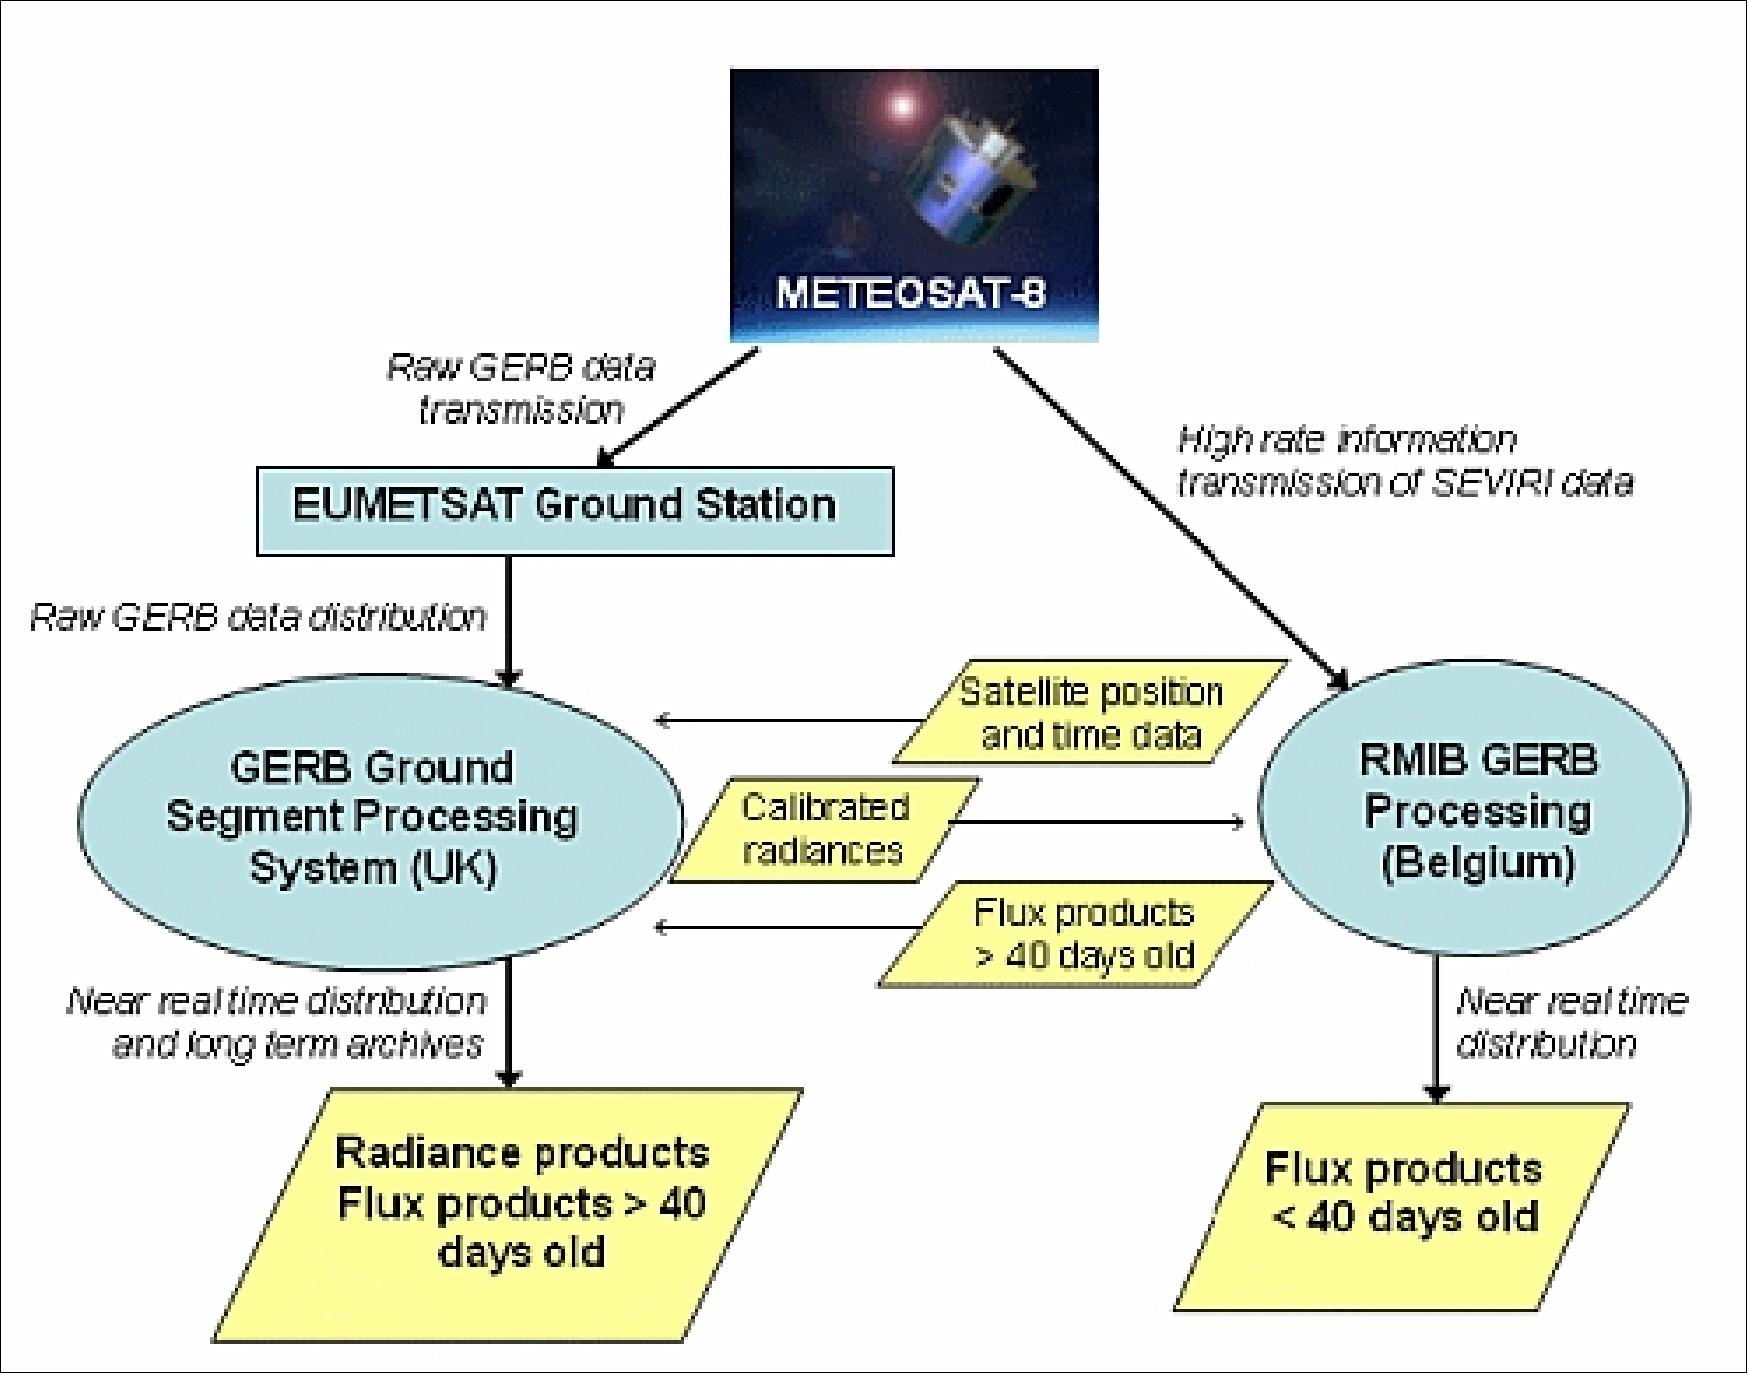
GEOS&R (Geostationary Search and Rescue)
GEOS&R is a communications payload within the S&RSAT/COSPAS system. Provision of transparent relay function for search and rescue operations (a 406 MHz transponder is carried by the MSG satellites). 82)
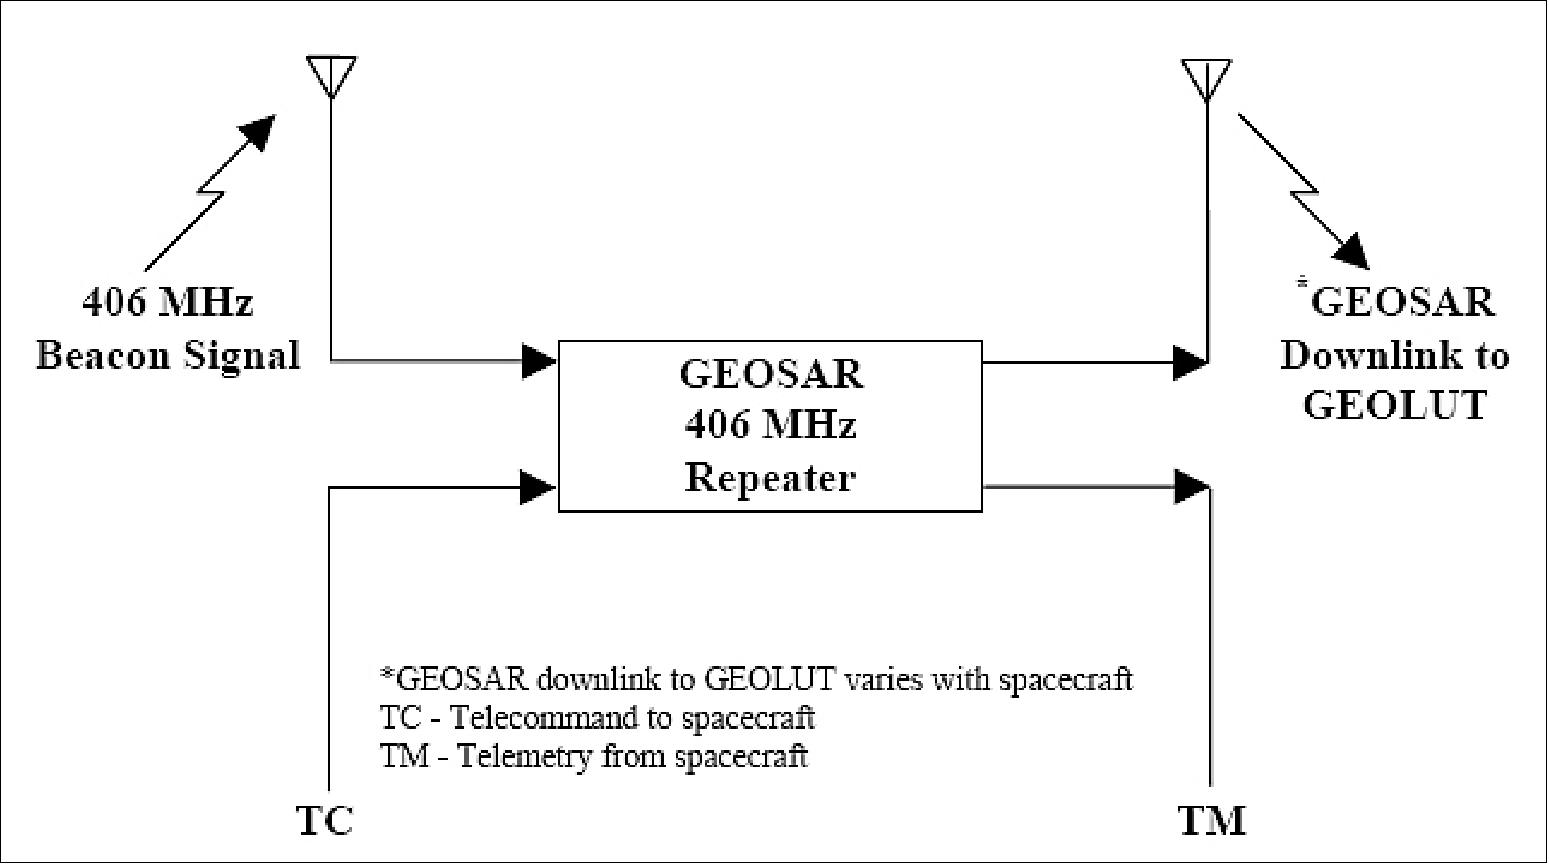
DCS (Data Collection System)
DCS is an on-board collection system. The current data rate of 100 bit/s for each DCP (Data Collection Platform) in the ground segment will continue to be supported by MSG operations. MSG supports a significantly increased number of simultaneously relayed messaging channels.
Nr. of channels supported | Channel bandwidth | Frequency Range (MHz) | Usage |
210 | 1.5 kHz | 401.7025 - 402.0010 | Neighboring satellites' regional DCP band (contingency relay only, no MSG processing) |
33 | 3.0 kHz | 402.0025 - 402.0985 | International DCP band |
224 | 1.5 kHz | 402.1015 - 402.4360 | MSG regional DCP band |
Parameter | Meteosat 1st generation (MOP) | Meteosat 2nd generation (MSG) |
Visible channels | 1 | 3 + HRV |
Water vapor | 1 | 2 channels |
IR window (+absorption) | 1 (+0) | 6 (+2) channels |
Sampling distance | VIS: 2.5 km, IR:5 km | VIS: 3 km, HRV:1 km, IR:3 km |
Radiometric resolution | 0.4 K | 0.25 K |
Image repeat cycle | 30 minutes | 15 minutes |
Raw data rate | 333 kbit/s | 3.2 Mbit/s |
Data collection system (DCS) | 33 regional channels @ 0.1 kbit/s 33 international channels | 210 regional channels @ .1 kbit/s 40 international channels |
Primary dissemination | HRI: 166 kbit/s | HRIT: 1 Mbit/s |
Secondary dissemination | WEFAX: analog | LRIT: 128 kbit/s |
MDD (Met. Data Distribution) | MDD: up to 4x2 kbit/s | data in LRIT |
DCP retransmission system | DRS: 12.5 kbit/s | data in LRIT |
Ground Segment
The MSG ground segment is composed of:
• MCC (Mission Control Center) located at ESOC in Darmstadt, Germany
• PGS (Primary Ground Station) located in Usingen, Germany
• BRGS (Backup and Ranging Ground Station) located in Maspalomas, Gran Canary Island, Spain
• An application ground segment, which extracts meteorological and geophysical products from the calibrated and geolocated image data generated by MCC, and performs data management functions. The application ground segment is composed of MPEF (Meteorological Product Extraction Facility) and U-MARF (Unified Meteorological Archive and Retrieval Facility), both are located at EUMETSAT HQ in Darmstadt, and a distributed network of SAFs (Satellite Application Facilities). There are five SAFs using MSG data, they are:
- SAF on Ocean and Sea Ice hosted by France
- SAF on support to Nowcasting & VSRF hosted by Spain
- SAF on Climate Monitoring (CM) hosted by Germany. Within the CM-SAF consortium six meteorological services [Deutscher Wetterdienst (DWD), Finnish Meteorological Institute (FMI), Konijklik Netherland Meteorological Institute (KNMI), Meteoswiss, the Royal Meteorological Institute of Belgium (RMIB), and the Swedish Meteorological and Hydrological Institute (SMHI)] jointly develop, implement, and validate satellite based climate monitoring products. DWD is the operations leading entity and responsible for the overall coordination and execution of the activities of the SAF on Climate Monitoring. 84)
- SAF on Numerical Weather Prediction hosted by the United Kingdom
- SAF on Land Surface Analysis hosted by Portugal
• User Ground Segment. This comprises all MSG user stations. These are receive-only systems, operated by the users, which make use of either LRIT (Low Rate Information Transmission) or HRIT (High Rate Information Transmission) from the MSG satellites.
MSG Communication Services and Data Distribution
The MSG communication subsystem provides an all digital data transmission capability. The communication payload consists of three subsystems, namely the antenna subsystem, the transponder subsystem (including the S&R transponder), and the TT&C subsystem. 85) 86)
Parameter | Raw Data | HRIT | LRIT | DCP | S&R |
Uplink frequency (MHz) | N/A | 2015.65 | 2101.5 | 402.06 | 406.05 |
Downlink frequency (MHz) | 1686.83 | 1695.15 | 1691.0 | 1675.281 | 1544.5 |
Useful signal bandwidth (MHz) | 5.4 | 1.96 | 0.66 | 0.75 | 0.06 |
Bit rate | 7.5 Mbit/s | 2.3 Mbit/s | 290 kbit/s | 100 bit/s | 400 bit/s |
Modulation | QPSK | QPSK | BPSK | PM | PM |
Antenna | Type | Function | Reference Coverage | Polarization |
L-band | EDA (Electrically Despun Antenna) | Raw data transmission HRIT & LRIT transmission DCP transmission S&R transmission | Elevation > 5º Zone B Europe Europe | Linear horizontal |
S/L-band | Slotted waveguide TPA (Toroidal Pattern Antenna) | HRIT & LRIT reception Raw data transmission (backup) | Europe | Linear horizontal |
UHF-band | Crossed dipoles circular array EDA | DCP reception S&R reception | Full Earth coverage | Circular right-hand |
S-band TT&C | Printed quadrifilar TPA | Telecommand reception Telemetry transmission Tracking | Azimuth 360º Elevation 120º from north axis | Circular |
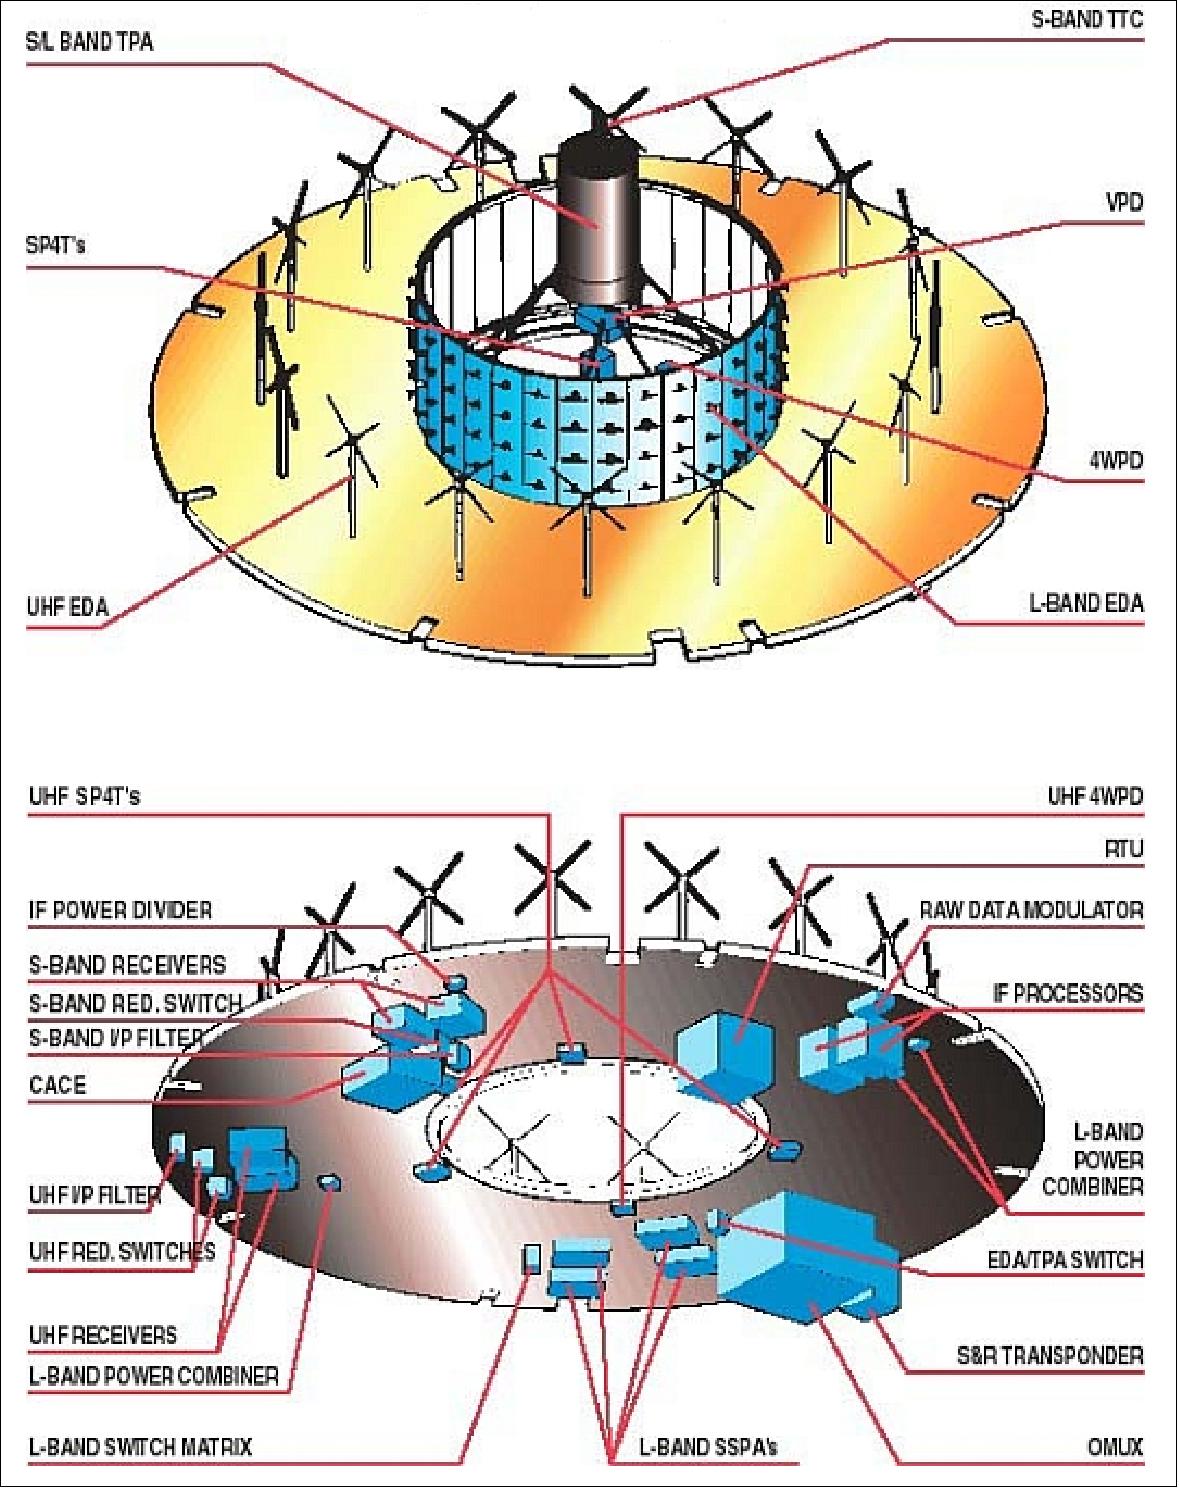
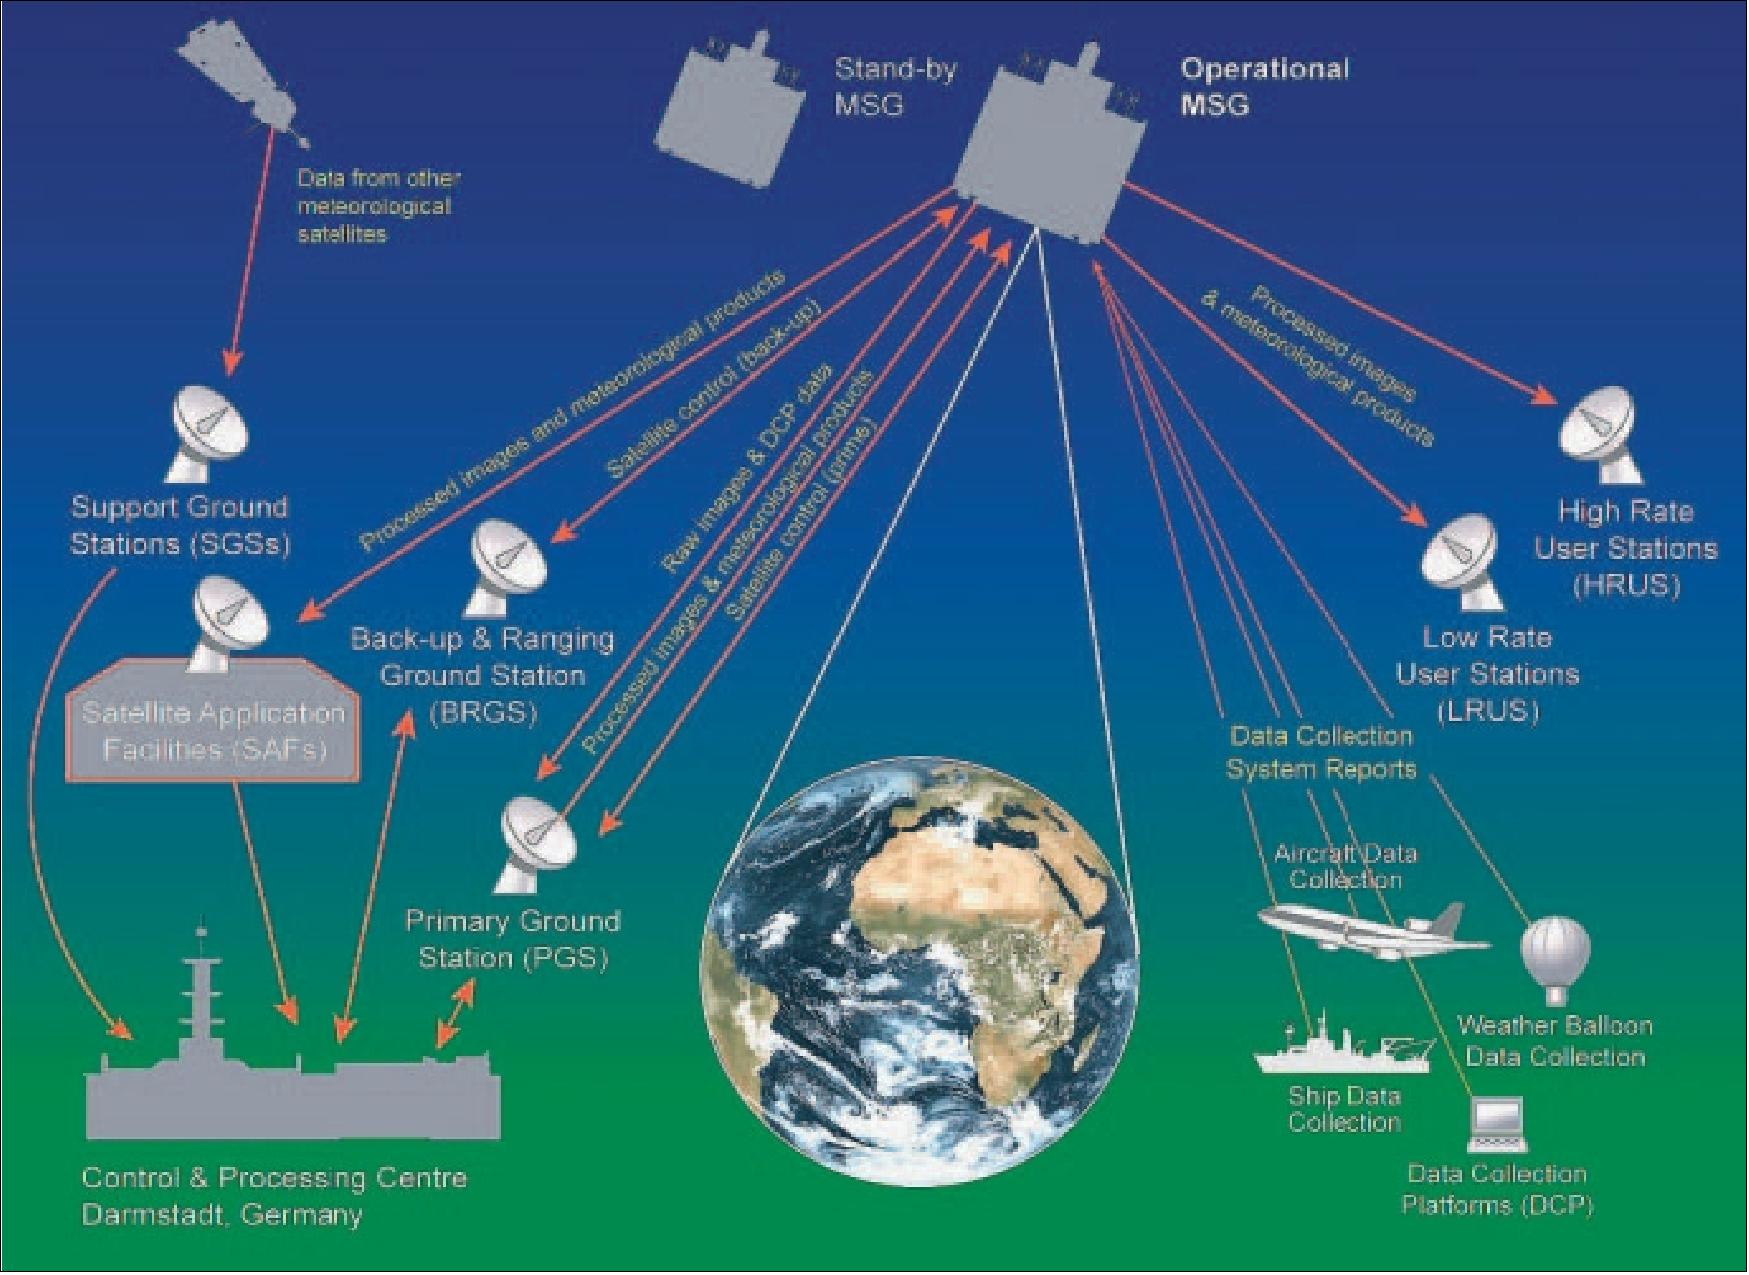
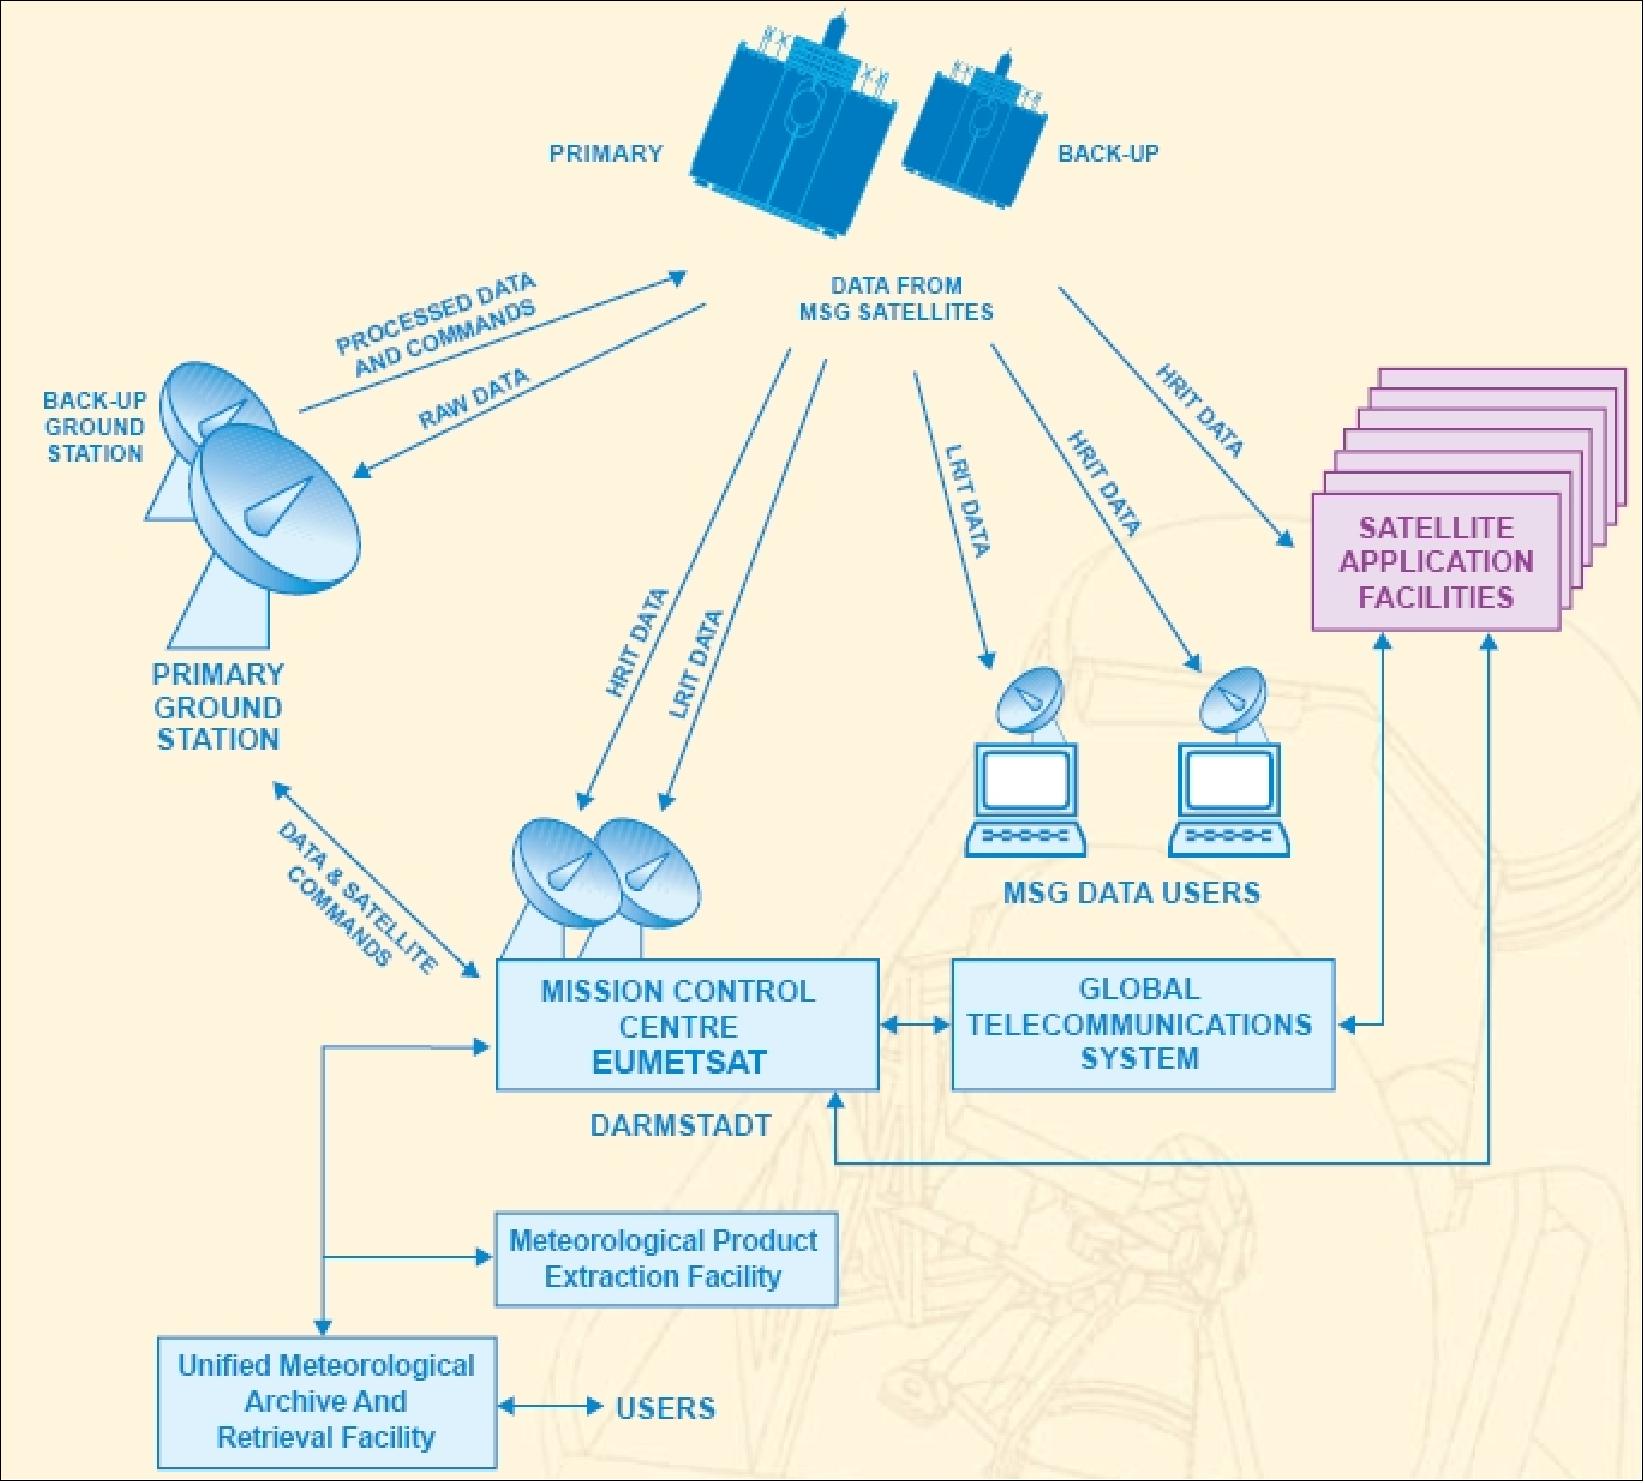
HRIT/LRIT Dissemination Service
A primary objective of the Meteosat service is to deliver image data for nowcasting within a few minutes of the end of acquisition of each image, therefore the timeliness of data delivery is an issue of utmost importance.
Two dissemination channels are defined within the MSG system to broadcast data to end-users via (Low Rate and High Rate Information Transmission (LRIT/HRIT) schemes. Both channels multiplex image data from the SEVIRI and foreign satellites together with meteorological products and DCP data (link), within the limits of the defined packetized data rate. The limited channel capacity requires the use of data compression in order to maximize the amount of information to be transmitted. 89) 90)
• The HRIT data stream has a capacity of 1 Mbit/s which allows the reception of the disseminated level 1.5 data in quasi real-time and full spatial and temporal resolution. It is segmented, encrypted and JPEG-compressed for the purpose of transmission. The compression is lossless for all channels and lossy for the HRV (High Resolution Visible) channel.
• The LRIT data stream capacity is 128 kbit/s. The images are all compressed in a lossy manner (by about a factor of 8) in full spatial resolution with the image data rounded to 8 bits representation. The current baseline is that only every second image is disseminated.
Parameter | LRIT | HRIT |
Length of coded VCDU | 1020 octets | |
Center frequency | 1691.0 MHz | 1695.15 MHz |
Bandwidth | 0.660 MHz | 1.960 MHz |
Polarization | linear horizontal | |
Packetized data rate | 128 kbit/s | 1 Mbit/s |
Total coded data rate | 293.9 kbit/s | 2.3 Mbit/s |
Modulation | PCM/NRZ/BPSK | PCM/NRZ/QPSK |
Pulse shaping | Raised cosine filter | Raised cosine filter |
Coding | Concatenated coding, | |
Coding gain | 9.4 dB | |
Eb/No for required probability of frame loss | 2.8 dB | |
Achieved margins in case of nominal S/C and user station | Worst case 0 dB | |
Data Product | Description |
Level 1.0 | SEVIRI and GERB data as observed by the satellite (raw data) |
Level 1.5 | Geometrically corrected, navigated, Earth located and calibrated SEVIRI data |
Level 2.0 | Geophysical parameters extracted from level 1.5 SEVIRI data by MPEF and SAFs |
Level 3.0 | Further products derived from level 2.0 SEVIRI data by some SAFs |
EUMETCast (EUMETSAT's Multicast Distribution System)
EUMETCast is EUMETSAT's data distribution service transmitted via EutelSat's HotBird-6 satellite in GEO located at 13º E longitude. The service was initiated at the end of April 2003 utilizing data file distribution via DVB-S (Digital Video Broadcast-Satellite) to a wide audience located within the geographical coverage zone which includes most of Europe and all EUMETSAT Member States and Cooperating States.
The extension of the system includes coverage over the African continent (trials started in August 2003). The overall trial period of EUMETCast, designed to fully test the system infrastructure, ended in late 2003, and the service became fully operational as the primary 0º longitude service in late January 2004 with the satellite having then been drifted from its commissioning location (10º W). 91) 92) 93)
The following EUMETCast services are available:
• Meteosat-8 (former MSG-1) routine Meteosat-8 operational services. This consists of: full HRIT data - 12 channel SEVIRI data every ¼ hour. Full LRIT data - 5 channel reduced SEVIRI data ¼ hourly + foreign satellite relays - GOES-E, GOES-W, [GOMS]/Meteosat-5 Indian Ocean and GMS/MTSAT/GOES (temporary replacement).
• EUMETSAT ATOVS (Advanced TOVS - a NOAA/NESDIS processing system) Retransmission Service (EARS)
• Rapid Scanning Service (RSS)
The EUMETCast system is based on a client/server system architecture. The server site is implemented at the EUMETCast uplink site (Usingen, Germany) and the client side installed on the individual EUMETCast reception stations. The DVB multicast distribution mechanism is provided by the telecommunication network providers. Data/product files are transferred via a dedicated communications line from EUMETSAT to the uplink facility. These files are encoded and transmitted to a geostationary communications satellite for broadcast to user receiving stations. Each receiving station decodes the signal and recreates the data/products according to a defined directory and file name structure.
The system uses a DVB/MPEG-2 based transport for carrying IP datagrams. It uses a set of broadcast satellite forward channels, but does not use the return channel. The forward links are provided by a set of geostationary, digital telecommunications satellites.
The geographic coverage of a DVB is determined by the characteristics of the spacecraft and its associated antenna beams. In the current operational configuration, EUMETCast reception is available in:
• European service in Ku-band via HotBird-6 (starting from November 2002)
• African service in C-band via AtlanticBird-2 (from November 2003, available in demonstration mode from August 2003, full service provision from Aug. 2005 onwards)
• American service in C-band via NewSkies-806
Reception station requirements: A typical EUMETCast reception station consists of a standard PC with DVB card inserted and a satellite offset antenna fitted with a digital universal V/H LNB. In addition, users require the multicast client software. As EUMETCast operates a tq®-TELLICAST server, the tq®-TELLICAST client software is mandatory and a licence is required for each user station. The tq®-TELLICAST client software used with EUMETCast must be purchased directly from EUMETSAT, all other components of the reception station are commercially available.
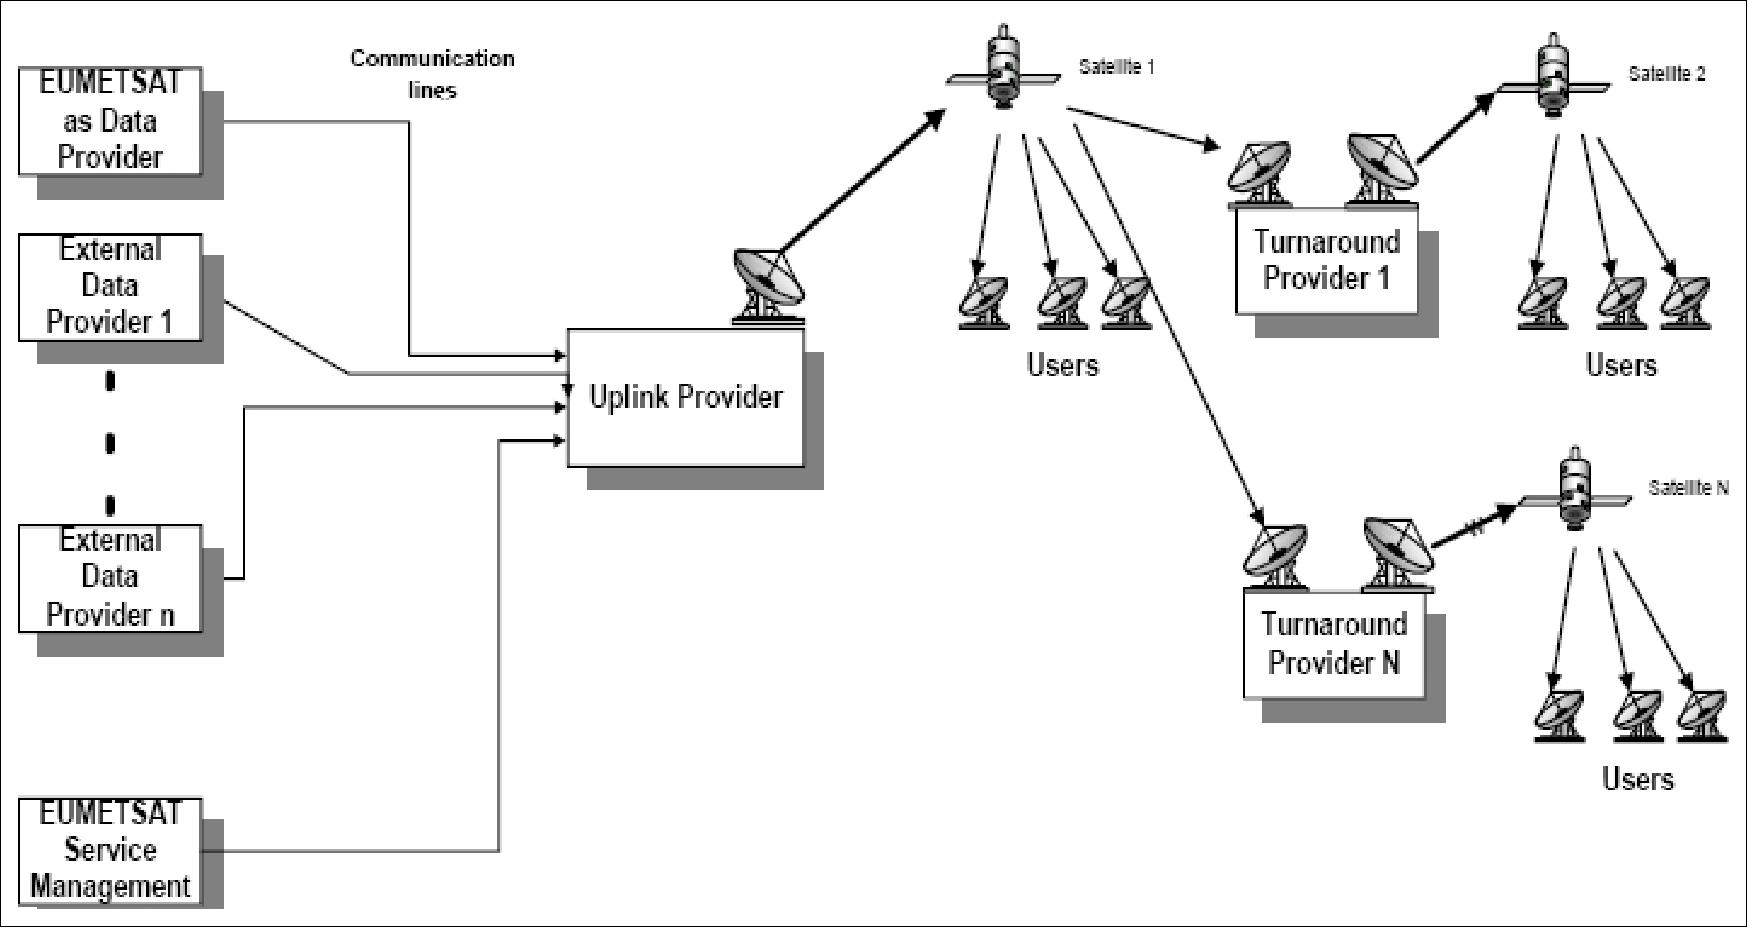
Background: EUMETSAT was forced to abandon its conventional meteorological data dissemination service when the MeteoSat-8 weather satellite rebroadcast function (i.e. its ability to retransmit data once it has been pre-processed on the ground) malfunctioned in orbit on Oct. 17, 2002 (just 6 weeks after launch). In particular, the SSPA-C (Solid State Power Amplifier-C) failed which was to be used to re-broadcast the data that had been processed by the EUMETSAT control center. 94)
Scrambling to find a quick operational retransmission solution, EUMETSAT decided to lease a small amount of commercial telecommunication satellite capacity to retransmit the data in Ku-band to its customers via the HotBird-6 of EutelSat. However, EUMETCast required also that users purchased new satellite reception equipment and pay for the transmission fee.
The switch to a commercial service provider permitted EUMETSAT to send larger amounts of data at faster rates to a much larger user community. EUMETSAT and the EU later extended the EUMETCast service by funding data reception equipment in Africa, using C-band capacity leased aboard the AtlanticBird-3 satellite of EutelSat.
In addition, EUMETSAT has leased capacity on the NewSkies-806 satellite of SES, also in C-band, to provide data services to portions of South America (the regions that are covered by the Meteosat observations).
As of 2006, about 1800 EUMETCast PC-based stations have been installed worldwide, so that MSG imagery from MSG (Meteosat Second Generation) satellites are available in less than 5 minutes from sensing time to end users.
The following environmental data streams and products are delivered via EUMETCast in 2006:
• Meteosat first generation image data
• Meteosat second generation image data
• GOES East & West image data
• MTSAT image data
• DCP & MDD in-situ and forecast data
• EUMETSAT meteorological products
• Land and OSI SAF products
• NOAA POES regional products
• DWDSAT products from DWD
• SPOT VEGETATION products from VITO
• Basic Meteorological Data (BMD) for WMO RA VI
• Metop Global Data Service
• NOAA POES Global Area Coverage
• Metop Regional Data Service
• GRAS and Ozone SAF products
The current EUMETCast system is seen as an emerging prototype candidate of a future GEONETCast service, a global system in its definition phase at GEOSS (Global Earth Observation System of Systems). An important step into the direction of a unified Earth observation approach was done at the GEO (Group on Earth Observations) summit in Tokyo, Japan, on April 25, 2004 when GEOSS (Global Earth Observation System of Systems) was created. GEOSS is an international framework to develop a 10‐year implementation plan (for the period 2005‐2015), a comprehensive, coordinated and sustained system that will help to better understand Earth systems, including weather, climate, oceans, water cycle, geology, ecosystems, agriculture and biodiversity, energy, disasters, etc.
Representatives of 47 countries and more than a dozen international organizations [UN (UNEP, FAO, UNESCO), ESA, EUMETSAT, EC, ECMWF, ISCU, WMO, IGOS‐P, CEOS, WCRP, etc.] were present at the ad hoc GEO (Group on Earth Observations) summit, signing the document (the finalization of a draft implementation plan).
The 10‐year GEOSS program implementation plan was formally approved/adopted by government delegates at the 3rd Earth Observation Summit on February 16, 2005 in Brussels, Belgium. Nearly 60 nations and about 40 international organizations are working to establish the emerging network of Earth observation systems.
References
1) W. Veith, “The MSG Satellite and its Subsystems,” Proceedings of the 2000 EUMETSAT Meteorological Satellite Data Users' Conference, Bologna, Italy, May 29-June 2, 2000, pp. 15-32
2) S. Rota, “The METEOSAT Second Generation,” Proceedings of the EUMETSAT Meteorological Satellite Data User's Conference, Copenhagen, Denmark, Sept. 6-10, 1999, pp. 25-32
3) http://www.esa.int/SPECIALS/MSG/
4) J. Schmetz, P. Pili, et al., “An Introduction to METEOSAT Second Generation (MSG),” BAMS, July 2002, pp. 977-992, URL: http://journals.ametsoc.org/doi/pdf/10.1175/1520-0477%282002%29083%3C0977%3AAITMSG%3E2.3.CO%3B2
5) “Meteosat Second Generation,” ESA brochure BR-153, 1999, URL: http://www.esa.int/esapub/br/br153/br153.pdf
6) G. Giacometti, J. P. Canard, O. Perron, “MSG Power Subsystem Flight Return Experience,” Proceedings of the 9th European Space Power Conference, Saint Raphael, France, June 6-10, 2011, ESA SP-690
7) “MSG-3 successfully launched,” EUMETSAT, July 5, 2012, URL: http://www.eumetsat.int/website/home/News/DAT_2027306.html?lang=EN
8) ”Earth from Space: Earth Day,” ESA Applications, 22 April 2022, URL: https://www.esa.int/Applications/Observing_the_Earth/Earth_from_Space_Earth_Day
9) ”Up to 90 percent fewer condensation trails due to reduced air traffic over Europe,” DLR, 20 May 2020, URL: https://www.dlr.de/content/en/articles/news/2020/02/20200520_fewer-condensation-trails-due-to-reduced-air-traffic.html
10) ”Meteosat Second Generation (MSG) provides images of the full Earth disc, and data for weather forecasts,” EUMETSAT, September 2018, URL: https://web.archive.org/web/20190903231844/https://www.eumetsat.int/website/home/Satellites/CurrentSatellites/Meteosat/index.html
11) ”A repositioning of Europe’s geostationary meteorological satellite fleet currently being undertaken at an altitude of 36,000km reached an important milestone today,” EUMETSAT, 20 Feb. 2018, URL: [web source no longer available]
12) ”EUMETSAT takes steps to extend Meteosat and EPS operations and approves ground segment contracts for next generation systems,” EUMETSAT, 6 Dec. 2017, URL: https://web.archive.org/web/20200920022038/https://www.eumetsat.int/website/home/News/DAT_3745326.html
13) ”Forty years of Meteosat,” ESA 22 Nov. 2017, URL: http://m.esa.int/About_Us/Welcome_to_ESA/ESA_history/Forty_years_of_Meteosat
14) ”Forty years of Meteosat – a European success story in geostationary orbit,” EUMETSAT, 23 November, 2017, URL: https://web.archive.org/web/20181103071201/https://www.eumetsat.int/website/home/News/DAT_3729453.html
15) Ruth McAvinia, ”Forty years of Meteosat — Europe’s geostationary weather satellites reach milestone,” ESA Bulletin No 171, 1 November 2017, pp: 20-29, URL: http://esamultimedia.esa.int/multimedia/publications/ESA-Bulletin-171/offline/download.pdf
16) ”Looking to the Moon to better measure climate change on Earth,” EUMETSAT, 28 April 2017, URL: http://www.eumetsat.int/website/home/News/DAT_3460357.html?lang=EN&pState=1
17) ”EUMETSAT decommissions Meteosat-7 after almost 20 years of service” EUMETSAT, 11 April 2017, URL: http://www.eumetsat.int/website/home/News/DAT_3441795.html?lang=EN&pState=1
18) ”The final journey of Meteosat-7,” EUMETSAT. 4 April 2017, URL: http://www.eumetsat.int/website/home/News/DAT_3430008.html
19) ”EUMETSAT and China National Space Administration sign framework agreement,” EUMETSAT, March 15, 2017, URL: http://www.eumetsat.int/website/home/News/DAT_3411424.html?lang=EN&pState=1
20) ”The 2nd generation Meteosat-8 satellite takes over Meteosat-7 over the Indian Ocean,” EUMETSAT, Feb. 1, 2017, URL: http://www.eumetsat.int/website/home/News/DAT_3363062.html
21) F. Murolo, K. Dammann, S. Burns, ”Transition of EUMETSAT’s Indian Ocean Data Coverage Service to the Meteosat Second Generation Satellites,” Proceedings of the EUMETSAT 2016 Meteorological Satellite Conference, Darmstadt, Germany, Sept. 26-30, 2016, availability of the proceedings at the end of December 2016, URL: http://www.eumetsat.int/website/home/News/ConferencesandEvents/DAT_2833302.html
22) ”Meteosat-8 ready to boost observations over the Indian Ocean,” EUMETSAT, Sept. 23, 2016, URL: http://www.eumetsat.int/website/home/News/DAT_3212714.html
23) ”On 19 July the UK saw its hottest day of 2016, when the mercury topped 33ºC. The heat then triggered thunderstorms,” EUMETSAT, July 19, 2016, URL: http://www.eumetsat.int/website/home/Images/ImageLibrary/DAT_3130843.html
24) http://www.eumetsat.int/website/home/Satellites/CurrentSatellites/index.html , EUMETSAT file accessed on May 12, 2016.
25) ”EUMETSAT has successfully completed the commissioning of its MSG-4 satellite, and renamed it Meteosat-11,” EUMETSAT, Dec. 16, 2015, URL: http://www.eumetsat.int/website/home/News/DAT_2880495.html
26) J. Schmetz, K. Holmlund, P. Schlüssel, R. Stuhlmann, J. Schulz, L. Schüller, M. Cohen, S. Rota, ”EUMETSAT’s Current and Future Satellite Programs,” The 1st KMA International Meteorological Satellite Conference, Seoul, Korea, November 16-18, 2015, URL: http://www.kmaimsc.kr/download/Day-1.zip
27) “MSG-4, Europe’s latest weather satellite, delivers first image,” ESA Press Release No 29-2015, URL: http://www.esa.int/For_Media/Press_Releases/MSG-4_Europe_s_latest_weather_satellite_delivers_first_image
28) ESA hands over control of the MSG-4 weather satellite,” ESA, July 27, 2015, URL: http://www.esa.int/Our_Activities/Observing_the_Earth/Meteosat_Second_Generation/ESA_hands_over_control_of_the_MSG-4_weather_satellite
29) “Happy Earth Day,” ESA, April 22, 2015, URL: http://www.esa.int/spaceinimages/Images/2015/04/MSG-3_image_of_Earth_April_2015
30) “Meteosat-7 becomes EUMETSAT's longest-serving operational satellite,” EUMETSAT, January 23, 2015, URL: http://www.eumetsat.int/website/home/News/DAT_2526201.html
31) “Data from the Meteosat satellite has been used to measure the temperature of lava at a remote volcano in Africa,” EUMETSAT, June 3, 2014, URL: http://www.eumetsat.int/website/home/News/DAT_2229337.html
32) L. Spampinato, G. Ganci, P. A. Hernández, D. Calvo, D. Tedesco, N. M. Pérez, S. Calvari, C. Del Negro, M. M. Yalire, “Thermal insights into the dynamics of Nyiragongo lava lake from ground and satellite measurements,” Journal of Geophysical Research: Solid Earth, Volume 118, Issue 11, pp: 5771–5784, November 2013
33) Eric Bouchez, Michel Horny, “Multi-Mission Elements: Key Assets for EUMETSAT programs,” SpaceOps 2014, 13th International Conference on Space Operations, Pasadena, CA, USA, May 5-9, 2014, URL: http://arc.aiaa.org/doi/pdf/10.2514/6.2014-1630
34) “Meteosat-9 takes over Rapid Scanning Service,” EUMETSAT, April 9, 2013, URL: http://www.eumetsat.int/website/home/News/DAT_2042671.html?lang=EN
35) “Ten years of EUMETCast,” EUMETSAT, March 28, 2013, URL: http://www.eumetsat.int/website/home/TechnicalBulletins/EUMETCast/DAT_2350738.html
36) “Meteosat-10 takes over from Meteosat-9,” EUMETSAT, January 21. 2013, URL: http://www.eumetsat.int/website/home/News/DAT_2035884.html?lang=EN
37) “MSG-3 declared operational as Meteosat-10,” EUMETSAT Press Release, Dec. 18, 2012, URL: http://www.eumetsat.int/website/home/News/DAT_2041270.html?lang=EN
38) “Trial dissemination of data from the MSG-3 satellite begins,” EUMETSAT, Oct. 23, 2013, URL: http://www.eumetsat.int/website/home/News/DAT_2041287.html?lang=EN
39) “Ten years of Meteosat Second Generation,” ESA, Aug. 28, 2012, URL: http://www.eumetsat.int/website/home/Images/ImageLibrary/DAT_2254241.html
40) “MSG-3, Europe’s latest weather satellite, delivers first image,” ESA, Aug. 7, 2012, URL: http://www.esa.int/esaCP/SEMRFKVXF5H_index_0.html
41) “ESA hands over MSG-3 weather satellite to EUMETSAT,” EUMETSAT, July 16, 2013, URL: http://www.eumetsat.int/website/home/News/DAT_2039168.html?lang=EN
42) “ESA hands over weather satellite for operations,” ESA, July 16, 2013, URL: http://www.esa.int/Our_Activities/Observing_the_Earth/ESA_hands_over_weather_satellite_for_operations
43) “MeteoSat-8 and Meteosat-9,” ESA Bulletin, No 145, Feb. 2011, p. 82
44) ESA Bulletin Nr. 141, Feb. 2010, p. 72
45) http://homepage.ntlworld.com/phqfh1/status.htm
46) W. Schumann, P. Mauté, A. Lamothe, “METEOSAT Second Generation: MSG1 Performances and MSG Future,” Proceedings of IAC 2004, Vancouver, Canada, Oct. 4-8, 2004, IAC-04-B.1.09
47) W. Schumann, R. Oremus, S. Rota, J. Kerkmann, “Meteosat Second Generation Becomes Operational,” ESA Bulletin No 119, Aug. 2004, pp. 15-21
48) Libe Jauregui, Spencer Ziegler, Alain Schütz, “Determining the attitude of MSG-2 during the Launch & Early Orbit Phase,” Proceedings of the 59th IAC (International Astronautical Congress), Glasgow, Scotland, UK, Sept. 29 to Oct. 3, 2008, IAC-08-C1.7.6
49) “Weather satellite sets new service record,” ESA, Feb. 4, 2010, URL: http://www.esa.int/esaEO/SEMN5DSJR4G_economy_0.html
50) METEOSAT Image Newsletter, Issue 32, May 2010, pp.. 6 & 8, URL: [web source no longer available]
51) “MSG-3 set to ensure quality of Europe’s weather service from geostationary orbit,” ESA, July 6, 2012, URL: http://www.esa.int/esaCP/SEMJRG2VW3H_index_0.html
52) “On 24 January 2015, Meteosat-7 becomes the longest-serving operational satellite in EUMETSAT history, clocking up 17 years of monitoring the weather from space,” EUMETSAT, Jan. 23, 2015, URL: http://www.eumetsat.int/website/home/News/DAT_2526201.html
53) “Europe's MSG-4 weather satellite delivered into orbit,” ESA, July 15, 2015, URL: http://www.esa.int/Our_Activities/Observing_the_Earth/Meteosat_Second_Generation/Europe_s_MSG-4_weather_satellite_delivered_into_orbit
54) Hans Bonekamp, “EUMETSAT's Perspective,” 2010 International Ocean Vector Winds Meeting, Barcelona, Spain, May 18, 2010, URL: http://coaps.fsu.edu/scatterometry/meeting/docs/2010_may/intro/bonekamp.pdf
55) P. Coste, F. Pasternak, F. Faure, B. Jacquet, S. Bianchi, D. M. A. Aminou, H. J. Luhmann, C. Hanson, P. Pili, G. Fowler, “SEVIRI Imaging Radiometer on Meteosat Second Generation: SEVIRI on MSG-1: A First Assessment,” Proceedings of 54th IAC, Bremen, Germany, Sept. 29 - Oct. 3, 2003
56)) P. Coste, F. Pasternak, F. Faure, B. Jacquet, S. Bianchi, D. M. A. Aminou, H. J. Luhmann, C. Hanson, P. Pili, G. Fowler, “SEVIRI, the Imaging Radiometer on Meteosat Second Generation: In-Orbit Results and First Assessment,” Proceedings of the 5th International Conference on Space Optics (ICSO 2004), 30 March - 2 April 2004, Toulouse, France
57) D. M. A. Aminou, “MSG's SEVIRI Instrument,” ESA Bulletin 111, Aug. 2002, pp. 15-17, URL: http://www.esa.int/esapub/bulletin/bullet111/chapter4_bul111.pdf
58) J. Schmid, “The SEVIRI Instrument,” Proceedings of the 2000 EUMETSAT Meteorological Satellite Data Users' Conference, Bologna, Italy, May 29-June 2, 2000, pp. 23-32, URL: http://www.eumetsat.int/groups/ops/documents/document/pdf_ten_msg_seviri_instrument.pdf
59) MSG Project Team, ESA/ESTEC, “The In-Orbit Commissioning of MSG-1,” ESA Bulletin, 114, May 2003, pp. 80-84, URL: http://www.esa.int/esapub/bulletin/bullet114/chapter10_bul114.pdf
60) “Meteosat Second Generation Instruments,” URL: http://www.eumetsat.int/Home/Main/Satellites/MeteosatSecondGeneration/Instruments/index.htm
61) Paolo Pili, Lee Matheson, Claudia Tranquilli, Johannes Müller, Tim Hewison, Stefane Carlier, Stephane Bianchi, Pierre Coste, ”The In-orbit Performance of the Meteosat Second Generation SEVIRI Instruments,” Proceedings of the EUMETSAT 2016 Meteorological Satellite Conference, Darmstadt, Germany, Sept. 26-30, 2016, availability of the proceedings at the end of December 2016, URL: http://www.eumetsat.int/website/home/News/ConferencesandEvents/DAT_2833302.html
62) M. Huchler, M. Seibel, I. Köker , “The SCAN Assembly for the SEVIRI Instrument on MSG,” DGLR-JT98-118, 1998, pp. 1027-1036
63) D. M. A. Aminou., B. Jacquet, F. Pasternak, “Characteristics of the Meteosat Second Generation (MSG) Radiometer/Imager: SEVIRI”, Proceeding of SPIE, EUROPTO series, Vol. 3221, pp 19-31, 22 September, 22, 1997
64) Claudia Tranquilli, Bartolomeo Viticchiè, Stefano Pessina, Tim Hewison, Johannes Müller, Sebastien Wagner, ”Meteosat SEVIRI Performance Characterisation and Calibration with Dedicated Moon/Sun/Deep-space Scans,” Proceedings of the 14th International Conference on Space Operations (SpaceOps 2016), Daejeon, Korea, May 16-20, 2016, paper: AIAA 2016-2536, URL: http://arc.aiaa.org/doi/pdf/10.2514/6.2016-2536
65) P. Pili, “Calibration of SEVIRI,” Proceedings of the 2000 EUMETSAT Meteorological Satellite Data Users' Conference, Bologna, Italy, May 29-June 2, 2000, pp. 33-39
66) J. E. Harries, J. E. Russell, J. A. Hanafin, H. Brindley, J. Futyan, J. Rufus, S. Kellock, G. Matthews, R. Wrigley, A. Last, J. Mueller, R. Mossavati, J. Ashmall, E. Sawyer, D. Parker, M. Caldwell, P. M. Allan, A. Smith, M. J. Bates, B. Coan, B. C. Stewart, D. R. Lepine, L. A. Cornwall, D. R. Corney, M. J. Ricketts, D. Drummond, D. Smart, R. Cutler, S. Dewitte, N. Clerbaux, L. Gonzalez, A. Ipe, C. Bertrand, A. Joukoff, D. Crommelynck, N. Nelms, D. T. Llewellyn-Jones, G. Butcher, G. L. Smith, Z. P. Szewczyk, P. E. Mlynczak, A. Slingo, R. P. Allan, M. A. Ringer, “The Geostationary Earth Radiation Budget Project,” BAMS (Bulletin of the American Meteorological Society), Vol. 86, No 7, July 2005, pp. 945-960, URL: http://journals.ametsoc.org/doi/pdf/10.1175/BAMS-86-7-945
67) J. E. Harries, “The Geostationary Earth Radiation Budget experiment: Status and Science,” Proceedings of the 2000 EUMETSAT Meteorological Satellite Data Users' Conference, Bologna, Italy, May 29-June 2, 2000, pp. 62-71
68) J. E. Harries, D. Crommelynck, “The Geostationary Earth Radiation Budget experiment on MSG-1 and its potential applications,” Advanced Space research, Vol. 24, 1999, pp. 915-919
69) P. Vogel, “The GERB Experiment,” Proceedings of the EUMETSAT Meteorological Satellite Data User's Conference, Copenhagen, Denmark, Sept. 6-10, 1999, pp. 124-130
70) H-J. Luhmann, “MSG's GERB Instrument,” ESA Bulletin 111, Aug. 2002, pp. 18-20, URL: http://www.esa.int/esapub/bulletin/bullet111/chapter5_bul111.pdf
71) Consortium members are: Imperial College of Science, Technology and Medicine(ICSTM), London; Leicester University, UK; AEA Technology, UK; Galileo Avionica, Italy; Amos, Belgium and the Royal Meteorological Office (RMIB), Belgium.
72) D. Crommelynck, “Introduction to the geostationary Earth radiation budget experiment and data,” http://gerb.oma.be/doku.php?id=introduction
73) http://www3.imperial.ac.uk/spat/research/missions/atmos_missions/gerb/instrument/
74)) M. C. W. Sandford, P. M. Allan, M. E. Caldwell, J. Delderfield, M. B. Oliver, E. Sawyer, J. E. Harries, J. Ashmall, H. Brindley, S. Kellock, R. Mossavati, R. Wrigley, D. Llewellyn-Jones, O. Blake, G. Butcher, R. Cole, N. Nelms, S. DeWitte, P. Gloesenere, F. Fabbrizzi, “The geostationary Earth radiation budget (GERB) instrument on EUMETSAT's MSG satellite,” Acta Astronautica Volume 53, Issue 11, Dec. 2003, pp. 909-915
75) Jacqui Russell, “Geostationary Earth Radiation Budget GERB unit level spectral response data,” Earth Radiation Budget Workshop 2010, Paris, France, Sept. 13-16, 2010
76) J. Mueller, et al., “GERB: An Earth Radiation Budget Instrumentation on Second Generation Meteosat,” Advanced Space Research, Vol. 24, No 7, 1999, pp. 921-924
77)) N. Helms, J. Dowson, O. Blake, G. Butcher, “A composite focal plane assembly for the GERB instrument,” Acta Astronautica, Volume 59, Issue 12, Dec. 2006, pp. 1117-1122
78) S. Dewitte, et al., “In-Flight Calibration of the GERB-1 Instrument,” Proceedings of the EUMETSAT Meteorological Satellite Data User's Conference, Copenhagen, Denmark, Sept. 6-10, 1999, pp. 113-120
79) J. Mueller, “Geostationary Earth Radiation Budget (GERB) Instrument Calibration Plans,” Advances in Space Research, Vol. 19, No 9, 1997, pp. 1307-1316
80) J. Mueller, et al., “Earth Radiation Budget Data from Geostationary Orbit,” Proceedings IGARSS'99, Vol. 2, Hamburg, Germany, June 28 - July 2, 1999, pp.824-825
81) J. E. Harries, J. E. Russell, R. Bantges, H. E. Brindley, J. Futyan, V. Gimbert, “The Geostationary Earth Radiation Budget (GERB) experiment: Status and Results,” EarthCARE Workshop, May 7-9, 2007, ESA/ESTEC, URL: http://www.congrex.nl/07c08/presentations%5CSession%20B.4%20Earth%20Radiation%20budget%20satellite%20measurements%5C03_Harries.ppt
82)) “Description of the 406 MHz Payloads used in the COSPAS-SARSAT GEOSAR System,” C/S T.011, Issue 1, Rev. 5, Oct. 2008
83) R. Francis, V. Gärtner, “The Transition from MTP to MSG operations for the End-User Community,” Proceedings of the EUMETSAT Meteorological Satellite Data User's Conference, Copenhagen, Denmark, Sept. 6-10, 1999, pp. 55-60
84) J. Schulz, P. Albert, H.-D. Behr, S. Dewitte, B. Dürr, A. Gratzki, R. Hollmann, K.-G. Karlsson, T. Manninen, R. Müller, R. Roebeling, N. Selbach, S. Sheldon, A. Tetzlaff, W. Thomas, M. Werscheck, A. Zelenka, “Operational Climate Monitoring from Space: The Satellite Application Facility on Climate Monitoring,” Proceedings of the 2005 EUMETSAT Meteorological Satellite Conference, Dubrovnik, Croatia, Sept. 19-23, 2005, pp. 336-343
85) K. D. McMullan, “MSG's Communications Payload,” ESA Bulletin 111, Aug. 2002, pp. 21-23, URL: http://www.esa.int/esapub/bulletin/bullet111/chapter6_bul111.pdf
86) K. D. McMullan, “The MSG Mission Communications Payload, including the Search and Rescue Transponder,” Proceedings of the EUMETSAT Meteorological Satellite Data User's Conference, Copenhagen, Denmark, Sept. 6-10, 1999, pp. 106-113
87) W. Schumann, H. Stark, K. McMullan, D. Aminou, H-J. Luhmann, “The MSG System,” ESA Bulletin 111, Aug. 2002, pp. 11-14, URL: http://www.esa.int/esapub/bulletin/bullet111/chapter3_bul111.pdf
88) “A New Geostationary Meteorological Satellite System for the 21s t Century,” URL: http://goes.gsfc.nasa.gov/text/msg.pdf
89) “MSG Ground Segment LRIT/HRIT Mission Specific Implementation,” EUMETSAT, Document No: EUM/MSG/SPE/057, Issue 5, Feb. 4, 2005
90) D. Just, Y. Buhler, “Data Compression for METEOSAT Second Generation,” Proceedings of the EUMETSAT Meteorological Satellite Data User's Conference, Copenhagen, Denmark, Sept. 6-10, 1999, pp. 131-138
91) EUMETSAT Brochure E.01, Sept. 2006, Version 2, URL: http://www.eumetsat.int/groups/cps/documents/document/pdf_br_e01_en.pdf
92) TD 15 - EUMETCast - EUMETSAT's Broadcast System for Environmental Data, Technical Description, Document No: EUM/OPS/DOC/06/0118, Issue V4, Aug, 4, 2006, URL: http://www.eumetsat.int/Home/Basic/Common_Content/pdf_td15_eumetcast
93) https://web.archive.org/web/20201020115311/https://www.wmo.int/pages/prog/www/ISS/Meetings/RMDCN-Steering_Vienna2008/documents/EUMETCast.ppt
94) P. B. de Selding, “U,S.-China Meteorological Network Mirrors European Model,” Space News, Dec. 4, 2006 p. 6
The information compiled and edited in this article was provided by Herbert J. Kramer from his documentation of: ”Observation of the Earth and Its Environment: Survey of Missions and Sensors” (Springer Verlag) as well as many other sources after the publication of the 4th edition in 2002. - Comments and corrections to this article are always welcome for further updates (eoportal@symbios.space).
Spacecraft Launch Mission Status Sensor Complement Ground Segment References Back to top