ISS: SAGE-III (Stratospheric Aerosol and Gas Experiment-III)
EO
Atmosphere
Atmospheric Temperature Fields
Aerosols
The Stratospheric Aerosol and Gas Experiment-III (SAGE-III) is a National Aeronautics and Space Administration (NASA) experiment mounted on the International Space Station (ISS), aimed at measuring energy through the Earth’s limb (atmosphere, viewed edge-on) during solar and lunar occultations, as well as limb scattering. The instrument, launched in February 2017, provides near-global long-term monitoring of vertical aerosol distribution and trace gas measurements through the upper atmosphere to target climate and chemical process studies.
Quick facts
Overview
| Mission type | EO |
| Agency | NASA |
| Mission status | Operational (extended) |
| Launch date | 19 Feb 2017 |
| Measurement domain | Atmosphere |
| Measurement category | Atmospheric Temperature Fields, Aerosols, Atmospheric Humidity Fields, Ozone, Trace gases (excluding ozone) |
| Measurement detailed | Aerosol Extinction / Backscatter (column/profile), Atmospheric specific humidity (column/profile), O3 Mole Fraction, Atmospheric temperature (column/profile), NO2 Mole Fraction, OClO (column/profile) |
| Instruments | SAGE-III |
| Instrument type | Atmospheric chemistry |
| CEOS EO Handbook | See ISS: SAGE-III (Stratospheric Aerosol and Gas Experiment-III) summary |
Summary
Mission Capabilities
SAGE-III utilises a grating spectrometer that measures ultraviolet (UV) and visible light by vertically scanning across the sun or moon, and gets broken up into UV, visible and infrared (IR) wavelengths by the grating spectrometer. Calculating a ratio with the scanned light with the measured atmospheric light provides the absorption for a given height in the atmosphere. When the altitude is varied, this allows for a vertical profile of various compounds and aerosols to be constructed. Furthermore, a discrete photodiode provides additional aerosol information.
An additional instrument is the Contamination Monitoring Packages (CMP), which is utilised to reduce reading error when space station operations elevate environmental contamination. This allows for measurements to continue whilst space station operations continue.
Performance Specifications
SAGE-III observes vertically in seven different products, six of which are solar related and one related to lunar measurements. The vertical range differs from 0 km or cloud-top altitude to 100 km, with the ability to take measurements at the tropopause. It has a vertical resolution of 0.75 km in solar measurements, and 1.5 km for lunar measurements, and has a precision ranging from 0.1 % to 10 %.
Being externally mounted on the ISS, SAGE-III undertakes a non-sun-synchronous orbit with an altitude of 407 km, an inclination of 51.6°, and a period of 93 minutes.
Space and Hardware Components
SAGE-III was launched onboard a SpaceX Falcon 9 launch vehicle from Cape Canaveral, United States of America. It was mounted onto the Express Logistics Carrier (ELC) which is a Nadir-Viewing Platform (NVP) onboard the ISS. SAGE-III and its instruments were developed by NASA/Langley Research Centre (LaRC), and manufactured by Ball Aerospace.
Data is transferred at 2150 MB per day.
ISS Utilization: SAGE-III (Stratospheric Aerosol and Gas Experiment-III)
Launch Mission status Instrument HexaPod Ground Segment References
SAGE-III, a NASA instrument built as part of the EOS (Earth Observing System) program, is an existing grating spectrometer instrument that measures near-UV/visible/near-IR energy through the Earth's limb during solar and lunar occultations and, during the daytime side of the orbit, limb scattering.
The President's FY 2011 budget provides an opportunity to refurbish and recalibrate SAGE-III for a possible flight on the ISS by 2014. Observing from the ISS, SAGE-III will provide near-global, long-term measurements of key components of the Earth's atmosphere important to climate and chemical processes. The most important of these key measurements are the vertical distribution of aerosols from the upper troposphere through the stratosphere, and ozone from the upper troposphere through the mesosphere. In addition, SAGE-III will provide high vertical resolution profile measurements of trace gases such as water vapor and nitrogen dioxide.
Three copies of SAGE-III were produced. One instrument was mounted on the Meteor-3M spacecraft that launched in 2001 and a second was carefully packed away awaiting a flight of opportunity. The SAGE- III - ISS and the other two SAGE-III instruments were developed and managed by NASA/LaRC (Langley Research Center) and built by Ball Aerospace in Boulder, CO.
The SAGE family of instruments was pivotal in making accurate measurements of the amount of ozone loss in Earth's atmosphere. SAGE has also played a key role in measuring the onset of ozone recovery resulting from the internationally mandated policy changes that regulated chlorine-containing chemicals, the Montreal Protocol, which was passed in 1987. 1)
SAGE-III/ISS technical status: 2) 3) 4)
• SAGE-III/ISS was delivered to NASA/LaRC and is in storage since 2004
• Instrument assessment, including powered radiometric testing, was performed in 2009 and concluded that the instrument is still an excellent flight candidate
• An ESA-provided HPS (Hexapod Pointing Platform) will be used to compensate for major variations in ISS orientation
• A detailed accommodation study with the ISS program is being performed to determine the best location to mount SAGE-III. Mounting location selection criteria include:
- Clear measurement FOV (Field of View)
- ISS environment including contamination and disturbances.
The objective of SAGE-III is to provide global, long-term measurements of key components of the Earth's atmosphere. The most important of these are the vertical distribution of aerosols and ozone from the upper troposphere through the stratosphere. In addition, SAGE-III also provides unique measurements of temperature in the stratosphere and mesosphere and profiles of trace gases such as water vapor and nitrogen dioxide that play significant roles in atmospheric radiative and chemical processes.
Instrument | Era | Orbit/Platform | Channels | Science highlight |
SAM | 1975 | Apollo-Soyuz | Single channel @ 850 nm | Demonstration |
SAM-II | 1978-1993 | SSO/Nimbus-7 polar coverage | Single channel @ 1 nm | Polar stratospheric clouds |
SAGE-I | 1979-1981 | Inclined/AEM-2 global coverage | Ozone, Aerosol, NO2 | Preceding ozone baseline |
SAGE-II | 1984-2005 | Inclined/ERBS global coverage | Added water vapor, improved NO2 | Ozone trends, extreme aerosol variability |
SAGE-III |
|
|
|
|
For nearly thirty years, NASA’s SAGE (Stratospheric Aerosol and Gas Experiment) family of remote-sensing- satellite instruments continuously measured stratospheric ozone (O3) concentrations, aerosols, water vapor, and other trace gases. However, there has been a nearly decade-long gap in SAGE measurements since the SAGE-III Meteor-3M (launched in 2001) ended on March 6, 2006.
The first SAGE mission (SAGE-I) launched February 18, 1979, on the ARM-B (Applications Explorer Mission-B) satellite of NASA. The mission collected valuable data for nearly three years until the satellite’s power system failed. SAGE-II launched onboard the ERBS (Earth Radiation Budget Satellite) in October 1984, and observed stratospheric O3 from 1984 until 2005. Data from SAGE II were integral in confirming human-driven changes to O3 concentrations in the stratosphere, and thus influenced the decisions to negotiate the Montreal Protocol in 1987. Later, observations from SAGE-II showed that O3 in the stratosphere stopped decreasing in response to the actions agreed to in the treaty. 5)
Development Status
• January 17, 2017: The SAGE III instrument was delivered from NASA's Langley Research Center to NASA Kennedy Space Center (KSC) in November 2015 and is now completely ready for launch. "Final powered testing was completed at the KSC Space Station Processing Facility during the past year and in December 2016 the instrument payload and the Nadir Viewing Platform were handed over to SpaceX for installation into the Dragon Trunk of the Falcon 9 rocket. The integrated trunk is now awaiting launch," Marilee M. Roell, SAGE III Science Manager at NASA/LaRC, told SpaceFlight Insider. 6)
• In November 2015, SAGE-III was shipped to KSC (Kennedy Space Center) in Florida. 7)
• In February 2015, the HPS (Hexapod Pointing System) of ESA (European Space Agency) was delivered to NASA/LaRC. HPS is a key component to the SAGE-III instrument to automatically adjust the pointing of SAGE-III to compensate for variations in the orientation between the space station and Earth during its orbit, maintaining the instrument perpendicular to the Earth’s surface. - HPS was several years in storage prior to NASA/LaRC delivery. 8)
Launch
SAGE-III was launched on the commercial SpaceX Falcon 9 v1.1 FT vehicle and Dragon spacecraft CRS-10 (Cargo Resupply-10) on February 19, 2017. The launch site was NASA's historic Launch Complex 39 Pad A of the Kennedy Space Center, Cape Canaveral SLC-39A, FL. 9) 10) 11)
CRS-10 mission overview 12)
The resupply mission to the International Space Station carries hardware and supplies to support dozens of the of approximately 250 science and research investigations that will occur during Expeditions 50 and 51. The Expedition crew members Thomas Pesquet and Shane Kimbrough will use the station’s robotic arm to capture Dragon when it arrives on station. The spacecraft will be berthed to the Earth-facing port on the Harmony module.
The Dragon resupply vehicle is carrying a total cargo of 2490 kg, of which 1530 kg are in the pressurized cargo bay (732 kg science investigations, 296 kg crew supplies, 382 kg vehicle hardware, 10 kg of spacewalk equipment, 11 kg of computer resources, and 22 kg of Russian hardware).
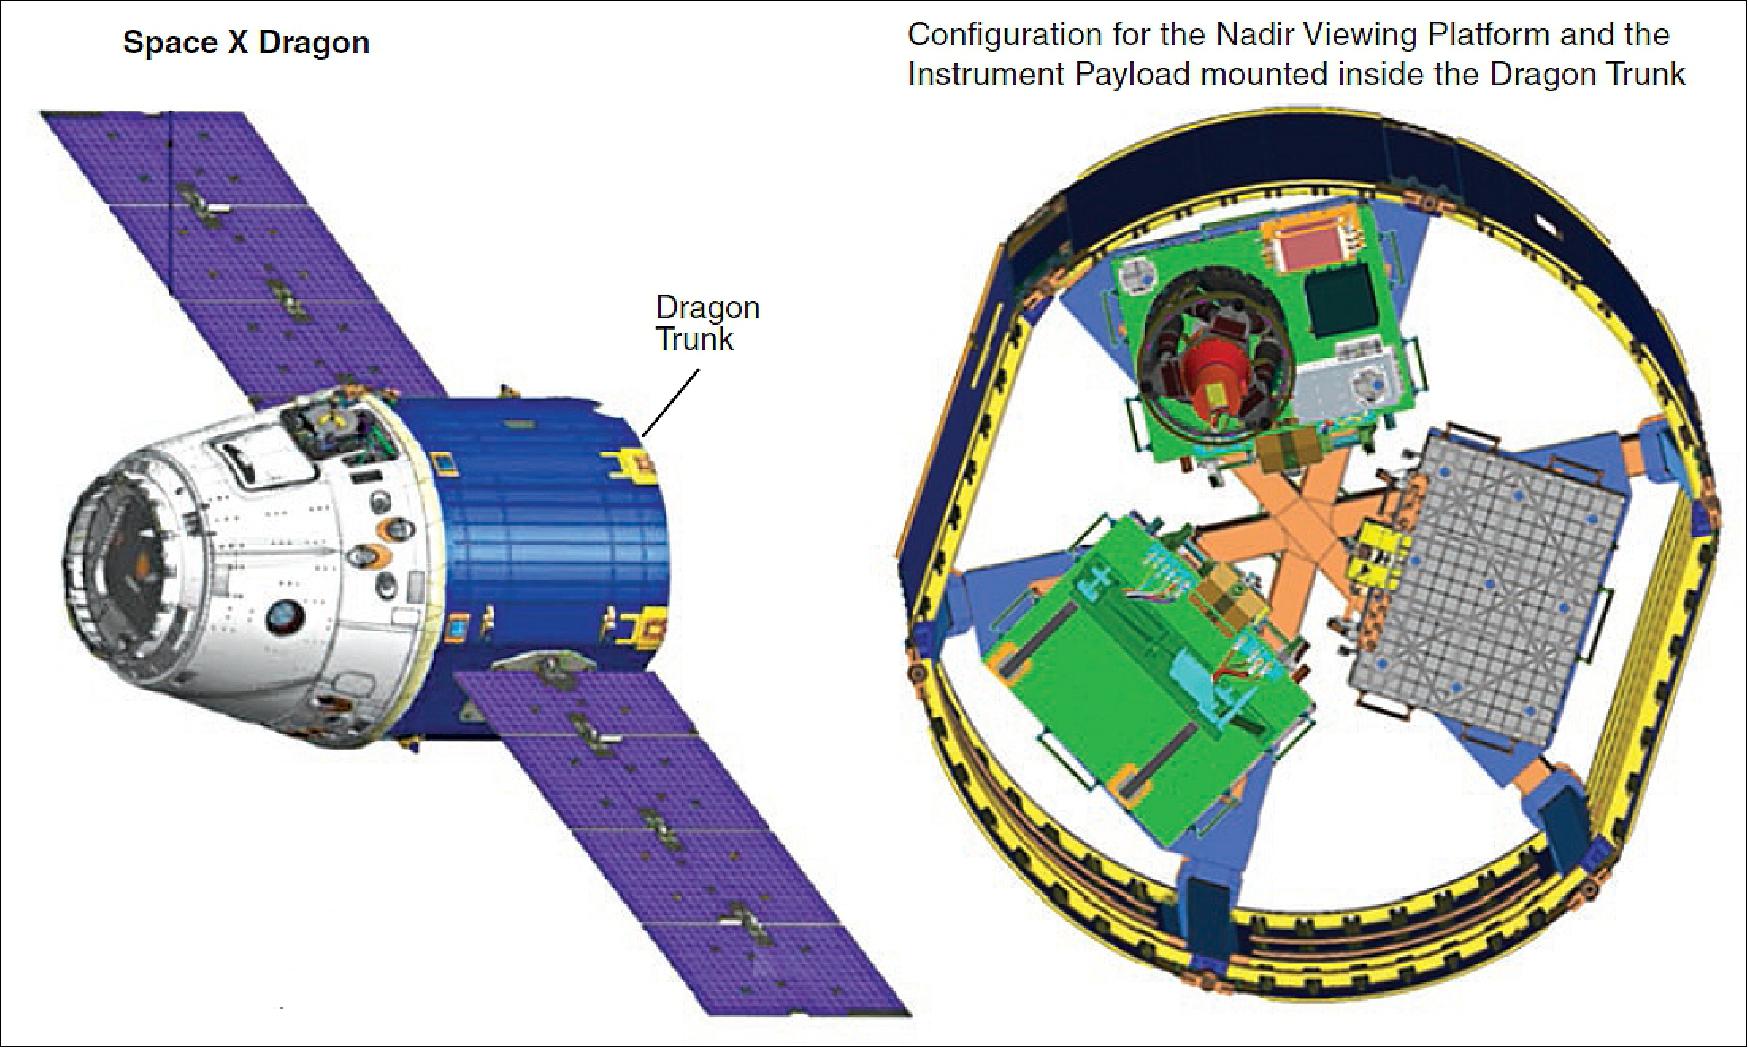
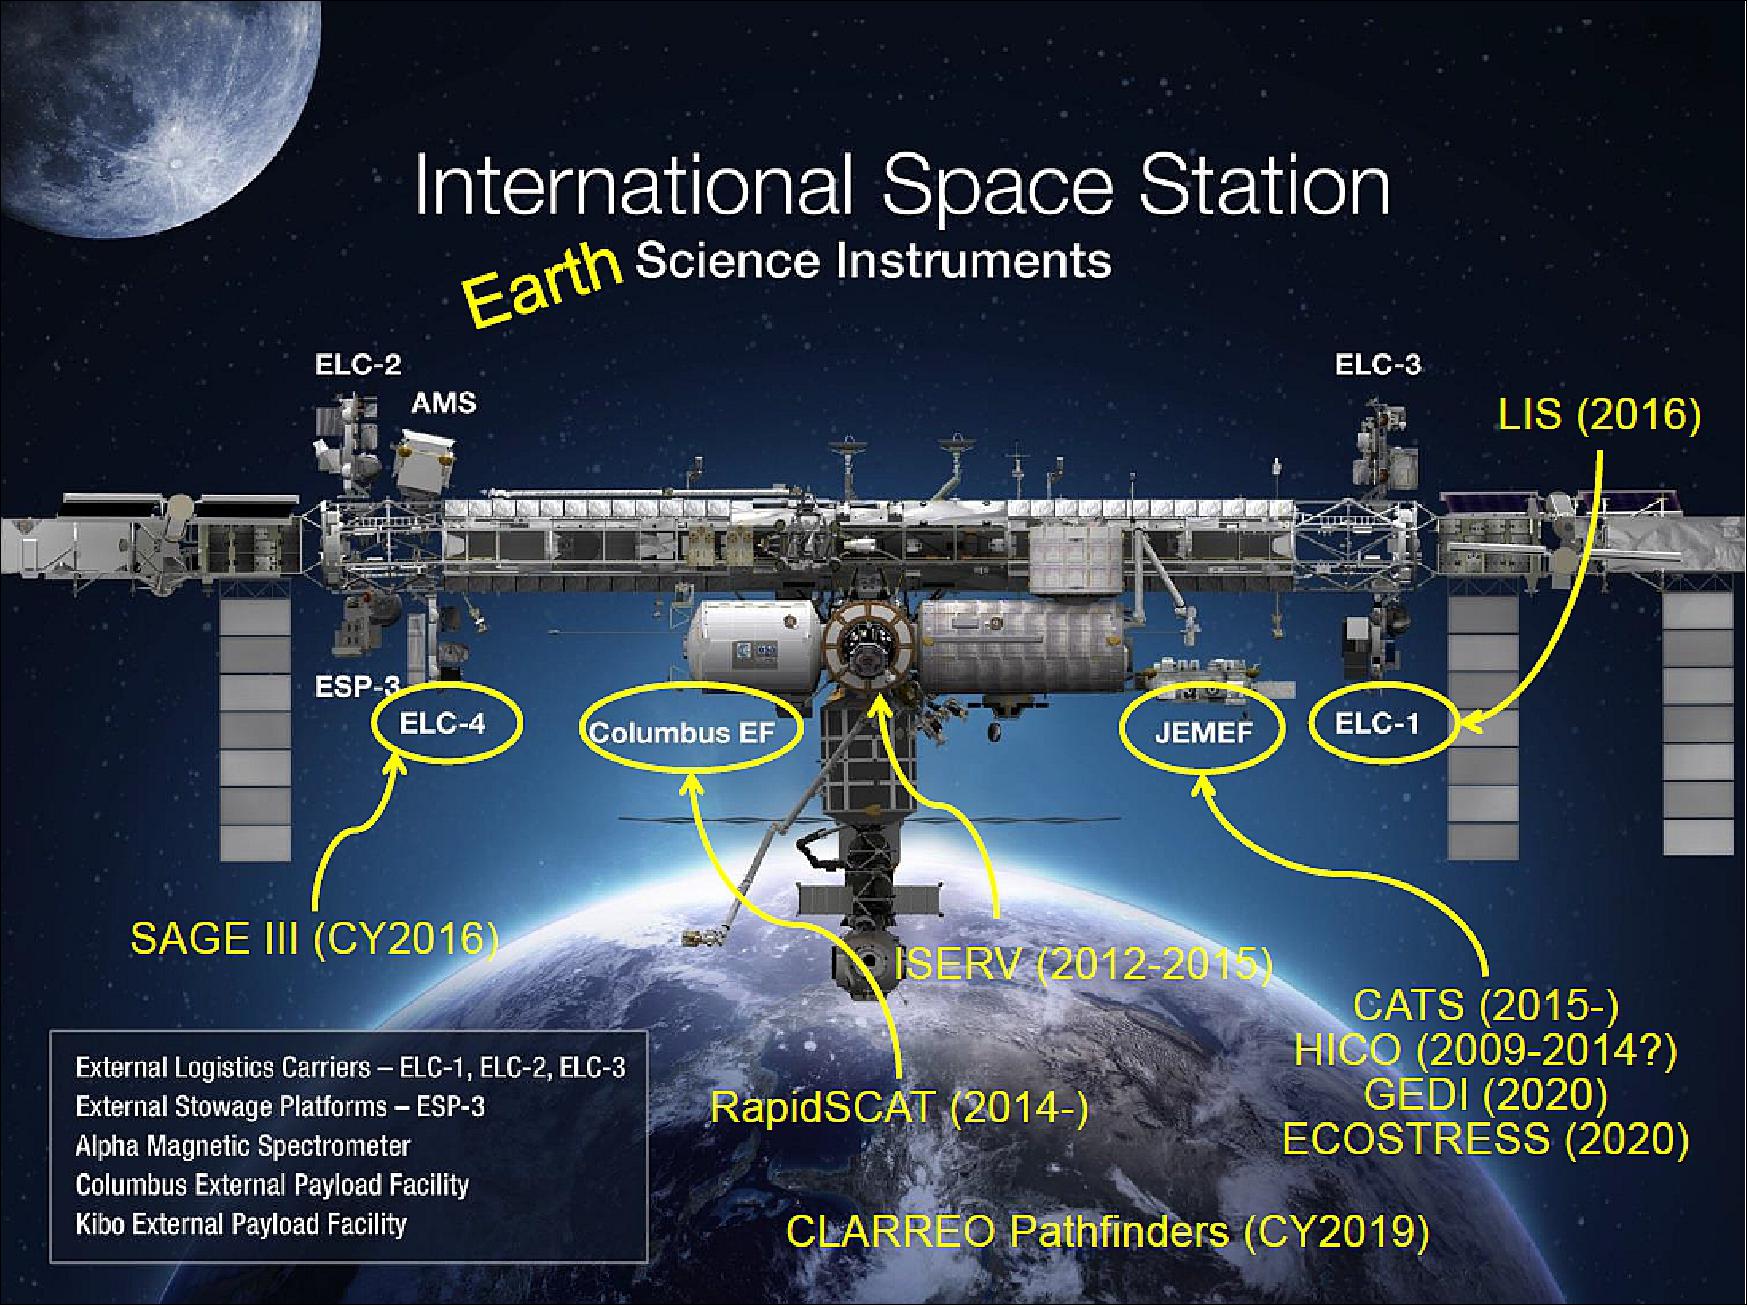
The unpressurized trunk of the spacecraft (960 kg) holds the SAGE-III (Stratospheric Aerosol and Gas Experiment-III) , which will provide continuity for key climate observations and data records, and the STP-H5 payload manifest, including LIS (Lighting Imaging Sensor). There are separate files of each instrument on the eoPortal.
Orbit of the ISS: Near-circular orbit with an altitude of ~400 km, inclination = 51.6º.
SAGE-III will be robotically mounted onto the ELC, a NVP (Nadir Viewing Platform) on the International Space Station.
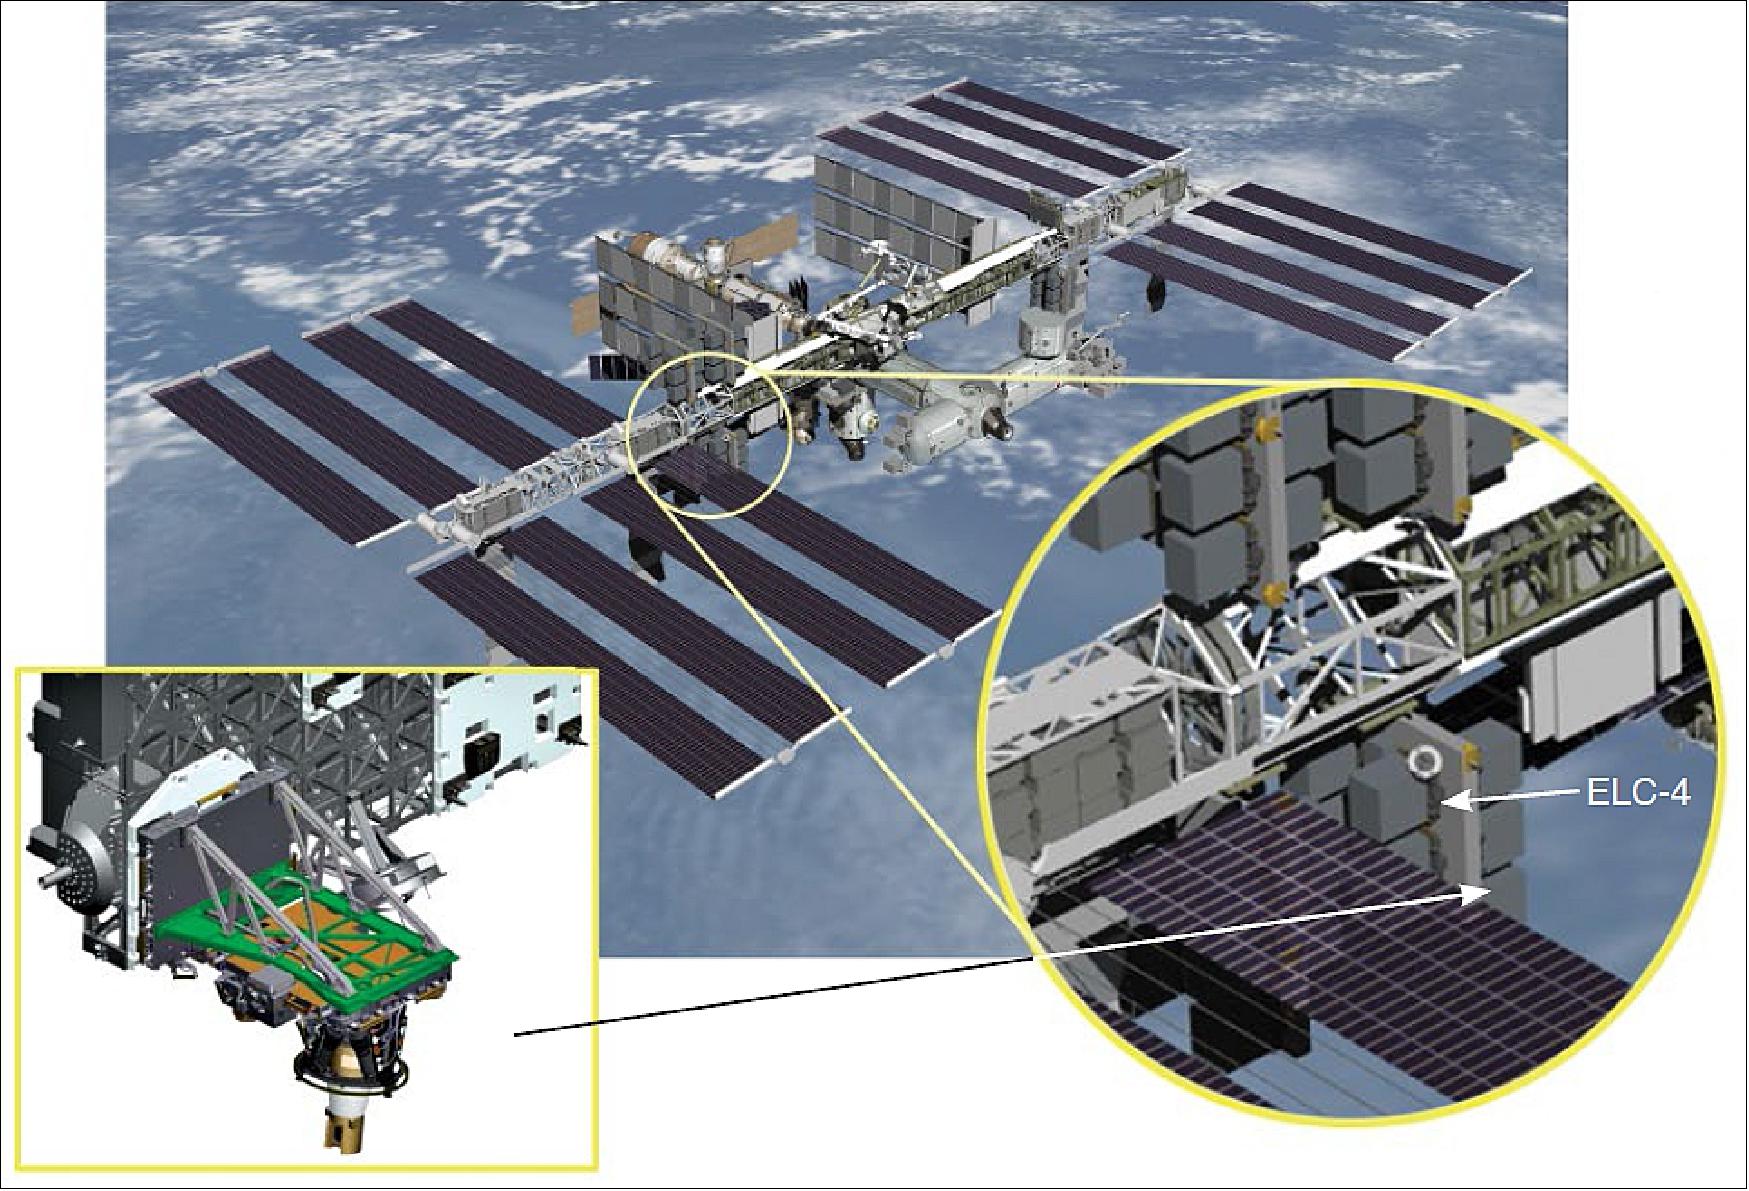
SAGE-III will be transferred from the Dragon Trunk attached to a FRAM (Passive Flight Releasable Attachment Mechanism) Adapter Plate 3 (PFAP 3), and installed to the ELC-4 (ExPRESS Logistics Carrier -4) site via the SSMS (Space Station Remote Manipulator System). The SAGE-III investigation is then mounted on a preinstalled NVP (Nadir Viewing Platform) that provides the required interface and structure. This move requires the use of the SPDM (Special Purpose Dexterous Manipulator) and temporary stowage on the SPDM's EOTP (Enhanced ORU Temporary Platform) FRAM Site.
The SAGE-III instrumentation has a total mass of 527 kg and a data rate of 2150 MB/day.
Mission Status
• November 9, 2021: Did you know active volcanoes lie beneath the ocean’s surface? The Stratospheric Aerosol and Gas Experiment (SAGE) III on the International Space Station (ISS) instrument spotted remnants of the Fukutoku-Okanoba undersea volcanic 2021 eruption in Earth’s stratosphere. 14)
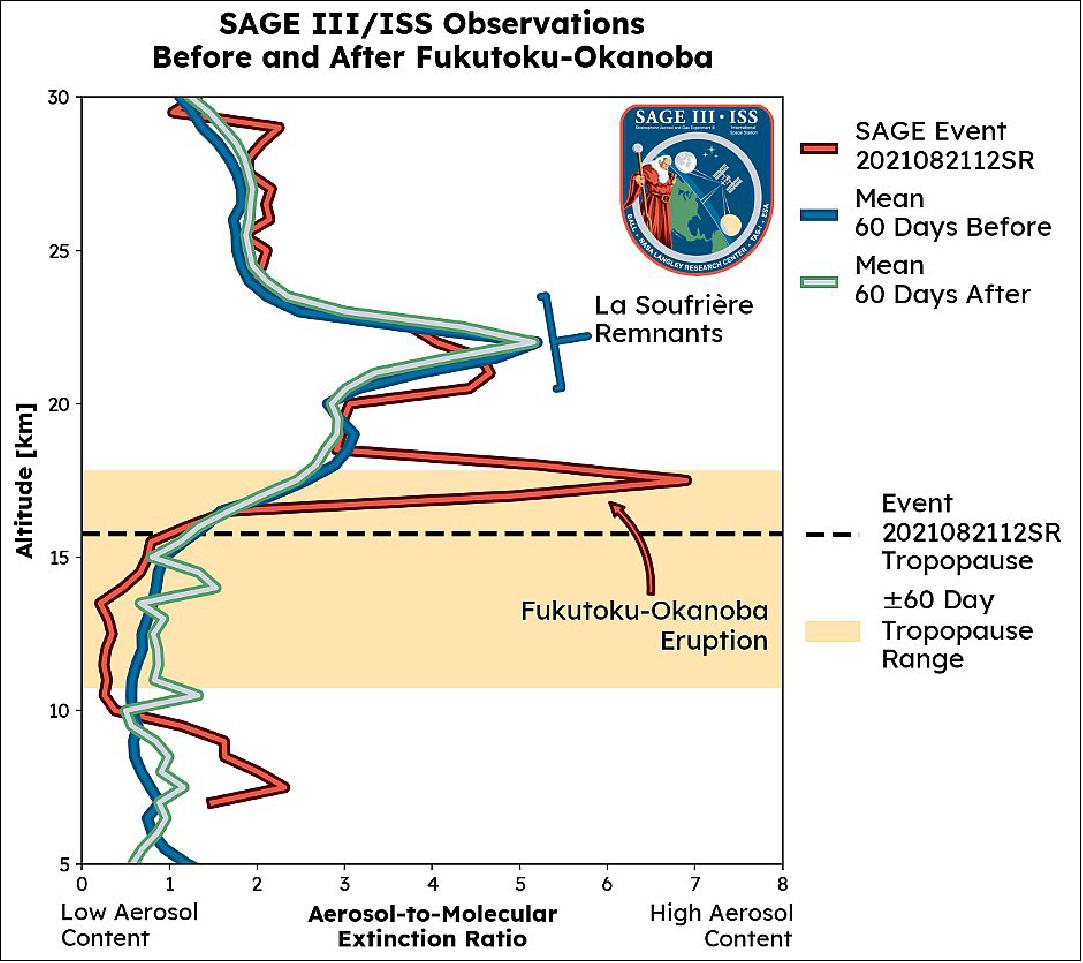
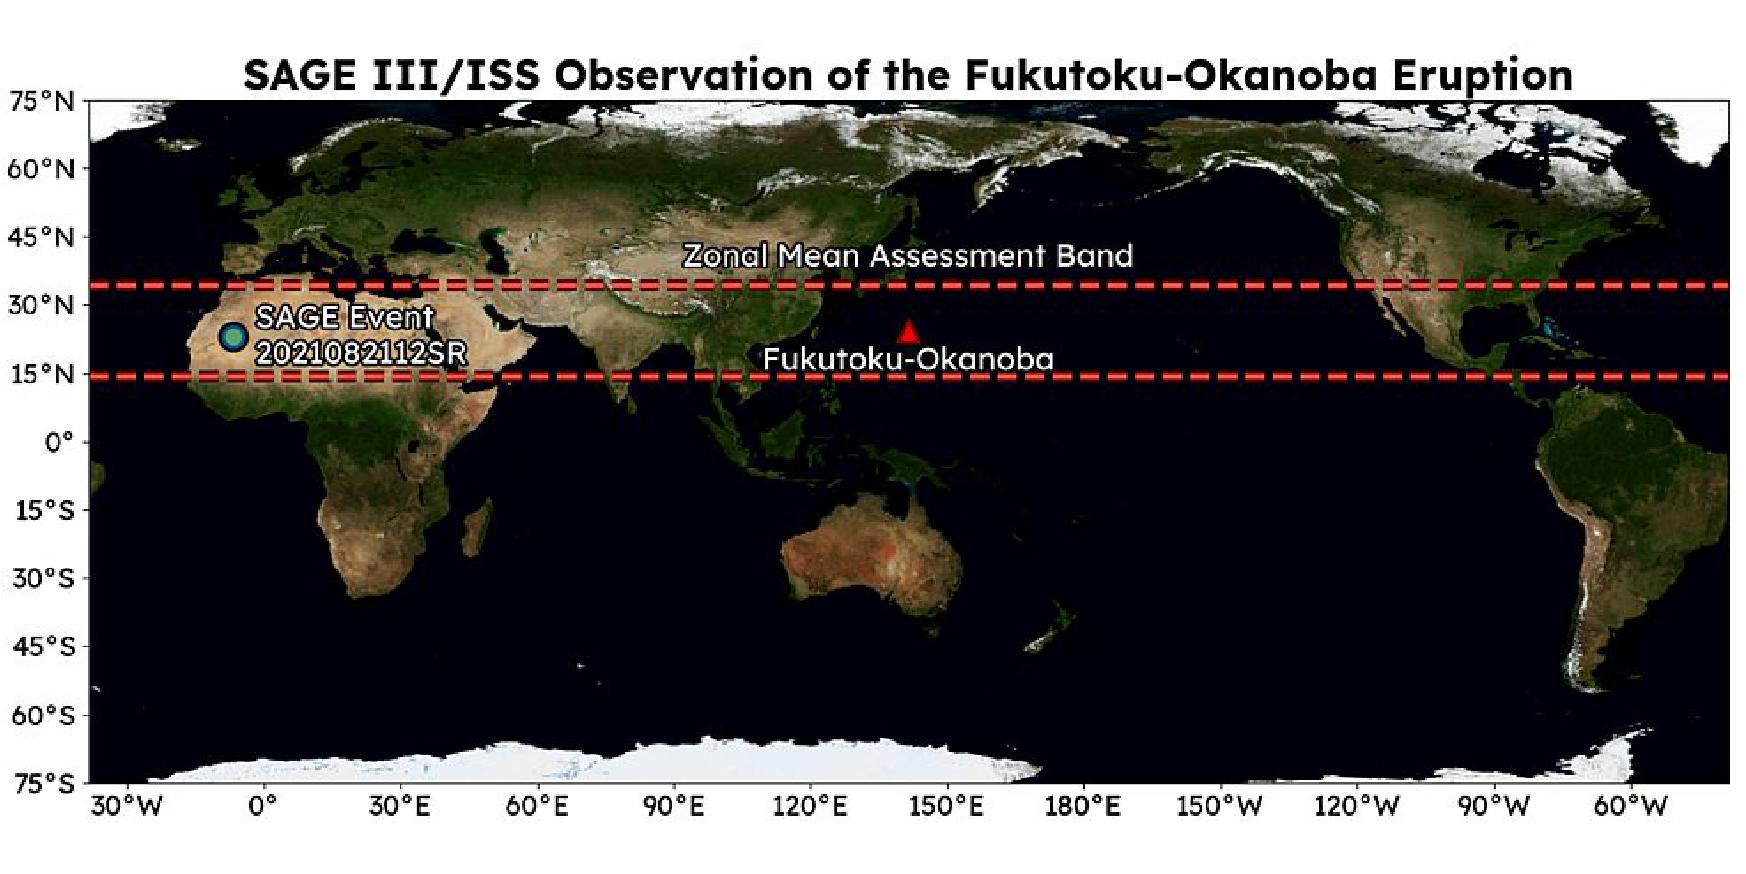
- Fukutoku-Okanoba erupted vigorously in the Philippine Sea on Aug. 13, 2021. Although the volcano's summit is approximately 80 feet under water, the powerful eruption was still forceful enough to send ash and sulfate aerosol particles high above the sea's surface and well up into the lower stratosphere at an altitude of approximately 16 km. While SAGE III was not measuring in the immediate vicinity to capture data at the time of the eruption, SAGE III observations passed through the same latitude one week later, and measurements discerned a new aerosol layer in the lower stratosphere.
- These are important observations for SAGE III to make, because they help scientists understand global climate change better. Stratospheric aerosols such as these act to cool the Earth’s surface by reflecting sunlight back to space.
- It is worth noting that sulfate aerosols don't blast straight from the mouth of an underwater volcano into the stratosphere. Sulfuric dioxide from the volcano reacts with water to form sulfuric acid, which then condenses into the sulfate droplets spotted by SAGE III.
- The data plot of Figure 6 shows the clear spike in aerosols right above the tropopause (dotted line) from the eruption of Fukutoku-Okanoba. Although this was a comparably small eruption in relation to some in the historical record, multiple minor and moderate eruptions causing aerosol enhancements in the stratosphere have a cumulative effect. The result has been shown to be important when studying past changes in Earth’s climate, as well as predicting future changes.
- Higher in the stratosphere around 23 km, SAGE III also saw an enhanced layer of aerosols remaining from the eruption of the La Soufrière volcano in April 2021.
- The SAGE III team continues to examine the evolution of these volcanic disturbances in the stratosphere as the instrument samples the tropics/sub-tropics in the coming months.
• June 2, 2020: The devastating southeastern Australian bushfires that started last September spewed smoke and aerosols higher into the atmosphere than some Earth-observing instruments have ever measured. 15)
- After months of hot and dry weather, the fires erupted in the heavily populated areas of New South Wales and Victoria burning millions of acres of land, destroying thousands of homes, and taking dozens of lives across the country. Now that the fires have been extinguished, NASA scientists are still seeing lingering effects of this natural disaster.
- NASA’s fleet of space-based instruments help scientists and researchers understand how these fires can effect the Earth. Working collaboratively, these NASA systems can detect actively burning fires, track smoke and aerosol transport, help to create air quality forecasts, and observe long-term impacts to wildlife and ecosystems.
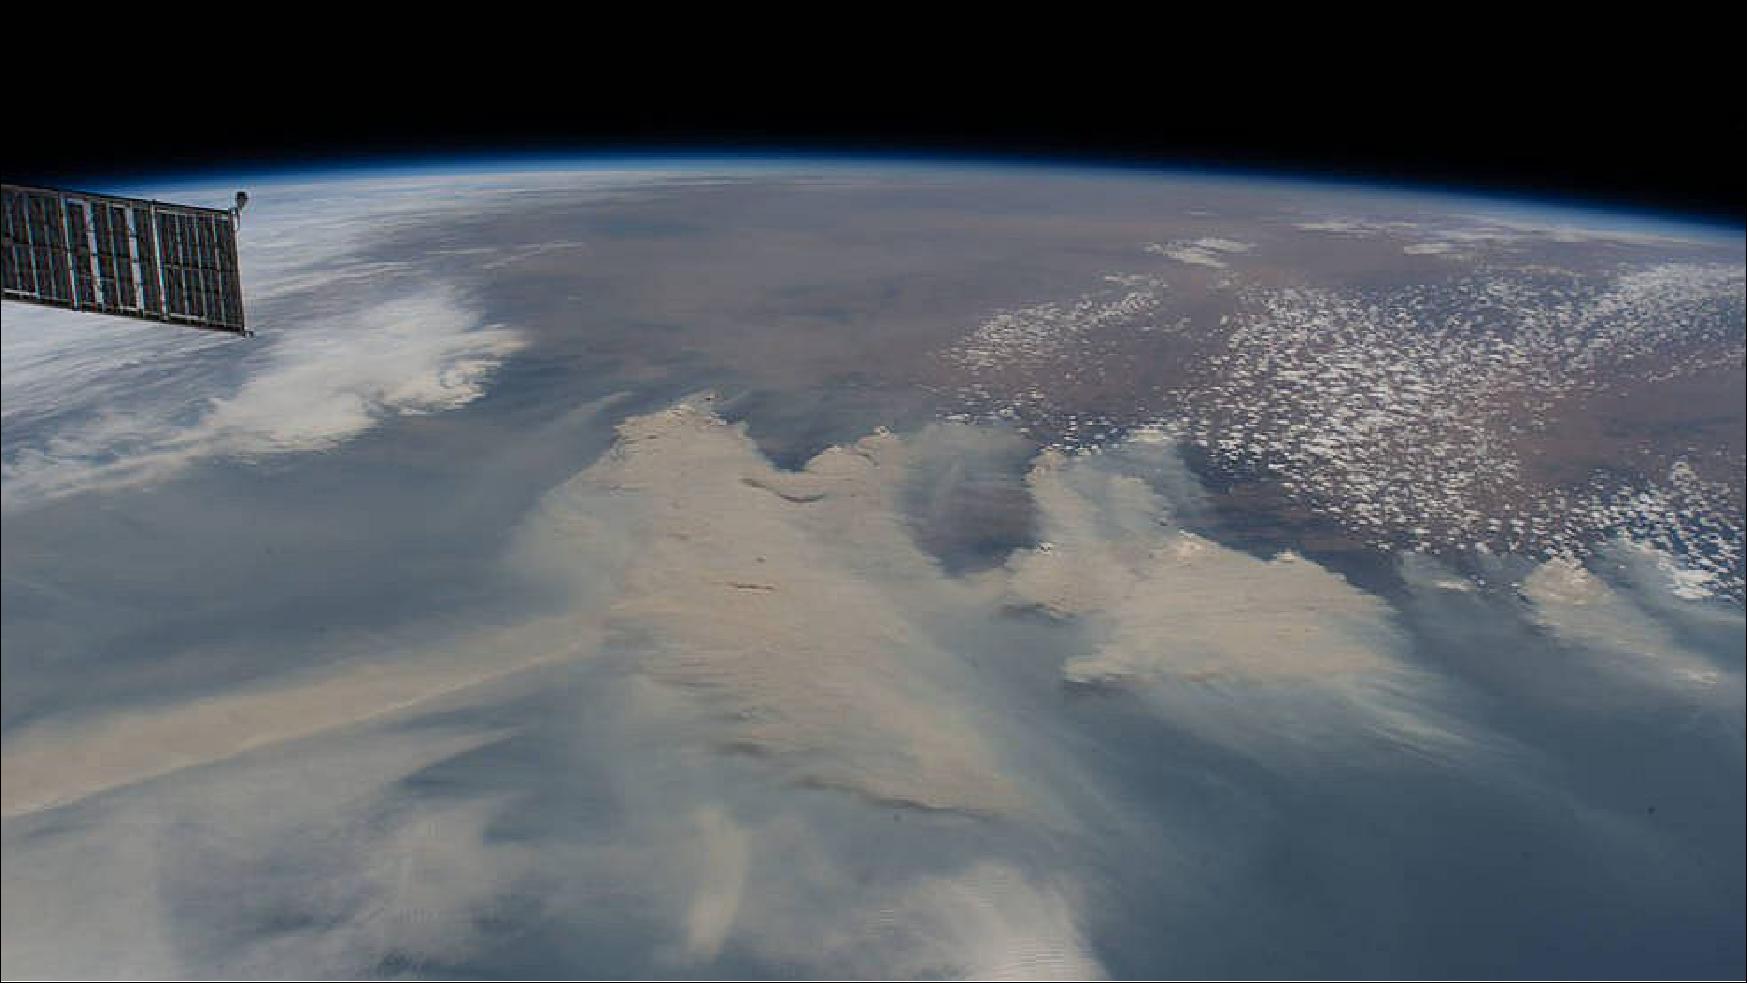
- Between November 2019 and the end of January 2020, the Stratospheric Aerosol and Gas Experiment (SAGE) III instrument, mounted on the International Space Station (ISS), saw a dramatic increase in the amount of stratospheric aerosols above Australia.
- Aerosols are tiny, airborne, solid and liquid particles in the atmosphere. Most aerosols are naturally occurring, including windblown dust from deserts, sea salt, smoke from wildfires, and ash from volcanic eruptions. Stratospheric aerosols can play a role in the destruction of ozone, which acts as Earth’s sunscreen to protect humans from harmful ultraviolet rays from the Sun. In addition, depending upon their size, type, and location, stratospheric aerosols can also either cool Earth’s surface, or warm the atmosphere, contributing to variability in the climate record.
- In November, SAGE III saw increased amounts of aerosol in the upper part of the troposphere (approximately below 12 km for mid-latitudes), but the loading in the stratosphere, just above the troposphere, remained normal. At the end of December and into early January, the intrusions of aerosols into the stratosphere became more consistent in the SAGE III science data due to pyrocumulonimbus storms, or pyroCbs. These pyroCbs occur when fires loft enough heat and moisture into Earth’s atmosphere, creating powerful clouds that cause dangerous smoke-infused thunderstorms.
- “Different from typical stratospheric sulfate aerosol, pyroCb injected aerosols are of larger size, according to SAGE III/ISS data, and most likely carbonaceous (soot), based on the context,” said David Flittner, SAGE III project scientist at NASA’s Langley Research Center in Hampton, Virginia.
- Approximately once a month, the orbit of the ISS allows SAGE III to make high-resolution, vertical observations of the stratosphere within a specific latitude region. Visiting latitudes south of Australia for this regular monthly check-up, SAGE observed the increased aerosol loading at successively higher altitudes: 15 km in early January, 20 km in late January/early February, 25 km in early March, 30 km in late March, and just over 30 km in May.
- “A process called the diabatic heating effect causes the aerosols resulting from the wildfires to absorb sunlight and heat the air around them, and rise higher into the stratosphere. This process causes the aerosols to remain in the atmosphere longer before slowly falling back to the Earth’s surface, than if there was no substantial diabatic heating,” said Kevin Leavor, SAGE III scientist.
- Initially, SAGE III scientists saw the aerosols from the fires drift east toward South America, as well as towards the southern extent of the SAGE III observation range (70°S). In more recent observations, aerosols have been drifting towards the tropics. Based on events in the past that produced large amounts of stratospheric aerosols, such as the Pacific Northwest wildfires in 2017, scientists expect the effects of the Australian wildfires to stick around for at least a year.
Possible Effects on Ozone
- Aerosols from wildfires, as well as volcanic eruptions, can have an effect on Earth’s Antarctic stratospheric ozone hole.
- During winter in the polar regions, aerosols grow to form polar stratospheric clouds (PSCs). The large surface areas of these cloud particles provide sites for chemical reactions to take place. These reactions lead to the formation of large amounts of reactive chlorine and, ultimately, to the depletion of ozone in the stratosphere.
- “The increased aerosol content in the south polar stratosphere resulting from the Australian wildfires might have an effect on the 2020 ozone hole by altering the number of PSC particles and the timing of the processes involved in ozone hole chemistry,” said Flittner. Scientists observed enhanced ozone destruction occur after the April 2015 eruption of the Calbuco volcano in Southern Chile.
- “Although the timing is slightly different (January for the peak of the fires vs. April for the volcanic eruption) and the composition of the enhanced aerosol is different (carbonaceous vs. sulfate), in light of the response to Calbuco, I am interested to see if the Australian wildfires will influence the 2020 Antarctic ozone hole season,” said Flittner.
- Because the fires could have a potential impact on ozone levels at the pole, areas of low ozone could sweep out over regions in the southern hemisphere. New Zealand and parts of South America, such as Argentina and Chile, have been affected in the past by areas of low ozone moving overhead. With reduced amounts of ozone, which acts as Earth’s protective sunscreen, there could be an increase in sunburns, skin cancer and cataracts in humans and reduced crop yield in plants.
- “SAGE III is helping to contribute science data to the models that will give a better understanding to what is happening to the ozone in those regions,” said Marilee Roell, SAGE III science manager.
Monitoring Fires and Eruptions
- In addition to the Australian wildfires, SAGE III has seen numerous other notable stratospheric aerosol events throughout its three years in orbit on the International Space Station.
- SAGE III saw significant stratospheric aerosol loading events in the Northern Hemisphere resulting from large wildfires in the Pacific Northwest in 2017 and in Alberta, Canada and Siberia, Russia in mid to late 2019.
- In addition to the wildfire events, volcanic emissions from the eruptions of Ambae on the south Pacific island of Vanuatu in mid-2018, and Ulawun in Papua New Guinea in mid-2019, introduced significant amounts of aerosols into the stratosphere and greatly increased the concentration of aerosols measured at altitudes observed by the SAGE III instrument. Additionally, the Raikoke volcano on the northwest Pacific Kuril Islands erupted in June 2019 emitting the largest amount of sulfur dioxide into the atmosphere in the past decade. The resulting plume quickly moved toward the equator and was observed at high stratospheric altitudes for several months afterward.
- Stratospheric aerosol particles can block sunlight from reaching the ground by absorbing or scattering light, which can then exert a cooling effect on the Earth’s surface. A data measurement called the stratospheric aerosol optical depth tells scientists how much direct sunlight is prevented from reaching the ground by the concentration of aerosol particles in the stratosphere. Since the SAGE III/ISS record began in June 2017, the stratospheric aerosol optical depth record has increased globally by a factor of 2 or 3 due to the various wildfires and volcanic eruptions observed in the past three years. To put this in perspective, the current optical depth record remains a factor of 20 less than after the Mt. Pinatubo eruption in 1991. The Mt. Pinatubo eruption had the most major stratospheric impact in the last 50 years and caused the global troposphere to cool by approximately 1 degree F.
- “There has been a significant amount of variability in stratospheric aerosol loading across the globe. Typically, we associate dramatic changes in stratospheric aerosols with volcanic eruptions, but these wildfire events mimic minor volcanic eruptions," said Flittner. "We have seen major wildfire events three times now in less than three years. This has been unique for historical SAGE observations stretching back to the mid-1980s.”
- The SAGE III/ISS stratospheric data complements observations from other NASA satellites such as trace gas data from the Microwave Limb Sounder (MLS) showing record amounts of carbon monoxide (CO), a by-product of wildfires, and CALIPSO (Cloud-Aerosol Lidar and Infrared Pathfinder Satellite Observations) sightings of stratospheric aerosol plumes. Using these data sources, NASA scientists will continue to monitor the effects of the Australian wildfires on Earth’s atmosphere for the months to come.
• March 20, 2018: With ESA’s help, the latest atmosphere monitor on the International Space Station, namely SAGE-III, is delivering results on our planet’s ozone, aerosol and nitrogen trioxide levels. Installed last year on the orbital outpost, NASA’s sensor tracks the Sun and Moon to probe the constituents of our atmosphere. 16)
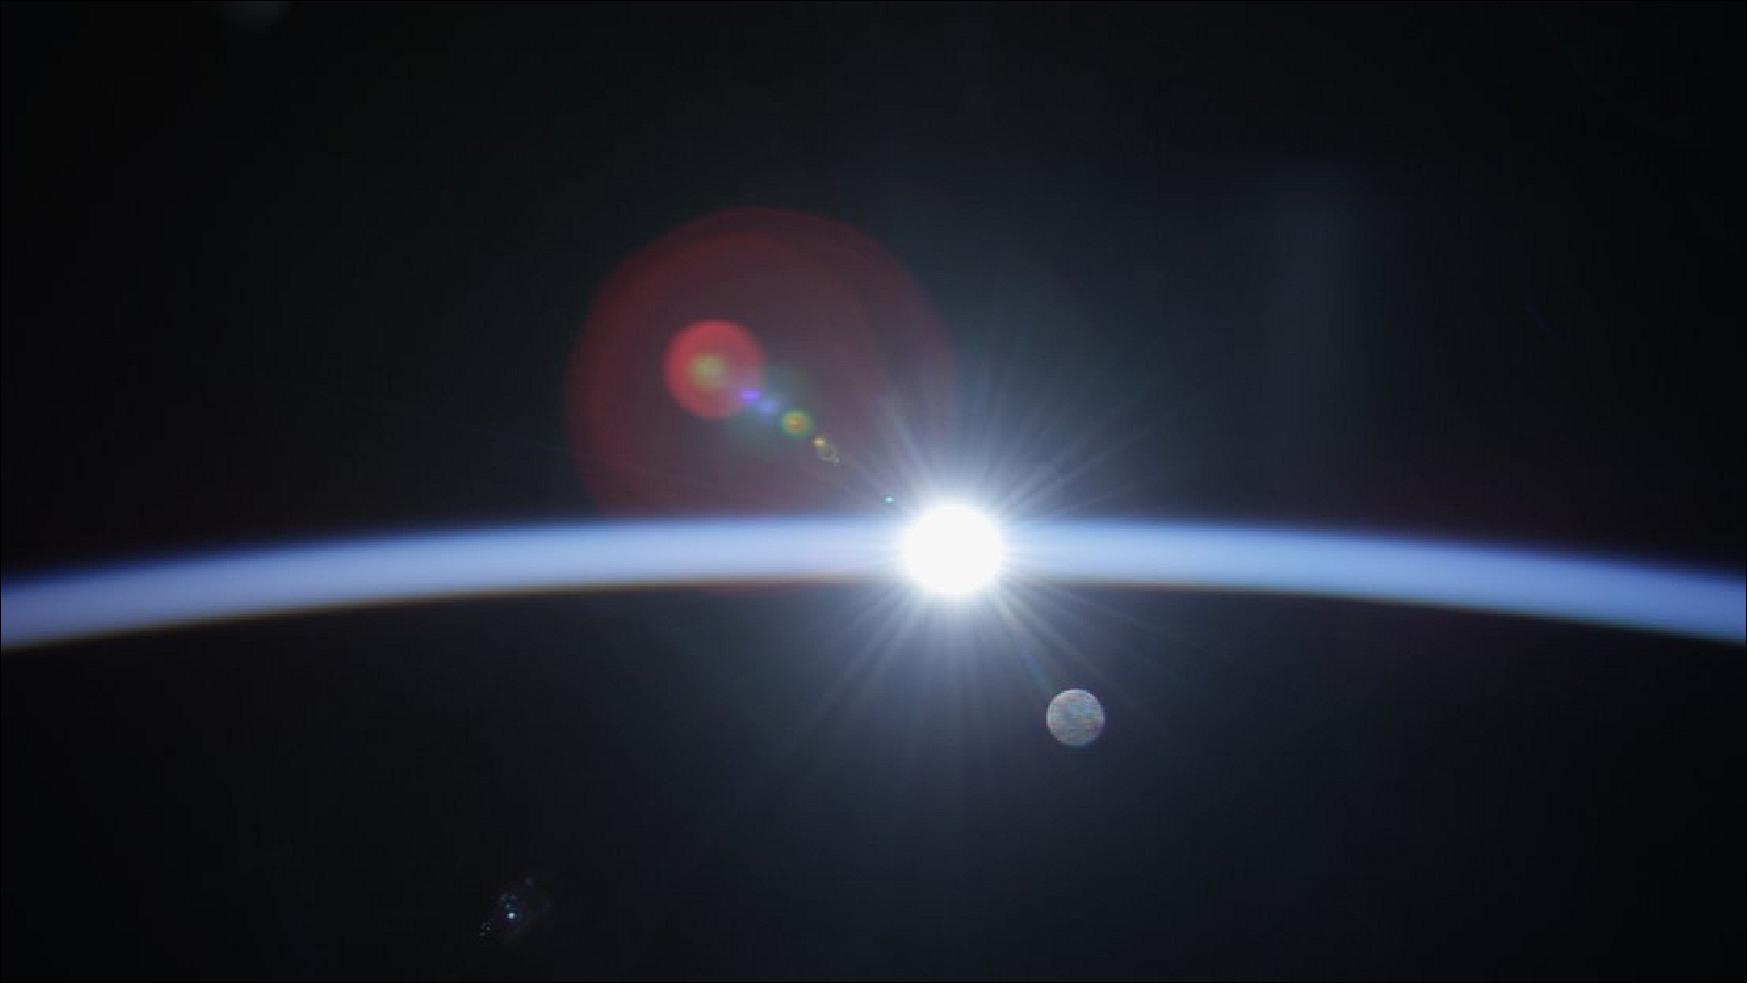
Legend to Figure 10: SAGE is improving our understanding of ozone and climate change in the upper atmosphere by looking at the Sun and Moon as they skim the horizon – and this is where ESA’s Hexapod comes in. Hexapod’s six legs work together to track the Sun and Moon precisely in the few seconds of their setting and rising dozens of times each day. Hexapod tracks the Sun until it disappears behind the horizon and then returns to a starting position to repeat the process with the Moon, for years on end.
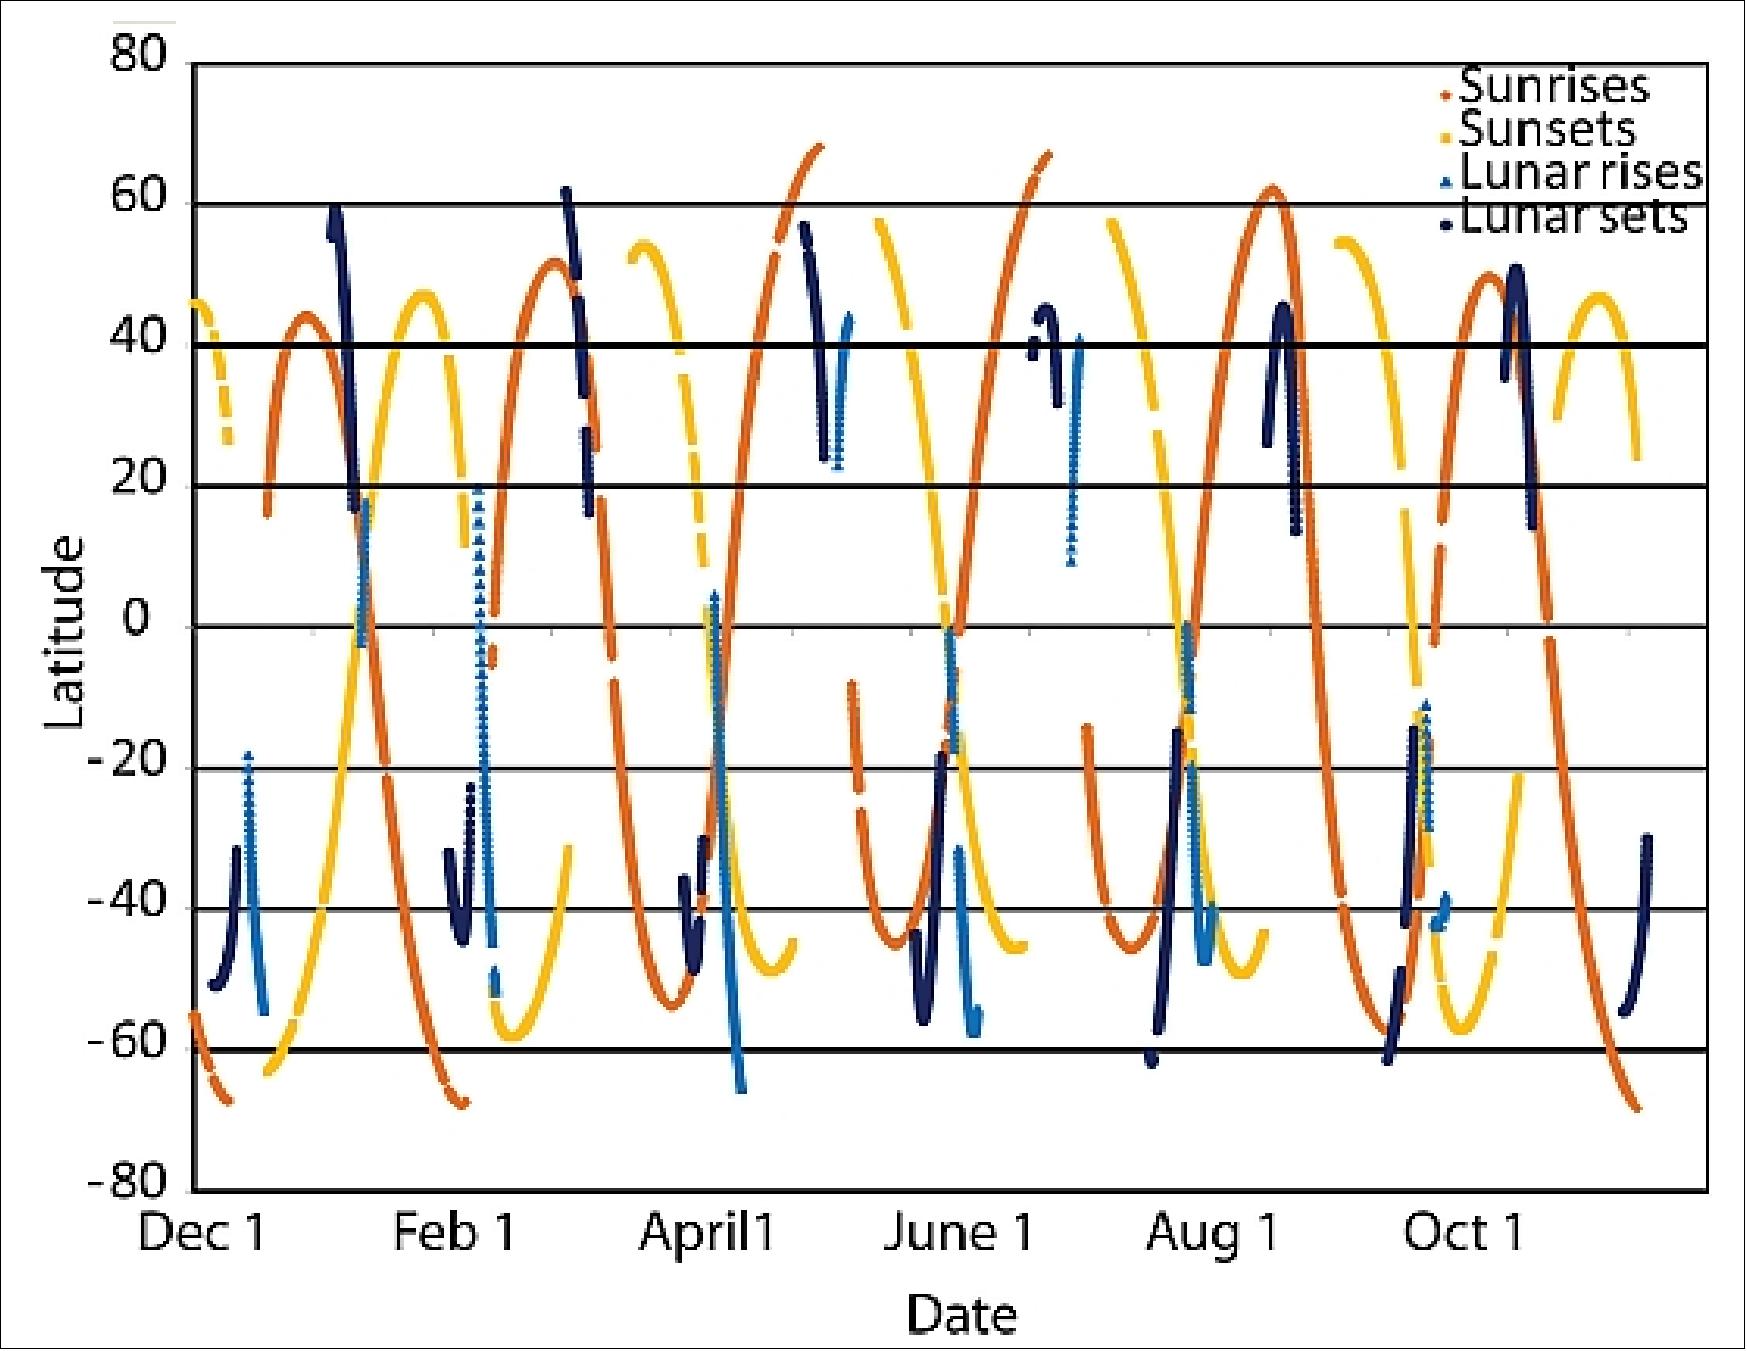
- The Station takes only 90 minutes for a complete circuit of our planet, experiencing 16 sunrises, 16 sunsets, and sometimes moonrises or moonsets, every day. By observing the Sun or Moon through the atmosphere, the Stratospheric Aerosol and Gas Experiment – SAGE – measures the quantity of ozone, aerosols and other gases.
- The readings are complementing the long-term monitoring by Europe’s Copernicus Sentinel missions: launched in October 2017, Sentinel-5P is the first in a series of Sentinels focusing on the atmosphere. —As the Station orbits, SAGE is continuously turned to point in the right direction by ESA’s six-legged Hexapod.
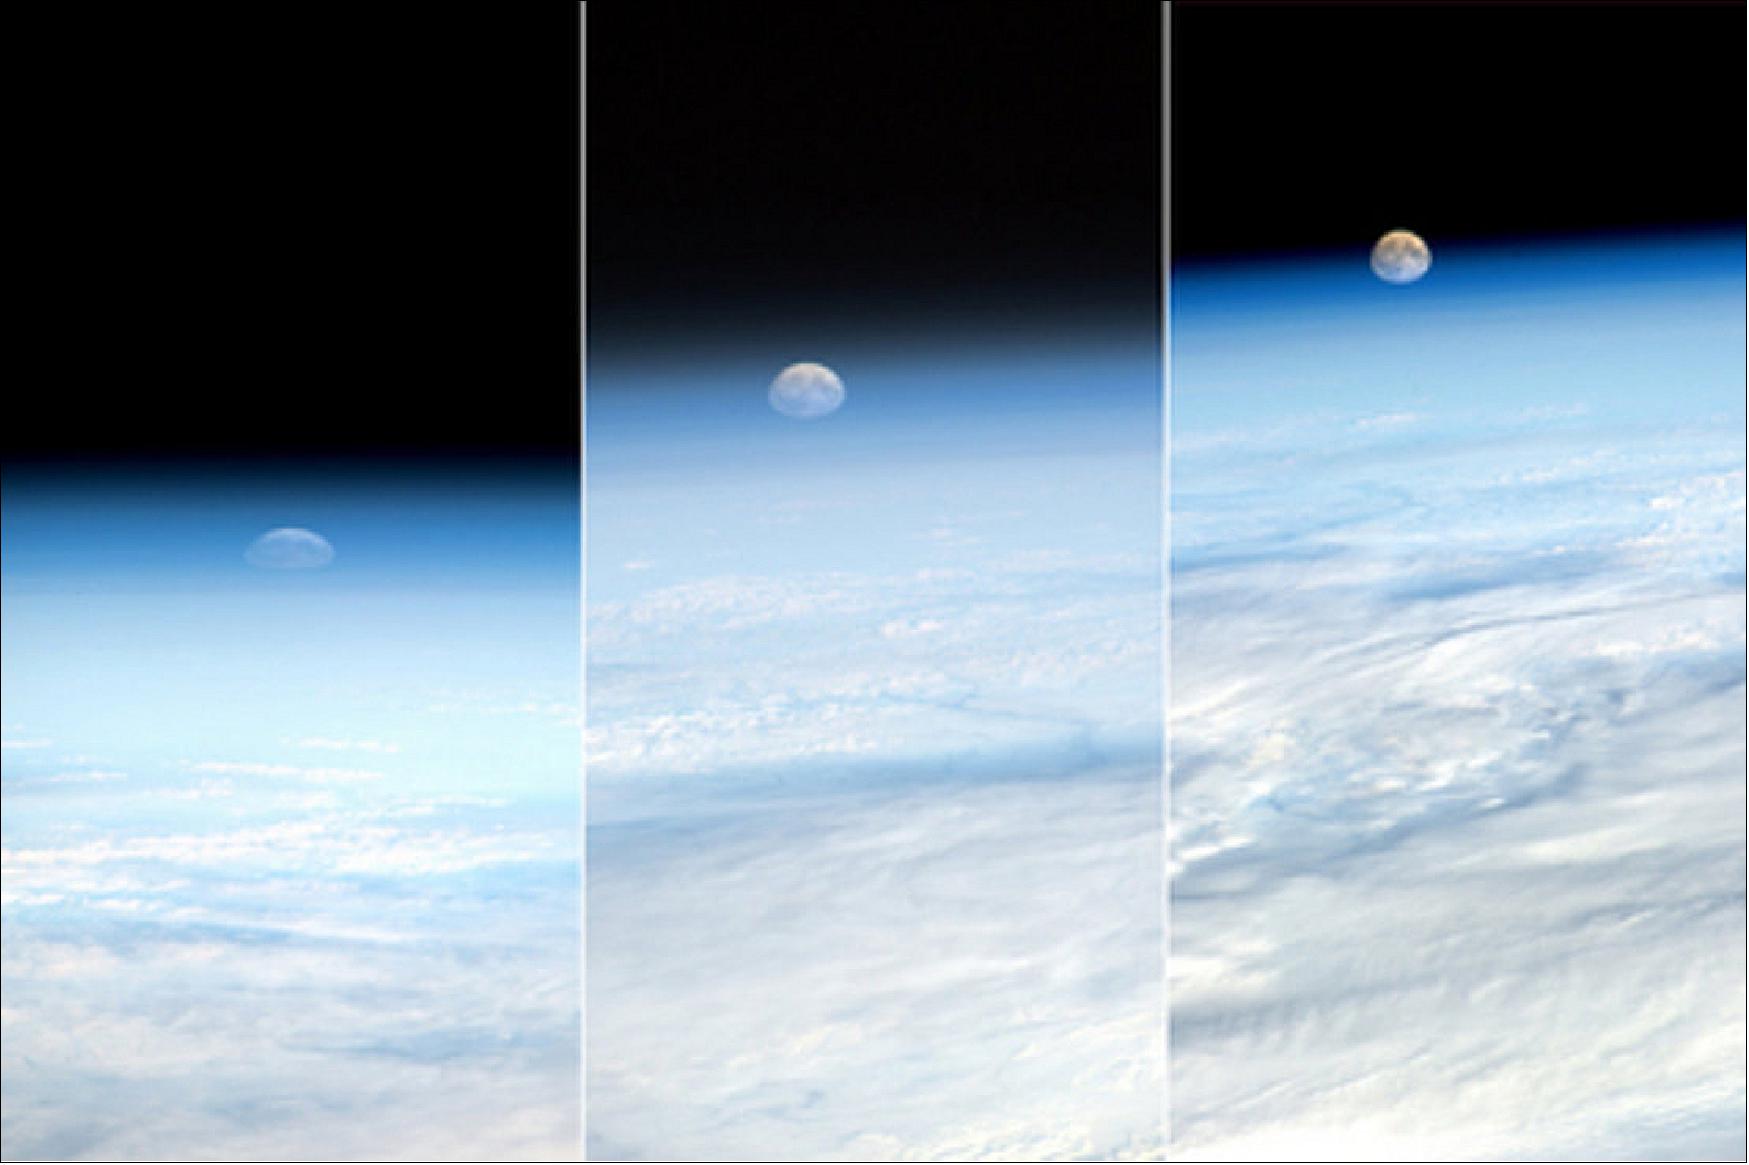
- Using position information from the Station, Hexapod’s computer calculates the movements of its six legs to track the Sun and Moon in the few seconds of their setting and rising. This will happen dozens of times each day over years.
- SAGE was installed in February 2017 and the first results are now being released to the public. The results will be issued monthly, with the quality improving as more measurements are added.
- “The installation and setting up could not have gone better and we are happy to see Hexapod working perfectly to keep SAGE pointing in the right direction,” said ESA’s Hexapod project manager Scott Hovland. “The Hexapod and SAGE collaboration is an exemplary transatlantic cooperation and we are very happy to see the first results coming in.”
- ESA has a history of tracking the Sun from the Space Station: working for more than nine years, its SOLAR facility created the most precise reference on the Sun’s energy output ever.
- The next ESA sensor to be launched to the Station is ASIM (Atmospheric Space Interactions Monitor), which will point straight down at Earth to investigate high-altitude electrical storms. — To be attached next month, it will capture images of elusive electrical discharges called red sprites, blue jets and elves. These powerful electrical charges can reach high above the stratosphere and have implications for how our atmosphere protects us from space radiation.
• October 25, 2017: The first wave of atmospheric data from SAGE-III (Stratospheric Aerosol and Gas Experiment III), a NASA instrument that launched to the ISS (International Space Station) earlier this year, is now available for public use. 17)
- The data, available through NASA’s Atmospheric Science Data Center, was collected from June through August and includes measurements of ozone, aerosols and nitrogen dioxide. SAGE III scientists are releasing this initial dataset in order to solicit feedback from the international atmospheric science community.
- “The intention of this initial release is validation,” said SAGE-III Project Scientist Joe Zawodny of NASA’s Langley Research Center in Hampton, Virginia. “We’re putting it out there so people can start comparing it to their measurements. A lot of these folks have been around for a very long time. They’ve used [data from previous SAGE missions] in the past. They are the ones who are best positioned to give us honest opinions of what they like and what they don’t like.”
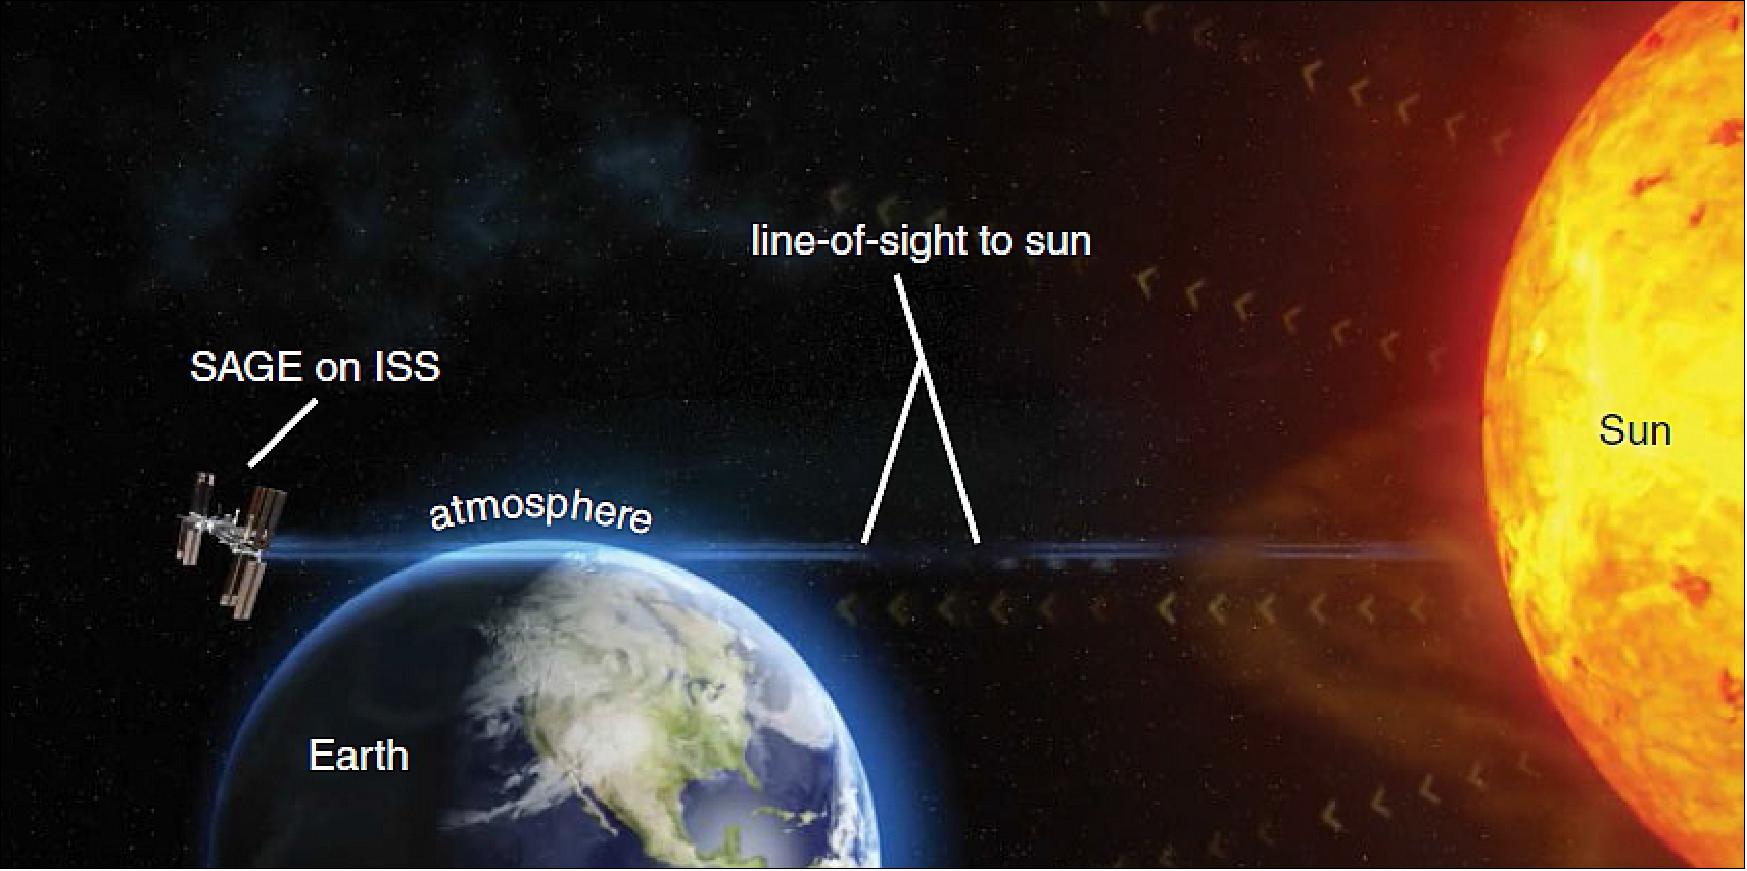
- To take measurements, SAGE-III uses a technique known as occultation, which involves looking at the light from the Sun or Moon as it passes through Earth’s atmosphere at the edge, or limb, of the planet. The space station provides a unique vantage point from which to take those measurements. This initial data release is of solar occultation measurements.
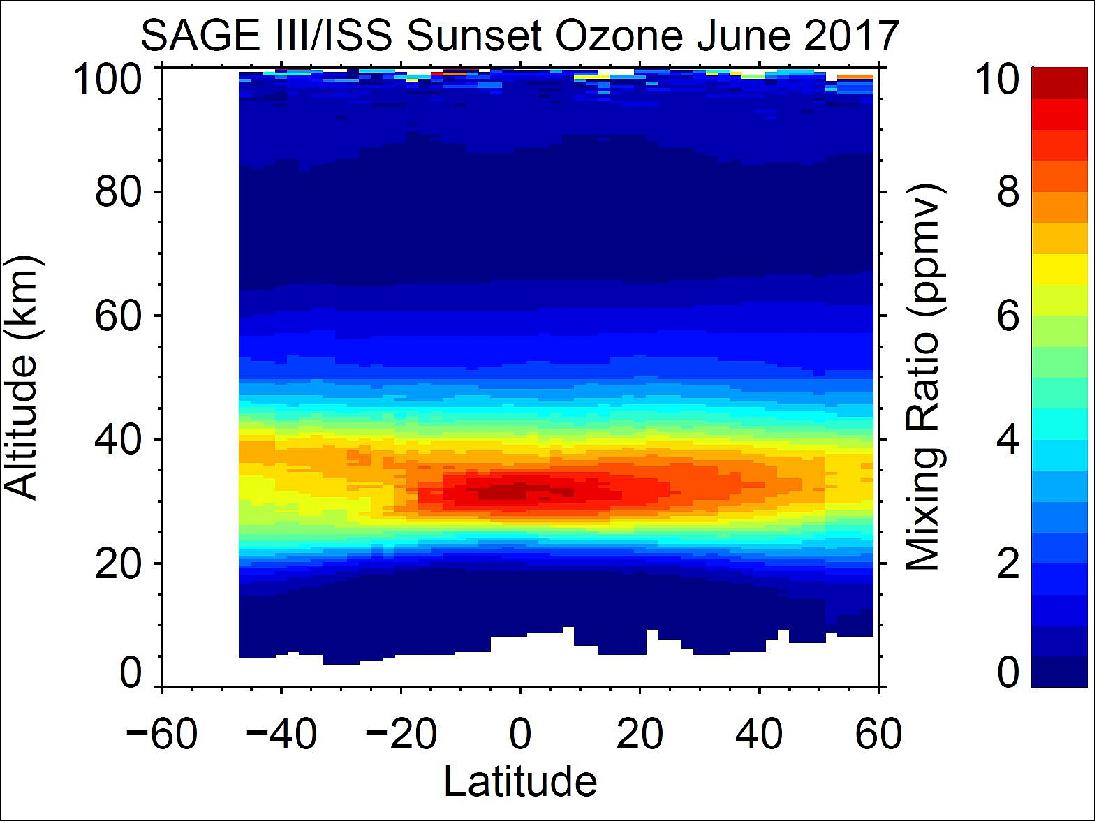
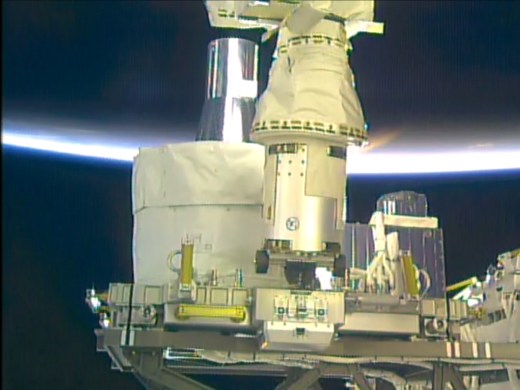
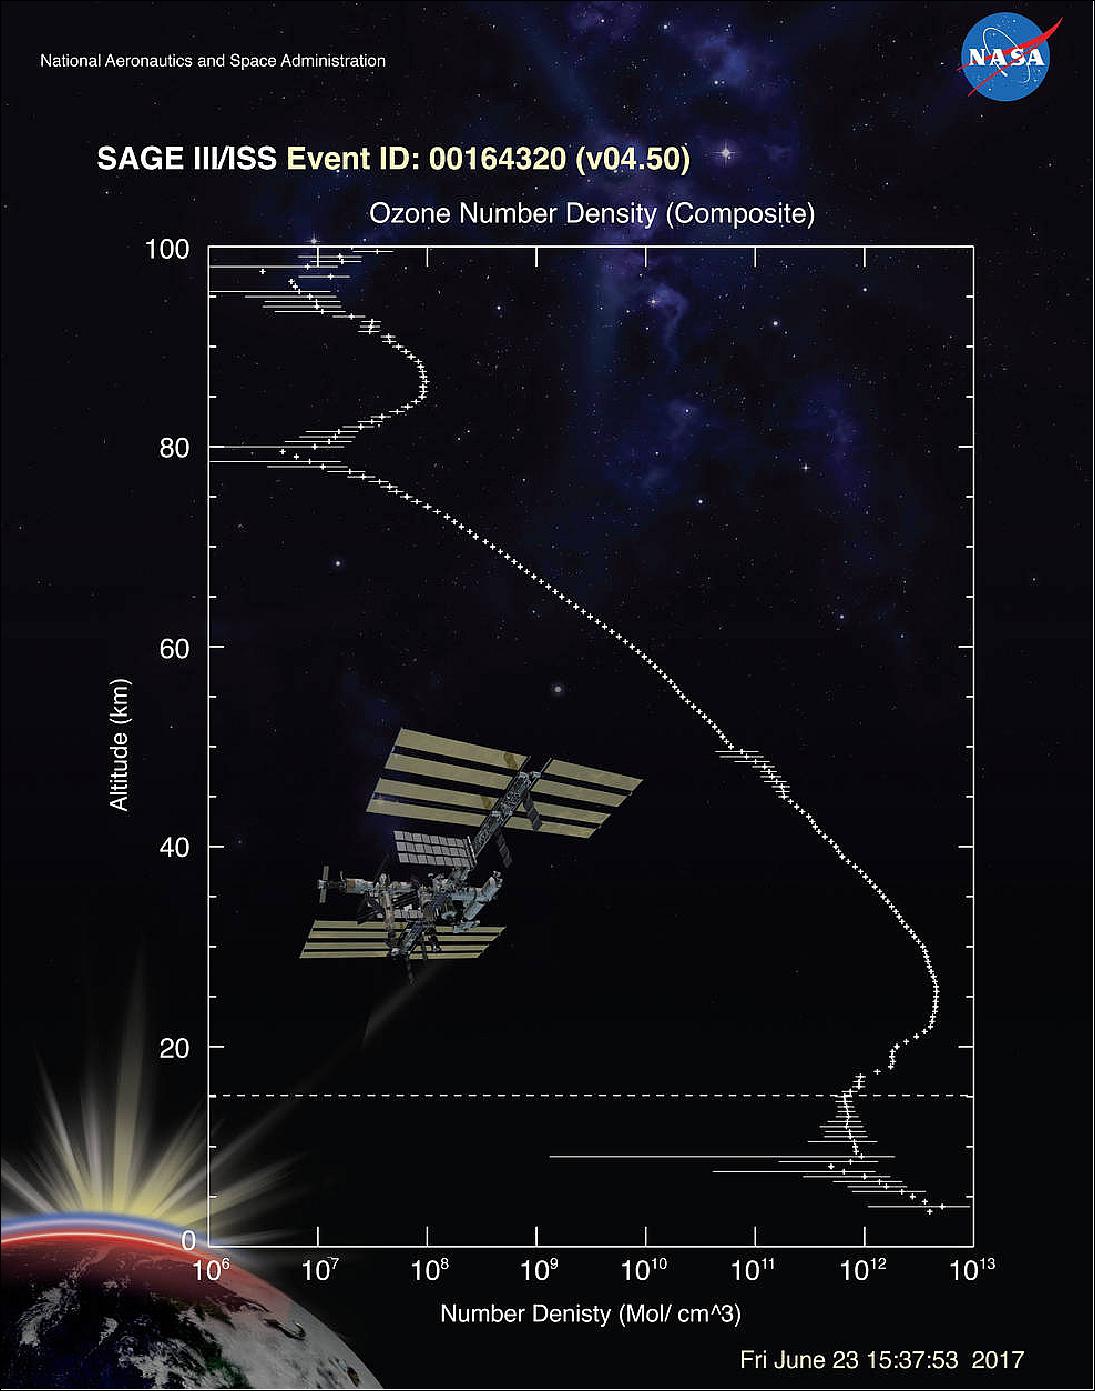
• August 7, 2017: SAGE-III science mission begins. An ozone-measuring instrument that launched to the International Space Station in February has completed commissioning and is now collecting atmospheric data. The SAGE-III (Stratospheric Aerosol and Gas Experiment III) instrument, which was developed at NASA’s Langley Research Center in Hampton, Virginia, collected the preliminary data pictured above over the western desert of Iraq from its perch on the exterior of the space station. 18)
- The instrument measured ozone levels from the mesosphere, stratosphere and through most of the troposphere, as clouds permitted. The relative smoothness of the profile line reflects the quality of the SAGE-III data. “The ISS program congratulates the SAGE-III team on the achievement of this critical milestone, and we are pleased to contribute to the continuation of the SAGE dataset of ozone measurements as the hosting platform for the instrument, which likewise demonstrates the usefulness of the ISS as a remote sensing platform,” said William Stefanov, associate space station program scientist for Earth observations.
• On March 17, 2017, SAGE-III reached another in a series of major recent milestones by collecting first light data from its new home on the International Space Station. 19)
- Solar occultation is a type of measurement that involves looking at the light from the sun as it passes through Earth’s atmosphere at the edge, or limb, of the planet. SAGE-III uses both solar and lunar occultation to measure ozone and aerosols in Earth’s atmosphere.
- Autonomous operations of the instrument will continue over the weekend. Next week, the mission operations team will settle into what Joe Gasbarre of NASA/LaRC referred to as a “cadence of adjustments and data analysis” as instrument commissioning moves into full swing. Complete commissioning and calibration of SAGE-III will take approximately 90 days.- Once fully commissioned, SAGE-III will take occultation measurements about 15 or 16 times a day. The space station’s unique orbital path will allow SAGE-III to make observations during all seasons and over a large portion of the globe.
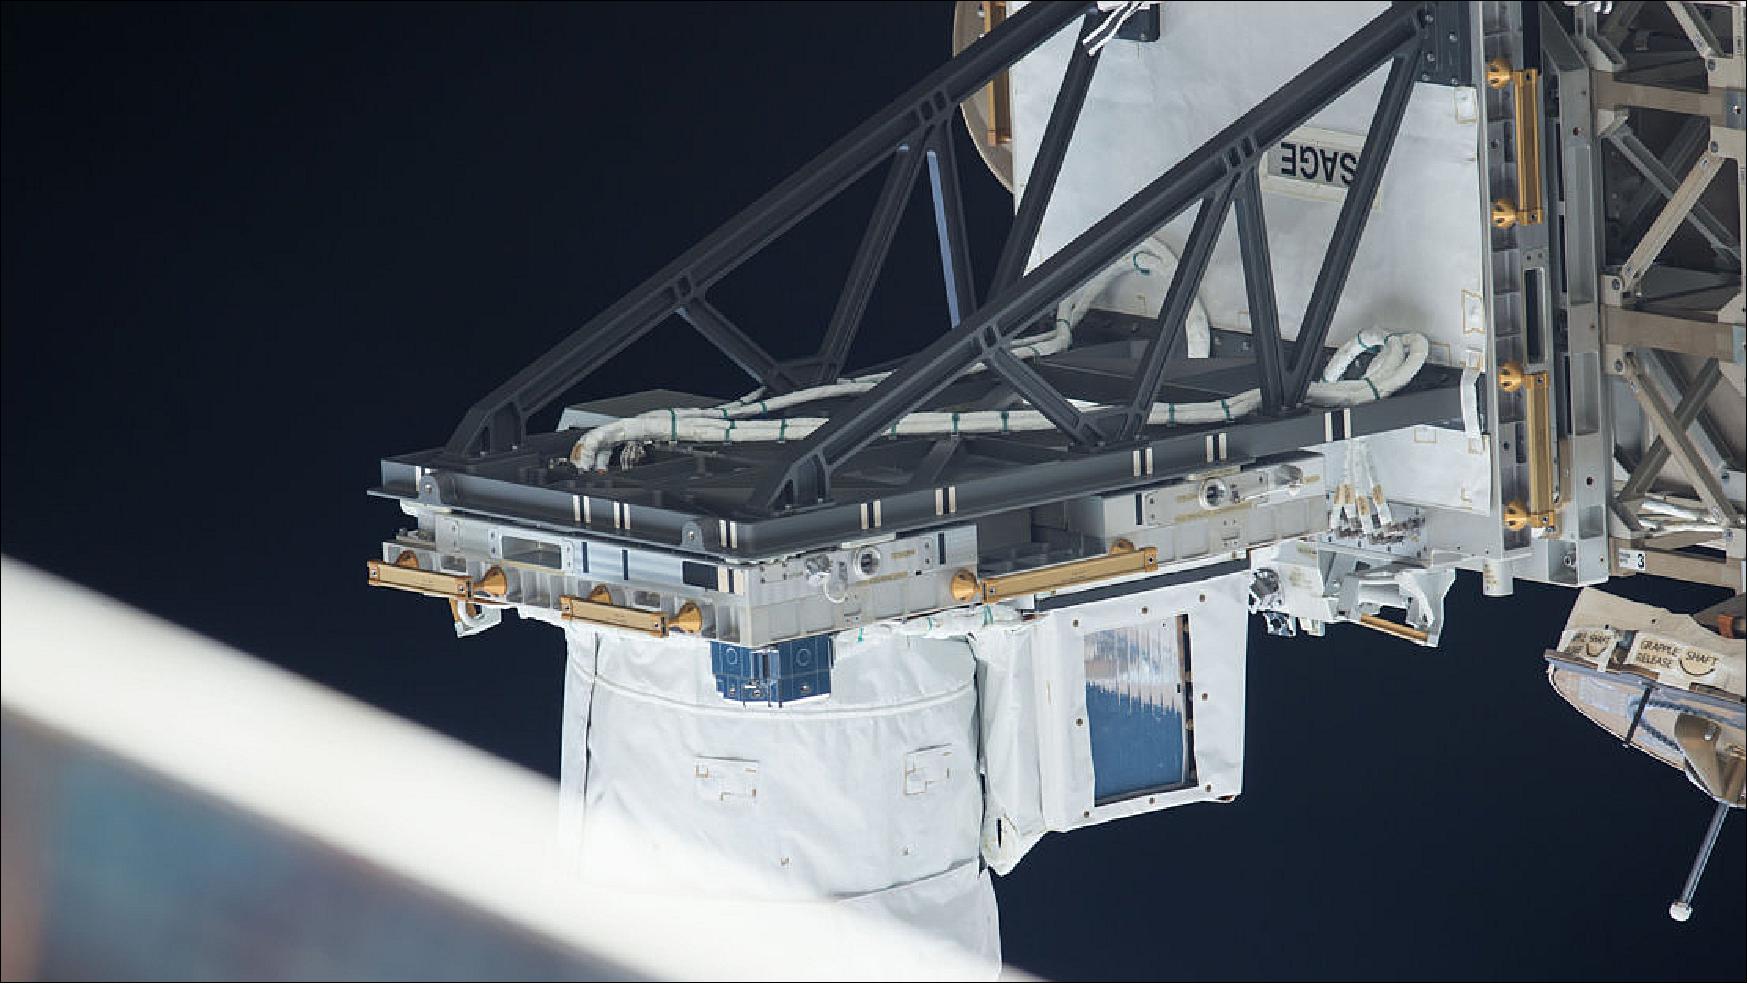
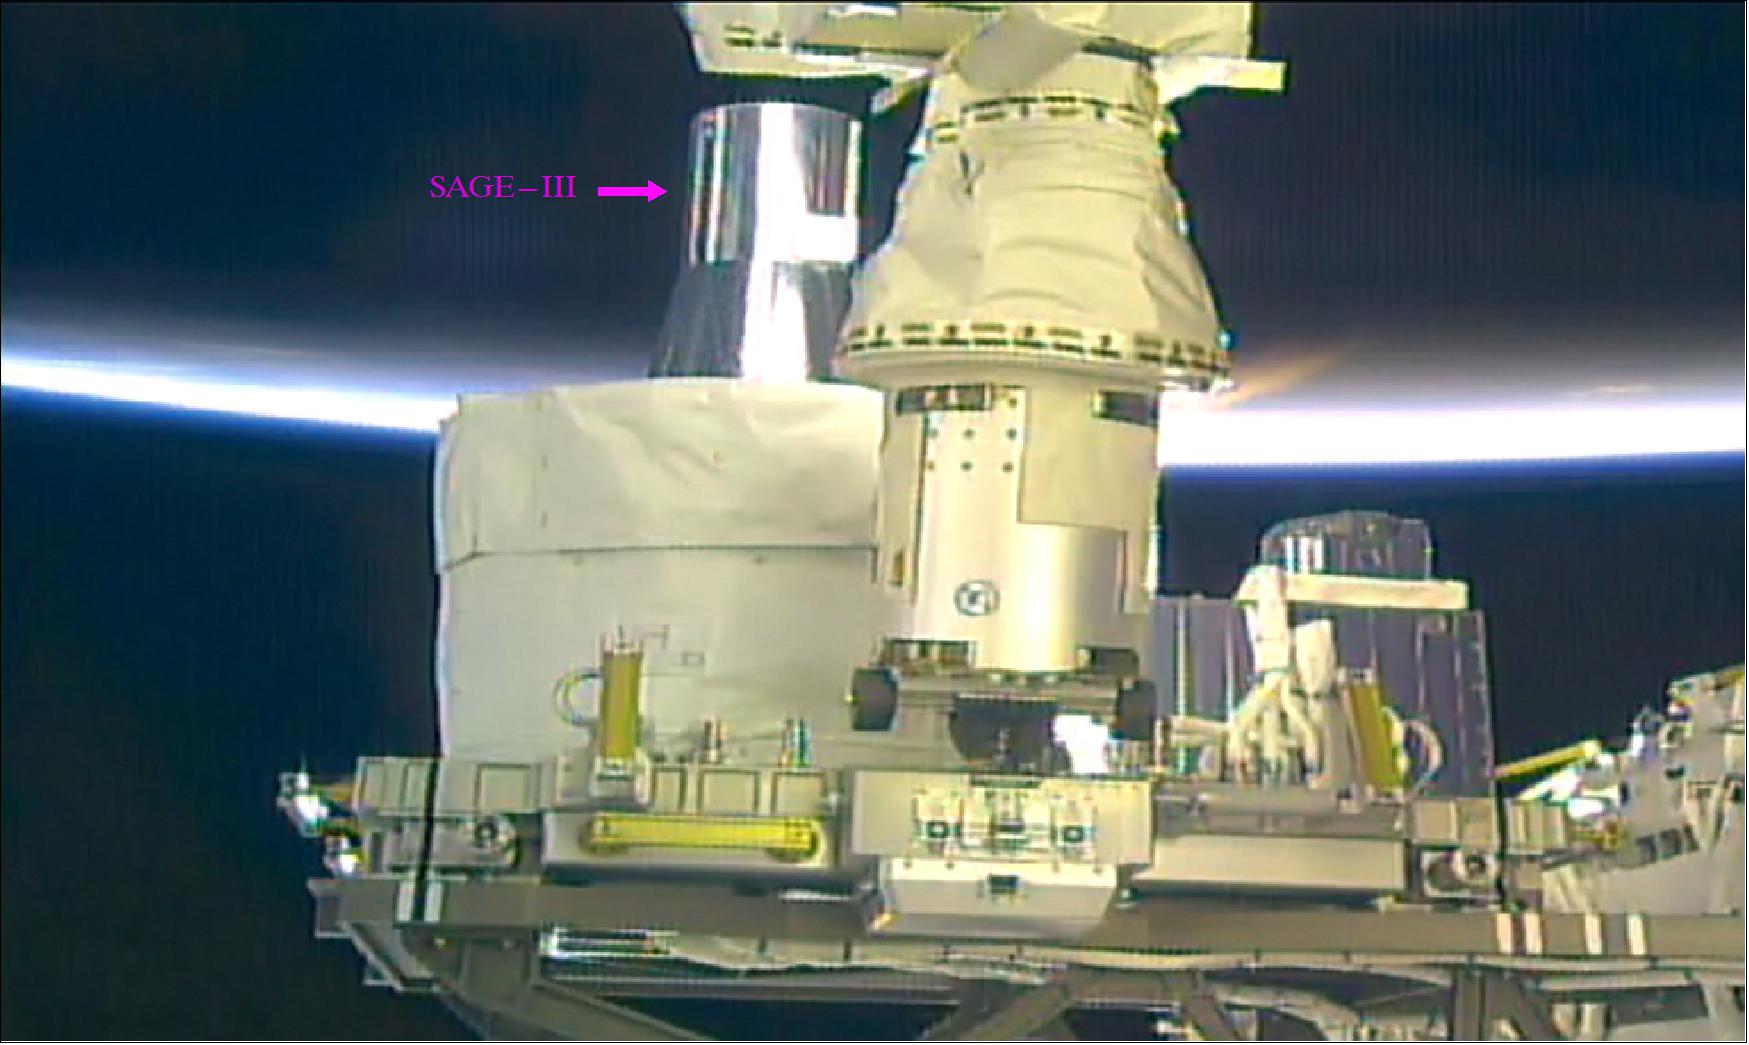
• March 8, 2017: Just a little more than two weeks after its Feb. 19 launch on a SpaceX Falcon-9/Dragon spacecraft, SAGE-III (Stratospheric Aerosol and Gas Experiment III) is now safely installed on the outside of the International Space Station, where it will monitor ozone and aerosols in Earth’s upper atmosphere. — In a highly choreographed sequence of events, the station’s robotic Canadarm2 removed the instrument payload and its NVP (Nadir Viewing Platform) from the Dragon trunk and installed them on the ExPRESS Logistics Carrier platform. The entire sequence took about four days. The NVP allows SAGE-III to face nadir, or down, toward Earth. 20)
- Final installation of the instrument payload, which includes SAGE-III and its hexapod pointing system, took place March 7.
- “With a flawless launch and the on-orbit assembly sequence behind us, the SAGE-III and the space station teams have completed a major milestone,” said SAGE-III Project Manager Mike Cisewski. “Our team is ready to proceed with payload commissioning and our long-term work of extending the SAGE data record from the station.”
- Activation and calibration of SAGE-III will take approximately 90 days. Brooke Thornton, SAGE-III mission operations manager, and the mission operations team will closely monitor those activities from the Flight Mission Support Center at NASA/LaRC (Langley Research Center) in Hampton, Virginia.
- “The operations team has been working so hard to get fully prepared for this and now that it is here it’s almost a relief,” said Thornton. “This team has operated and tested this payload for nearly five years now, so I know we have the best team to get us through activation and all the extensive calibration activities. We’re ready to get into routine operations.”
SAGE-III Instrument
The SAGE-III investigation observes the vertical profile of Earth's atmosphere by measuring the extent of our protective ozone layer, nitrogen dioxide (NO2) levels, water vapor and aerosols in the atmosphere. Atmospheric occultation measurements (i.e., measuring light transmitted through the atmosphere) are performed as the sun or moon is rising or setting. By measuring the composition of the middle and lower atmosphere from the unique vantage point of the ISS, researchers can monitor and help to better understand and quantify the long-term changes and our impact on Earth. 21) 22) 23) 24)
The science goals of the mission are to:
• Assess the state of recovery in the distribution of O3
• Re-establish the aerosol measurementsneeded by both climate and O3 models; and
• Gain further insight into key processes contributing to O3 and aerosol variability.
SAGE -III is the first instrument to measure the composition of the middle and lower atmosphere from the ISS. The orbit of the ISS provides a perfect vantage point from which to acquire measurements of this region of the atmosphere. The station's orbital path will allow SAGE-III to observe O3 during all seasons and over a large portion of the globe. SAGE-III on ISS will also measure O3 concentrations deeper into the atmosphere than previous SAGE measurements, reaching down into the troposphere. Another benefit of flying onboard the ISS is that scientists and engineers will also have near-continuous communications with the payload.
SAGE-III relies upon the flight-proven designs used in the SAM-I (Stratospheric Aerosol Measurement-I) and SAGE -I and -II instruments. SAGE-III, like its predecessors, is a grating spectrometer that measures ultraviolet/visible energy. However, SAGE-III has a few upgrades. The new design incorporates CCD (Charge Coupled Device) array detectors and a 16 bit A/D converter. The new CCD array detector enhances the measurement capability and may allow for new experimental data products like methane (CH4), bromine monoxide (BrO), and iodine monoxide (IO).Combined, these devices allow for wavelength calibration, a self-consistent determination of the viewing geometry, lunar occultation measurements and expanded wavelength coverage.
SAGE- III on ISS consists of two separate payloads—the Instrument Payload and the Nadir Viewing Platform. Combined, the SAGE-III payloads have a mass of 527 kg and a data rate of 2150 MB/day.
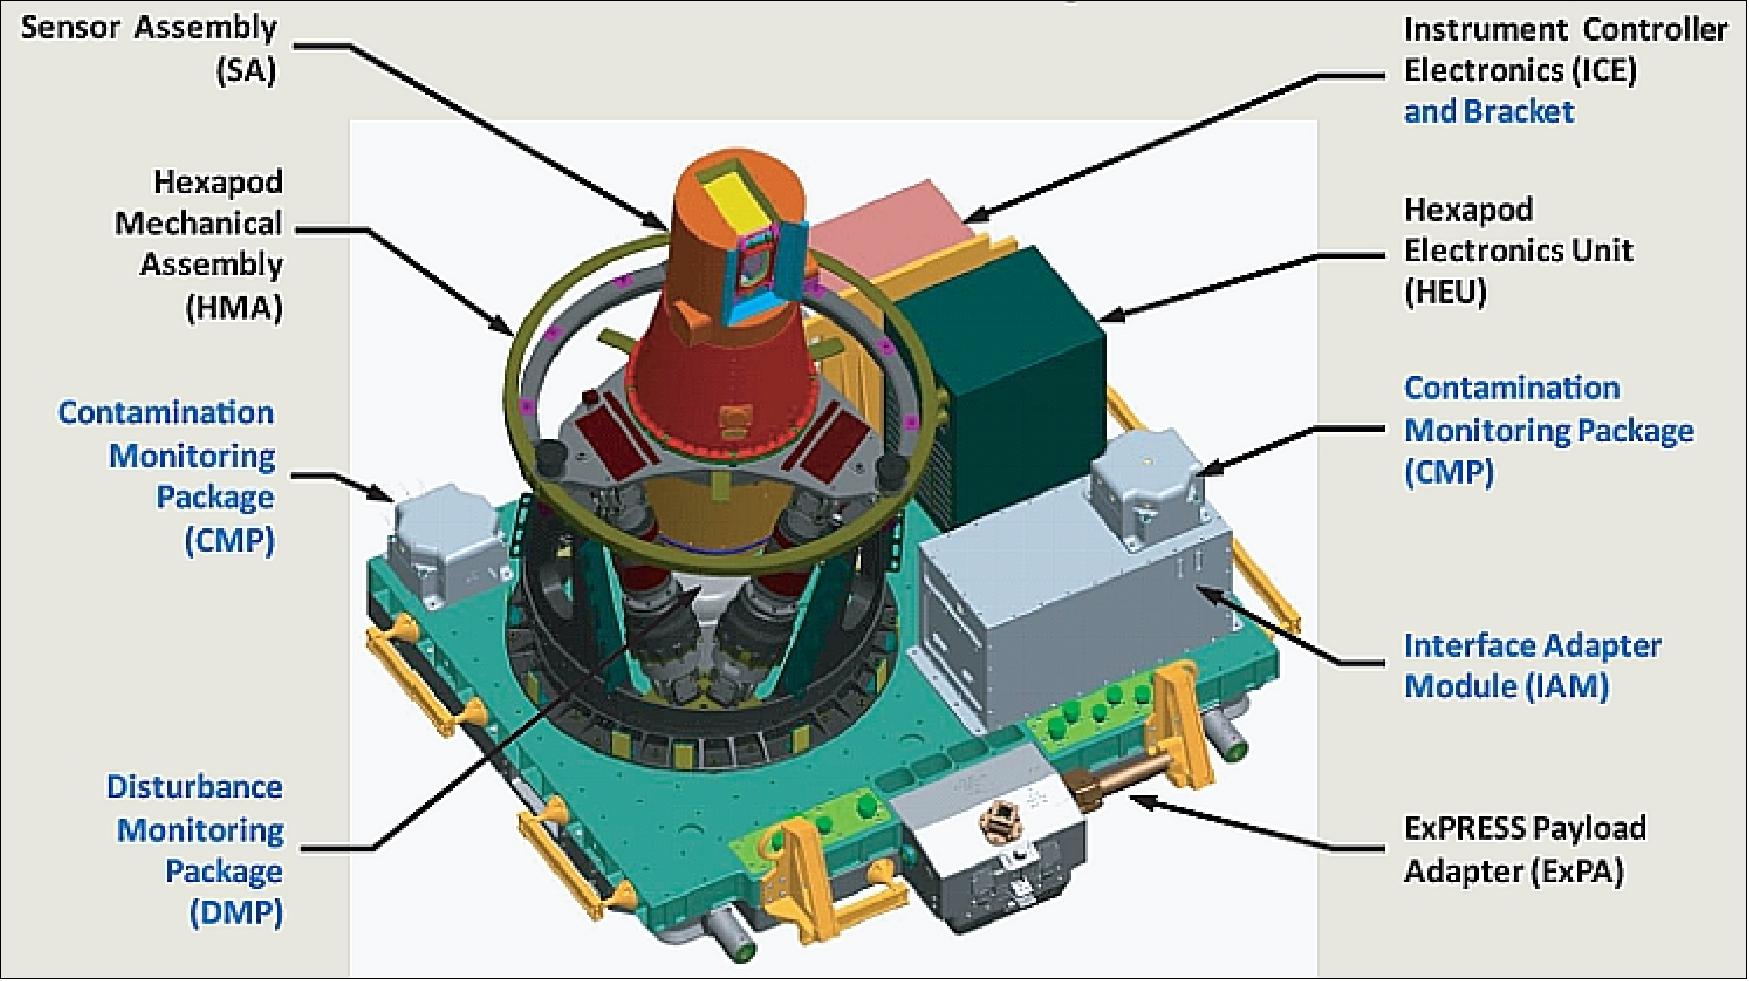
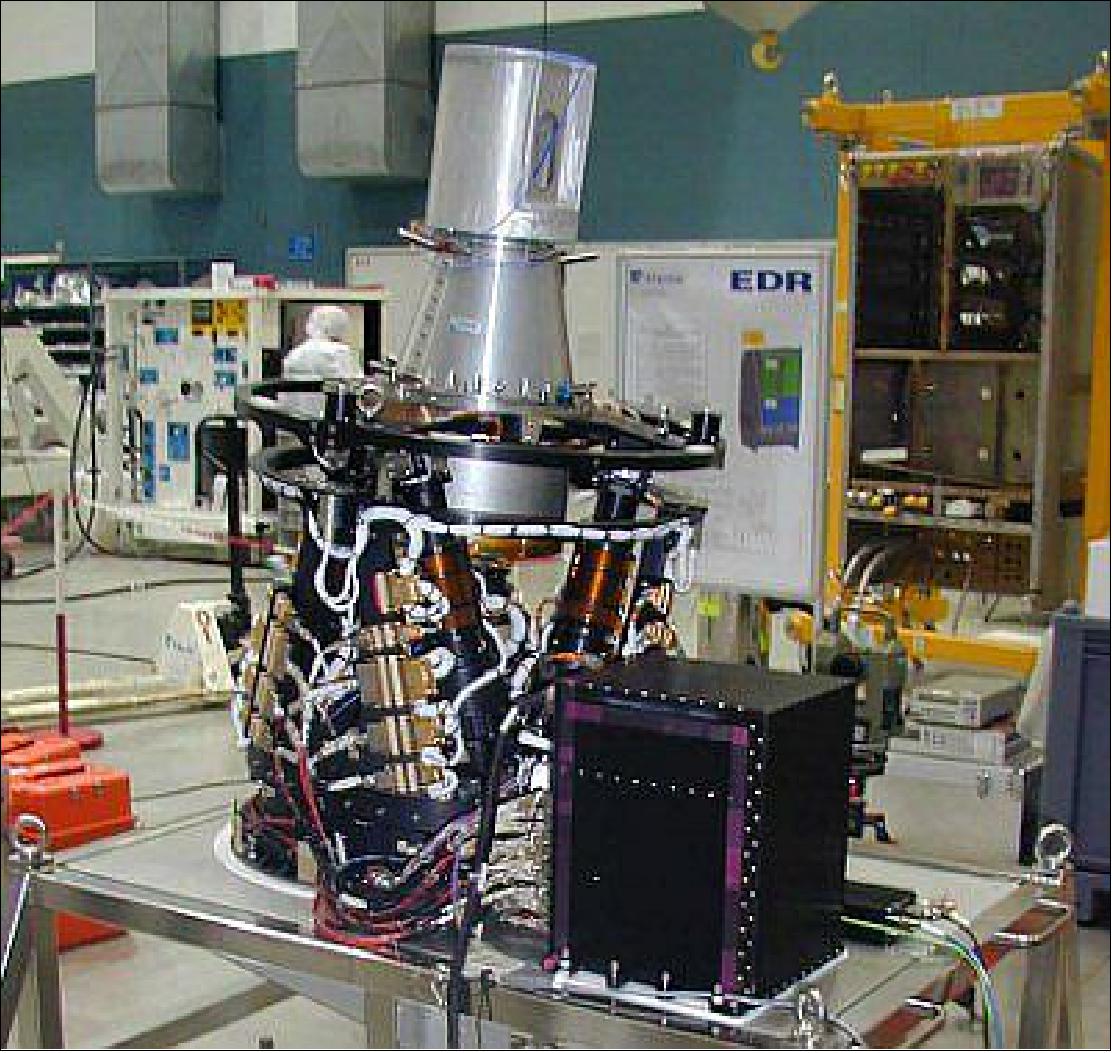
The Instrument Payload includes a SA (Sensor Assembly), IAM (Interface Adapter Module), a DMP (Disturbance Monitoring Package), the Hexapod Pointing System[HEU (Hexapod Electronics Unit and) HMA ( Hexapod Mechanical Assembly)], two CMP (Contamination Monitoring Packages), and the ICE (Instrument Control Electronics) box (Figure 18).
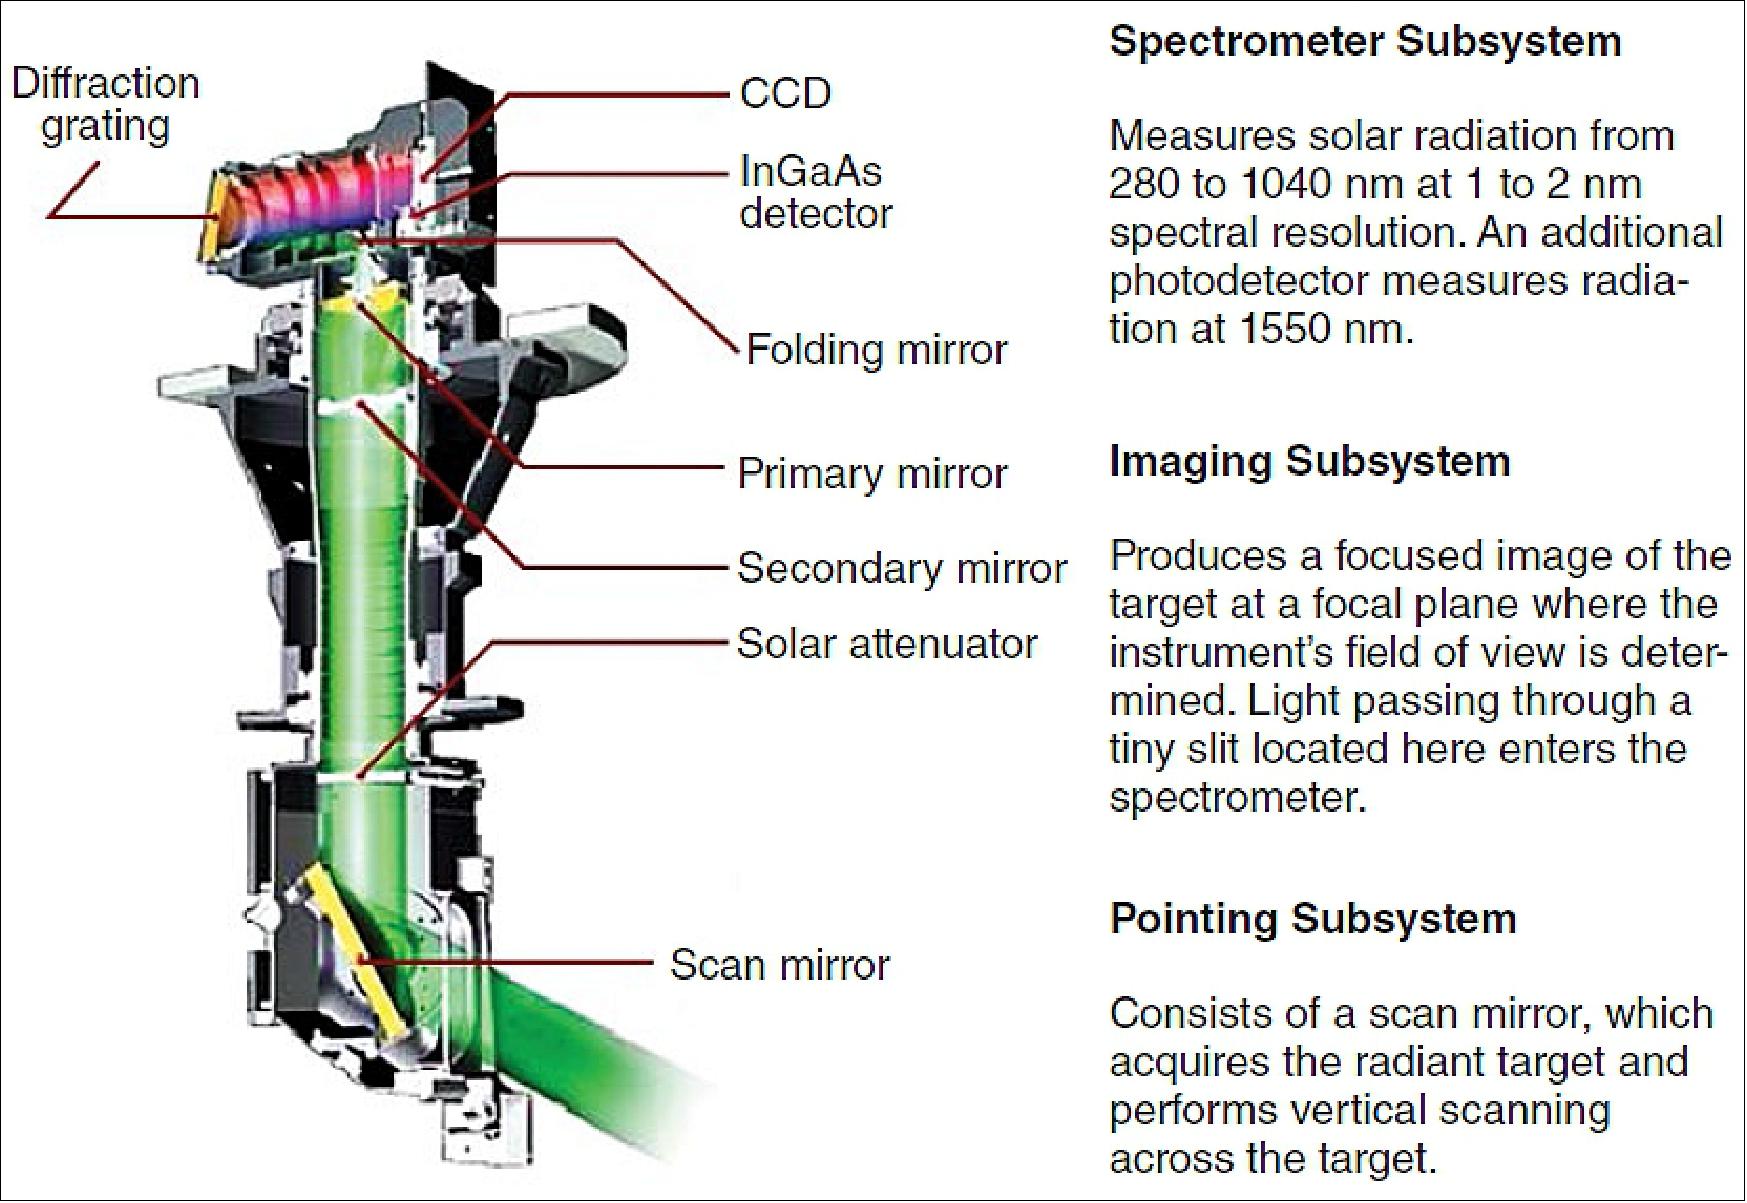
The SAGE-III SA (Sensor Assembly) — a grating spectrometer that measures ultraviolet (UV) and visible light and has a two-axis pointing system—consists of three subsystems: the scan head, imaging optics, and the spectrometer detector (Figure 19). These subsystems are employed to acquire light from either the sun or moon by vertically scanning across them. Once the instrument is powered on, light that is brought into the spectrometer by the telescope is broken up into UV, visible, and infrared wavelengths from 280 to 1040 nm by the grating spectrometer and sent to the CCD array. The measurements are made using a ratio: the amount of light passing through the atmosphere compared to the amount of light coming directly from the sun out-side the atmosphere. By measuring the amount of absorption of radiation at various heights throughout the atmosphere at different wavelengths, SAGE-III can infer the vertical profiles of O3, aerosols, water vapor, and NO2. Additional aerosol information is provided by a discrete photodiode at 1550 nm.
Several busy operations onboard the ISS can interfere with science observations, e.g., visiting instrument traffic and thruster operations. To avoid contamination from such operations, the Instrument Payload includes two CMP (Contamination Monitoring Packages) to monitor the environment surrounding the instrument. If the space station environment contains elevated contamination levels, a transparent contamination door will close to protect the instrument’s sensors while allowing measurements to continue.
The IAM (Interface Adapter Module) acts as the “brain” of the instrument payload, providing power and computing to the payload and acting as the interface between the instrument and the space station. The DMP (Disturbance Monitoring Package) is a miniature inertial measurement unit that will measure all small motions from space station operations. These measurements will be used to help identify and reduce noise in the instrument signal caused by the space station’s vibrations. The HPS (Hexapod Pointing System) supports the payload and keeps the instrument level with respect to Earth while in orbit (see next chapter on HPS).
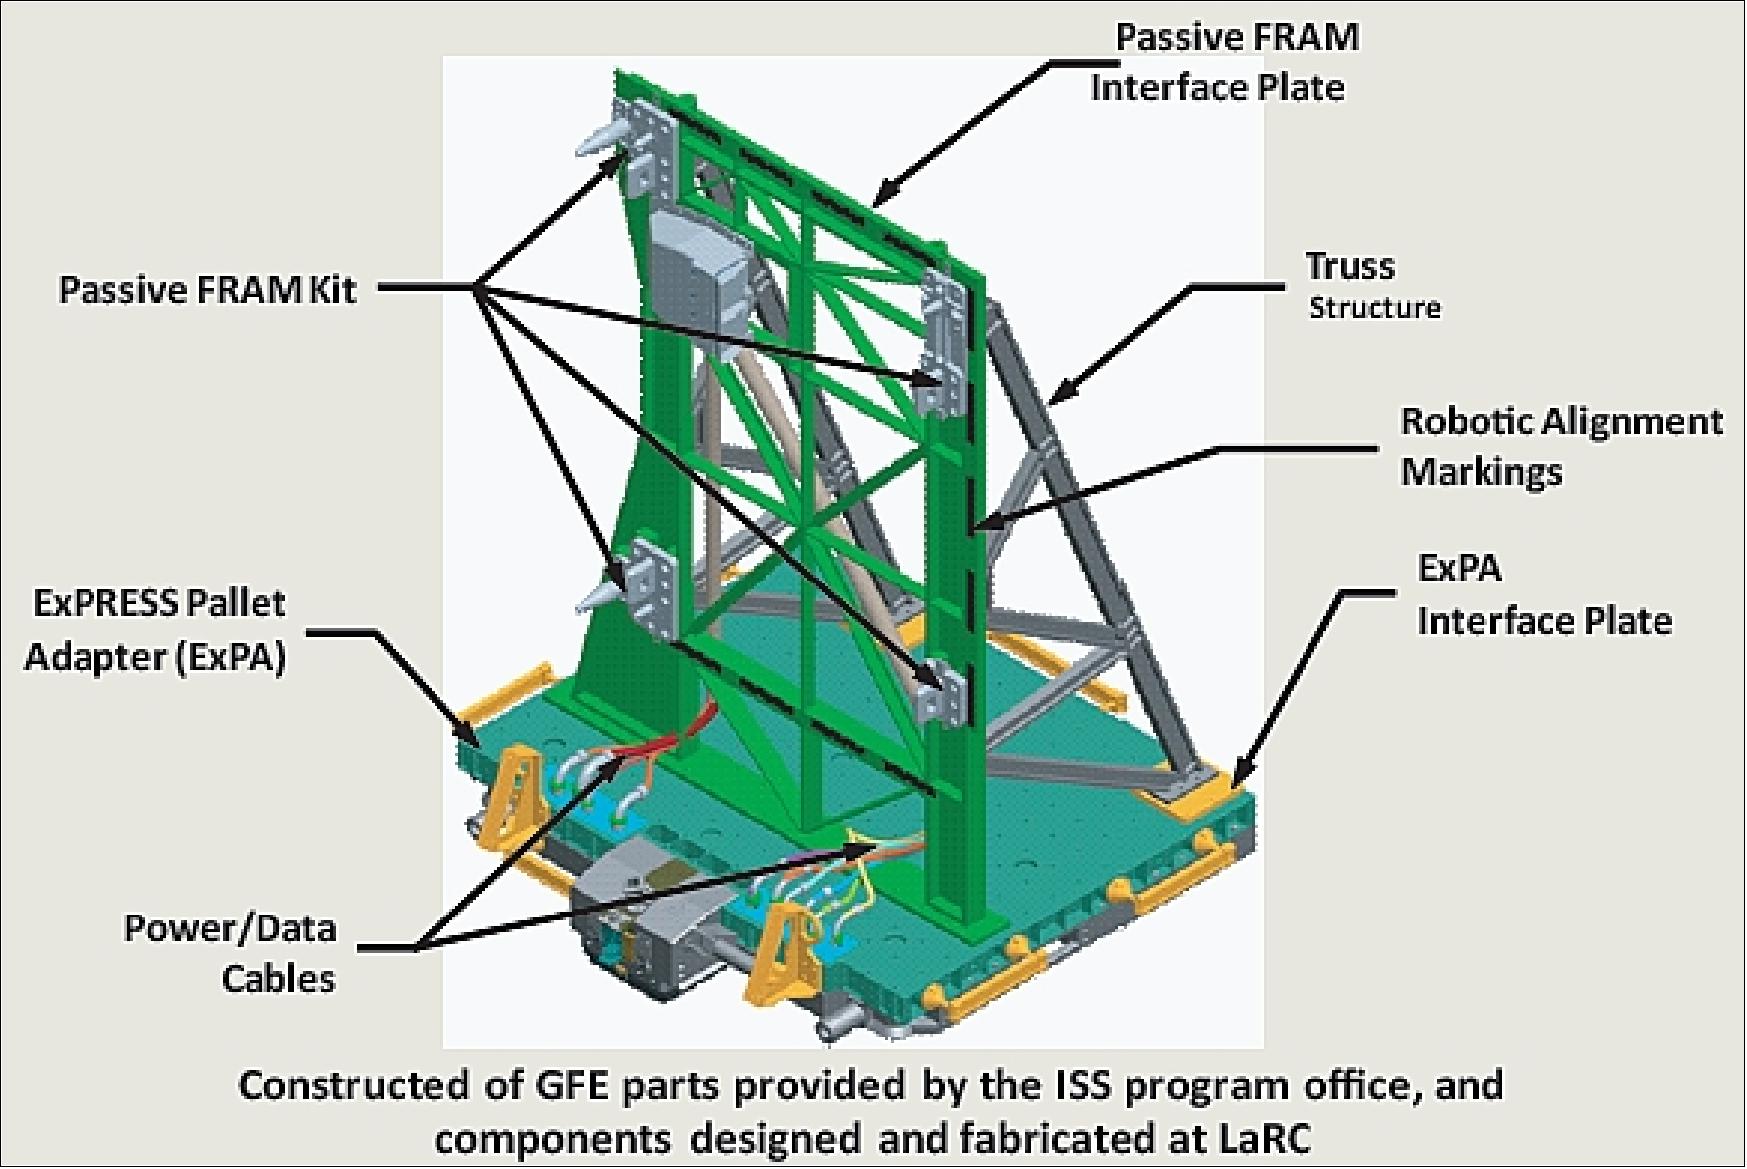
Nadir Viewing Platform: To orient SAGE-III facing nadir, or toward Earth, a special L-shaped mounting bracket called the Nadir Viewing Platform (Figure 20) was designed, built, and tested at LaRC. The Nadir Viewing Platform will attach to ELC-4 (ExPRESS Logistics Carrier-4)) onboard the station, perpendicular to the plane of the ELC, providing the nadir-orientation needed by the Instrument Payload. It replicates the standard ELC exposed-payload attachment. The ELC-4 will provide electrical power and command and data-handling services, and the Nadir Viewing Platform provides electrical power and data services to the SAGE-III instrument. Other space station-based payloads have already used the Nadir Viewing Platform’s design, turning a traditional ELC site into a nadir-oriented site.
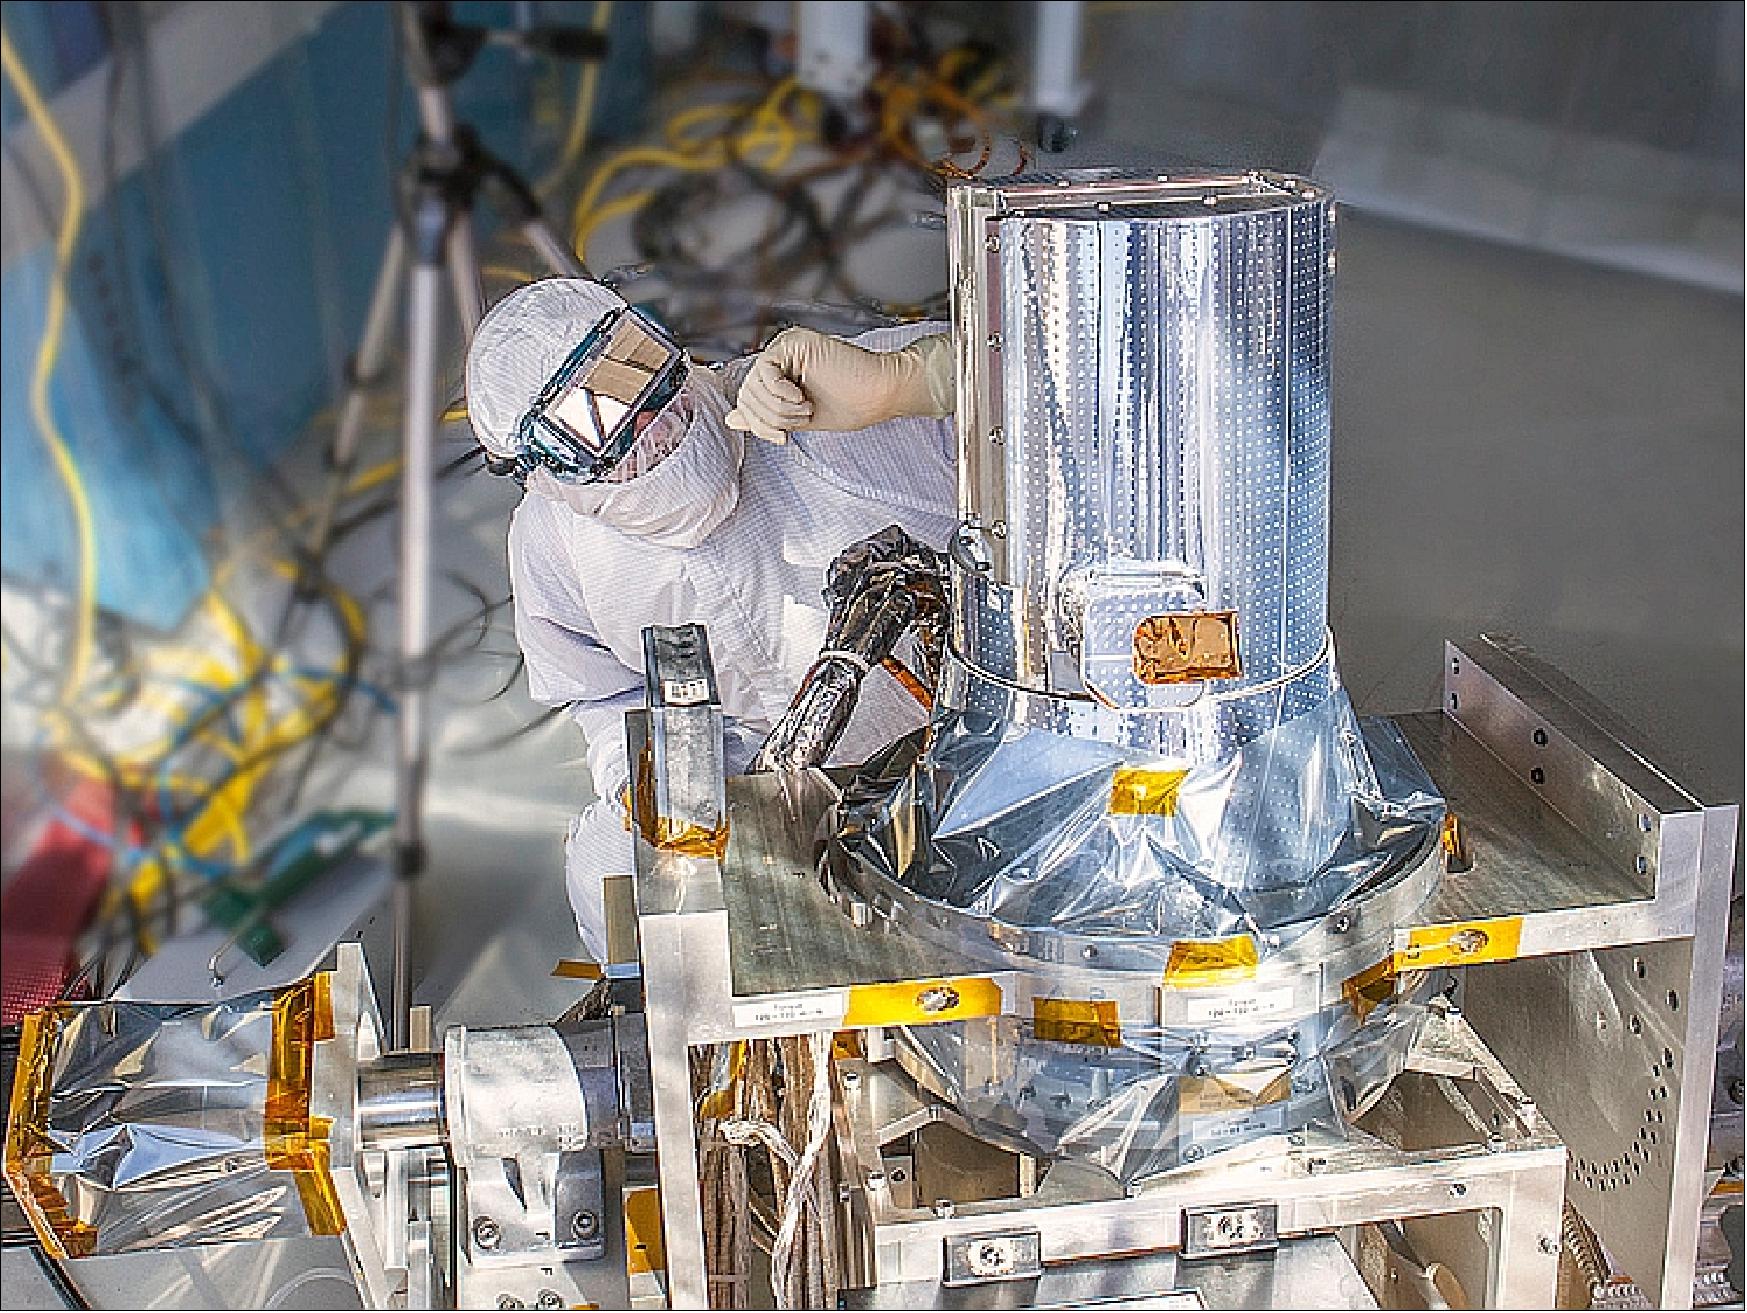
Legend to Figure 21: The SAGE-III instrument sun-look testing was successfully completed on March 4, 2013. The instrument pointed at and locked onto the sun and scanned to make a measurement. 25)
The SAGE-III event locations are modulated by the number of sunrise/sunset events experienced by the ISS in its inclined orbit plus some loss due to obscuration of the sun by the ISS platform and limitations to operations due to the presence of visiting spacecraft. Overall, the project expects to acquire 75% of the total events possible (~8000 solar events per year).
HPS (Hexapod Pointing System)
The ESA (European Space Agency) provided instrument HPS (Hexapod Pointing System) is intended to provide a stable nadir pointed platform to the NASA instrument SAGE-III. The Hexapod is one of the elements developed by ESA for NASA in return for ISS utilization rights prior to the launch of the ESA Columbus Laboratory.
Some background on the development of Hexapod 26)
In the framework of the Agreement for the Early Utilization of the International Space Station (ISS), ESA had negotiated with NASA to have early flight opportunities for European payload instruments prior to the launch of the Columbus Orbital Facility, in exchange for the delivery to NASA of a set of items that constitute the early European contributions for the utilization of the ISS. — One of these early European contributions was the Hexapod positioning/pointing system, which was being developed under the responsibility of ESA's Directorate of Manned Spaceflight and Microgravity to provide a pointing platform for the SAGE-III (Stratospheric Aerosol and Gas Experiment III) instrument of NASA. Hexapod and SAGE-III are designed to be accommodated on an ISS Express Pallet and have a five-year design lifetime.
The ISS-VIEW software tool has been developed to support the mission analysis and to define the observational windows for Hexapod/SAGE-III, but it can also be used for other instruments. For example, it also allows one to predict astronomical or Earth-target observing opportunities for Express Pallet payload instruments from their actual mounting locations on the Space Station Truss. In addition to the orbital and attitude parameters of the Station, ISS-VIEW is also able to take into account the field-of-view restrictions imposed by both the fixed and movable elements of the overall Space Station assembly.
Mounted on one of the lower Express Pallets of the ISS, and suitably aligned by Hexapod, SAGE-III will use the solar/lunar occultation technique to perform spectrometric measurements to monitor the global distribution of aerosol and gas constituents in the Earth's atmosphere. Sun- or moonlight will be collected via an aperture near the nadir end of the instrument. A scan mirror directs the collected light to a telescope, which focuses it at the entrance slit of a spectrometer. Light entering the spectrometer is reflected by a folded mirror to a spherical holographic grating, which disperses first-order light onto a CCD detector. The CCD will record eight different spectral channels of science data. A ninth data channel is provided by the zero-order light, appropriately filtered; in this case the detector is a photodiode.
Already in 1999, lifetime and lubrication tests had been used as guidelines for flight unit screws selection of Hexapod. The rationale for this test campaign was the lack of information on roller screw mechanism performances and lubrication behavior for vacuum exposed long mission, where no maintenance is foreseen. 27)
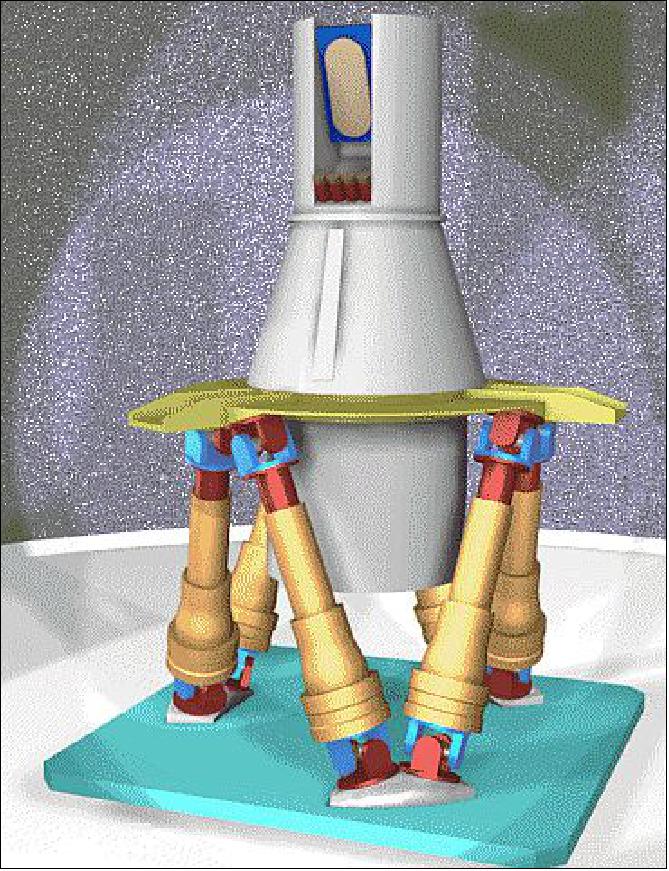
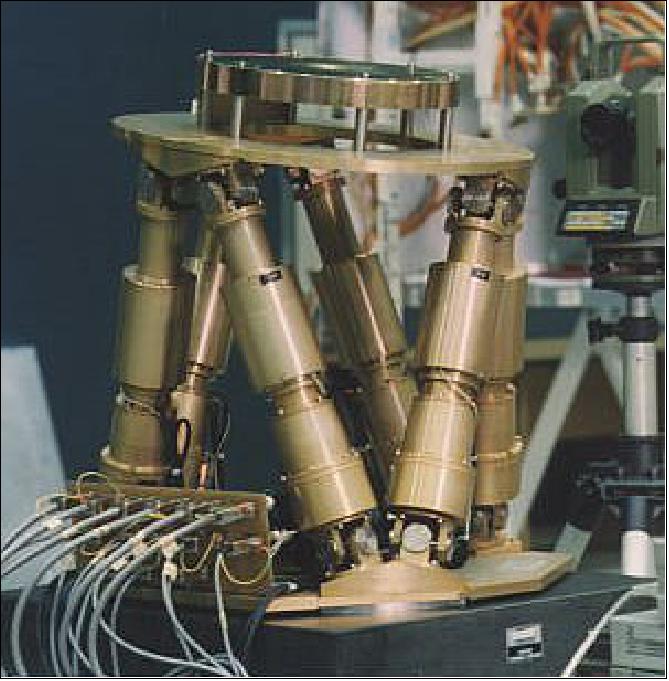
The HPS will be carried on one ExPA (Express Pallet Adapter) nadir oriented payload accommodation facility, located on the Integrated Truss Assembly of the ISS. The core of the HPS positioning/pointing mechanism is made by six electromechanical linear actuators disposed as three trapezoids between two reference planes, indicated as the lower and the upper platforms. The lower platform is fixed to the ExPA and the position and the attitude of the upper one is defined by the lengths of the six linear actuators.
The HPS includes an external off-loading device designed to partially support the launch loads, thus optimizing the actuators performances for on-orbit environment. The control and pointing function are powered and commanded by an electronic subsystem, the Hexapod Control Unit. The HPS is a project developed under an ESA contract, with the involvement of Alenia Aerospazio (as prime contractor) and Carlo Gavazzi Space, with the participation of ADS International and AEA/ESTL to these lifetime tests activity.
On November 25, 2005, the ESA Hexapod reached the end of its development phase with the completion of the Flight Acceptance Review at ESA/ESTEC. TAS-I (Thales Alenia Space-Italy), former Alenia Aerospazio, was responsible for the development, design, integration, and test of the Hexapod Pointing System. 28)
The Hexapod is a high accuracy pointing system, developed to support ISS external payloads. The flight unit of the Hexapod has a mass of 116 kg and consists of the HEU (Hexapod Electronic Unit) and the HMA (Hexapod Mechanical Assembly). The HEU handles power distribution, telemetry and telecommand management, data processing, and command and control. The HMA includes six linear actuators arranged as three trapezoids and connected to a bottom flange and an upper platform. Varying the lengths of the actuators provides the possibility to control the attitude and position of payloads attached to the upper platform in six degrees of freedom.
The HPS includes an external off-loading device designed to partially support the launch loads, thus optimizing the actuators performances for on-orbit environment. The control and pointing function are powered and commanded by an electronic subsystem, the Hexapod Control Unit.
ESA’s development of the Hexapod marks the upgrading of hexapod-based positioning/pointing systems for space applications. The Hexapod is designed for five years of in-orbit operation without maintenance, though users will be able to up-link Hexapod flight-software updates.
Ground System
The FMSC (Flight Mission Support Center) at NASA/LaRC, VA (Figure 26), together with the ISS Command and Control group at the MCC-H (Mission Control Center-Houston at NASA/JSC (Johnson Space Center) and the POIC (Payload Operations Integration Center) at NASA/MSFC (Marshall Space Flight Center) in Huntsville, AL, will command and operate the instrument, as well as manage and distribute the data. This includes oversight of the installation and instrument checkout, managing routine planning and command loads, data analysis, and resolution of any issues that may arise.
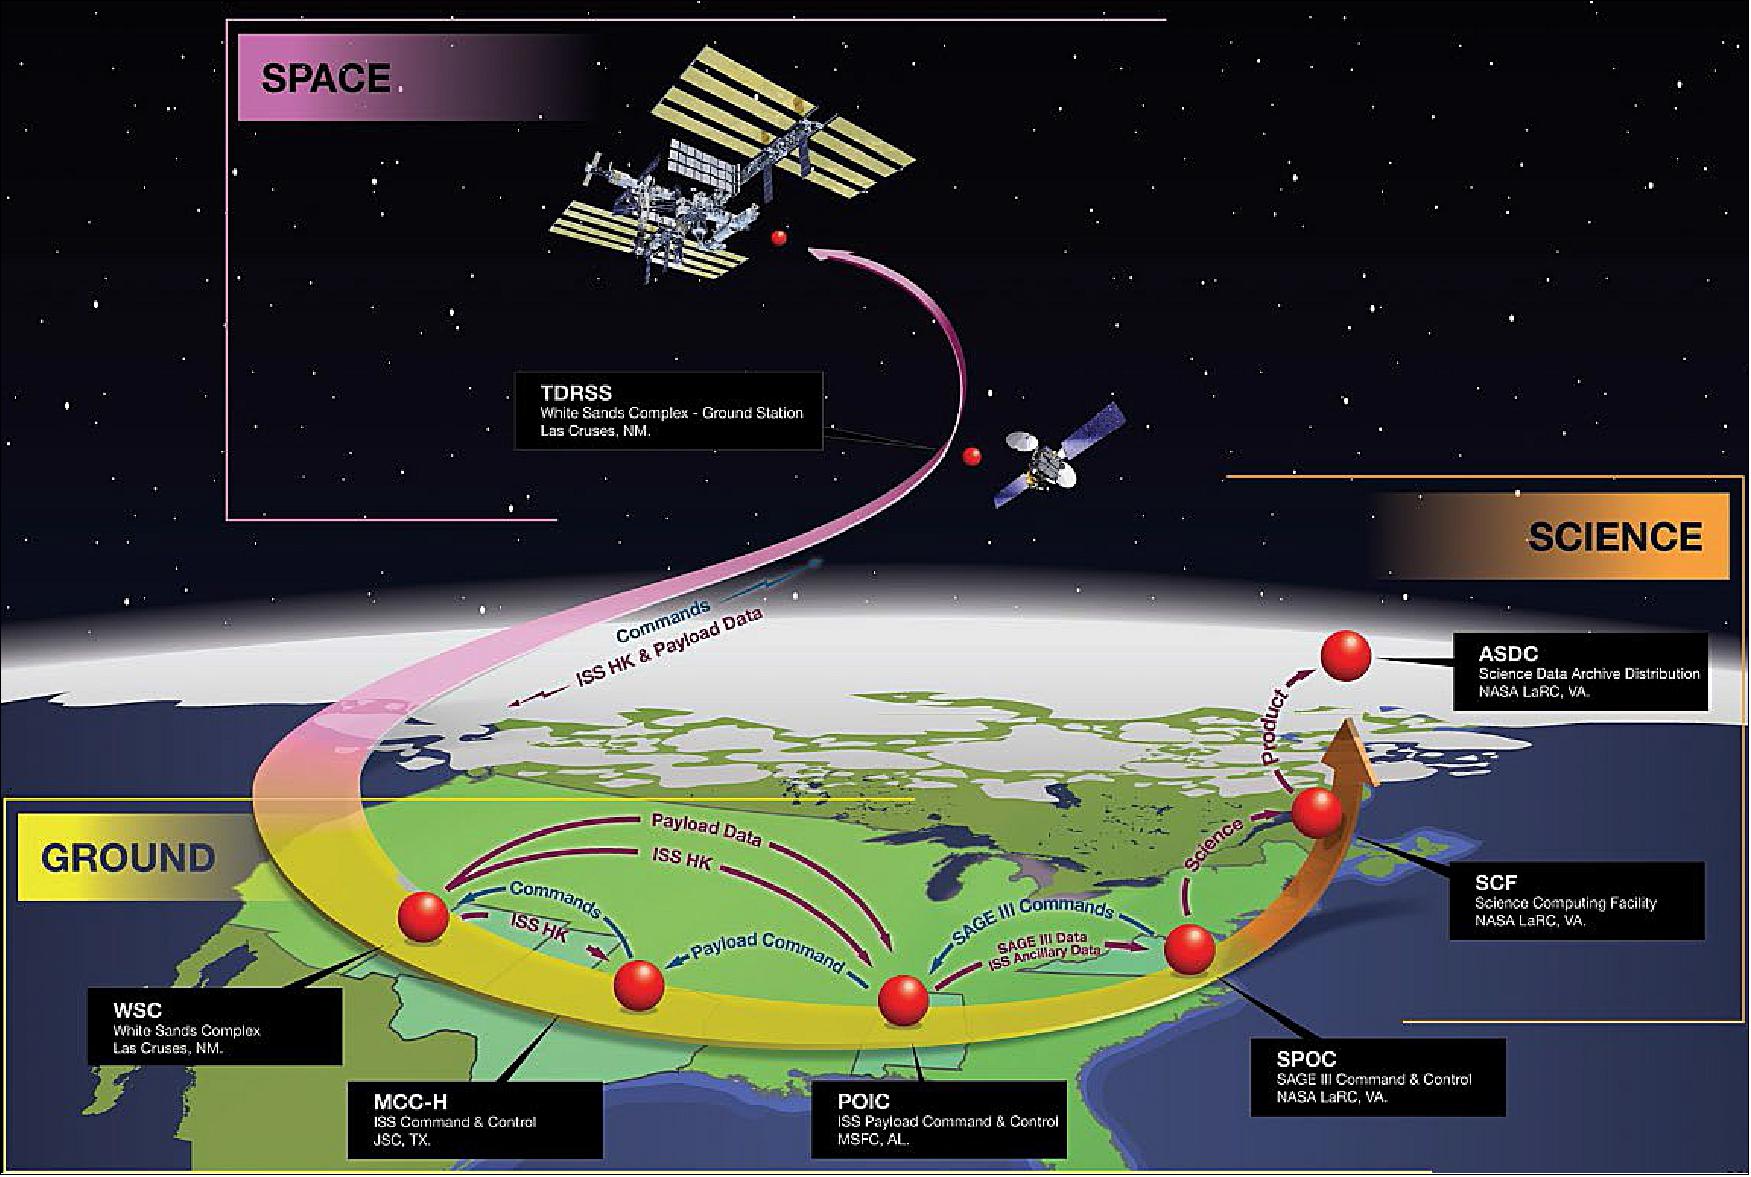
To communicate with SAGE-III on ISS, the SPOC (SAGE-III Payload Operations Center) at the FMSC will send software commands to NASA’s TDRSS (Tracking and Data Relay Satellite System). Once data are transmitted and collected, they will be processed at the SCF (Science Computing Facility) and released to the public directly through the ASDC (Atmospheric Science Data Center).
Measurements from SAGE-III on ISS will be validated as they have been during previous SAGE missions: Data from a number of independent instruments using a variety of techniques will be used to assess sensor biases and precision. Validation plans for SAGE-III on ISS include working with ongoing ground-based operations, including the Network for the Detection of Atmospheric Composition Change, spaceborne sensors, and balloon-based O3 measurements, including those from the Southern Hemisphere Additional Ozonesondes (SHADOZ) network.
Data will be freely available for download at https://eosweb.larc.nasa.gov/ . Table 4 lists the expected data products from the mission.
Product | Product Description | Measurement type | Vertical range (km) | Vertical resolution (km) | Precision |
1 | Level 1B transmissions | Solar | 0*-100 | 0.75 | 0.1%** |
2 | Level 2 Aerosol extinction coefficients | Solar | 0*-40 | 0.75 | 5% |
3 | Level 2 Aerosol optical depth | Solar | 0*-40 | 0.75 | 5% |
4 | Level 2 Ozone (O3) concentration | Solar | 0*-50 | 0.75 | 5% |
5 | Level 2 Water vapor (H2O) concentration | Solar | 5*-45 | 0.75 | 10% |
6 | Level 2 Nitrogen dioxide (NO2) concentration | Solar | TP,+2 - 45 | 0.75 | 10% |
7 | Level 2 Ozone (O3) concentration | Lunar | 15*-45 | 1.5 | 5% |
Legend to Table 4: *or cloud-top altitude, **defined at 600 nm, TP = altitude of the tropopause.
In addition to the production products, the project plans to explore some promising research products including for both solar events (BrO, CH4, and IO) and lunar (NO2, NO3, OClO) event types.
In summary, data from SAGE- III on ISS, coupled with model results, will allow scientists to monitor the health of the ozone layer and track the recovery of stratospheric O3 since ratification of the Montreal Protocol. By the 2020s, expectations are that O3 will recover to about half of the amount lost from pre-1980 levels. SAGE-III on ISS will also be valuable in assessing the performance of OMPS flying on the Suomi-NPP (National Polar-orbiting Partnership) satellite and planned for additional flights on the JPSS (Joint Polar Satellite System). In addition, data from SAGE-III on ISS will help to re-institute aerosol measurements crucial for more-accurate, long-term climate and O3 concentration and distribution models. Finally, if there are any new threats to the ozone layer, SAGE-III on ISS data will help the scientific community identify the cause and assess the threat.
After SAGE-III on ISS, a new generation of instruments will be needed to continue the long-term record of stratospheric O3 and aerosol concentrations.
References
1) http://sage.nasa.gov/SAGE3ISS/
2) David Flittner, J. Zawodny, M. Cisewski, D. MacDonnell, R. Moore, L. Thomason, “Overview of Stratospheric Aerosol and Gas Experiment (SAGE III) on the International Space Station,” AIAA Space 2010 Conference & Exposition: 'Future Earth Science Missions and Enabling Activities,' Aug. 30 to Sept. 2, 2010, Anahein CA, USA, URL: http://esto.nasa.gov/conferences/space2010/presentations/02_Flittner_SAGE_III.pdf
3) Tony Phillips, “Don't let this happen to your planet,” NASA Science News, March 29, 2013, URL: http://science.nasa.gov/science-news/science-at-nasa/2013/29mar_sage3/
4) “Space Station Bound SAGE III is Full Steam Ahead,” NASA, Feb. 22, 2013, URL: http://www.nasa.gov/mission_pages/station/research/news/sage_III.html
5) Heather Hansen, Kristyn Damadeo, ”SAGE-III on ISS: Continuing the Data Record,” The Earth Observer, November - December 2015. Volume 27, Issue 6, pp: 4-11, URL: http://eospso.nasa.gov/sites/default/files/eo_pdfs/Nov%20Dec%202015_508_col.pdf
6) Tomasz Nowakowski, ”SAGE III to Provide Highly Accurate Measurements of Atmospheric Gases,” Space Daily, Jan. 17, 2017, URL: http://www.spacedaily.com/reports/
SAGE_III_to_Provide_Highly_Accurate_Measurements_of_Atmospheric_Gases_999.html
7) Sam McDonald, ”SAGE III Leaves Langley for Journey to the International Space Station,” NASA/LaRC, Nov. 20, 2015, URL: http://fpd.larc.nasa.gov/sage-iii-leaves-langley-for-journey-to-iss.html
8) Michael Finneran, “European Space Agency Delivers Earth-observing Component to NASA,” NASA, Feb. 25, 2015, URL: http://www.nasa.gov/larc/
european-space-agency-delivers-earth-observing-component-to-nasa
9) Tabatha Thompson, Dan Huot, Stephanie Martin, ”NASA Cargo Headed to Space Station Includes Important Experiments, Equipment,” NASA, Feb. 19, 2017, Release 17-021 , URL: https://www.nasa.gov/press-release/
nasa-cargo-headed-to-space-station-includes-important-experiments-equipment
10) ”SpaceX CRS-10 Mission Overview,” NASA, URL: https://www.nasa.gov/sites/default/files/atoms/files/spacex_crs-10_mission_overview.pdf
11) Ken Kremer, ”NASA’s Historic Pad 39A Back in Business with Maiden SpaceX Falcon 9 Blastoff to ISS and Booster Landing,” Universe Today, Feb. 19, 2017, URL: http://www.universetoday.com/
133508/nasas-historic-pad-39a-back-business-maiden-spacex-falcon-9-blastoff-iss-booster-landing/
12) ”SpaceX CRS-10 Mission Overview,” NASA, URL: https://www.nasa.gov/sites/default/files/atoms/files/spacex_crs-10_mission_overview.pdf
13) Steven Volz, “NASA Earth Science Flight Program Overview,” Proceedings of JACIE 2014 (Joint Agency Commercial Imagery Evaluation) Workshop, Louisville, Kentucky, March 26-28, 2014, URL: https://calval.cr.usgs.gov/wordpress/wp-content/uploads/Volz_JACIE-Presentation.pdf
14) Allison McMahon, Joe Atkinson, ”Enhanced Stratospheric Aerosols from Fukutoku-Okanoba Eruption,” NASA Feature, 9 November 2021, URL: https://www.nasa.gov/feature/
langley/enhanced-stratospheric-aerosols-from-fukutoku-okanoba-eruption
15) Allison Leybold, Joe Atkinson, ”NASA’s SAGE III Instrument Observes Aerosol Spike from Australian Fires,” NASA Feature, 2 June 2020, URL: https://www.nasa.gov/feature/
langley/nasa-s-sage-iii-instrument-observes-aerosol-spike-from-australian-fires
16) ”Earth’s atmosphere: new results from the International Space Station,” ESA, 20 March 2018, URL: http://m.esa.int/Our_Activities/Human_Spaceflight/Research/
Earth_s_atmosphere_new_results_from_the_International_Space_Station
17) ”First SAGE III Atmospheric Data Released for Public Use,” NASA Release 17-24, 25 Oct. 2017, URL: https://www.nasa.gov/press-release/langley/first-sage-iii-atmospheric-data-released-for-public-use
18) Joe Atkinson, ”SAGE III Completes Commissioning, Begins Science Mission,” NASA, 7 Aug. 2017, URL: https://www.nasa.gov/feature/langley/sage-iii-completes-commissioning-begins-science-mission
19) Joe Atkinson,”SAGE III Achieves First Light from Space Station Perch,” NASA, March 17, 2017, URL: https://www.nasa.gov/feature/langley/sage-iii-achieves-first-light-from-space-station-perch
20) Joe Atkinson, ”SAGE III Installed on Its New Home on the International Space Station,” NASA, March 8, 2017, URL: https://www.nasa.gov/feature/langley/
sage-iii-installed-on-its-new-home-on-the-international-space-station
21) Joseph M. Zawodny, “Stratospheric Aerosol and Gas Experiment III-ISS (SAGE III-ISS),” NASA Fact Sheet, April 3, 2013, URL: http://www.nasa.gov/mission_pages/station/research/experiments/1004.html#description
22) “SAGE III - ISS,” NASA, URL: http://science.nasa.gov/missions/sage-3-iss/
23) Kristyn Damadeo, “The SAGE Legacy’s Next Chapter: SAGE III on the International Space Station,” The Earth Observer, NASA, Sept.-Oct. 2013, Vol. 25, Issue 5, pp: 4-8, URL: http://eospso.gsfc.nasa.gov
/sites/default/files/eo_pdfs/Sept_Oct_2013_508_color.pdf
24) Gloria Hernandez, Joseph M. Zawodny, Michael S. Cisewski, Brooke Thornton, Andrew Panetta, Marilee M. Roell, Marilee M. Roell, “On the Stratospheric Aerosol and Gas Experiment III on the International Space Station,” 2014, URL: http://ntrs.nasa.gov/archive/nasa/casi.ntrs.nasa.gov/20140003897.pdf
25) “Staring at the Sun with SAGE-III,” NASA/LaRC, March 8, 2013, URL: http://www.nasa.gov/multimedia/imagegallery/image_feature_2465.html
26) R. Stalio, P. Trampus, P. C. Galeone, R. Trucco, E. Anderson, K. Berens, “ISS-VIEW: A Software Tool for External Science Payloads Attached to the International Space Station,” URL: http://www.esa.int/esapub/bulletin/bullet91/b91stal.htm
27) Piero Pochettino, Marino Ballesio, Daniele Gallieni, Steve Gill, “Hexapod / SAGE-III roller screws lifetime and lubrication tests,” ESMATS (European Space mechanisms and Tribology Symposium)1999, Toulouse, France, URL: http://www.esmats.eu/esmatspapers/pastpapers/pdfs/1999/pochettini.pdf
28) Aldo Petrivelli, Dieter Isakeit, “Development of Hexapod reaches completion,” ESA, Dec. 5, 2005, URL: http://www.esa.int/About_Us/Business_with_ESA/Development_of_Hexapod_reaches_completion
The information compiled and edited in this article was provided by Herbert J. Kramer from his documentation of: ”Observation of the Earth and Its Environment: Survey of Missions and Sensors” (Springer Verlag) as well as many other sources after the publication of the 4th edition in 2002. - Comments and corrections to this article are always welcome for further updates (eoportal@symbios.space).
Launch Mission status Instrument HexaPod Ground Segment References Back to Top