GRACE-FO (Gravity Recovery And Climate Experiment - Follow-On)
EO
NASA
Gravity and Magnetic Fields
Gravity, Magnetic and Geodynamic measurements
Gravity Recovery and Climate Experiment - Follow On (GRACE-FO) is the successor to the original Gravity Recovery and Climate Experiment (GRACE) mission. The two identical satellites, a joint mission of NASA and the German Aerospace Centre (DLR) were launched from California, USA, in May 2018. GRACE-FO maintains data continuity for measuring changes in high-resolution monthly global models of Earth’s gravitational field, achieved by tracking water movement and surface mass changes across the planet. GRACE-FO applications include monitoring water storage, ice sheets and glaciers, sea level, and solid earth, similar to that of its predecessor, GRACE.
Quick facts
Overview
| Mission type | EO |
| Agency | NASA, GFZ |
| Mission status | Operational (nominal) |
| Launch date | 22 May 2018 |
| Measurement domain | Gravity and Magnetic Fields |
| Measurement category | Gravity, Magnetic and Geodynamic measurements |
| Measurement detailed | Gravity field |
| Instruments | MWI, LRI |
| Instrument type | Gravity instruments |
| CEOS EO Handbook | See GRACE-FO (Gravity Recovery And Climate Experiment - Follow-On) summary |
Summary
Mission Capabilities
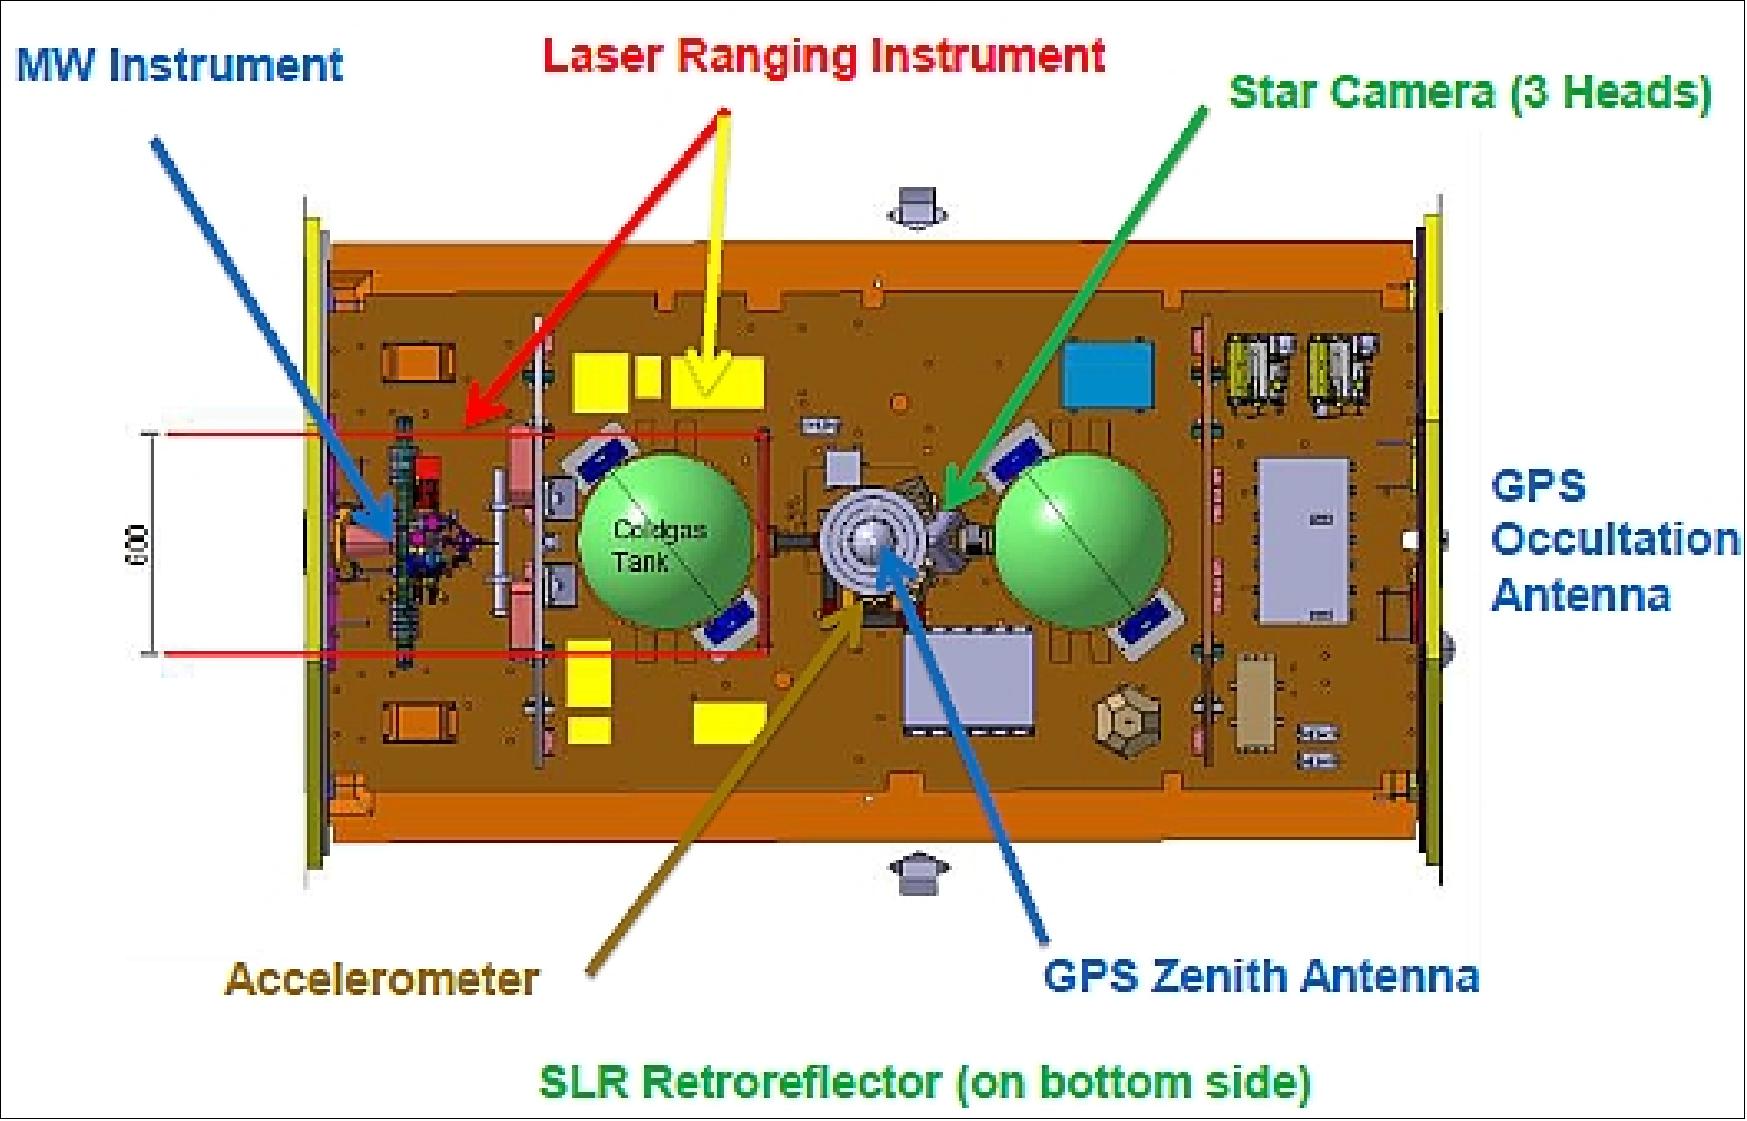
GRACE-FO carries six instruments, K/Ka-Band Ranging (KBR), Laser Ranging Interferometer (LRI), Accelerometer (ACC), Star Camera Assembly (SCA) and Tri-GNSS (GPS+Galileo+GLONASS), as well as Radio Occultation receiver (TriG-RO).
KBR, also referred to as Microwave Instrument (MWI), is a heritage instrument of the GRACE mission and provides precise Satellite to Satellite Tracking (SST) in low-low orbit. LRI measures the same range fluctuations as KBR but with reduced noise and provides accurate measurements of the relative pointing of the two satellites. ACC provides better thermal stability and characterisation. TriG provides Precise Orbit Determination (POD), Global Navigation Satellite System (GNSS) Radio Occultation, neutral atmosphere, ionosphere and scintillation and GNSS reflections.
Performance Specifications
The two GRACE-FO satellites are in a circular co-planar polar orbit at an altitude of about 490 km spaced 220 km apart. The inclination is approximately 89° and eccentricity is less than 0.0025 with a repeat cycle of 30 days. Each GRACE-FO satellite creates up to 200 temperature distribution profiles and water vapour content in the atmosphere and ionosphere.
Space and Hardware Components
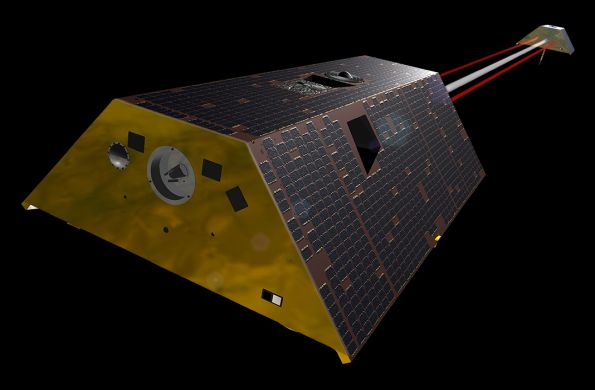
GRACE-FO instruments are accommodated in the third generation Flexbus platform developed by Astrium. Each GRACE-FO satellite measures approximately 3 m x 2 m x 0.8 m and has a mass of around 580 kg.
GRACE-FO (Gravity Recovery And Climate Experiment - Follow-On) / GFO (GRACE Follow-On)
The GRACE-FO (a.k.a. GFO) mission is heavily focused on maintaining data continuity from GRACE and minimizing any data gap after GRACE. Since 2009, the GRACE Follow-On mission is under definition/negotiation by the US-German GRACE consortium (NASA/JPL, CSR/UTexas, DLR, GFZ Helmholtz Center Potsdam). Many studies have been conducted on national and international levels by agencies, academia, institutions, and by industry to investigate new observation techniques fora long term strategy of observing the gravity field from space. 1) 2) 3)
The GRACE-FO project will be executed in the US under the direction of the NASA Earth Science Division (ESD) within the NASA Science Mission Directorate (SMD) and the Earth Systematic Missions Program Office at GSFC (Goddard Space Flight Center). JPL (Jet Propulsion Laboratory) is assigned responsibility for the GRACE-FO project.
The GRACE-FO mission has significant German participation managed by the German Research Center for Geosciences (GFZ). Funding of the German contributions is jointly secured by the Federal Ministry of Education and Research (BMBF), the Federal Ministry for Economic Affairs and Energy (BMWi), the Helmholtz Association (HGF), the German Aerospace Center (DLR) (LRI in kind contributions) and the German Research Center for Geosciences). The GRACE-FO mission will be operated by DLR/GSOC.
In the fall of 2012, after more than 10 years of very successful operation in orbit, the US-German GRACE-1 mission has demonstrated in a very impressive way its outstanding capability to monitor mass motions in the Earth system with unprecedented accuracy and temporal resolution. These results have stimulated many novel research activities in hydrology, oceanography, glaciology, geophysics and geodesy, which also indicate that long-term monitoring of such mass motions, possibly with improved spatial and temporal resolution, is a must for further understanding of various phenomena.
GRACE-1 gave many breakthroughs in the understanding of (Ref. 9):
- Changes in the terrestrial water cycle
- Melting and growing of glaciers and ice sheets
- sea level rise and its causes (ice melt, thermal expansion)
- solid Earth (past glaciation, large Earthquakes)
GRACE-FO mission objectives:
- The primary objective is to continue the high-resolution monthly global models of Earth's gravity field of the GRACE-1 mission for an expected length of 5 years.
- The secondary objectives are:
- demonstrate the effectiveness of a LRI (Laser Ranging Interferometer) in improving the low-low SST (Satellite-to-Satellite Tracking) measurement performance.
- continue measurements of GRACE radio occultations for operational provision of e.g. vertical temperature/humidity profiles to weather services
Satellite gravimetry
Satellite gravimetry, that is, measuring spatial and temporal change in the gravity field caused by mass variations from space, provides a unique opportunity to advance mass transport studies and improve our understanding of the Earth system. From the GRACE mission, new fundamental insights into the changing mass distribution have been achieved in the first decade of the 21st century. The results from the GRACE mission have actually revolutionized the field of Earth system research and have established the necessity for future satellite gravity missions. 4)
The large-scale mass distribution in the Earth system is continuously changing. Most of the mass transport is associated with well-monitored atmospheric variability, and with the global water cycle. Through this cycle, the ocean, atmosphere, land, and cryosphere storages of water interact through temporally and spatially variable water mass exchanges. The distribution of water mass in these reservoirs changes at timescales ranging from sub-daily to inter-annual, and decadal, and is strongly related to long-term global change, including sea-level rise, loss of land ice, and extensive droughts and floods. These mass variations may indicate a change in the forcing or the feedback mechanisms that moderate the climate. Water mass variations may therefore be considered a proxy for ongoing climate variations driven by natural and/or anthropogenic causes, which has the potential for impacting society very strongly (Ref. 4).
Gravity is determined by mass. By measuring gravity, GRACE shows how mass is distributed around the planet and how it varies over time. Data from the GRACE satellites is an important tool for studying Earth's ocean, geology, and climate. Mass variations are caused either by redistribution of mass in, on or above the Earth's surface or by geophysical processes in the Earth's interior. The first set of observations of monthly variations of the Earth gravity field was provided by the GRACE-1 twin-satellite mission beginning in March 2002. In 2015, this mission is still providing valuable information to the science community. 5)
Mapping the global gravity field:
- Static and dynamic components
- Many applications in geosciences
Techniques:
- Orbit determination and tracking
- SST (Satellite-to-Satellite Tracking)
Recent gravity field satellites:
- CHAMP
- GRACE
- GOCE
- GRAIL (lunar gravity)
In the framework of a cooperation on future EO technologies and missions, NASA and ESA established an Interagency Gravity Science Working Group of experts tasked to define the overall objectives and the observation requirements for a future constellation with better performance than that of a concept elaborated by a single agency – in fact, a performance better than "the sum of the parts" when these were not jointly defined. 6)
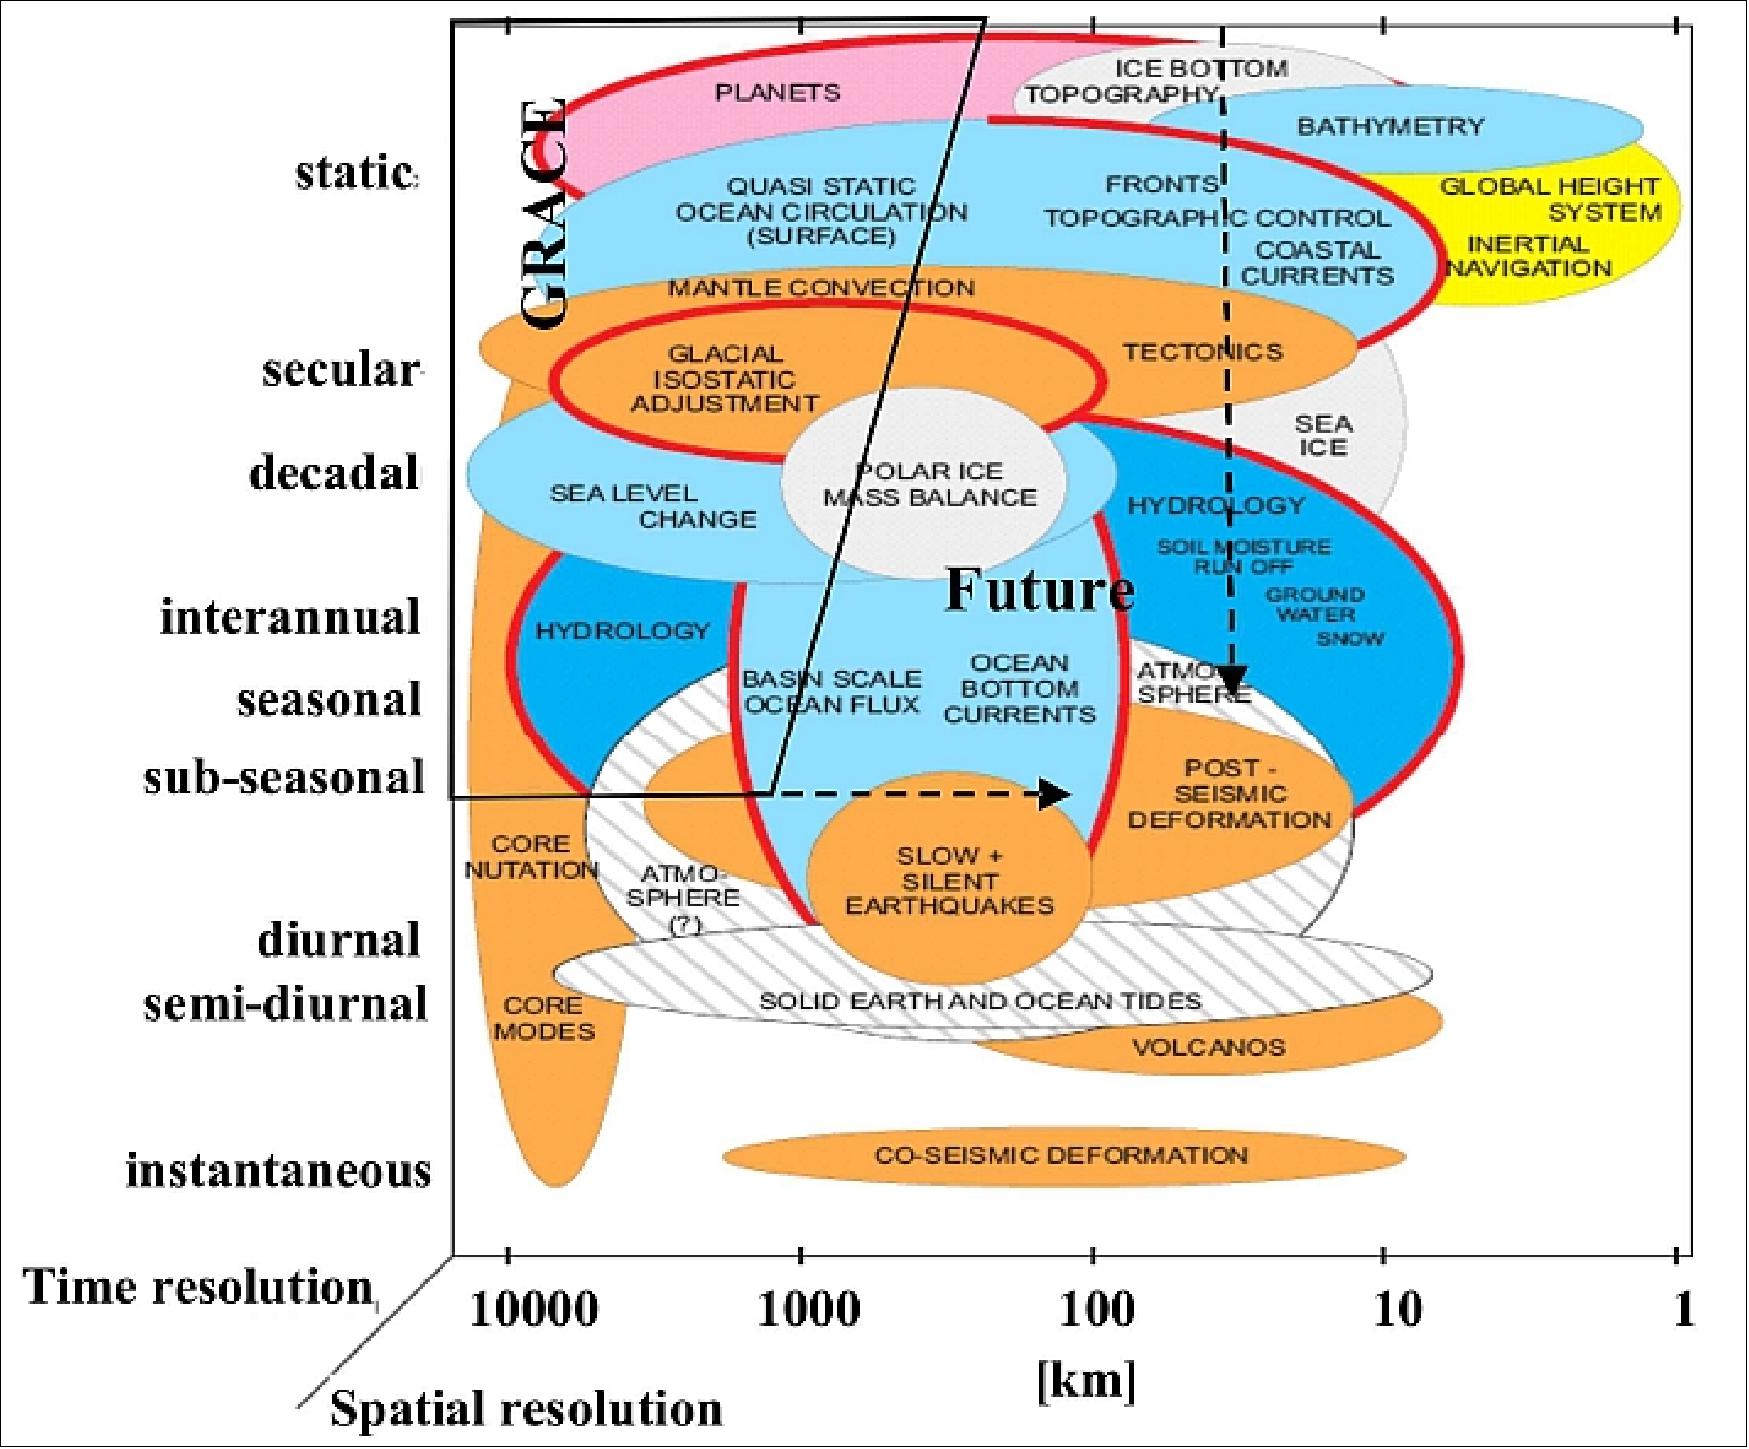
Figure 1 outlines the expected performance (in terms of spatial and temporal resolution) of a next generation gravity constellation, with two cases (three and ten day solutions) separately considered, and also indicates the performance of GRACE and GOCE as a reference. For geophysical signals the targeted geoid height accuracy of 1 mm at scales of 500 km and 150 km, respectively, will give (compared to GRACE) increased temporal and spatial performance and so allow resolving various geophysical processes in far more detail.
Studies have been performed in order to find the constellations of two satellite pairs equipped with laser-based distance metrology (of similar but not necessarily equal performance) capable to deliver the best scientific return. This was supported by closed-loop simulations, with realistic inputs from system design aspects. Constellation candidates have been found, with orbits at different inclinations that optimise the return for the different applications whilst "absorbing" in their gravity solutions most of the disturbing effects of daily and subdaily phenomena with a dedicated parameterisation. This would remove the need for de-aliasing based upon external models, as is current practice for GRACE data analysis, and almost entirely remove the "striping" or "striations" seen in single-pair gravity field solutions.
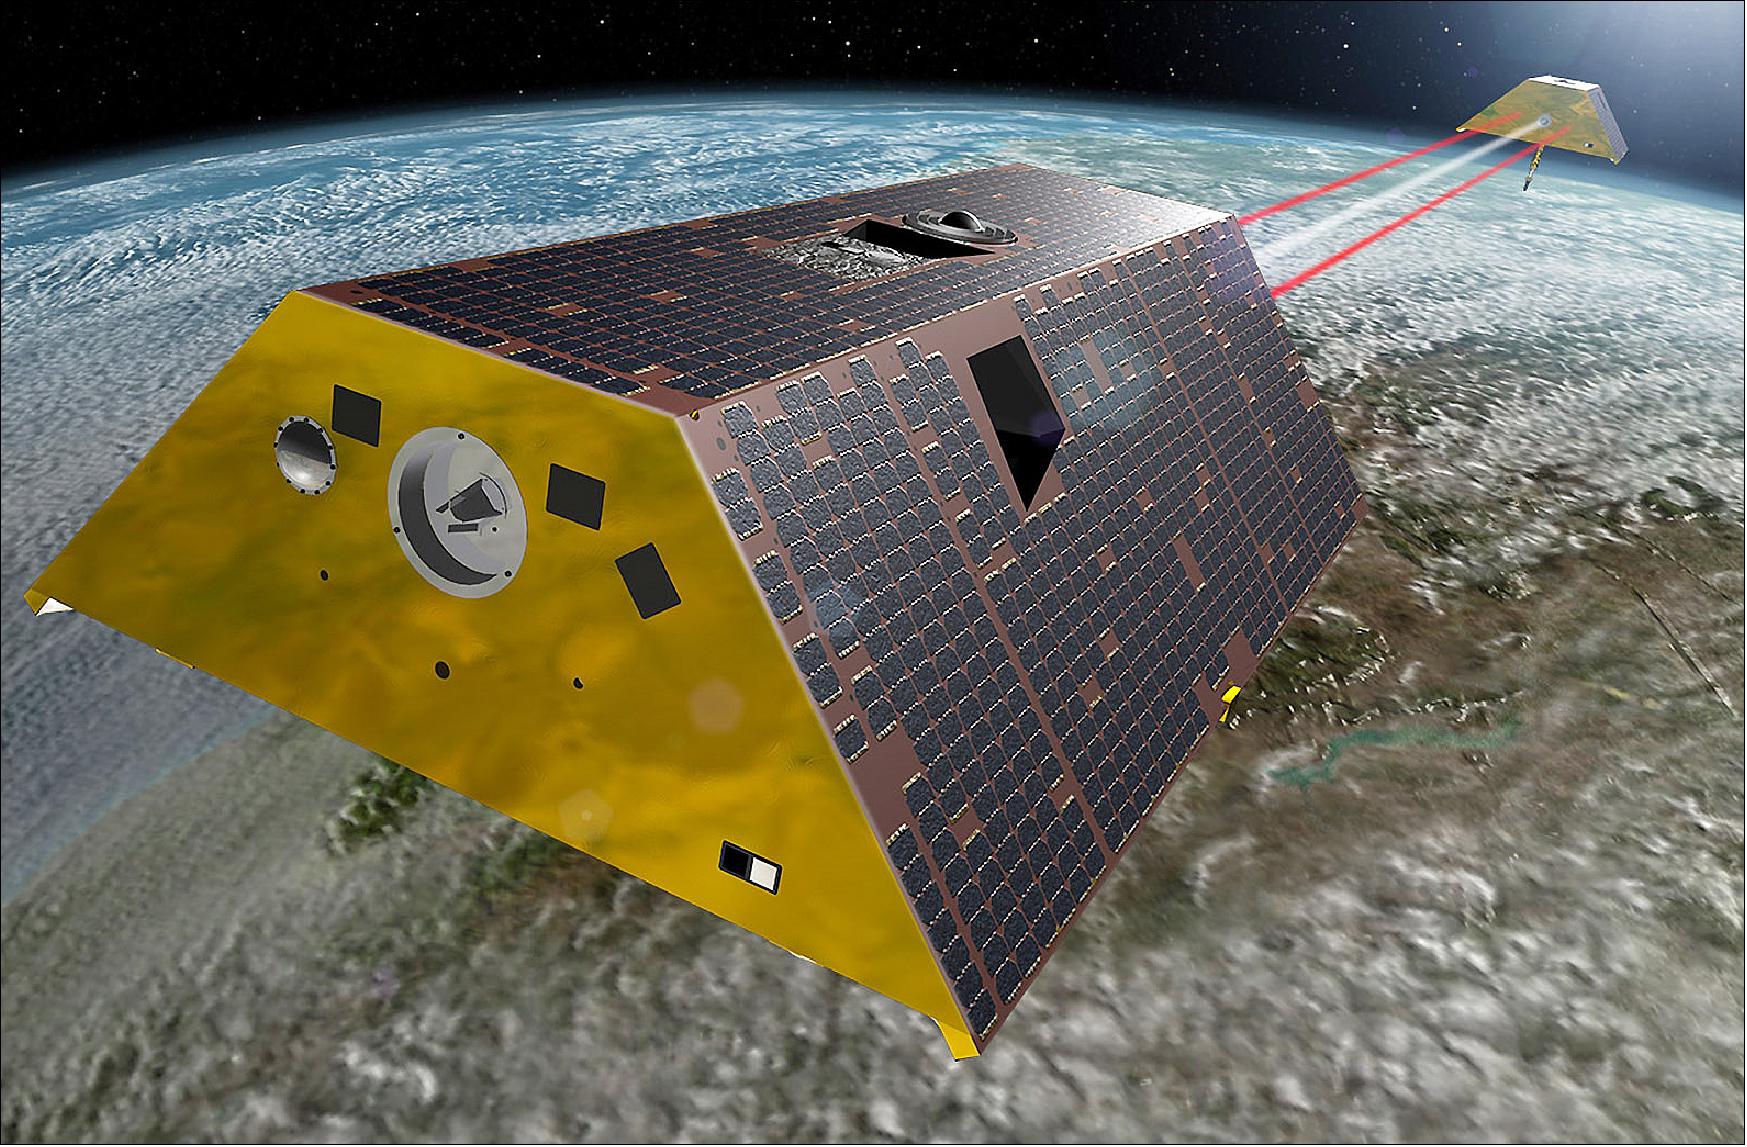
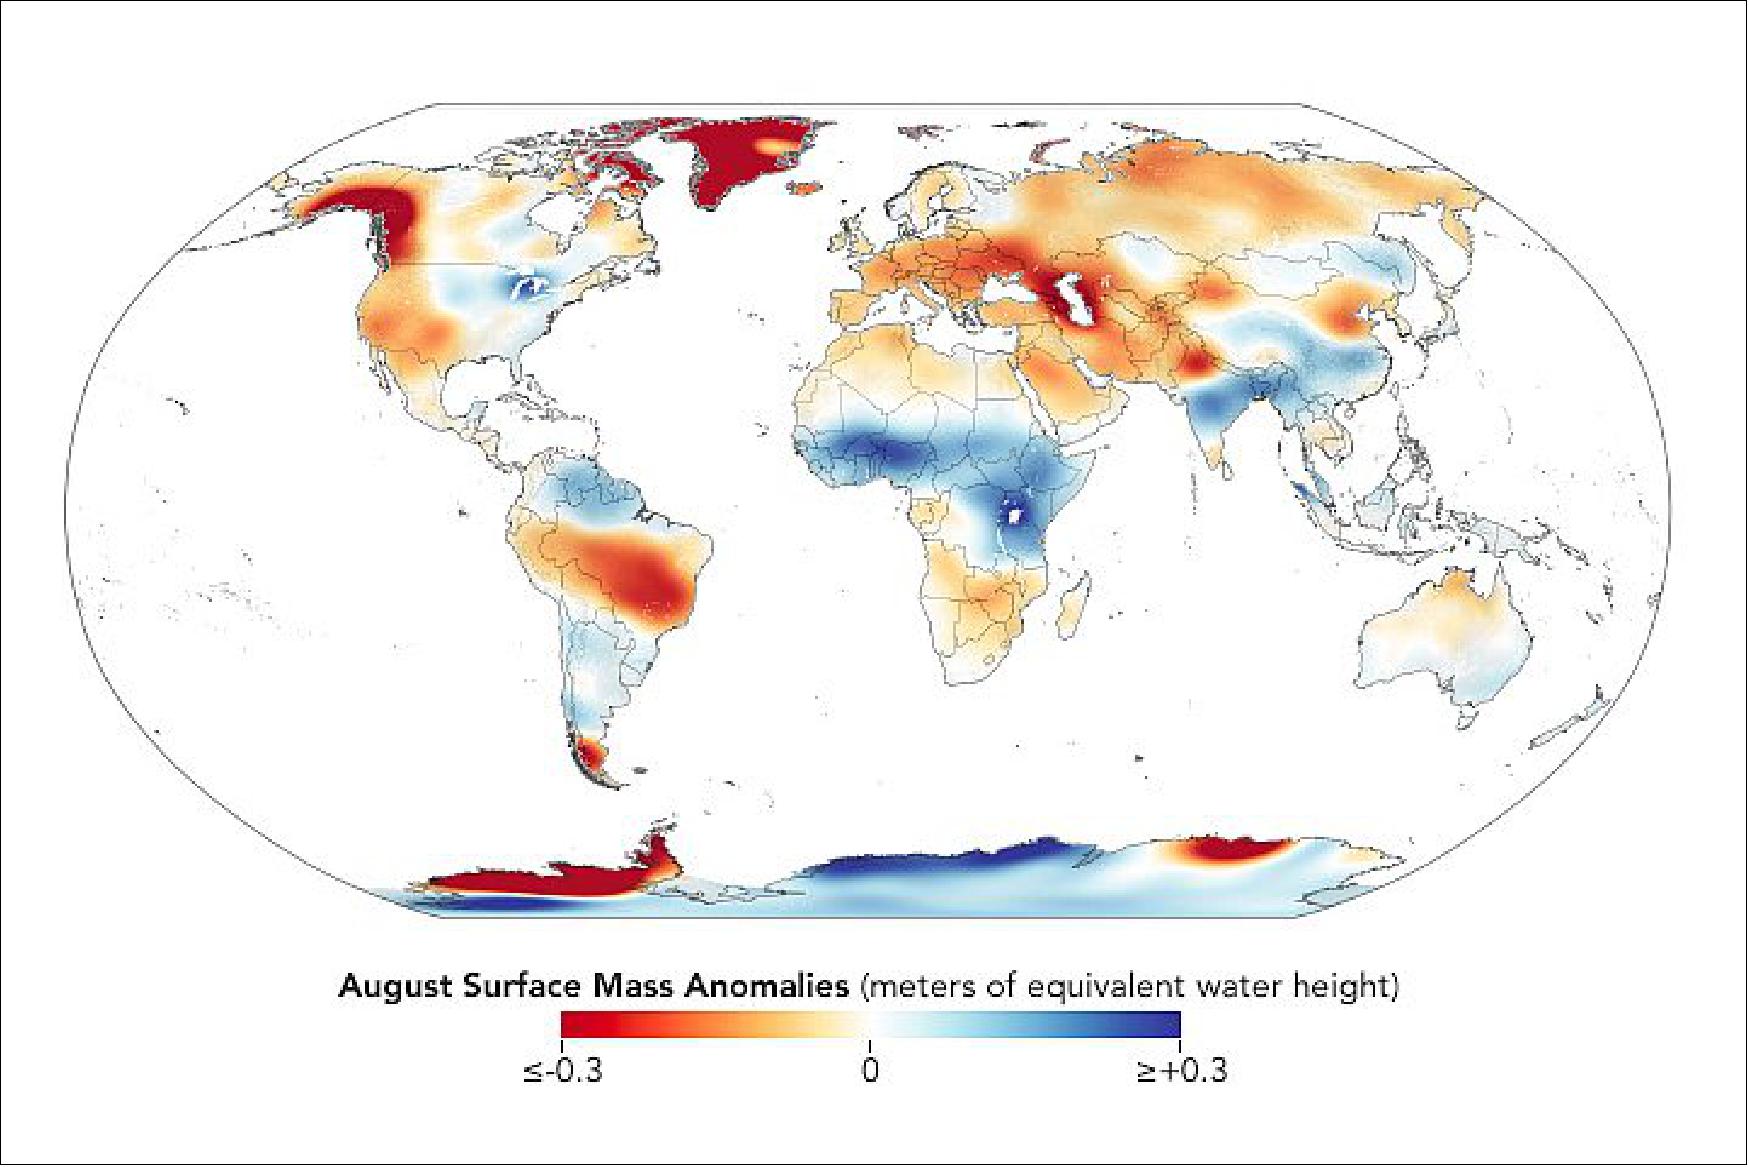
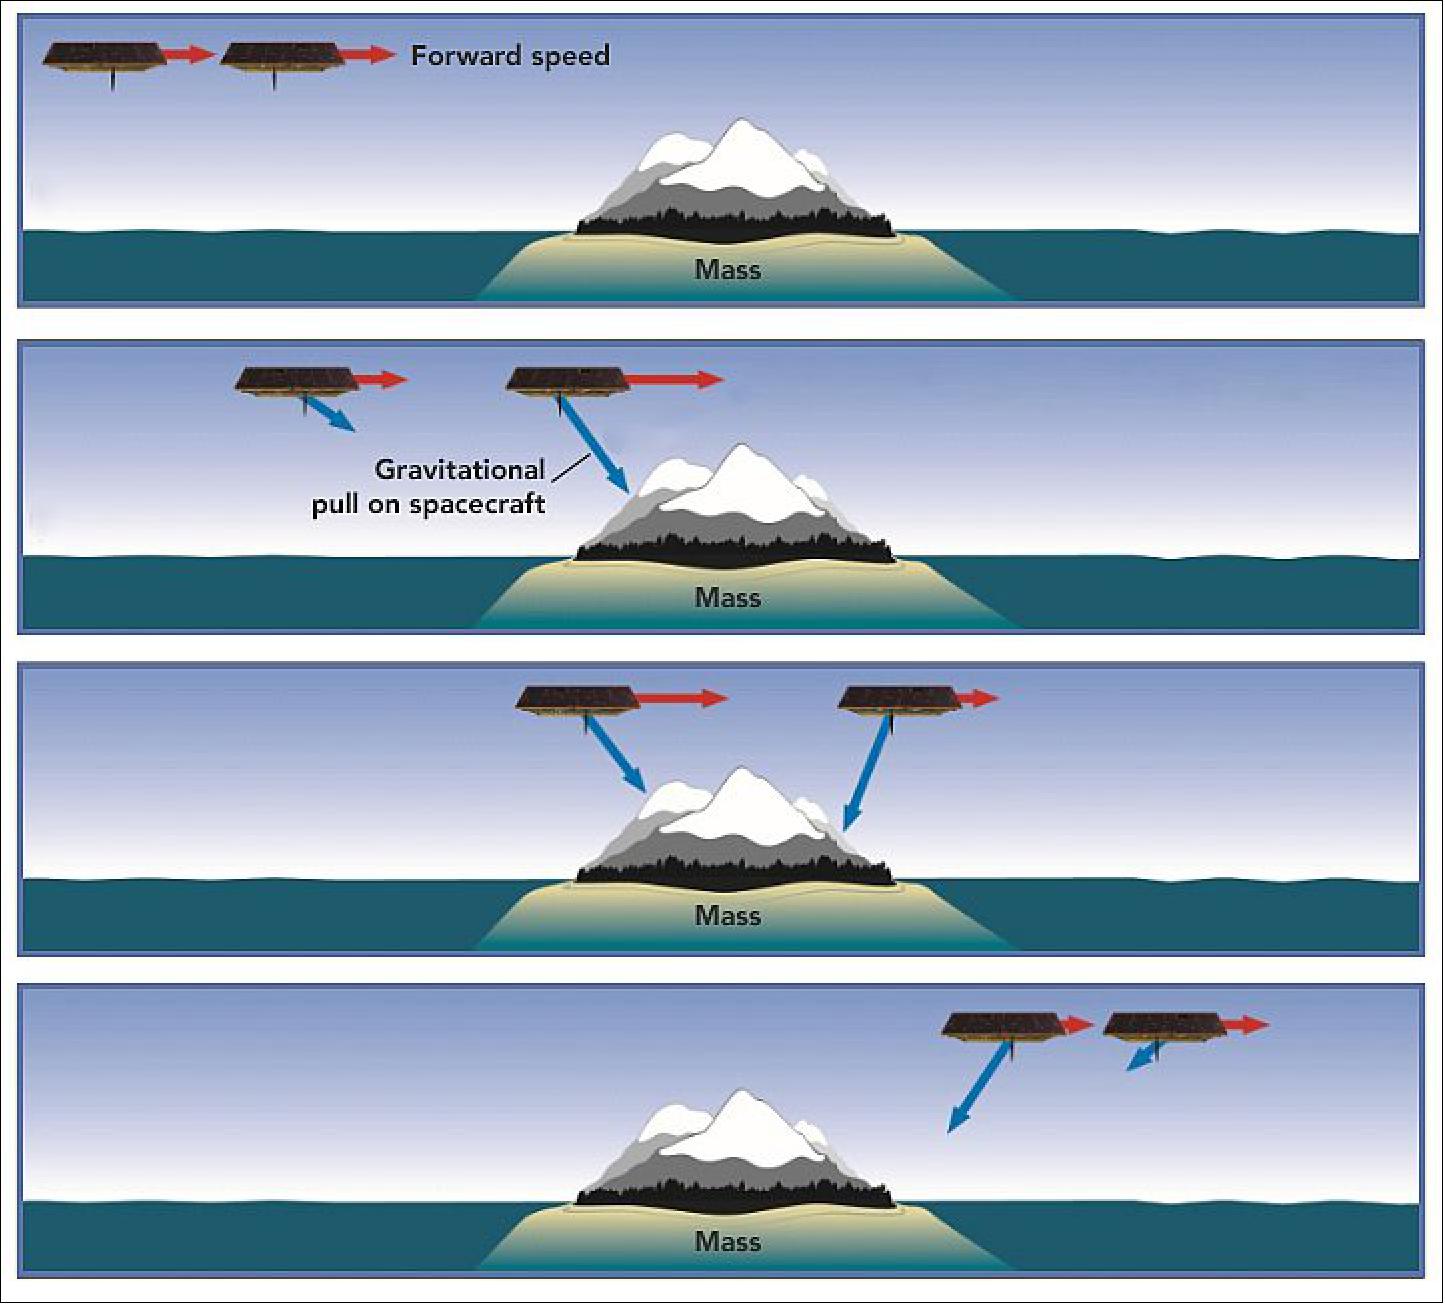
GRACE-FO, like GRACE, is designed to measure changes in gravitational pull that result from changes in mass on Earth. More than 99 percent of Earth's mean gravitational pull does not change from one month to the next. That's because it comes from the mass of the solid Earth itself — its surface and interior — and that rarely moves, or moves very slowly. Water, on the other hand, moves continually nearly everywhere: Snow falls, ocean currents flow, ice melts and so on. As the twin GRACE-FO satellites orbit Earth, one closely following the other, the changes in mass below change the distance between the two satellites very slightly. The record of these changes is analyzed to create monthly global maps of changes and redistribution of Earth's mass near the surface. 7)
Spacecraft
In November 2012, Airbus DS (formerly EADS Astrium GmbH, Friedrichshafen) has been commissioned to build two new GRACE Follow-On research satellites for NASA/JPL ( Jet Propulsion Laboratory). The goal of the GRACE Follow-on mission is to continue the extremely accurate measurement data collection of the first twin GRACE satellites, which have been in orbit since March 17, 2002. A launch of the mission is planned for August 2017, the minimum mission life is 5 years. 8)
JPL leads the development of the GFO satellite system in partnership (contract) with Astrium GmbH. Astrium provides major elements of two flight satellites based on an existing small satellite design for the CHAMP, GRACE and SWARM missions. The satellite system consists of the following subsystems where most are available with main and redundant units.
TT&C (Telemetry, Tracking & Control): The TT&C activities are carried out using a pyro-deployed S-band receive and transmit antenna, mounted on a nadir-facing deployable boom. Two back-up zenith antennae, one each for transmitting and receiving, along with the appropriate RF electronics assembly, complete the telemetry and telecommand subsystem. The telecommand function of the satellite is designed according to the ESA CCSDS (Consultative Committee for Space Data Systems) packet telecommand standard tailored for G-PUS (GRACE-FO Packet Utilization Standard) with adaptations mutually agreed with DLR/GSOC (German Space Operation Center). The satellites support the command and control capabilities of the MOS (Mission Operations System) by means of:
- HPC1 (High Priority Commands of priority 1), which are directly handled by the telecommand decoder and by-passes all OBC (On-Board Computer) software
- Normal telecommands, which will be processed by the OBC on-board software
After reception of the uplinked command stream via the S-band antenna and the receiver of the RF Electronic Assembly, the telecommands are decoded in above two command categories. The HPC1 are directly executed within the telecommand module of the OBC; i.e. corresponding bi-stable relays are set. The normal telecommands are read from the telecommand handler of the on-board flight S/W via system calls. The telecommand handler further validates and converts the telecommand packets into OBPs (On-Board command Packets). The OBPs are further distributed according to their indicated functionality.
Power subsystem: The power subsystem is responsible for the generation, storage, conditioning and distribution of electrical power in accordance with instrument and satellite bus users needs. Electrical energy is generated using solar arrays of triple junction GaAs (Gallium Arsenide) cells, placed on the top and side exterior surface of the satellites. Excess energy is stored in a battery of Li-Ion cells with a capacity of 66 Ah at mission start. The power bus delivers unregulated power to all users at the respective user interface.
TCS (Thermal Control Subsystem): The TCS consists of 96 independent heater circuits, 128 YSI-type thermistors and 36 PT-type thermistors for in-flight temperature housekeeping, monitoring and heater control, as well as for on-ground verification testing.
OBC (On-Board Computer) subsystem: The OBC subsystem provides processor and software resources, as well as necessary I/O capabilities for AOCS (Attitude and Orbit Control System), power subsystem and TCS operations, including necessary fault detection, isolation and recovery operations.
AOCS (Attitude and Orbit Control Subsystem): The AOCS consists of sensors, actuators and software to:
- Provide adequate knowledge of satellite attitude during all phases of the mission
- Generate on-board error signals to accurately maintain satellite attitude
- Provide necessary orbital control to satisfy the GRACE-FO mission requirements
The sensors include a CESS (Coarse Earth Sun Sensor), an IMU (Inertial Measurement Unit) and a fluxgate magnetometer, as well as the STR (Star Tracker Assembly) and GNSS receiver.
The CESS provides for omnidirectional, coarse attitude measurement in the initial acquisition, survival and stand-by modes of the satellite. It comprises of six thermistors orthogonally mounted on the satellite. By assuming that the Sun is the hottest object in the field of view and the Earth is the second hottest object in the field of view, the CESS provides the Sun and Earth vectors relative to the body frame at a rate of 1 Hz with an accuracy of ~5º.
The IMU is used in survival modes and provides 4-axis rate information. The unit comprises of three solid-state fiber optic gyros, and three solid-state silicon accelerometers that measure velocity and angle changes in a coordinate system fixed relative to its case. A fluxgate magnetometer provides additional rate information.
The actuators for the AOCS include a CGA (Cold Gas Assembly) and a magnetorquer system. The GN2 (Gaseous Nitrogen) reaction control system includes two pressure vessels, valves, regulators and filters, along with 12 attitude control thrusters and two orbit control thrusters. Three magnetorquers with linear dipole moments of 27.5 Am2 complete the set of AOCS actuators.
µSTR (micro Star Tracker Assembly): The µSTR determines the orientation of the satellite by tracking it relative to the position of the stars. These measurements are used for fine-pointing and on-board control of the satellite. Additionally they are required for the interpretation of measurements made in the satellite reference frame, such as those from the SuperSTAR accelerometer.
The SCA (Star Camera Assembly) consists of three temperature controlled CCD star cameras mounted to the accelerometer, along with the respective baffle assemblies. The STR delivers its video frames to the OBC, which then computes the attitude quaternions. The OBC also acts as the power and command/control interface to the STR. Once switched on and initialized, the STR proceeds with automatic coarse attitude acquisition and then on to fine attitude derivation.
CMT (Center of Mass Trim) assembly: The CMT assembly consists of six (two per axis) MTMs (Mass Trim Mechanisms), associated electronics, and the power and signal harness. Each MTM consists of a trim mass driven on a nut rotor with a stepper motor. The CMT assembly is used to center the CG (Center of Gravity) of the satellite at the center of the proof-mass of the accelerometer after CG calibration maneuvers.
• MDR (Mission Definition Review) and SSR (System Requirements Review) passed in July 2012.
• Formal transition to Phase A occurred in January 2012 9)
The two GRACE-FO satellites with a size of around 3 m x 3 m x 0.8 m and a mass of ~600 kg, will orbit Earth in a co-planar polar orbit, spaced 220 km apart at an altitude of ~490 km.
Some project development status dates
April 30, 2018: A pair of new spacecraft that will observe our planet's ever-changing water cycle, ice sheets and crust is in final preparations for a California launch no earlier than Saturday, 19 May. The GRACE-FO mission, a partnership between NASA and the German Research Center for Geosciences (GFZ), will take over where the first GRACE mission left off when it completed its 15-year mission in 2017.10)
GRACE-FO will continue monitoring monthly changes in the distribution of mass within and among Earth's atmosphere, oceans, land and ice sheets, as well as within the solid Earth itself. These data will provide unique insights into Earth's changing climate, Earth system processes and even the impacts of some human activities, and will have far-reaching benefits to society, such as improving water resource management.
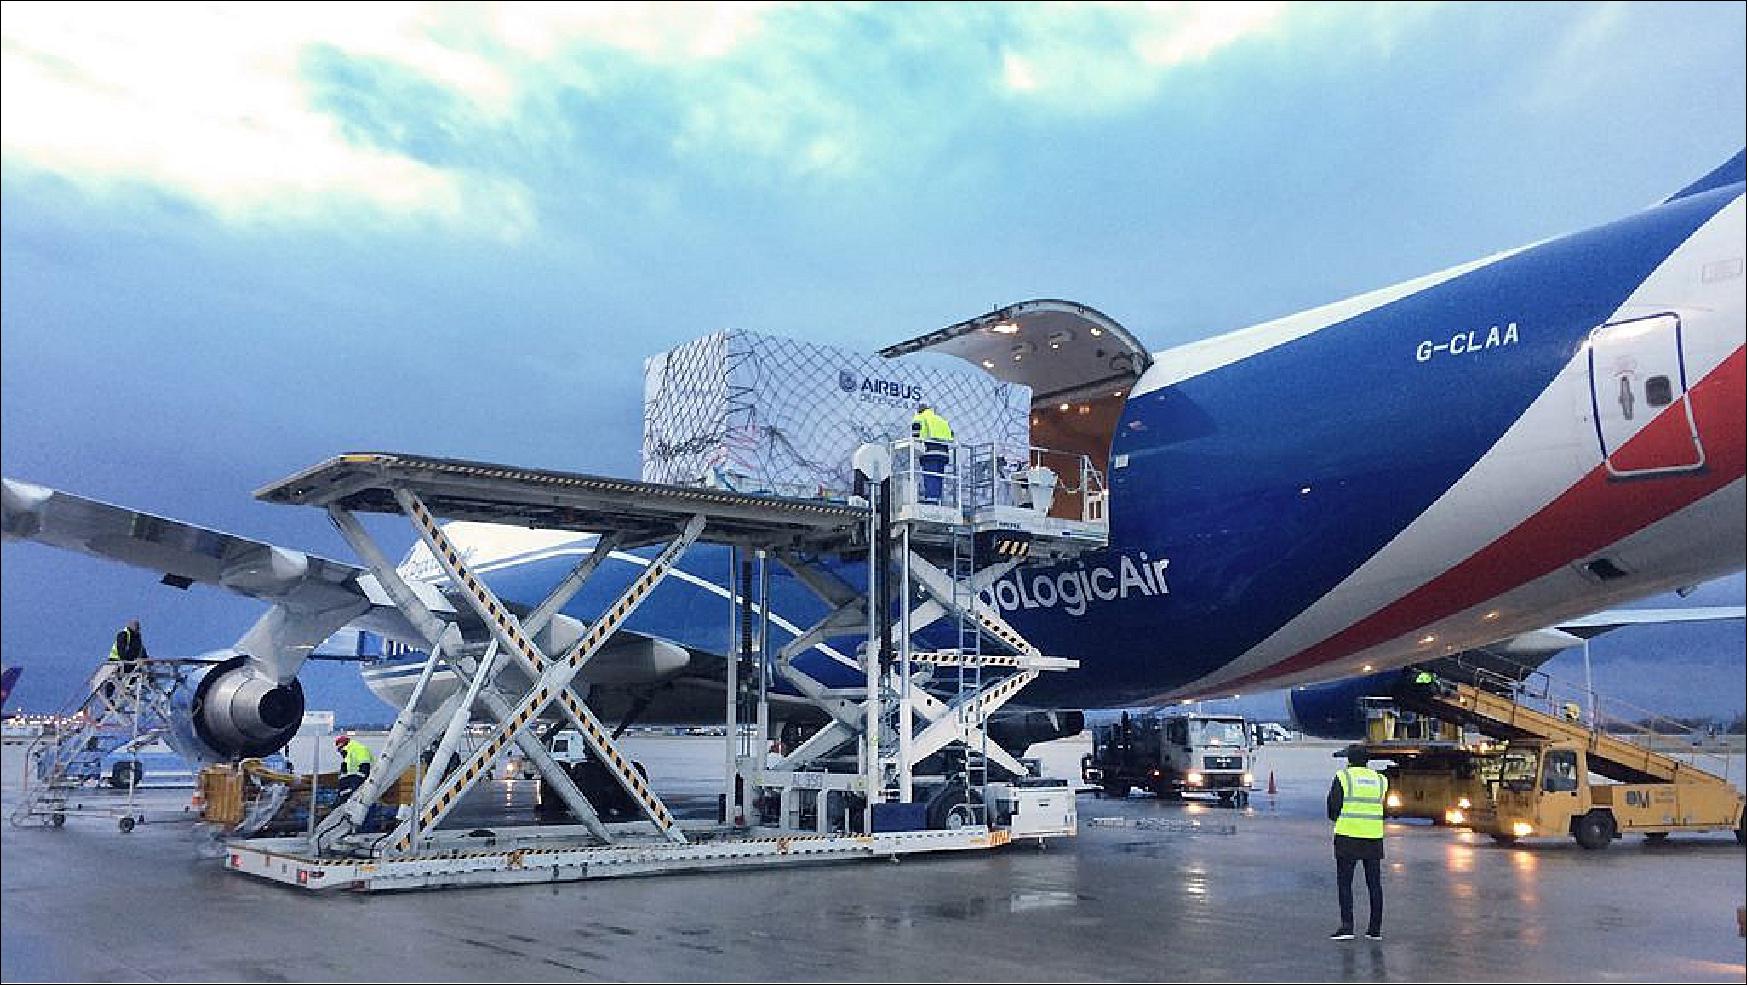
December 12, 2017: The twin GRACE-FO satellites have now set off on their journey to Vandenberg Air Force Base in California. Together with test equipment totalling around 45 tons, the gravity research satellites built and developed by Airbus in Friedrichshafen (Germany) were loaded overnight onto an air freighter at Munich Airport and flown to the USA this morning. GRACE-FO is a joint project between NASA/JPL (Jet Propulsion Laboratory) based in Pasadena, California, and the German Research Center for Geosciences (GFZ) in Potsdam. 11) 12)
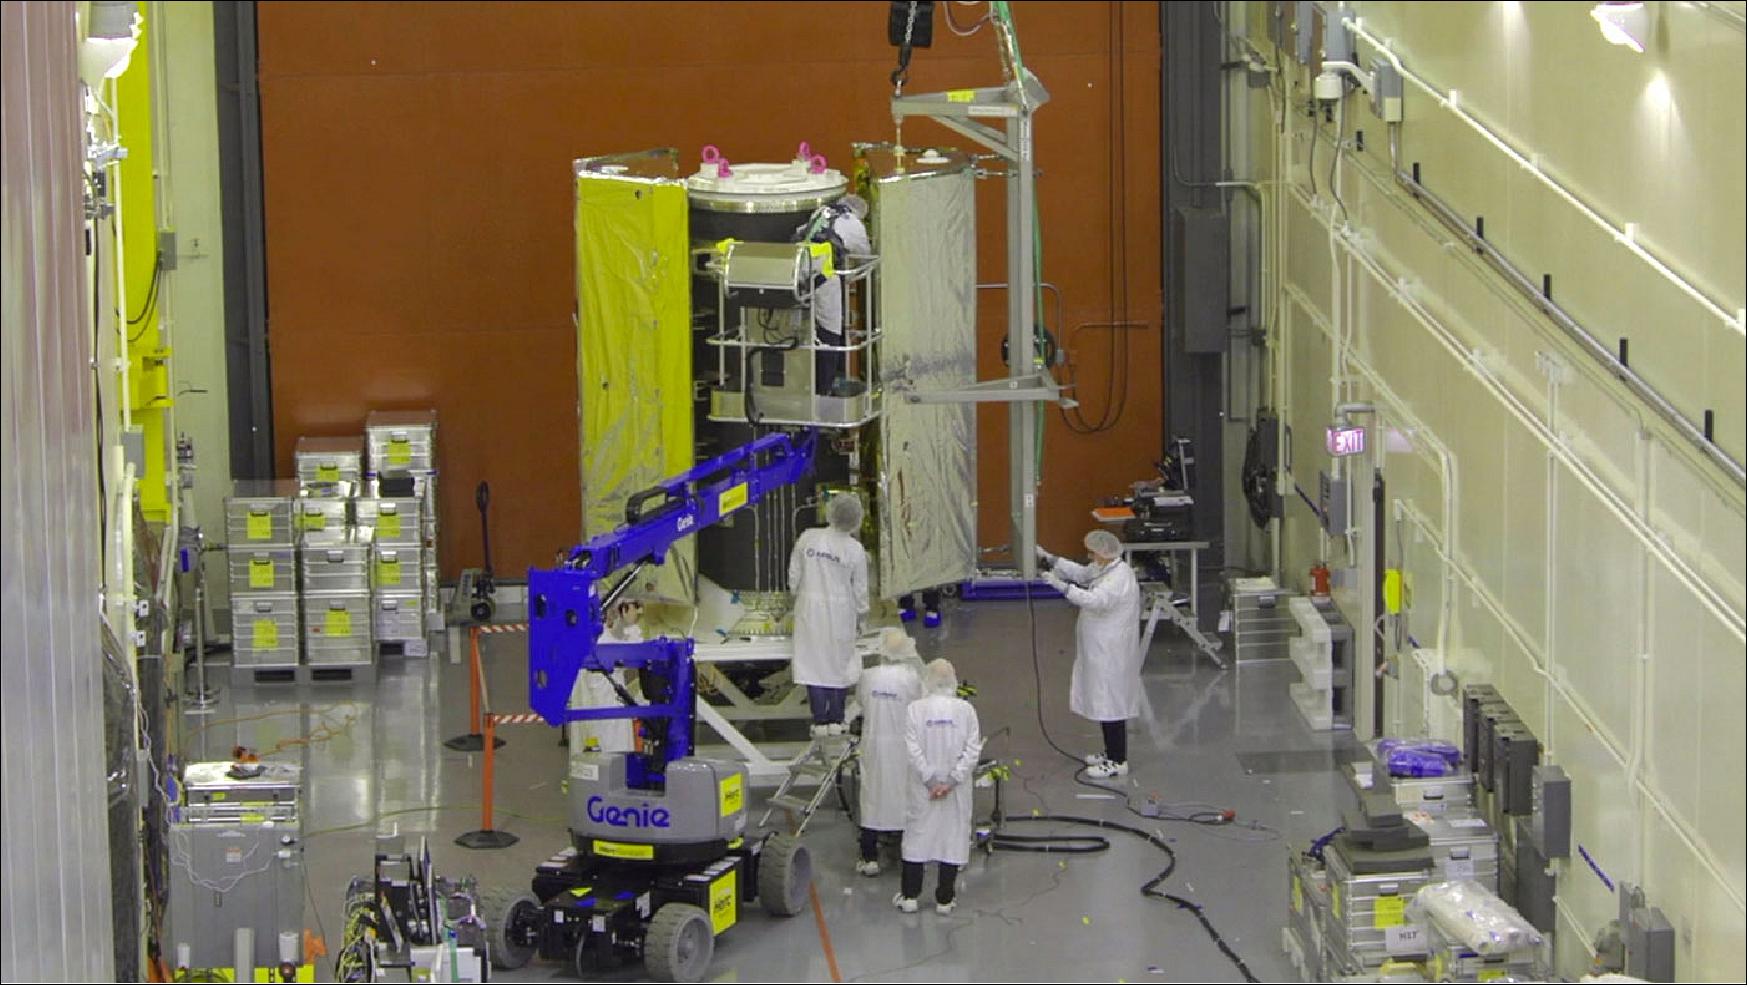
A team of 15 Airbus space engineers and technicians are currently awaiting the arrival of the satellites in California. The plan is to assemble all test systems on site and check the GRACE-FO spacecraft before the Christmas break in readiness for the launch campaign in 2018.
November 10, 2017: After a successful year-long test campaign by Airbus at IABG in Ottobrunn near Munich, the twin GRACE-FO (Gravity Recovery and Climate Experiment Follow-On) satellites will soon travel to their VAFB launch site in California. 13)
During testing, the gravity-measuring satellites were subjected to conditions similar to those they will experience during launch and in low Earth orbit. Both satellites, each weighing 600 kg, will be flown to the Vandenberg Air Force Base launch site in California in December to begin final launch preparations.
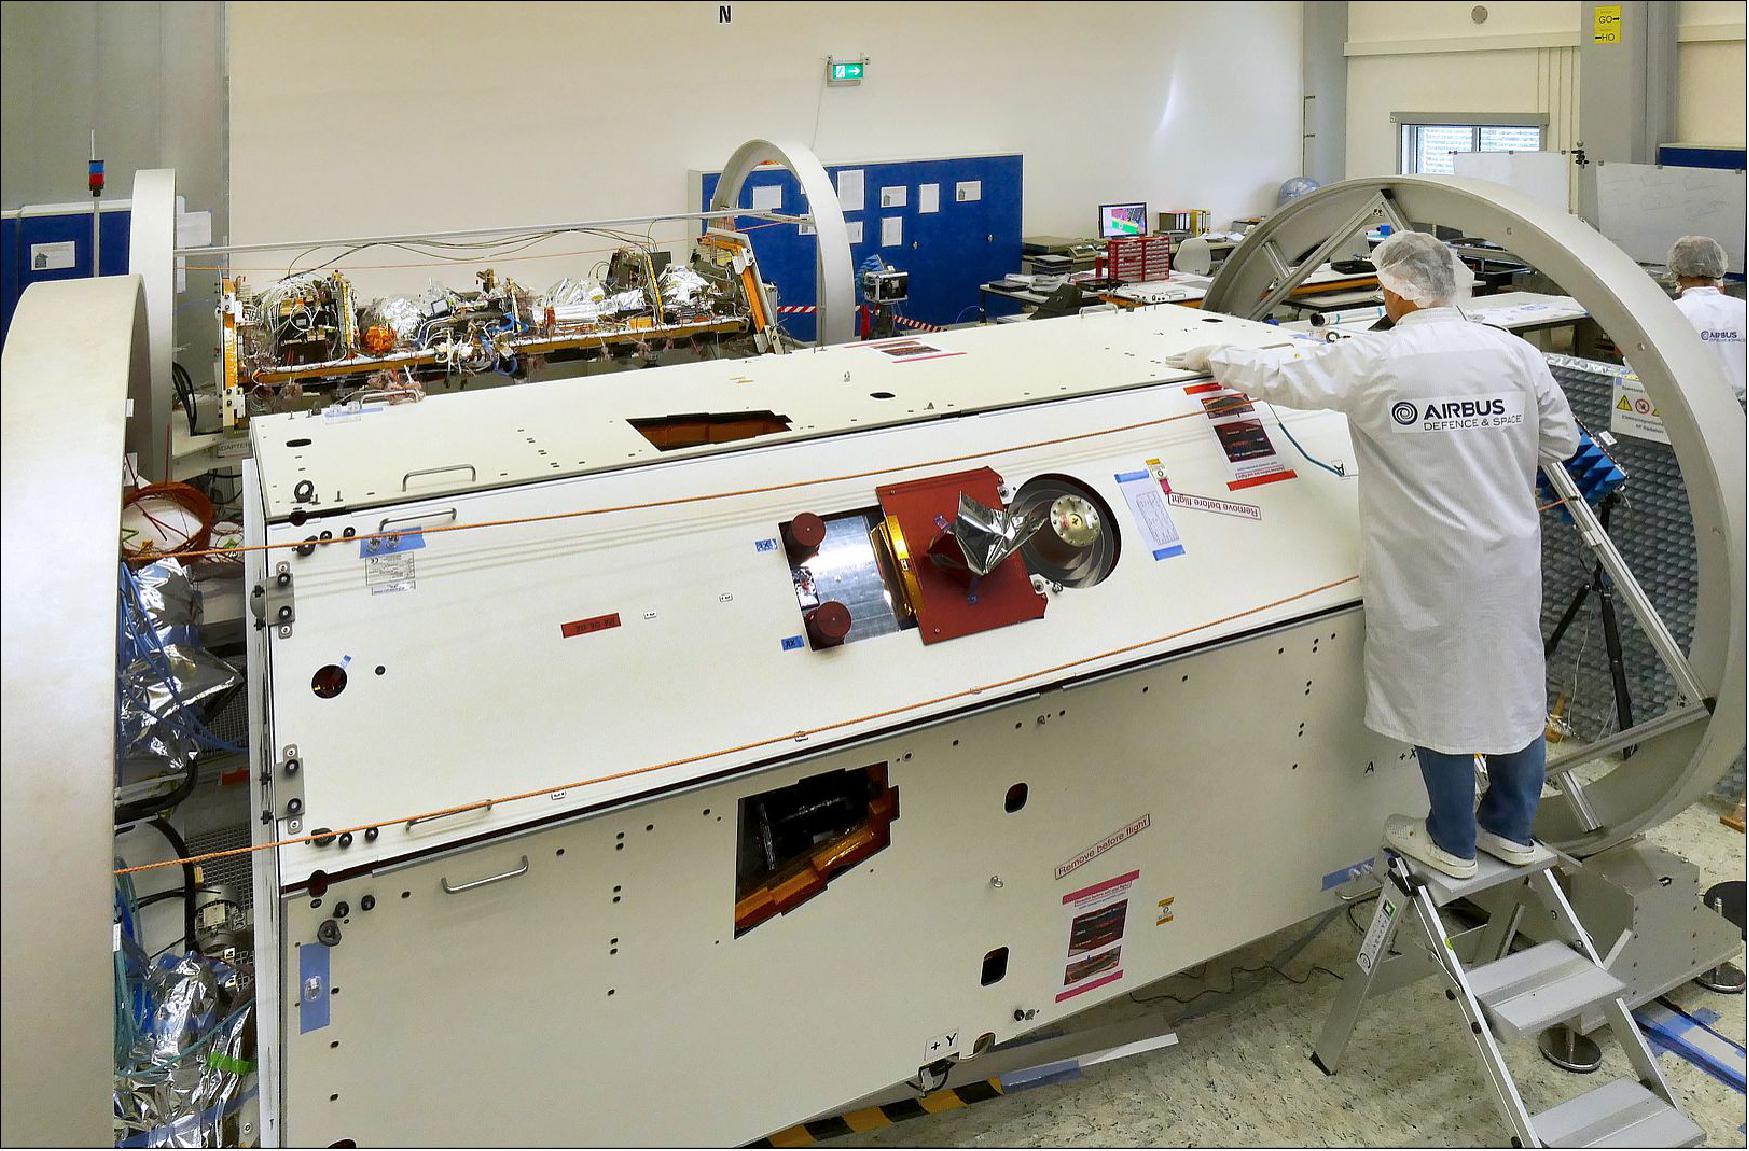
May 2, 2017: The two GRACE-FO satellites, developed at Airbus DS Friedrichshafen (Germany) for NASA/JPL, were 'given an earful' during recent acoustic tests. The sound impact that builds up during rocket launches was simulated in an echo chamber with a volume of around 1,400 m3 at IABG in Ottobrunn near Munich. 14)
In four test cycles, the satellites in their flight position were subjected to a sound impact of nearly 140 decibels (dB). In comparison, a pneumatic drill produces 100 dB and the human pain threshold is 130 dB. Both satellites passed the tests with flying colors.
NASA/JPL in partnership with the GFZ (German Research Center for Geosciences) Potsdam , will send both GRACE-FO research satellites into a polar orbit at an altitude of around 500 km and at a distance of 220 km apart.
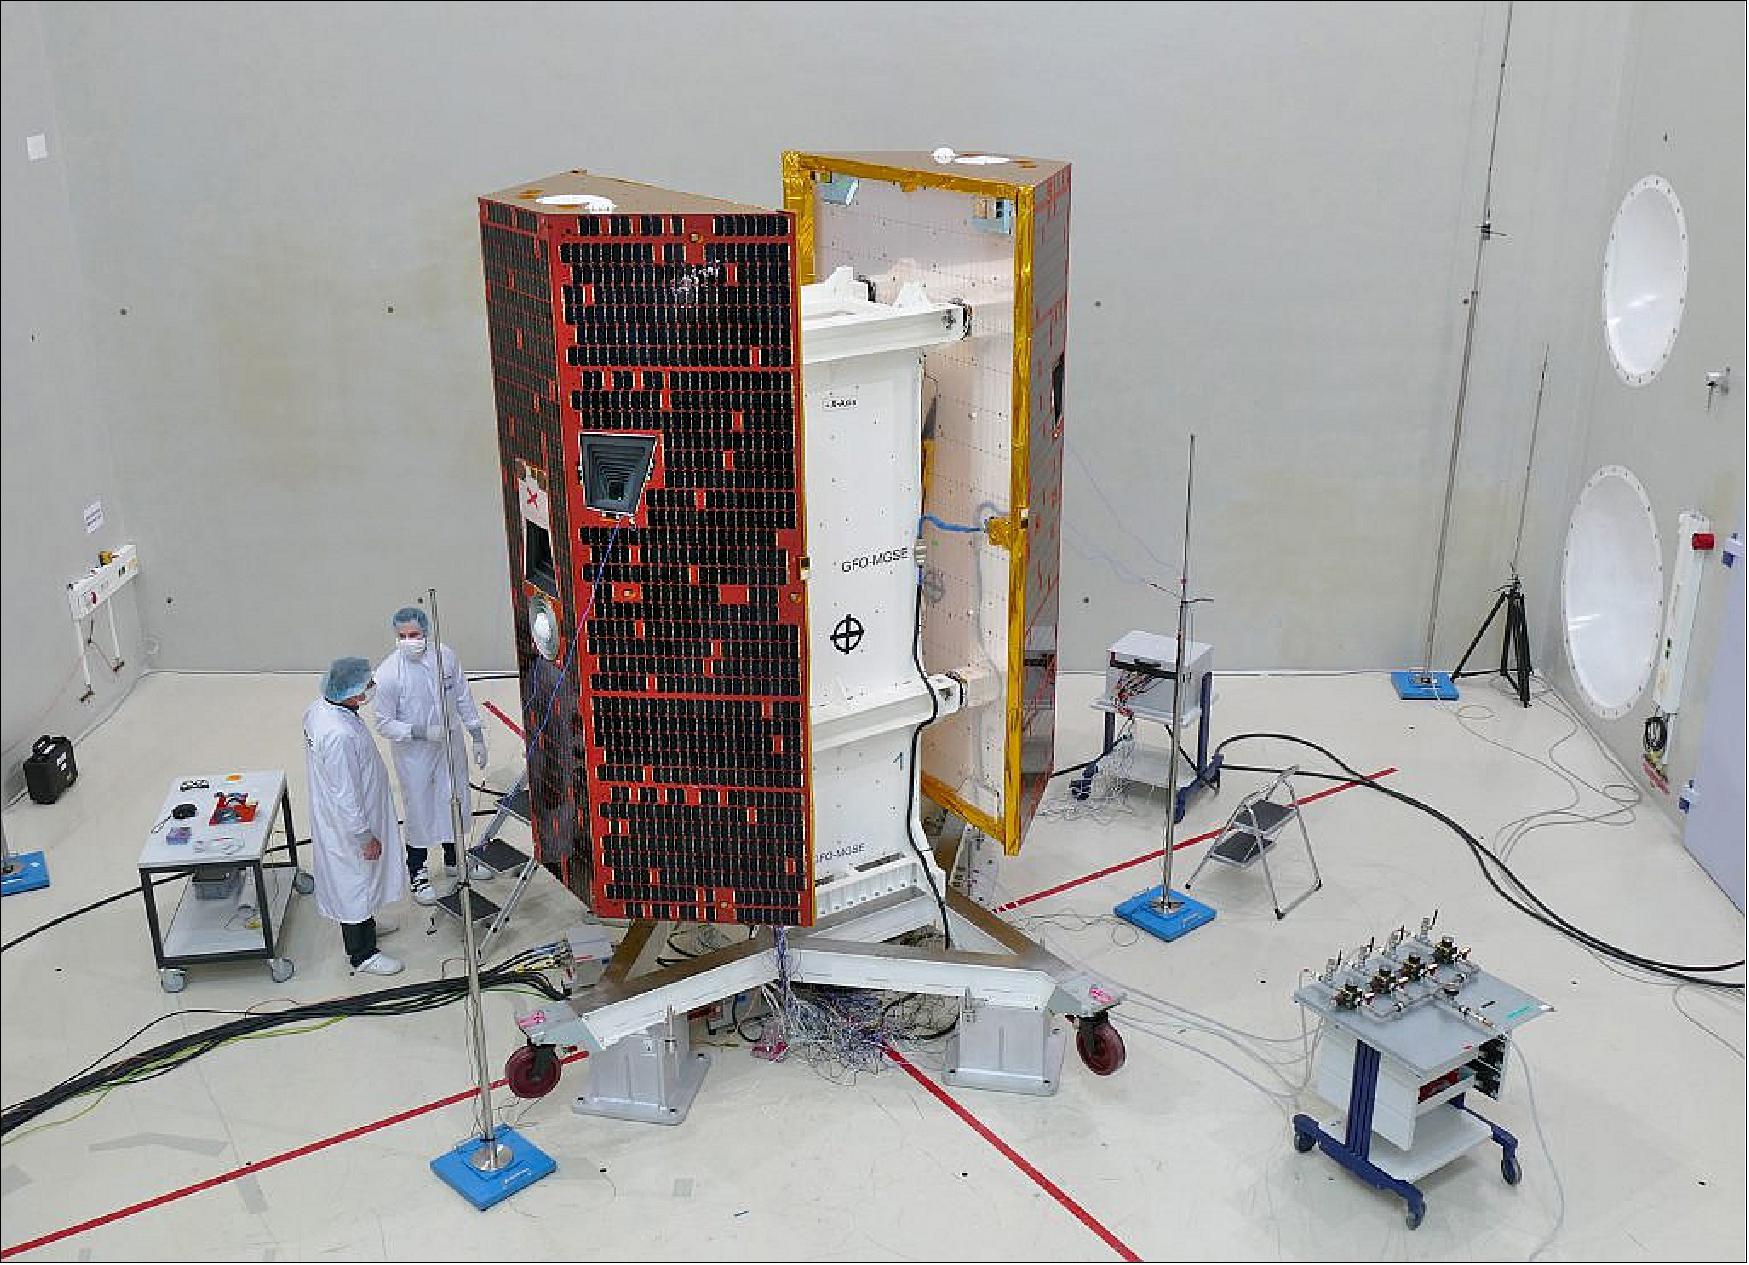
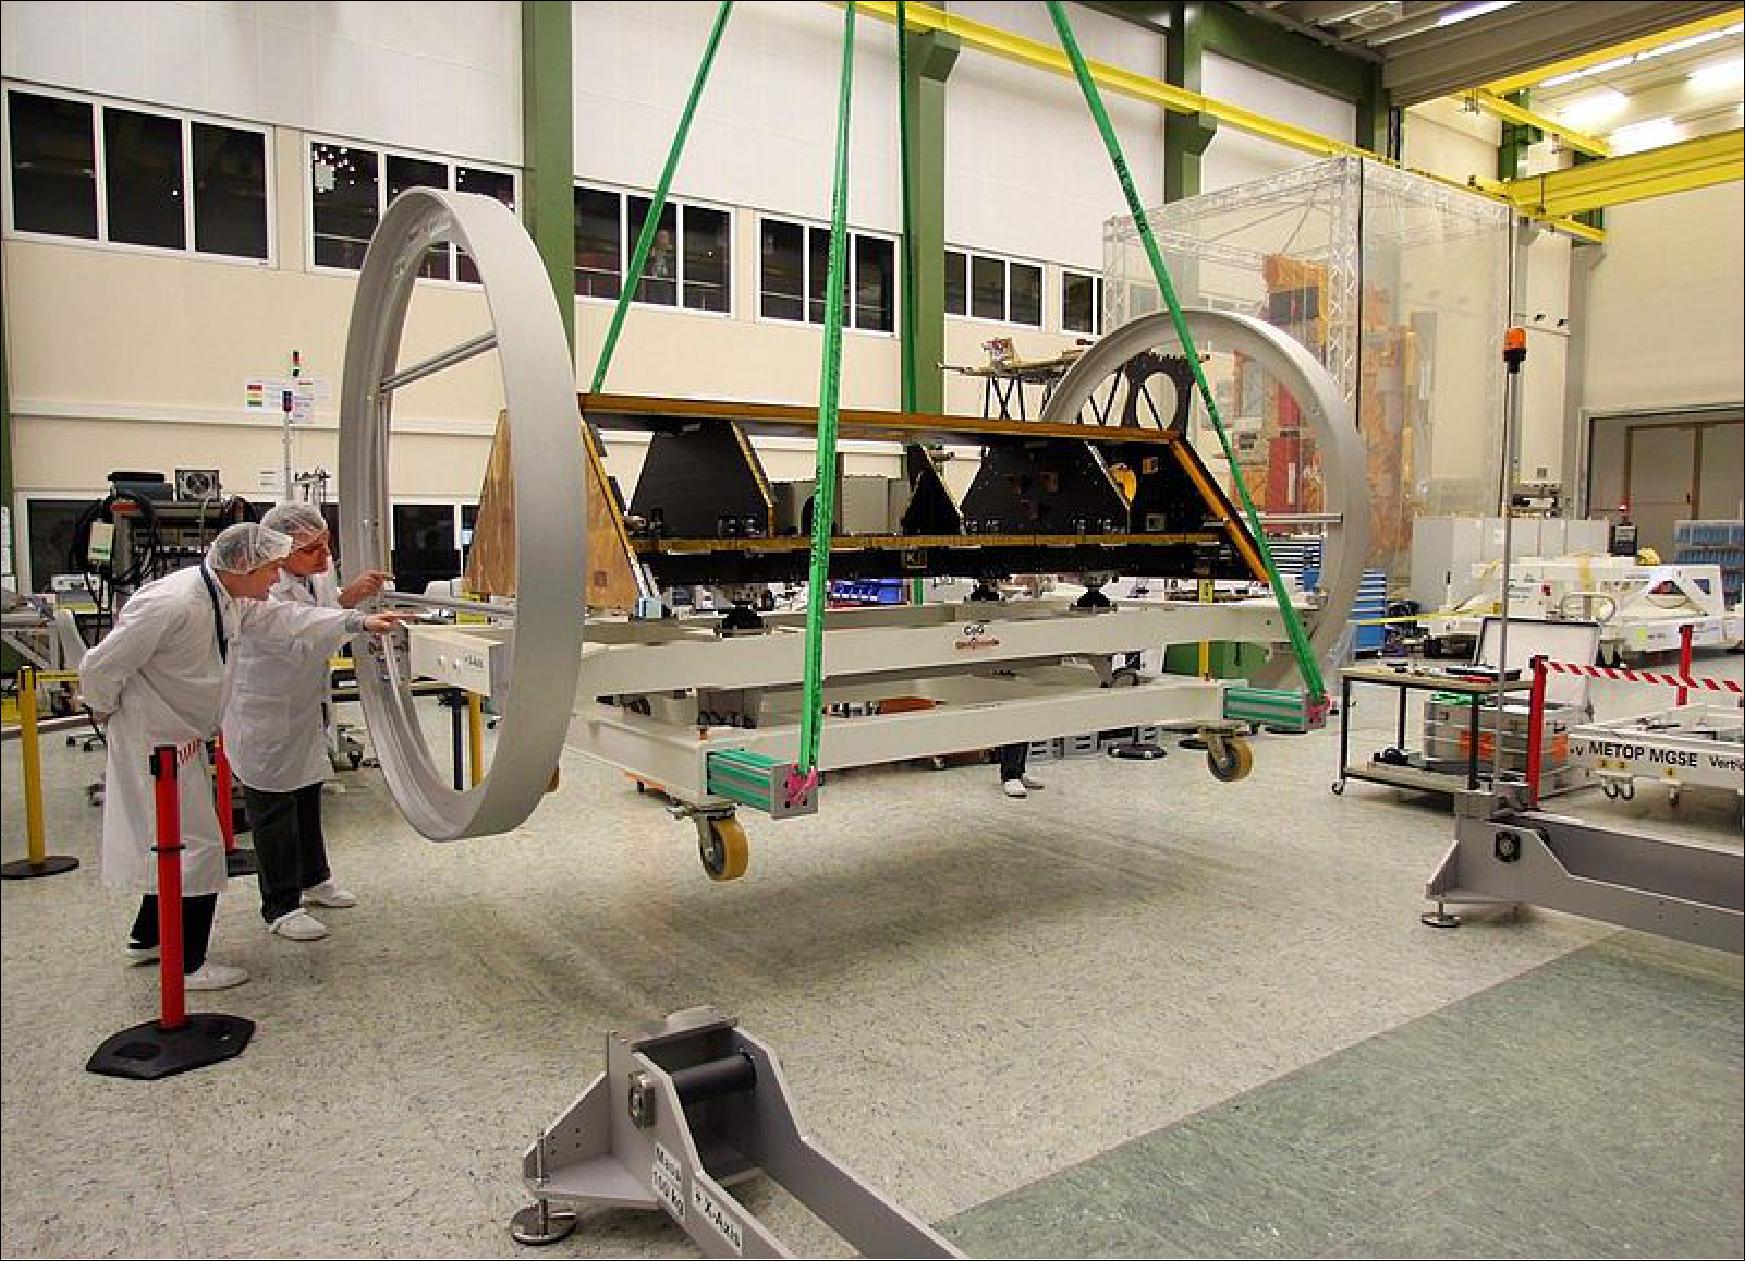
October 28, 2016: Airbus DS is reporting that the company has finished construction of the first of the two GRACE-FO satellites in Friedrichshafen, Germany (Figure 5). The satellite will now be transferred to Ottobrunn near Munich for several months of operational testing in the IABG (Industrieanlagen-Betriebsgesellschaft mbH) test center. — The second GRACE-FO satellite will be ready for testing in about four weeks. 15)
July 2, 2015: BATC (Ball Aerospace & Technologies Corporation) delivered the "laser frequency stabilization reference flight units" for GRACE-FO to NASA/JPL. Ball's flight units constitute a subsystem that is part of the high-precision LRI (Laser Ranging Interferometer), a secondary payload aboard the spacecraft.
Jan. 20-24, 2014: The project PDR (Preliminary Design Review) was conducted. 16)
Feb. 11, 2013: GFZ signs MoU and provides launcher - Today the Board of the GFZ (German Research Center for Geosciences) has signed the Memorandum of Understanding with NASA Administrator Charles Bolden Jr. to mutually realize the follow-on mission of GRACE (Gravity Recovery and Climate Experiment). This agreement solidifies the joint long-term planning and realization of this unique tandem satellite mission, which will, after having successfully passed the PDR (Preliminary Design Review) in January, now enter it's building phase to be launched in August 2017. 17)
Germany does not only provide the launcher but also optical elements of the LRI (Laser Ranging Interferometer) assembly. The distance measurement between the current dual GRACE satellites which has been performed so far with an accuracy of about two thousands of a millimeter using microwave signals. This shall be improved for GRACE-FO by this new technology by a factor of up to 20. This is important as the prime signal to monitor gravity field variations is the change in separation between both satellites. The LRI design is provided by the Max-Planck-Institute for Gravitational Physics (Albert-Einstein-Institute), the flight hardware will be delivered by STI (SpaceTech GmbH), the GFZ project partner).
Besides NASA/JPL (Jet Propulsion Laboratory) and the University of Texas, GFZ is again responsible for science data processing. Funding of the German contributions is jointly provided by the German Ministry of Education and Research, the German Ministry of Economics and Technology and the Helmholtz Foundation. The German Aerospace Center (DLR) provides in-kind contributions for the LRI. Besides this, GFZ provides Laser Retro-Reflectors for both satellites and funds the mission operations for 5 years. Mission operations will be conducted, as for GRACE, by GSOC (German Space Operation Center) of DLR in Oberpfaffenhofen.
September 3, 2012: Formal transition to Phase B.
Germany will contribute to the GRACE Follow-on mission the following services/developments:
- Launch provision (a Rockot launch is planned as for GRACE)
- Major contribution to the German/US LRI instrument
- Mission operations and ground system
- Science analysis.
Astrium uses a 3rd generation Flexbus for the GRACE-FO mission (Ref. 9). Each of the GRACE-FO satellites measures approximately 3 m x 2 m x 0.8 m and has a mass of around 580 kg.
Throughout the five-year mission, these measurements will be used to generate an updated model of the Earth's gravitational field every 30 days. In addition, every day each satellite will create up to 200 profiles of temperature distribution and water vapor content in the atmosphere and ionosphere.
Launch: The GRACE-FO twin spacecraft, a joint US/German mission, was launched on 22 May 2018 (19:47:58 UTC) from VAFB, CA, USA. GRACE-FO lifted off on a SpaceX-Falcon-9 flight as a rideshare mission with 5 Iridium NEXT communication satellites. 18)
April 9, 2018: GRACE-FO is officially confirmed on a SpaceX-Falcon-9 flight as a rideshare mission with 5 Iridium NEXT satellites, according to a joint announcement of Iridium, NASA and the GFZ (German Research for Geosciences). This unique "rideshare" launch will first deploy the twin GRACE-FO spacecraft, after which the Falcon 9 second stage will continue onward to the deployment orbit for the five Iridium NEXT satellites. Upon completion, the Iridium-6/GRACE-FO mission will increase the total number of Iridium NEXT satellites in space to 55, leaving just two launches, of 10 satellites each, remaining. Iridium NEXT satellites are scheduled to begin shipping to the launch site this week while the twin GRACE-FO spacecraft are already onsite at the VAFB Harris Corporation facility, and have been stacked, attached to their dispenser and are preparing for transfer to the SpaceX launch complex. 19)
On January 31, 2017, Iridium Communications Inc. announced that it has contracted with SpaceX for an eighth Falcon 9 launch. Along for the ride are the twin-satellites of the NASA/GFZ GRACE-FO (Gravity Recovery and Climate Experiment Follow-On) mission, which will be deployed into a separate low-Earth orbit, marking the first rideshare deal for Iridium. An agreement of this kind is economical for all parties, and affords Iridium the ability to launch five additional satellites for its next-generation global satellite network. The rideshare is anticipated to launch out of VAFB (Vandenberg Air Force Base) in California by early 2018. 20) 21)
This rideshare represents a material savings from other supplemental launch options due to the efficiency of sharing the rocket with GRACE-FO, and the incremental cost during the Iridium NEXT construction period is immaterial when considering the avoidance of unspent amounts contemplated under the Kosmotras program. It also affords Iridium the opportunity to rearrange its launch and satellite drifting plan and launch these five satellites directly into their operational orbital plane while increasing the number of planned in-orbit spares by three satellites. Further, this development allows Iridium to complete the whole operational constellation at a faster rate than it would have with seven launches. Iridium will still consider launching satellites with Kosmotras once approvals are available.
"This is a very smart way to get additional Iridium NEXT satellites into orbit," said Matt Desch, chief executive officer at Iridium. "This launch provides added resiliency to our network for not much more than we had planned originally to launch 72 satellites, including two with Kosmotras."
The GRACE-FO mission was initially booked with the launch provider ISC (International Space Company) Kosmotras on the Russian-Ukrainian Dnepr rocket with a launch from the Baikonur Cosmodrome launch station in Kazakhstan. GFZ arranged the launch under a contract with Moscow-based ISC Kosmotras. However, the Dnepr has not launched since March 2015. The company originally planned to launch its first two next-generation satellites on a Dnepr to test them in orbit before beginning large-scale deployment of the constellation on Falcon- 9 launches. Iridium ultimately decided to start with the Falcon 9, successfully launching its first 10 satellites Jan. 14, 2017. 22) GFZ (German Research Center for Geosciences) in Potsdam is managing the German involvement in the mission. Managers of GFZ switched the GRACE-FO mission to a Falcon-9 rocket launch. DLR (German Research Center) is funding the launch and is partnering with NASA on the mission. Some important factors in selecting a launch vehicle are reliability, cost, availability, and capability of lifting the satellite to its desired orbit. |
Orbit: A circular co-planar orbit (non-repeat ground track), initial altitude of 490 ±10 km, inclination = 89.0±0.06º, eccentricity < 0.0025, spacecraft separation: ~220 km.
After separation from the launch vehicle, the two satellites are in slightly differently sized orbits that cause a drift apart with a nominal drift rate of about 200 km/day for several days. This drift has to be stopped and reversed to bring them into the required formation of 220 km apart. The operations of the intersatellite ranging instruments — MWI and LRI — require pointing information based on TLEs (Two-Line Elements) of both spacecraft, which are provided via command from the ground. To improve this TLE-based pointing information onboard each satellite a GPS-based frame correction is applied for K-band pointing. For LRI operations this corrected pointing still is not accurate enough. Thus, the offset between GPS-based and TLE-based pointing is computed and modelled on the ground using a parametric fit method. The computed fit parameters are uploaded to the satellites by ground command together with each TLE set to compute a more accurate pointing using the TLEs and fit data. 23)
Status and imagery of the GRACE-FO mission
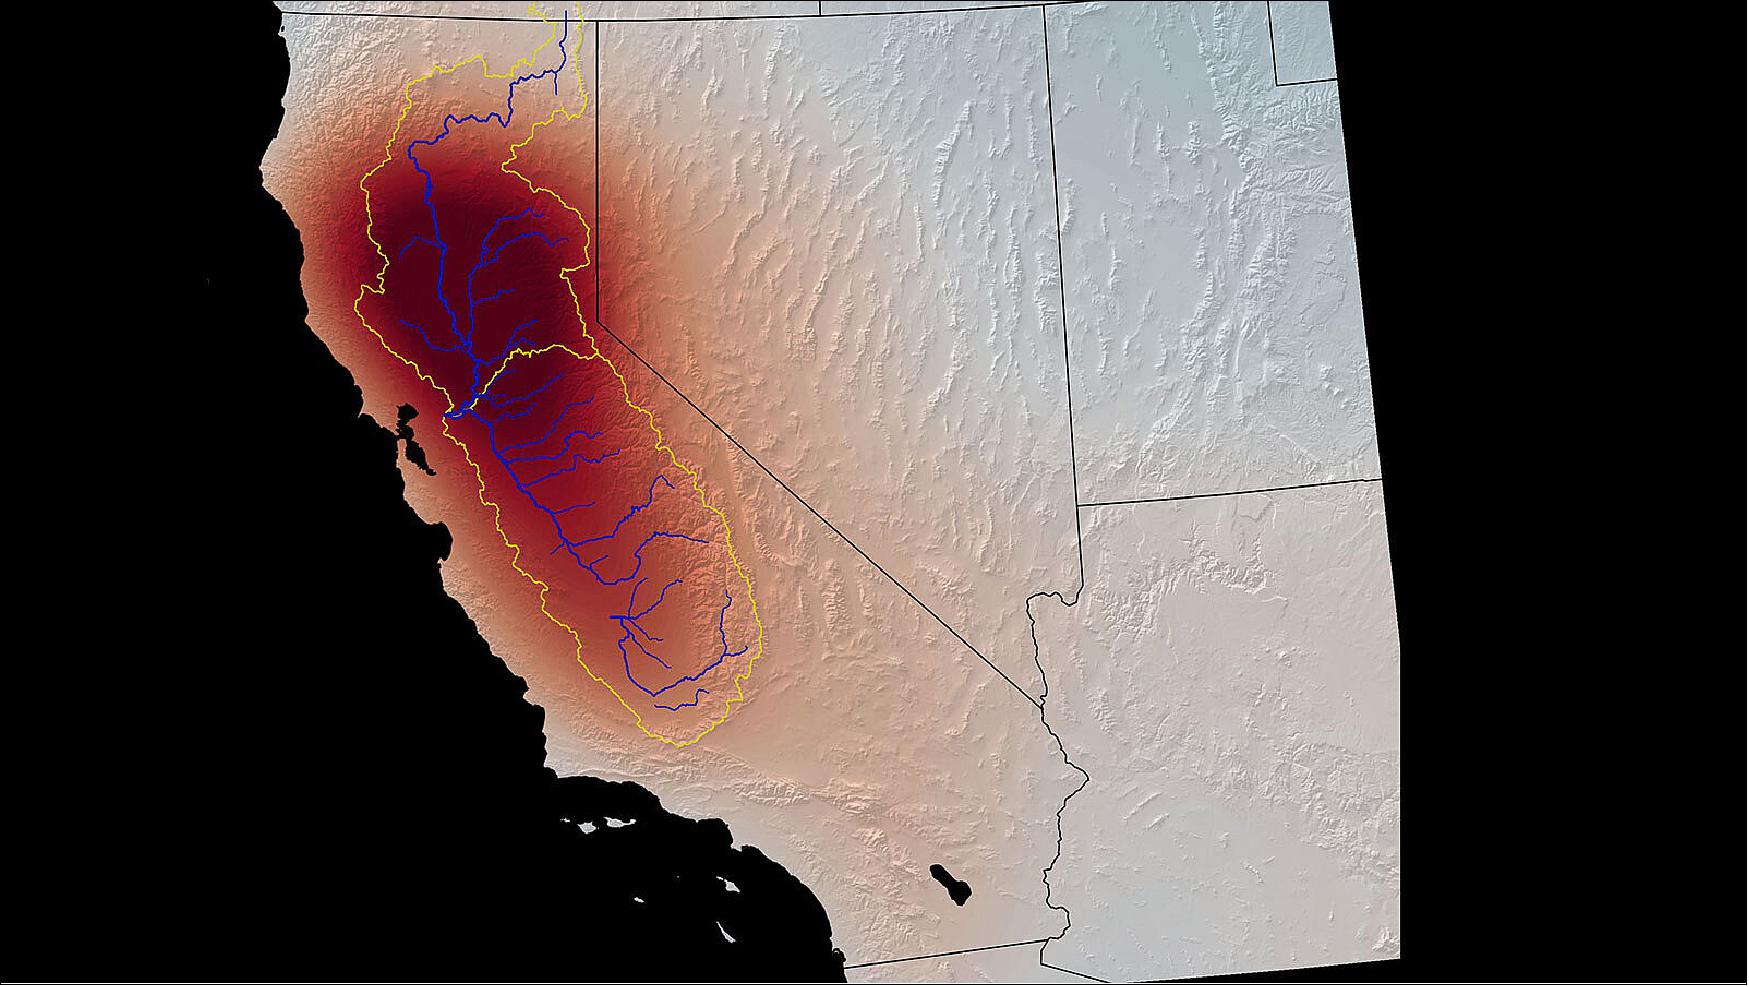
• April 5, 2022: Scientists have produced a new method that holds the promise of improving groundwater management – critical to both life and agriculture in dry regions. The method sorts out how much underground water loss comes from aquifers confined in clay, which can be drained so dry that they will not recover, and how much comes from soil that’s not confined in an aquifer, which can be replenished by a few years of normal rains. 24)
- The research team studied California’s Tulare Basin, part of the Central Valley. The team found that the key to distinguishing between these underground sources of water relates to patterns of sinking and rising ground levels in this heavily irrigated agricultural region.
- The Central Valley makes up only 1% of U.S. farmland, yet it grows an amazing 40% of the nation’s table fruits, vegetables, and nuts annually. Productivity like that is only possible because farmers augment the valley’s 5 to 10 inches (12 to 25 centimeters) of annual rainfall with extensive groundwater pumping. In drought years, more than 80% of irrigation water comes from underground.
- After decades of pumping, underground water resources are dwindling. Wells in the Tulare Basin now must be drilled as much as 3,500 feet (over 1,000 meters) deep to find adequate water. There’s no way to measure exactly how much water remains underground, but managers need to make the wisest use of whatever there is. That involves monitoring whether water is being drawn from aquifers or from loose soil, known as the water table. In this large region with tens of thousands of unmetered wells, the only practical way to do that is by using satellite data.
- A research team from NASA’s Jet Propulsion Laboratory in Southern California and the U.S. Department of Energy’s Lawrence Berkeley Laboratory in Northern California set out to create a method that would do exactly that. They attacked the problem by combining data on water loss from NASA’s Gravity Recovery and Climate Experiment (GRACE) and GRACE-FO satellites with data on ground-level changes from a ESA (European Space Agency) Sentinel-1 satellite. Ground-level changes in this region are often related to water loss because when ground is drained of water, it eventually slumps together and sinks into the spaces where water used to be – a process called subsidence.
- The Tulare Basin is subsiding drastically: The current rate is about one foot (0.3 meters) of sinkage per year. But from one month to the next, the ground may drop, rise or stay the same. What’s more, these changes don’t always line up with expected causes. For example, after a heavy rainfall, the water table rises. It seems obvious that this would cause the ground level to rise, too, but it sometimes sinks instead.
- The researchers thought these mysterious short-term variations might hold the key to determining the sources of pumped water. “The main question was, how do we interpret the change that’s happening on these shorter time scales: Is it just a blip, or is it important?” said Kyra Kim, a postdoctoral fellow at JPL and coauthor of the paper, which appeared in Scientific Reports. 25)
Clay vs. Sand
- Kim and her colleagues believed the changes were related to the different kinds of soils in the basin. Aquifers are confined by layers of stiff, impermeable clay, whereas unconfined soil is looser. When water is pumped from an aquifer, the clay takes a while to compress in response to the weight of land mass pressing down from above. Unconfined soil, on the other hand, rises or falls more quickly in response to rain or pumping.
- The researchers created a simple numerical model of these two layers of soils in the Tulare Basin. By removing the long-term subsidence trend from the ground-level-change data, they produced a dataset of only the month-to-month variations. Their model revealed that on this time scale, virtually all of the ground-level change can be explained by changes in aquifers, not in the water table.
- For example, in spring, there’s little rainfall in the Central Valley, so the water table is usually sinking. But runoff from snow in the Sierra Nevada is recharging the aquifers, and that causes the ground level to rise. When rainfall is causing the water table to rise, if the aquifers are compressing at the same time from being pumped during the preceding dry season, the ground level will fall. The model correctly reproduced the effects of weather events like heavy rainfalls in the winter of 2016-17. It also matched the small amount of available data from wells and GPS.
- Kim pointed out that the new model can be repurposed to represent other agricultural regions where groundwater use needs to be better monitored. With a planned launch in 2023, the NASA-ISRO (Indian Space Research Organisation) Synthetic Aperture Radar (NISAR) mission will measure changes in ground level at even higher resolution than Sentinel-1. Researchers will be able to combine NISAR’s dataset with data from GRACE Follow-On in this model for the benefit of agriculture around the globe. “We’re heading toward a really beautiful marriage between remote sensing and numerical models to bring everything together,” Kim said.
• December 10, 2021: As meteorological autumn came to an end in 2021, parts of western Washington and southern British Columbia were still saturated from the barrage of rainstorms that repeatedly soaked the area. The moisture is especially evident in the region’s soils, which had little time to dry between storms. 26)
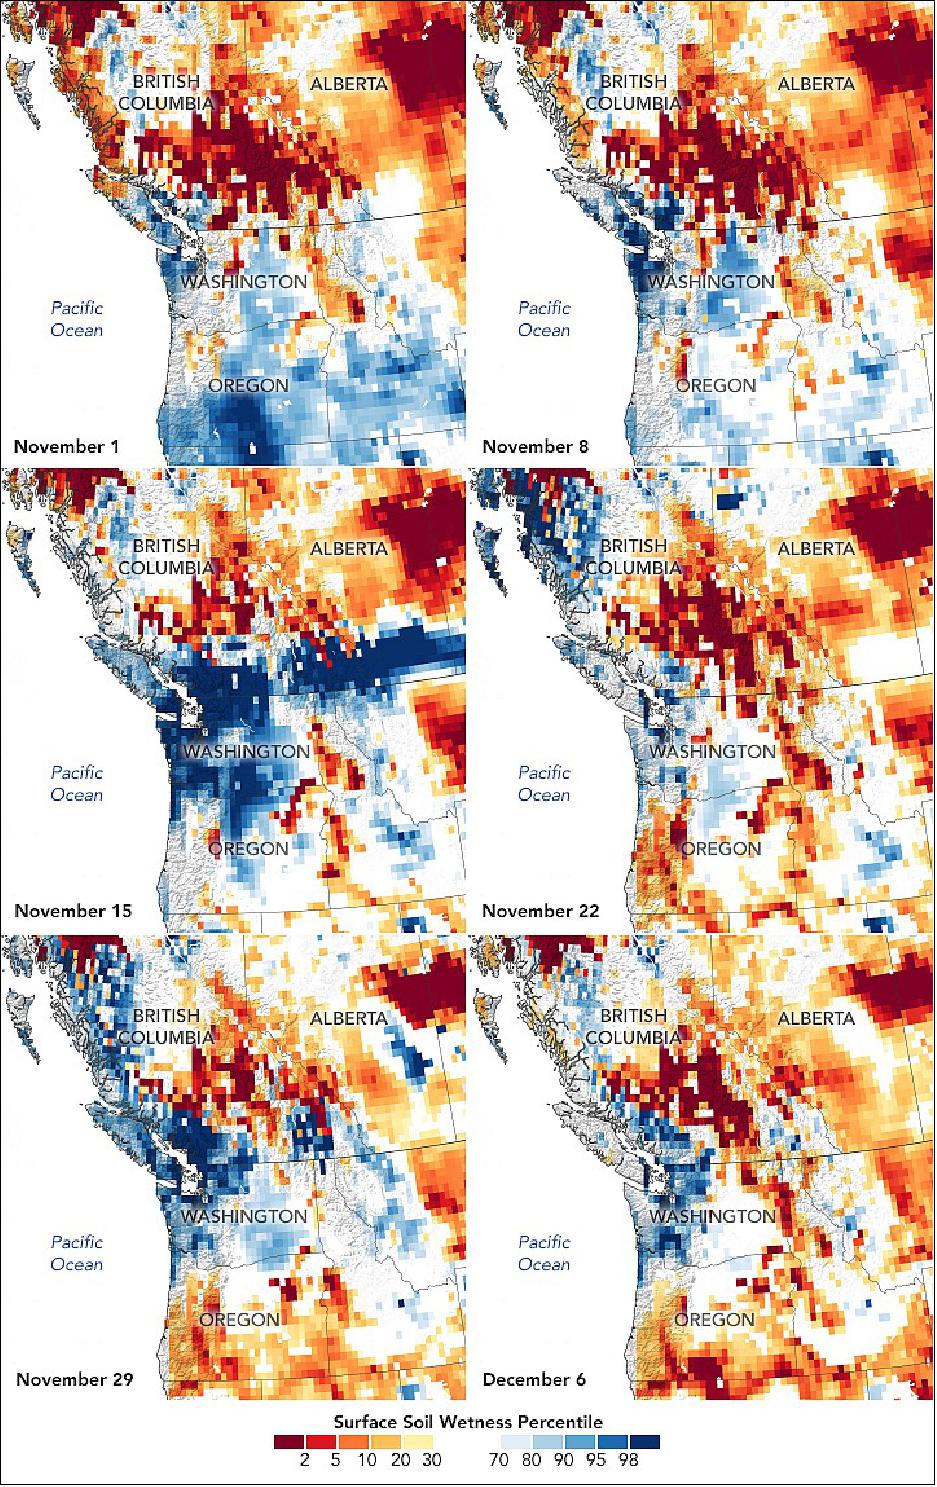
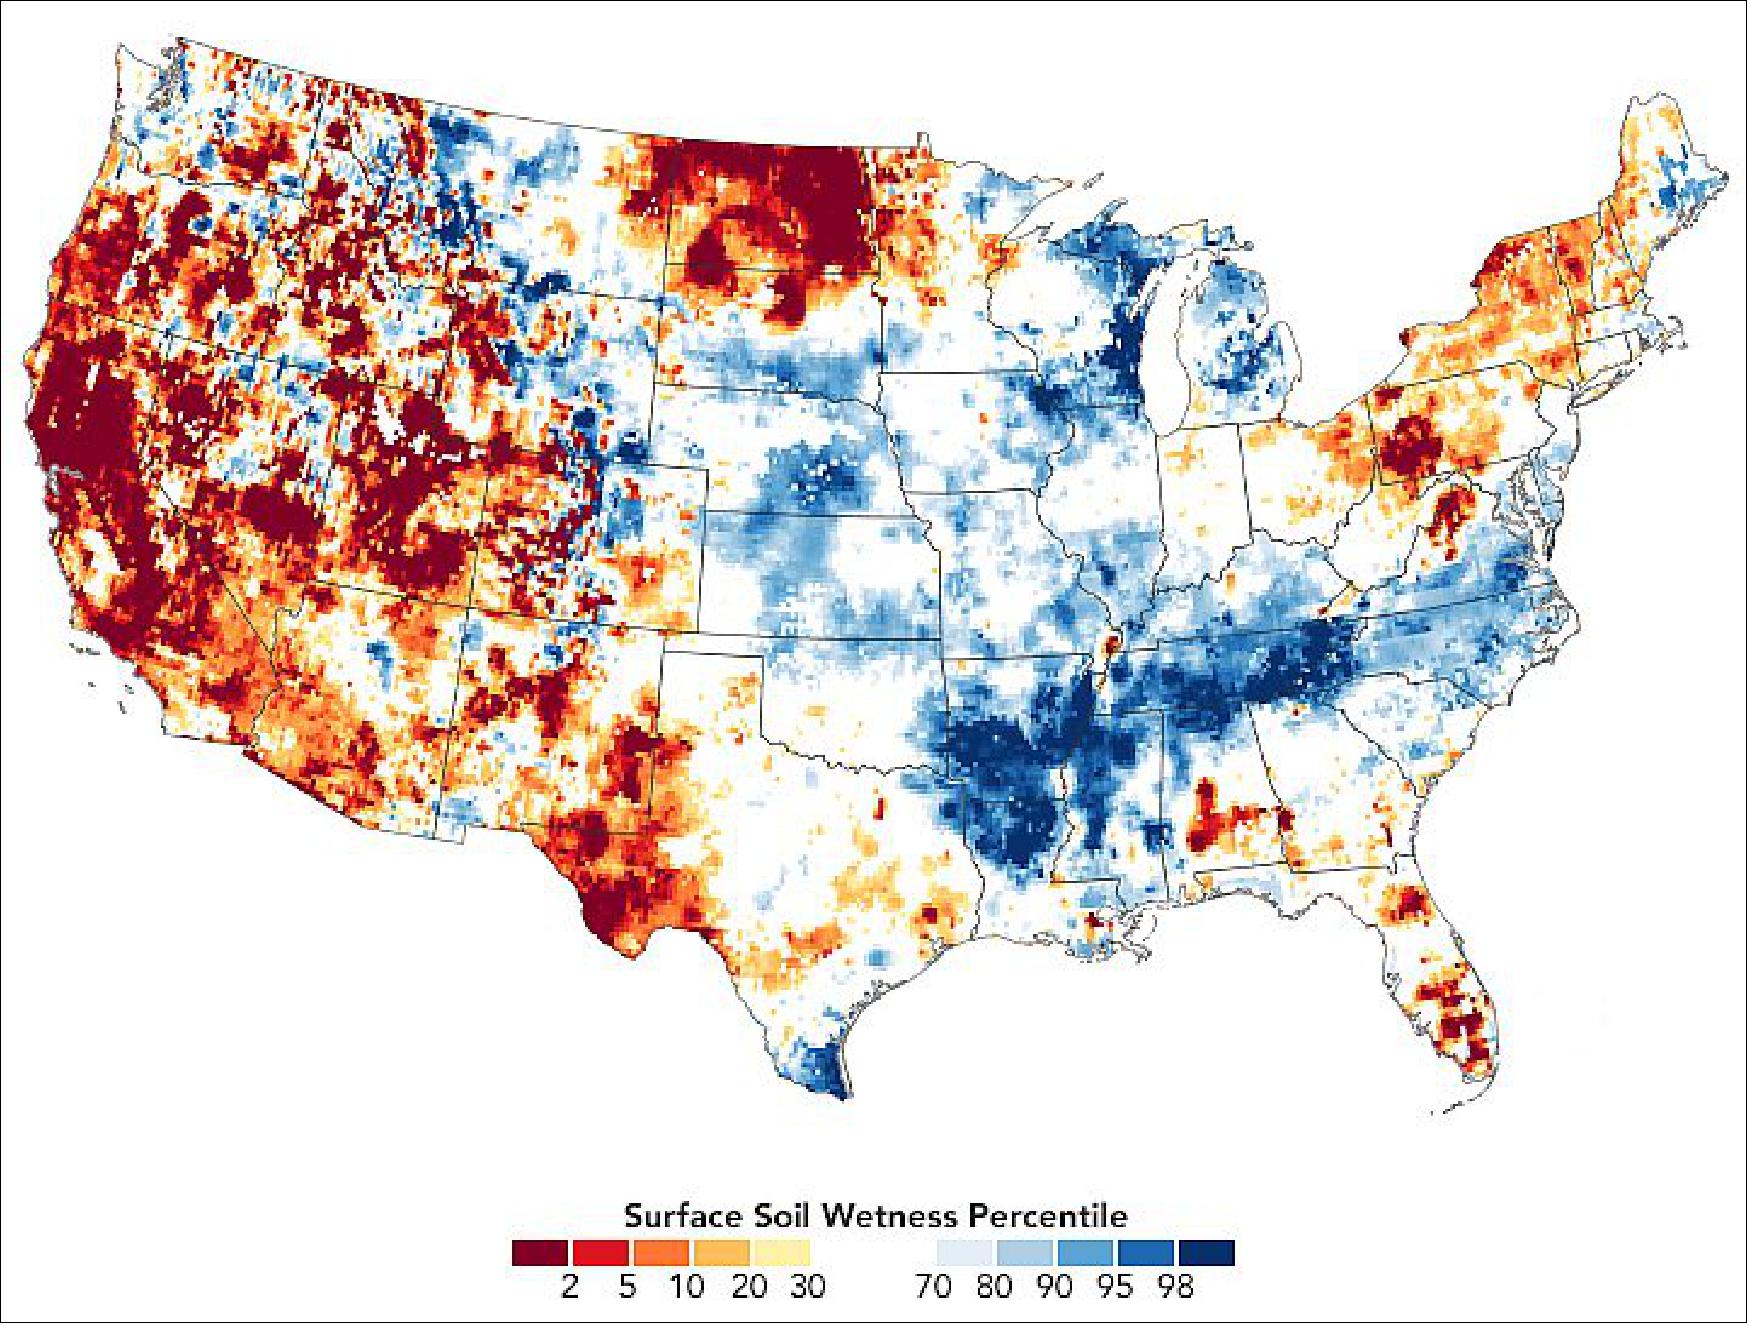
- These maps represent the moisture in the top 2 cm (0.8 inches) of soil. Moisture in this layer—and slightly deeper in the root zone—can fluctuate significantly over short periods of time. Unlike deep groundwater aquifers, surface layer soils are quickly replenished by rainfall. Notice the vast expanse of wetter-than-usual (dark blue) soils on November 15, the third day of a potent storm. The narrow bands of moisture missed some locations, especially inland areas, where surface soils stayed drier than usual (orange and red) throughout the month.
- Surface layer soils are also the first to dry out. Notice that by November 22, parts of western Washington and southern British Columbia do not look quite as wet. But the parade of storms kept coming, with three atmospheric rivers pouring into the region within a week in late November.
- Soils generally stayed soaked throughout the record-wet season. Ground-based observers in Seattle recorded about 48 cm (19 inches) of rain from September through November—the largest amount since records began in 1945. Just over 25 cm (10 inches) fell in November alone, raining on all but five days of the month. Farther north, a record 37.01 cm (14.57 inches) fell in Bellingham, Washington. In British Columbia, the cities of Vancouver, Victoria, Nanaimo, and Abbotsford all broke records for September-November rainfall. Some areas in B.C. are still cleaning up and rebuilding after the storms and floods devastated homes, roadways, and farmland.
- When soils are already saturated, additional rainfall can pose an even higher risk for flooding and mudslides. Looking ahead, a hazards outlook issued on December 7 by the Climate Prediction Center of the U.S. National Weather Service noted: “Following a wet November when precipitation averaged 150 to 200 percent of normal, many river levels across northwest Washington are running above the 95th percentile. Due to the ongoing antecedent wetness and heavy rainfall (3 to 5 inches) forecast during the next week, a flooding possible hazard is posted for northwest Washington. This flooding risk may persist throughout week 2, since above-normal precipitation is favored to continue in this region.”
• May 27, 2021: NASA scientists have studied 17 years of gravity observations of our planet to understand how the global water cycle is changing. 27)

- The rate at which plants and the land surface release moisture into the air has increased on a global scale between 2003 and 2019. These processes are collectively known as evapotranspiration, and a new NASA study has calculated its increase by using observations from gravity satellites.
- By gauging the mass change of water between the oceans and the continents, the researchers determined that evapotranspiration’s rate of increase is up to two times higher than previous estimates. This is important because evapotranspiration represents a critical branch of the global water cycle – a cycle that creates the conditions for life on land.
- While it is known that a warming climate should increase the rate of evapotranspiration, accurate global measurements have, until now, been elusive.
- “Our study found that evapotranspiration has increased by about 10% since 2003, which is more than previously estimated, and is mostly due to warming temperatures,” said Madeleine Pascolini-Campbell, a postdoctoral researcher at NASA’s Jet Propulsion Laboratory in Southern California, who led the study. “We hope that this information about the water cycle will help to better inform the development and validation of climate models.” 28)
- But how does the rate of evapotranspiration affect the global water cycle? As moisture from the oceans circulates through the atmosphere, a portion falls as precipitation over the continents. Some of this water goes into rivers as runoff, and some seeps into soils. The remaining water evaporates from the land and transpires from plants back into the air.
- Finding that evapotranspiration is increasing at a faster rate than previously known has implications for understanding how climate change could impact Earth in the future. As the world warms, evapotranspiration will accelerate, speeding up the drying of land and vegetation. Weather patterns can also be affected: Increased evaporation from land can create droughts in some regions. This is a symptom of a warming world that can have major consequences for ecosystems and human societies as stress on surface and groundwater supplies increases.
- “Images of melting glaciers and shrinking ice sheets are a palpable way for us to understand the impacts of global warming,” said Pascolini-Campbell. “But dramatic changes are also happening to other key components of our planet’s water cycle that aren’t so visible, such as when water evaporates from the land before it can enter the rivers as runoff.”
The Gravity of Water
- To get a global estimate of how evapotranspiration is changing, researchers found a new way to leverage data collected by the pair of Gravity Recovery and Climate Experiment (GRACE) satellites that operated from 2002 to 2017, and the successor pair, GRACE Follow-On, that launched in 2018. The GRACE mission was launched by NASA and the German Aerospace Center (DLR), and GRACE-FO is a partnership between NASA and German Research Centre for Geosciences (GFZ).
- Because water has mass and therefore contributes to the Earth’s gravity signal, these spacecraft are exquisitely sensitive to the movement of water around the world, from tracking changes in ice sheets to water stored on land to variations in ocean mass. Seeing an opportunity, the researchers studied the 17-year dataset from GRACE and GRACE-FO to see if it was possible to tease out the gravitational signal associated with the movement of water by evapotranspiration.
- “With the combined record of GRACE and GRACE-FO, we now have a long-enough observational record to be able to monitor these critical signs of global change,” said J. T. Reager, a JPL scientist and an investigator on the study. “When the gravity signal decreases, it means the land is losing water. Some of that loss is through rivers flowing back into the oceans, but the rest of it goes up into the atmosphere as evapotranspiration.”
- By subtracting all the water mass outputs from the inputs over land and then calculating the residual mass of water, the researchers were able to estimate the rate of evapotranspiration. They did this by subtracting independent estimates of global river discharge (in other words, the rate of water flowing through rivers to the ocean) and GRACE and GRACE-FO satellite data (that reveal the local changes in water mass on and in the ground) from global precipitation measurements to find out the mass of water being lost to the atmosphere.
- Due to observational and measurement challenges, global estimates of evapotranspiration are typically approximated using models or by taking measurements from individual locations and then scaling those measurements up. But these methods can be prone to error. By measuring global mass changes using gravity satellite observations, however, the researchers were able to get a more precise estimate for the rate of global evapotranspiration.
- Using this method, they found that evapotranspiration increased from 405 mm (about 16 inches) per year in 2003 to 444 mm (about 17.5 inches) per year in 2019. That represents an upward trend of 2.30 mm (about 0.1 inches) per year –a 10% increase – with a corresponding uncertainty of 0.5 mm (0.02 inches) per year, or 2%.
- “For years, we’ve been looking for a way to measure gross changes in the global water cycle, and finally we’ve found it,” said Reager. “The magnitude of the evapotranspiration increases really surprised us: This is a sizable signal indicating our planet’s water cycle is changing.”
- These results add to a growing body of research about our planet’s water cycle while also underlining the importance of continuity for Earth observations. Continuous satellite observations by satellites with a global view of water mass changes provide the long record necessary to observe the changing planet over the decades. These observations also help scientists track year-to-year variability in the water cycle caused by climate change and natural cycles.
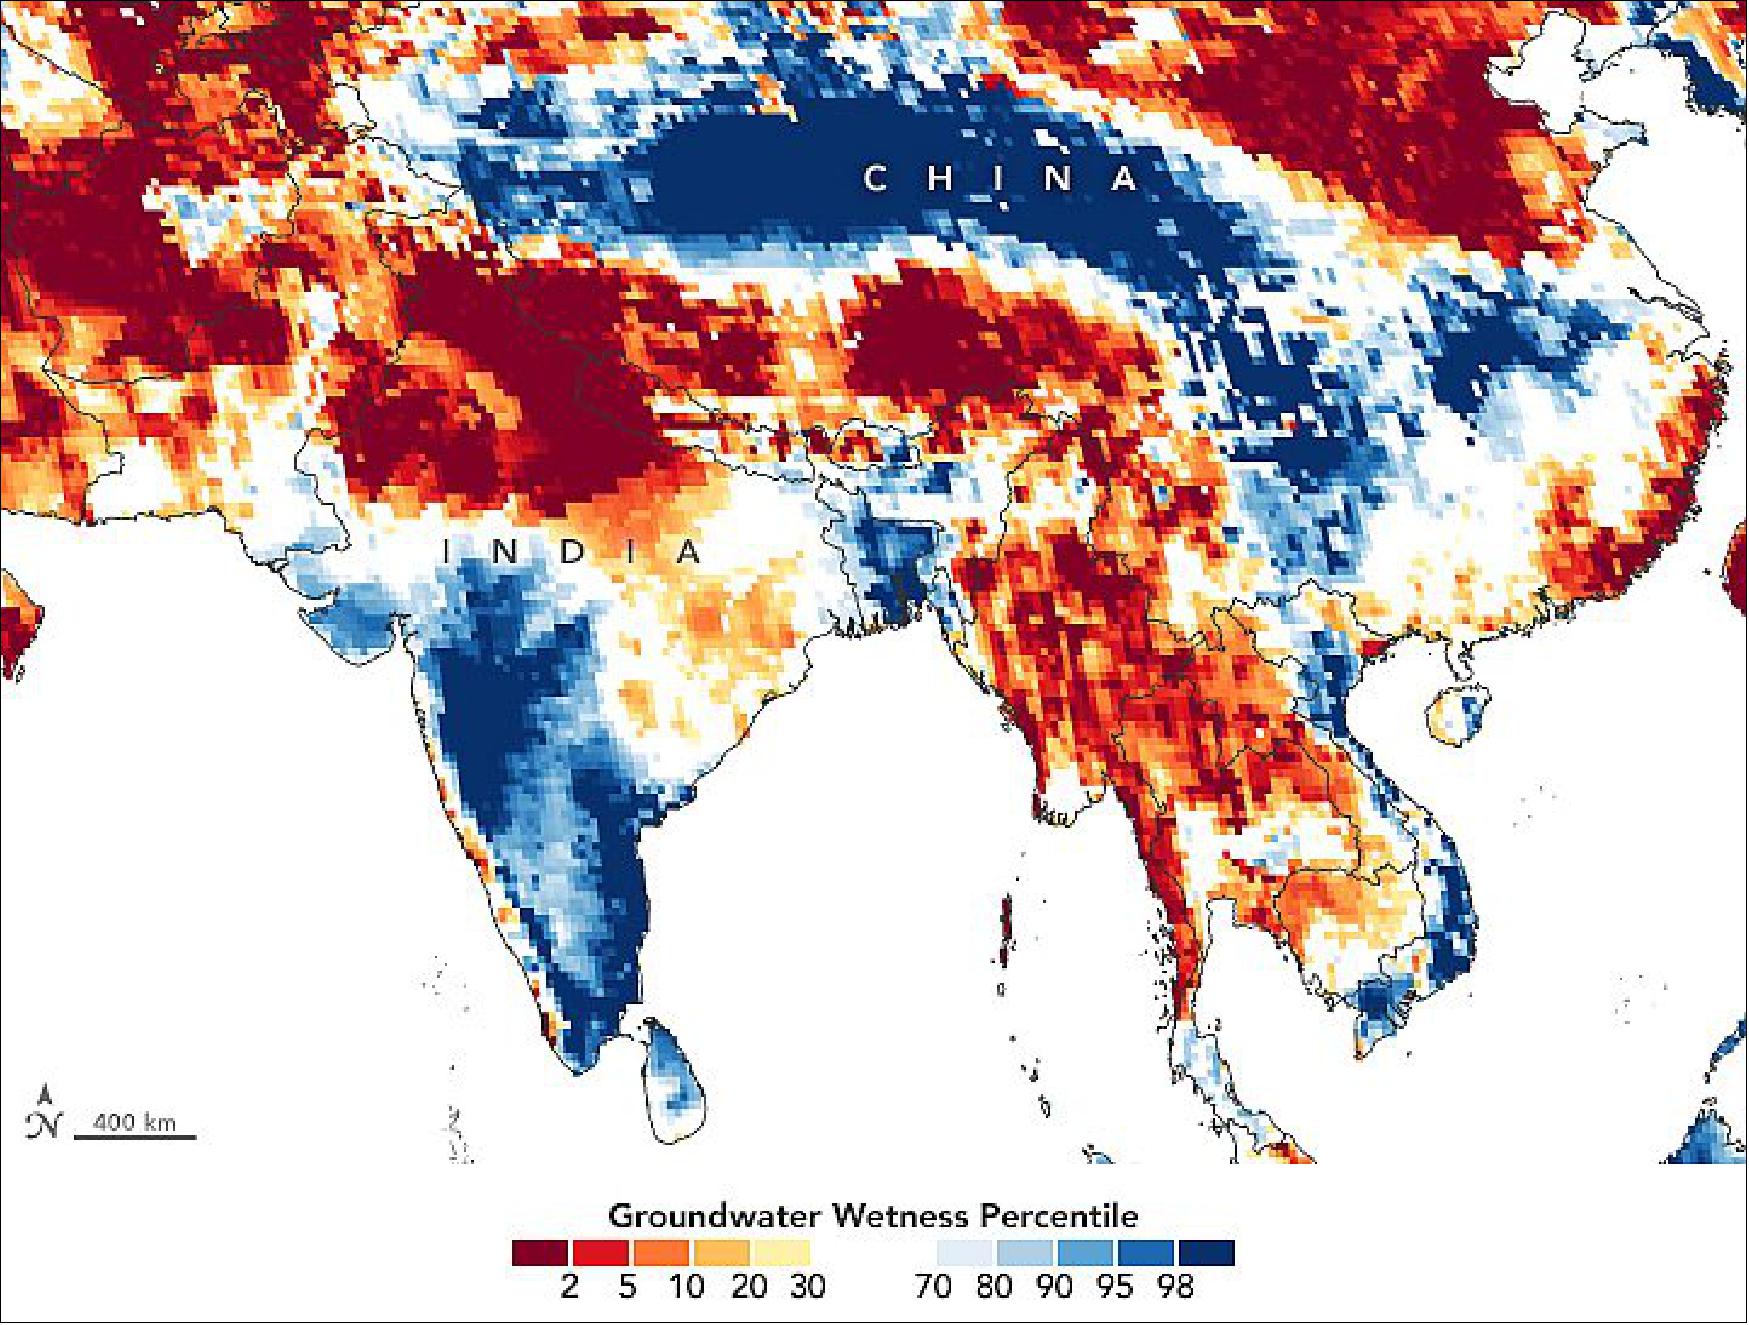
• April 21, 2021: As farmers and backyard gardeners know, plants grow best when they are watered just right—not too little, not too much. A growing number of South Asian farmers are now optimally irrigating their crops thanks to engineers, cell phones, and satellite data. The new tool is helping farmers simultaneously maximize their yield and conserve water. 29)
- Water sustainability, food security, and farmers’ livelihoods are all at stake in South Asia, so it is critical to end overwatering. Faisal Hossain, an environmental engineer at the University of Washington, and colleagues are harnessing free and open satellite data to help local farmers water just right.
- In research published in March 2021 in Water Resources Research, Hossain and colleagues demonstrated that a staggering amount of groundwater could be saved if a satellite-based irrigation advisory system is deployed to alert farmers who are overwatering crops. In the demonstration project, the team found that SMS text message advisories could potentially save as much as 80 million cubic meters of water in India and 150 million in Pakistan.
- While modern irrigation has largely offset the unpredictable nature of weather that once vexed farmers, the effective “rain-on-demand” achievement comes with a cost: water use by the food sector now accounts for some 60 to 90 percent of global freshwater use. In countries with monsoon-dominated flood-then-drought weather patterns, year-round farming is particularly reliant on groundwater extraction.
- “Water scarcity is a big issue in South Asia and in most places around the world,” Hossain observed. “If you look at data, the 800-pound gorilla of water use is the food sector.” Previous research has shown that an unsustainable amount of water has been pumped out of the ground in South Asia in recent years. At the same time, crops are often over-watered, lowering yields and squandering a precious resource.
- The University of Washington team is working closely with water and agriculture bureaus of South Asia to decrease wasteful irrigation. They developed an Irrigation Advisory System (IAS) that uses free and open data to assess where crops need less or more water. They tested it with 100,000 farmers in the region.
- The multi-step process starts with satellite gravimetry data from the GRACE-FO (Gravity Recovery and Climate Experiment-Follow On), which offers a qualitative synopsis of current groundwater conditions. This water storage information allows the IAS to identify regions where groundwater depletion trends are the most alarming and persistent.
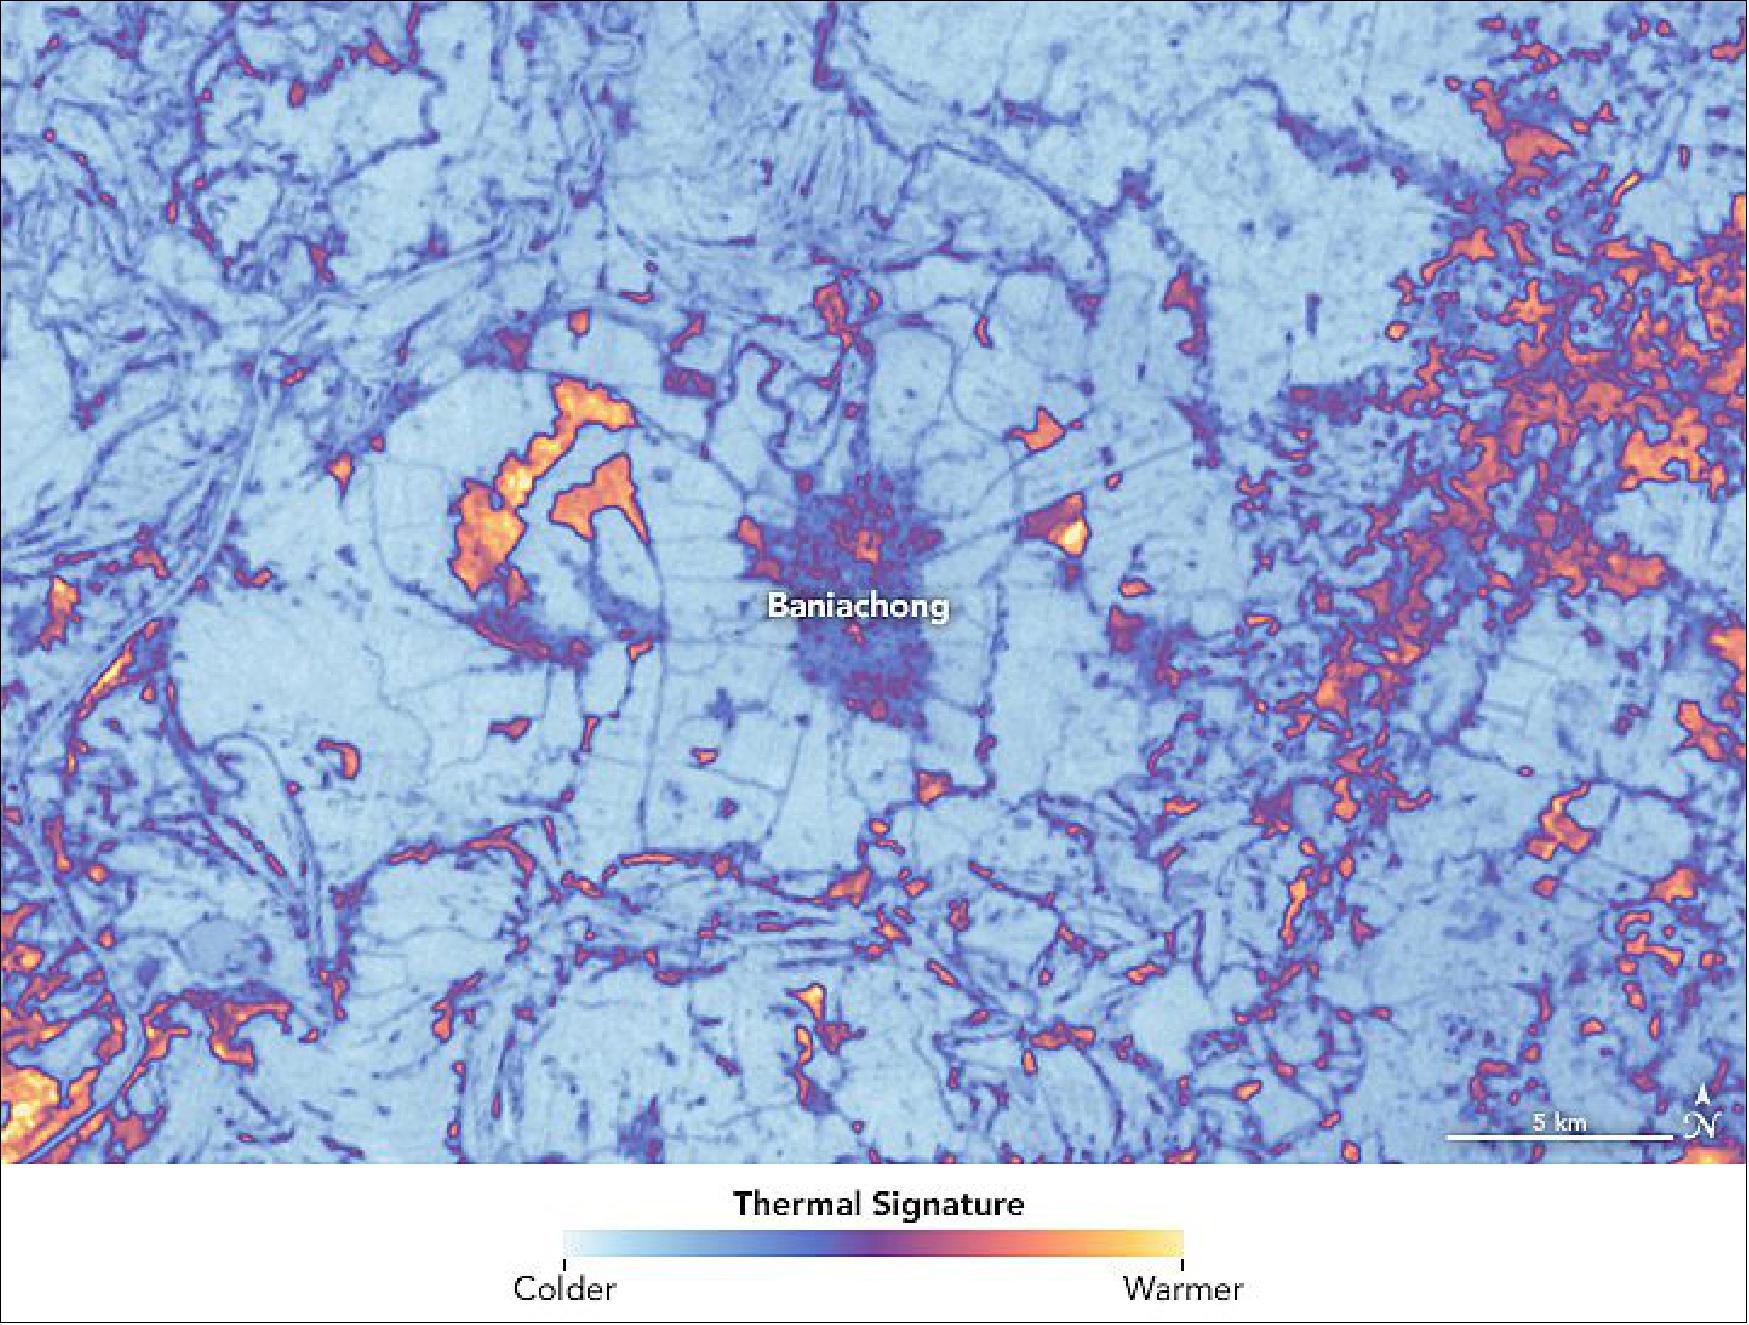
- The next step is to estimate the amount of water needed by certain crops, and then use Landsat’s Thermal Infrared Sensor (TIRS) to find overwatering farms. The images at the top of this page shows Baniachong, Bangladesh, northeast of Dhaka.
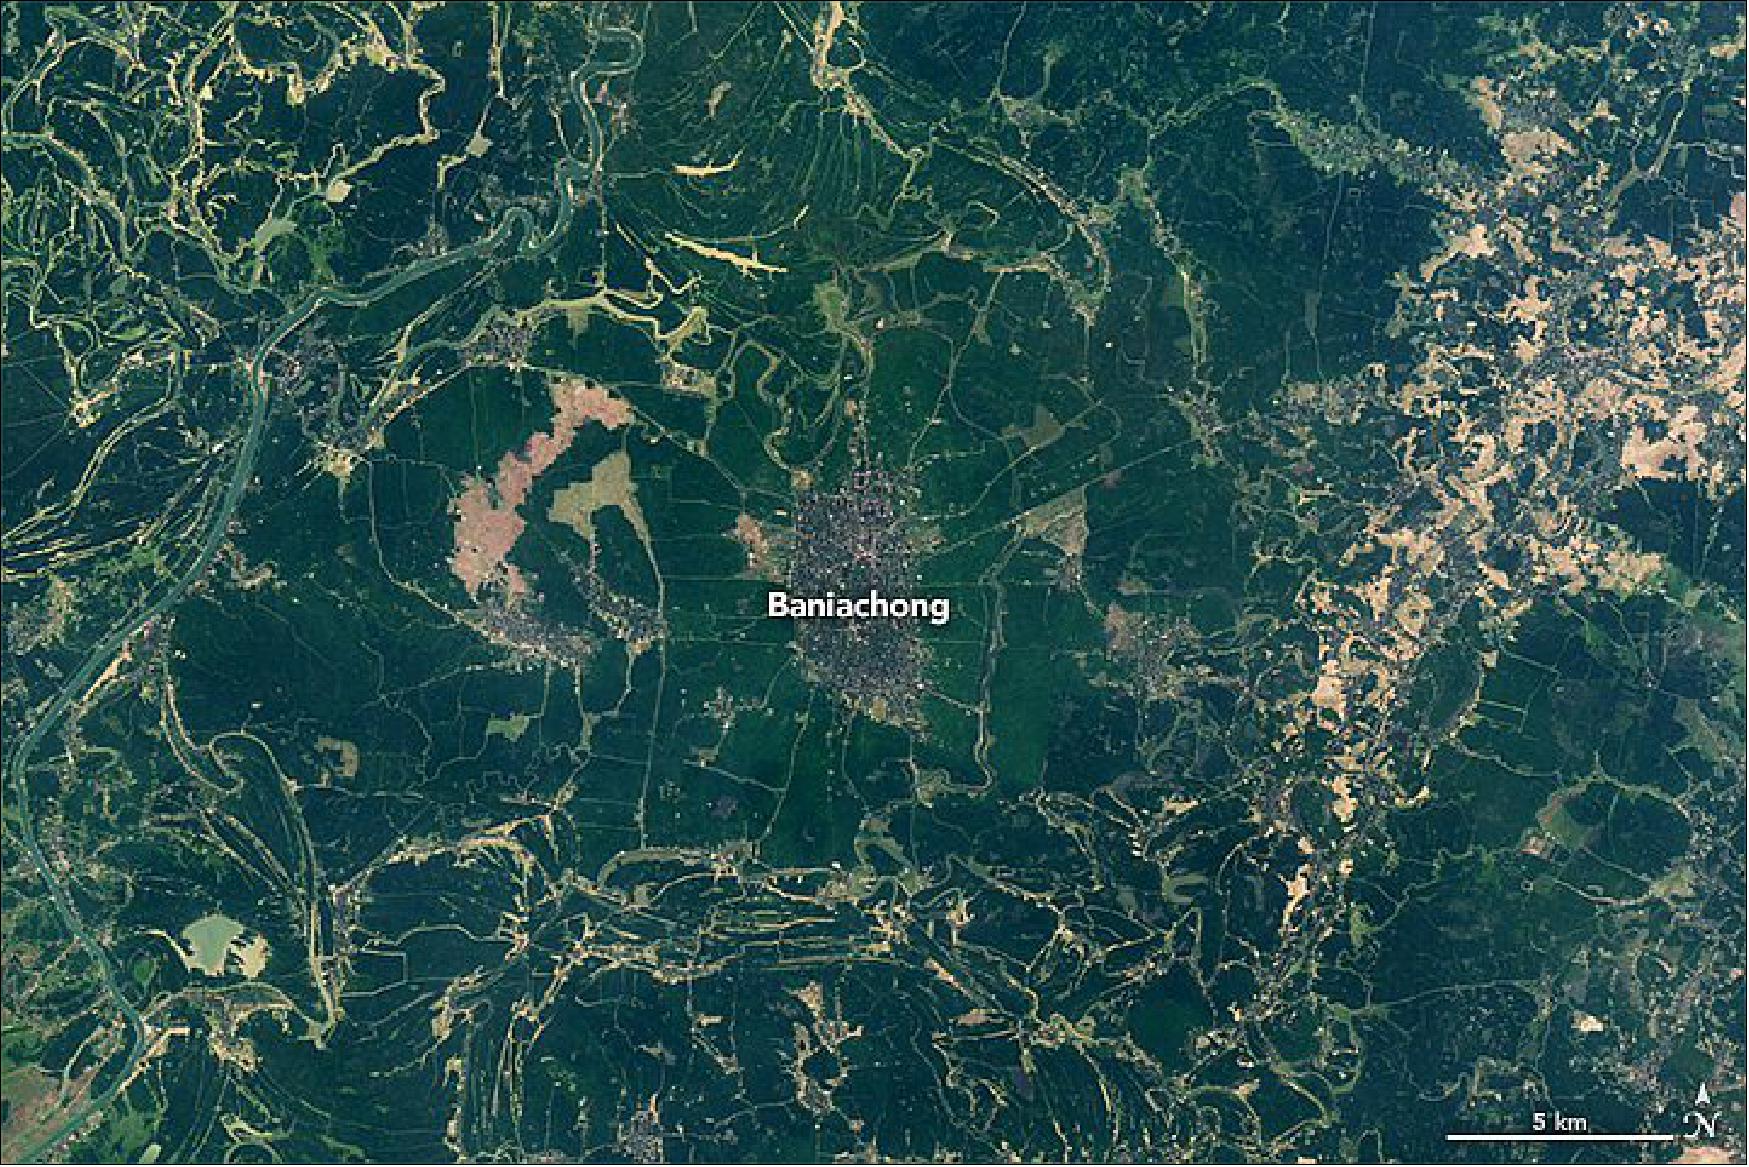
- From this thermal data, the team can calculate the amount of evapotranspiration—the movement of moisture and heat from the land to the air as the surface warms and plants “breathe.” Knowing the level of evapotranspiration helps Hossain and colleagues derive the amount of water being spread by farmers on their fields. When the amount of water used for irrigation is 20 percent higher than the amount needed—taking into consideration weather conditions and the crop growth stage—the farmers receive text messages from IAS that their fields that are being excessively irrigated.
- “I think this is a human rights issue for farmers to have free access to science-based best practices,” Hossain noted. “If we want to talk about water sustainability, we have to make agricultural water use as efficient as possible by growing more with less water. Even if we can improve by just 1 percent, it translates to huge savings in water, more than what entire nations consume for domestic needs.”
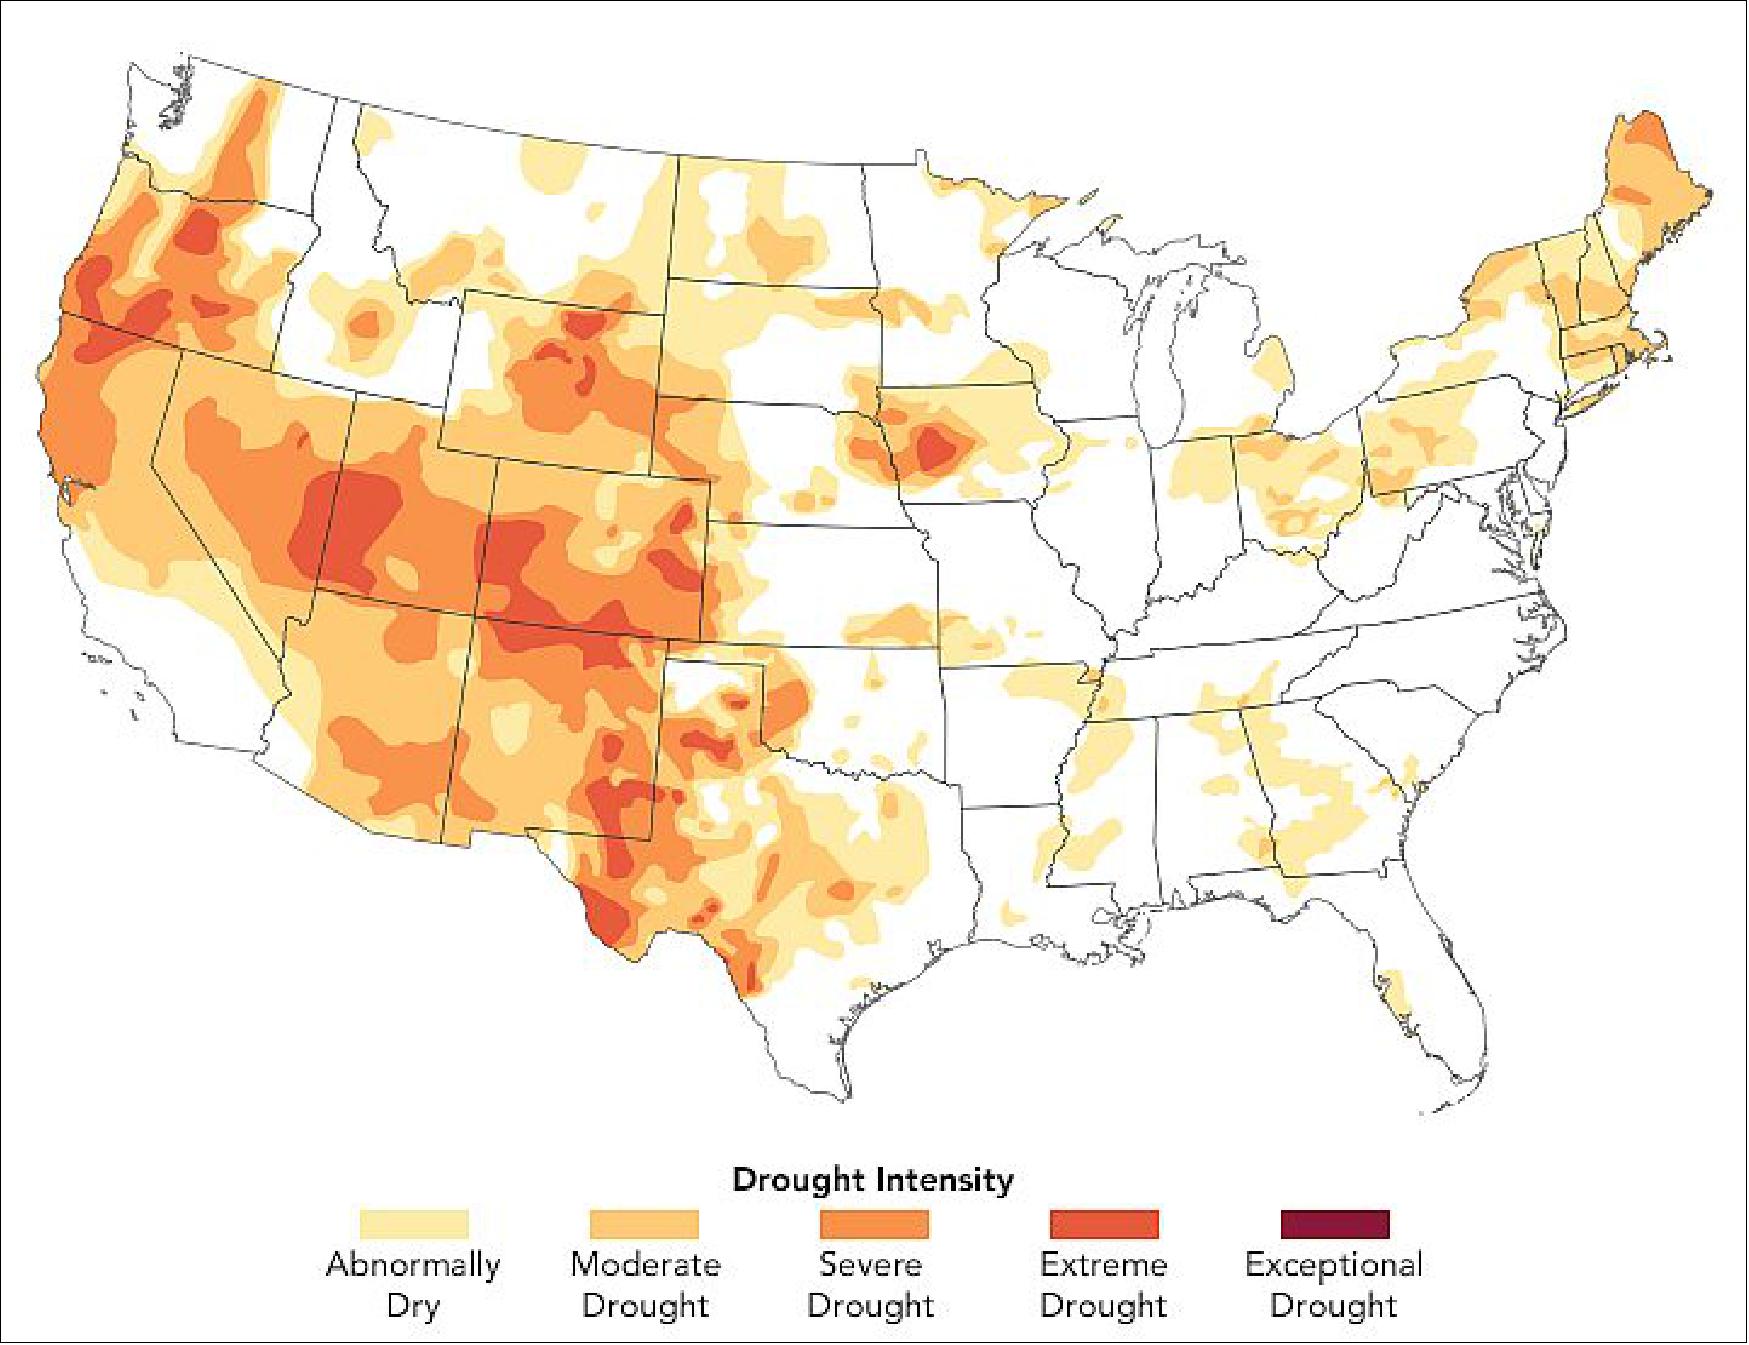
• April 1, 2021: Almost half of the United States is currently experiencing some level of drought, and it is expected to worsen in upcoming months. Experts say the dry conditions could put a strain on water supplies and have important effects on the environment, such as increasing susceptibility to fire this summer. 30)
- The hardest hit areas are in Arizona, Utah, Nevada, Colorado, and New Mexico, where severe to exceptional drought developed in 2020 and persisted through winter. A weak summer monsoon season and ongoing La Niña conditions have stifled precipitation. La Niña is characterized by cooler than normal sea-surface temperatures in the central and eastern tropical Pacific Ocean. The associated weather patterns can push the jet stream north and cause it to curve, diverting storms and precipitation away from the region.

- In California, many of the state’s reservoirs are currently below historical averages due to an absence of strong winter storms and below-average snowpack in the Sierra Nevada. As of March 2, the state closed out its fifth consecutive month with below-average rain and snow.
- The current event fits the pattern of a long megadrought episode over the past two decades. A recent study showed 2000-2018 has been the driest period in the U.S. Southwest since the late 1500s.
- “The larger megadrought and this event are certainly not independent of one another,” said Andrew Badger, an author of the study and researcher at NASA’s Goddard Space Flight Center. “While the megadrought period is primarily focused on the southwest U.S., the current drought outlook also has a larger spatial extent as it extends farther east towards the Great Plains.”
- NOAA (National Oceanic and Atmospheric Administration) announced in its spring outlook that warmer-than-average temperatures this spring, below-average precipitation, and low soil moisture could lead drought conditions to expand in the Great Plains and southern Florida. Winter wheat crops already took a hit from a severe cold outbreak in February.
- “As with any extreme event, pinning down the root causes can be challenging. The important thing to remember is the underlying conditions of the megadrought that are present now were present for the 2012-2013 drought,” said Badger. “These conditions can prime the surface for drought events to become more extreme when the right atmospheric conditions arise.”
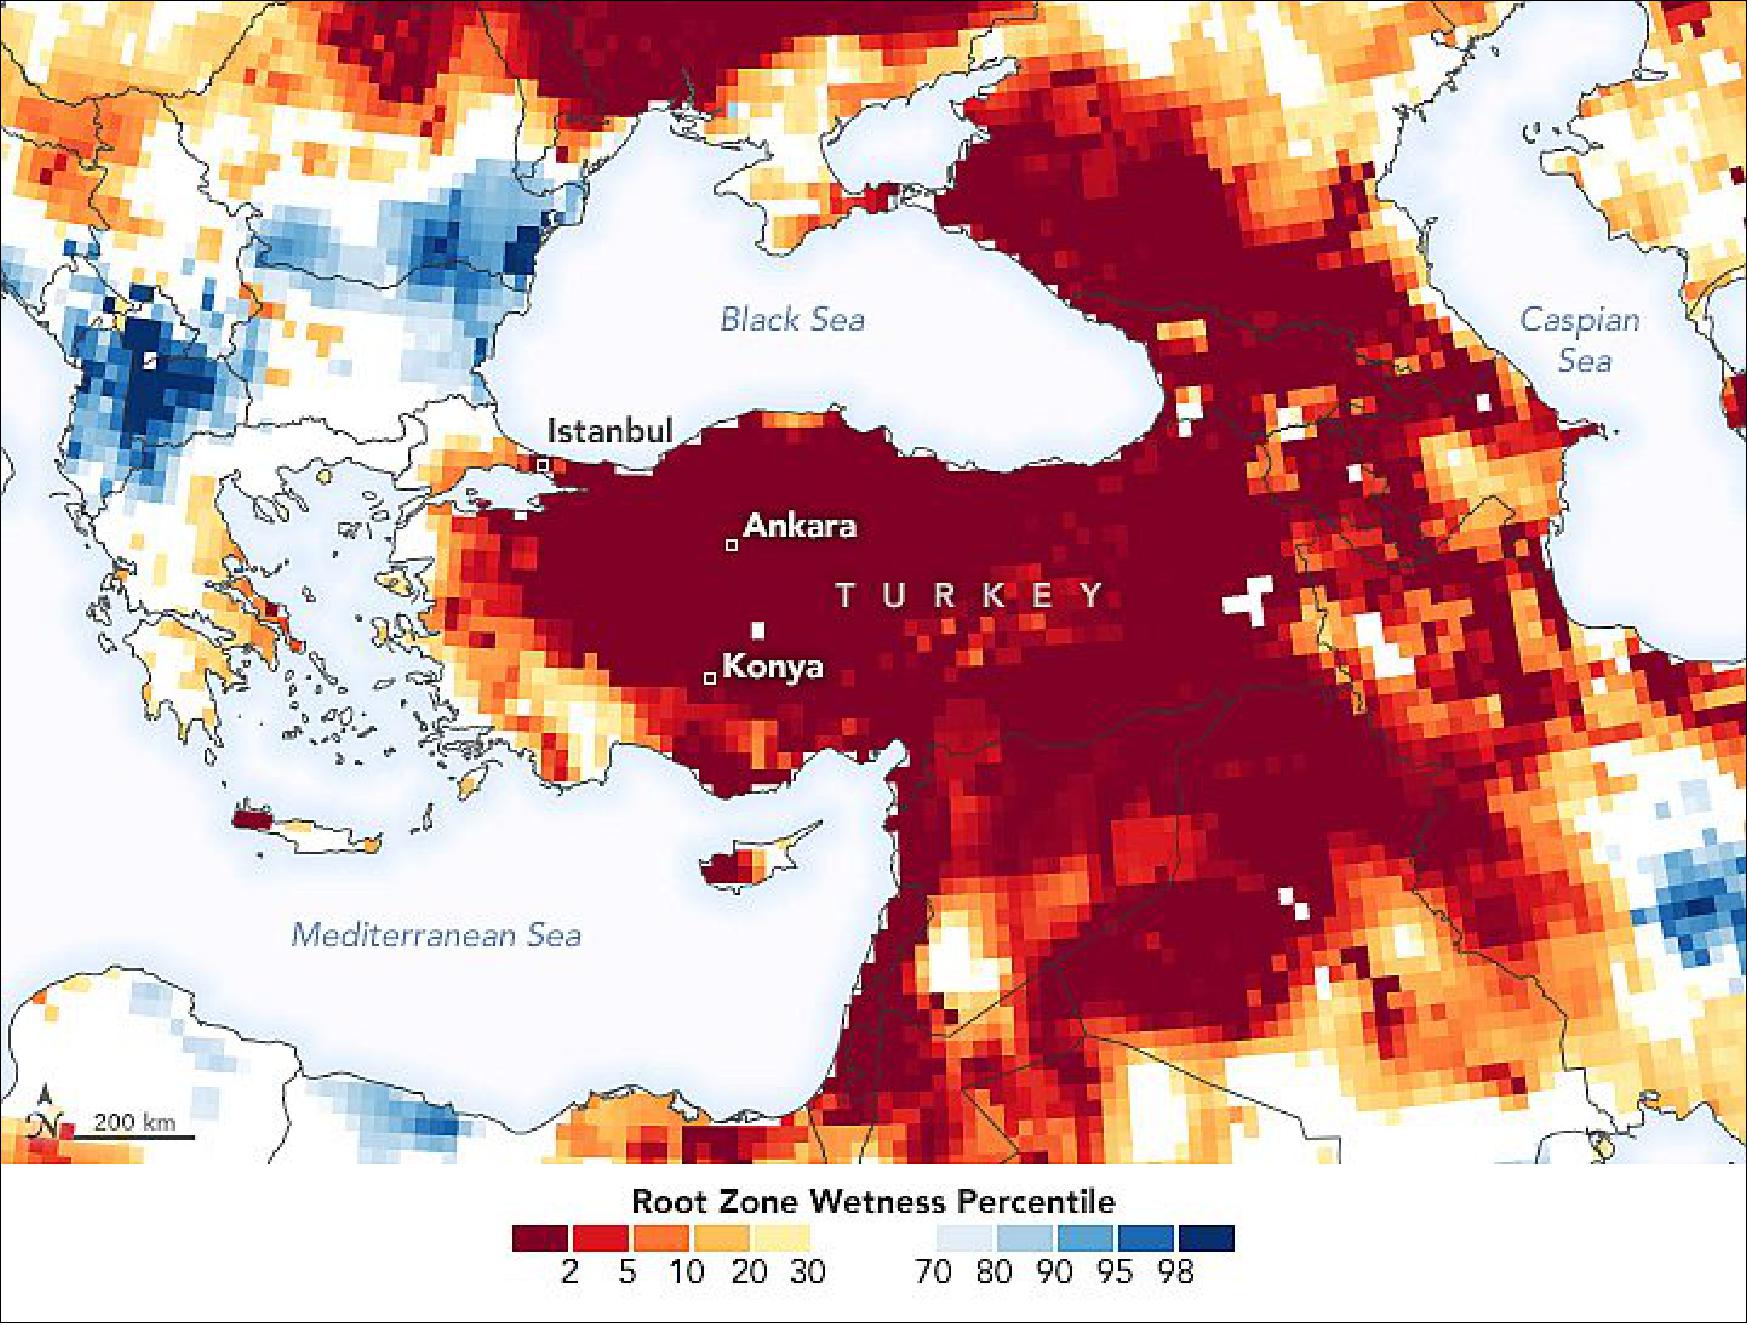
• January 16, 2021: As 2021 begins, most of Turkey is experiencing severe drought. Numerous reservoirs around Istanbul—the country’s most populous city (15 million)—have reached their lowest water storage levels in 15 years. Crop production could be threatened if conditions persist. 31)
- The dry conditions come after several seasons of low rainfall. In 2019, the summer and autumn months were mostly devoid of rain, and water levels in reservoirs dwindled. Then 2020 was the driest of the past five years, with notably little rainfall in the latter half of the year. Since July 2020, nearly all provinces in Turkey received below-average rainfall nearly every month. From October to December, precipitation across the country was 48 percent lower than the average for 1981-2010.
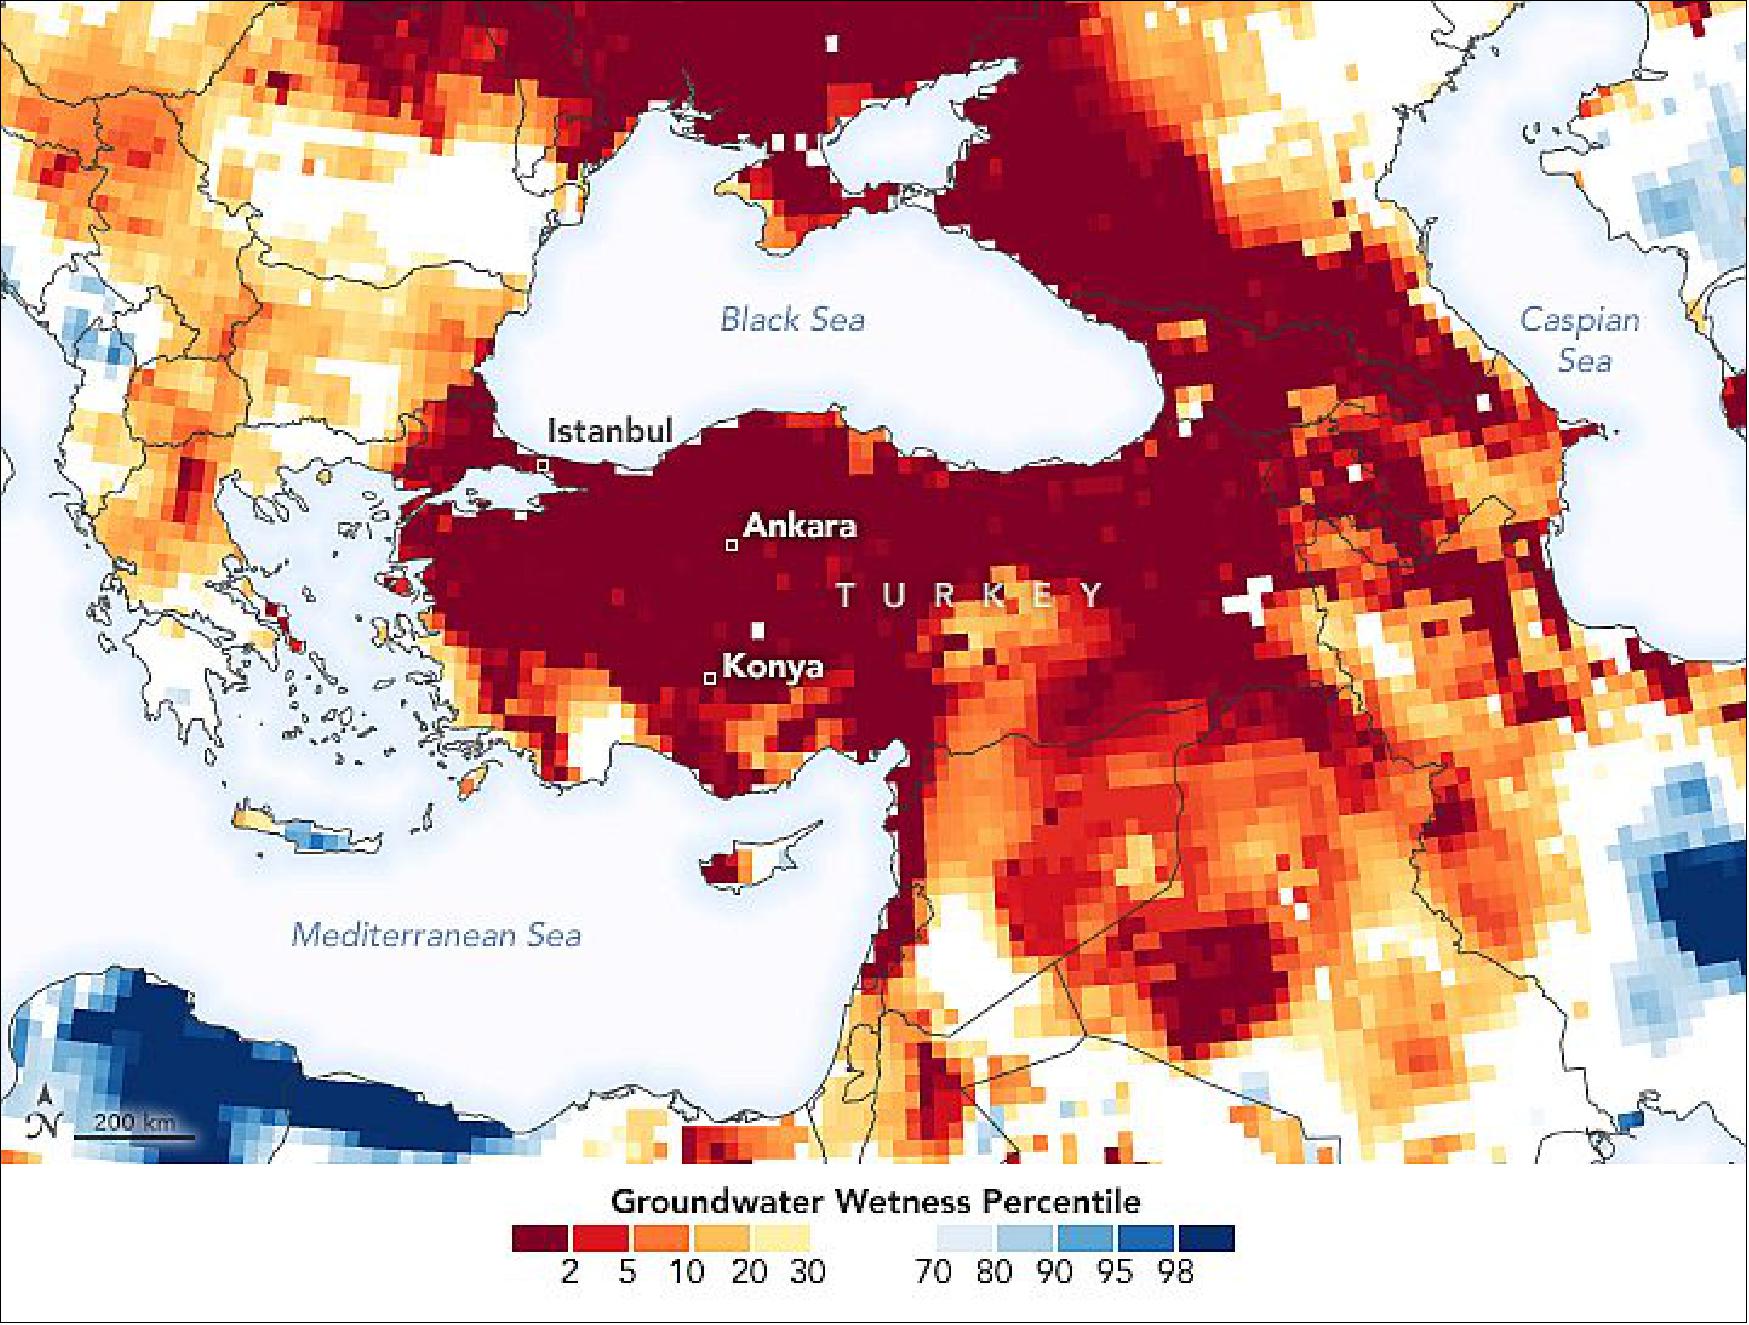
- Groundwater in aquifers is an important resource for crop irrigation and drinking water in many countries, and it also can sustain streams during dry periods. Groundwater take months to rebound from drought, though, as it has to be slowly and steadily replenished by surface moisture that seeps down through soil and rock to the water table.
- Due to the lack of rain and high water demands, officials said Istanbul could run out of water in months if current conditions continue. As of January 13, 2021, storage rates from at least seven reservoirs around Istanbul measured just below 25 percent.
- In the Konya Plain, farmers experienced about 38 percent less precipitation from July to December 2020 than the same time in 2019. The lack of rainfall in the past six months has dramatically reduced grain harvests and triggered drought alerts for farmers, leaving uncertainty for future crop production.
- Forecasts call for more rain in the second half of January 2021, but it would take extended, persistent rain to raise water levels to comfortable volumes. The mayor of Ankara warned that a continued lack of rain could cause a significant shortage by the summer.
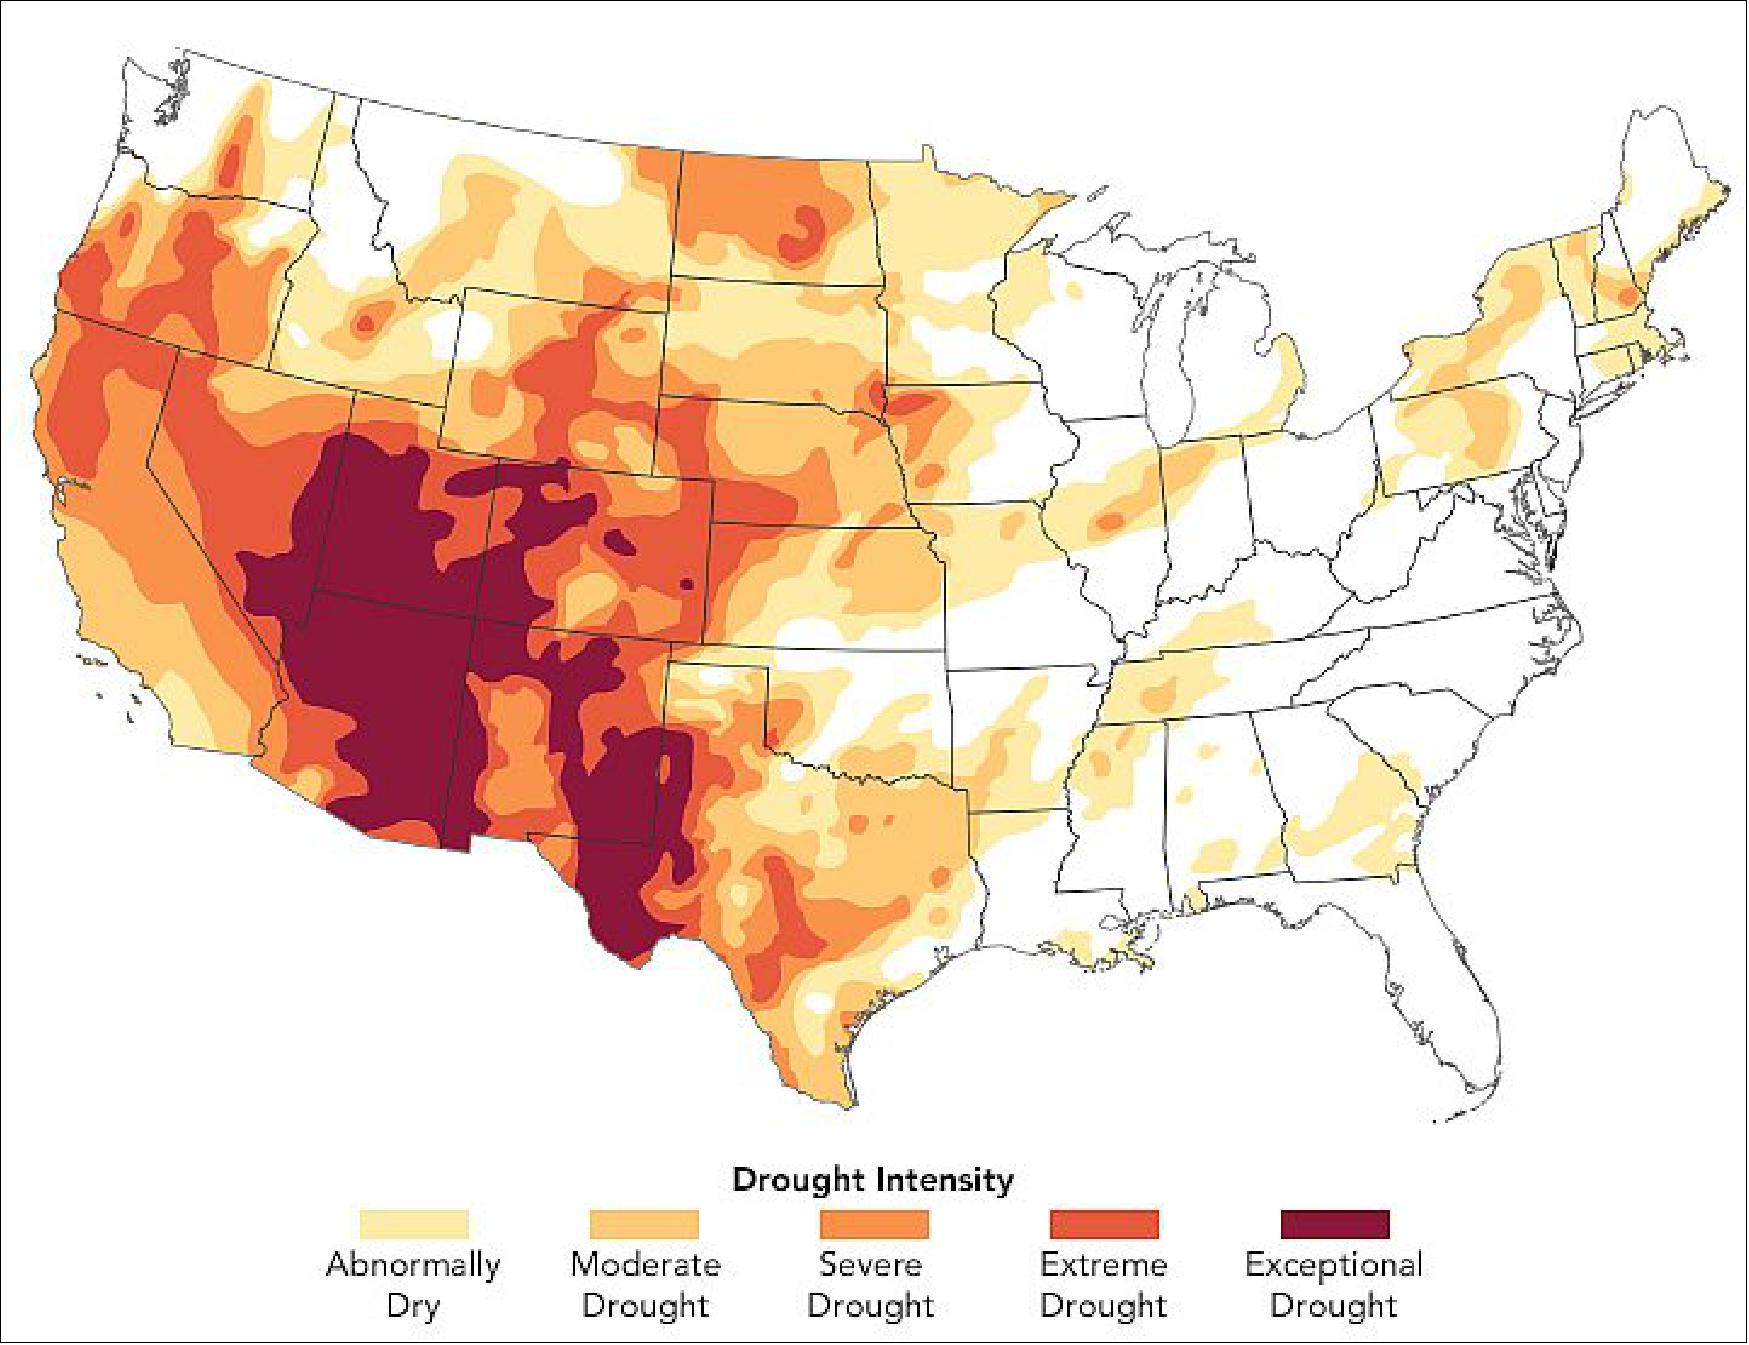
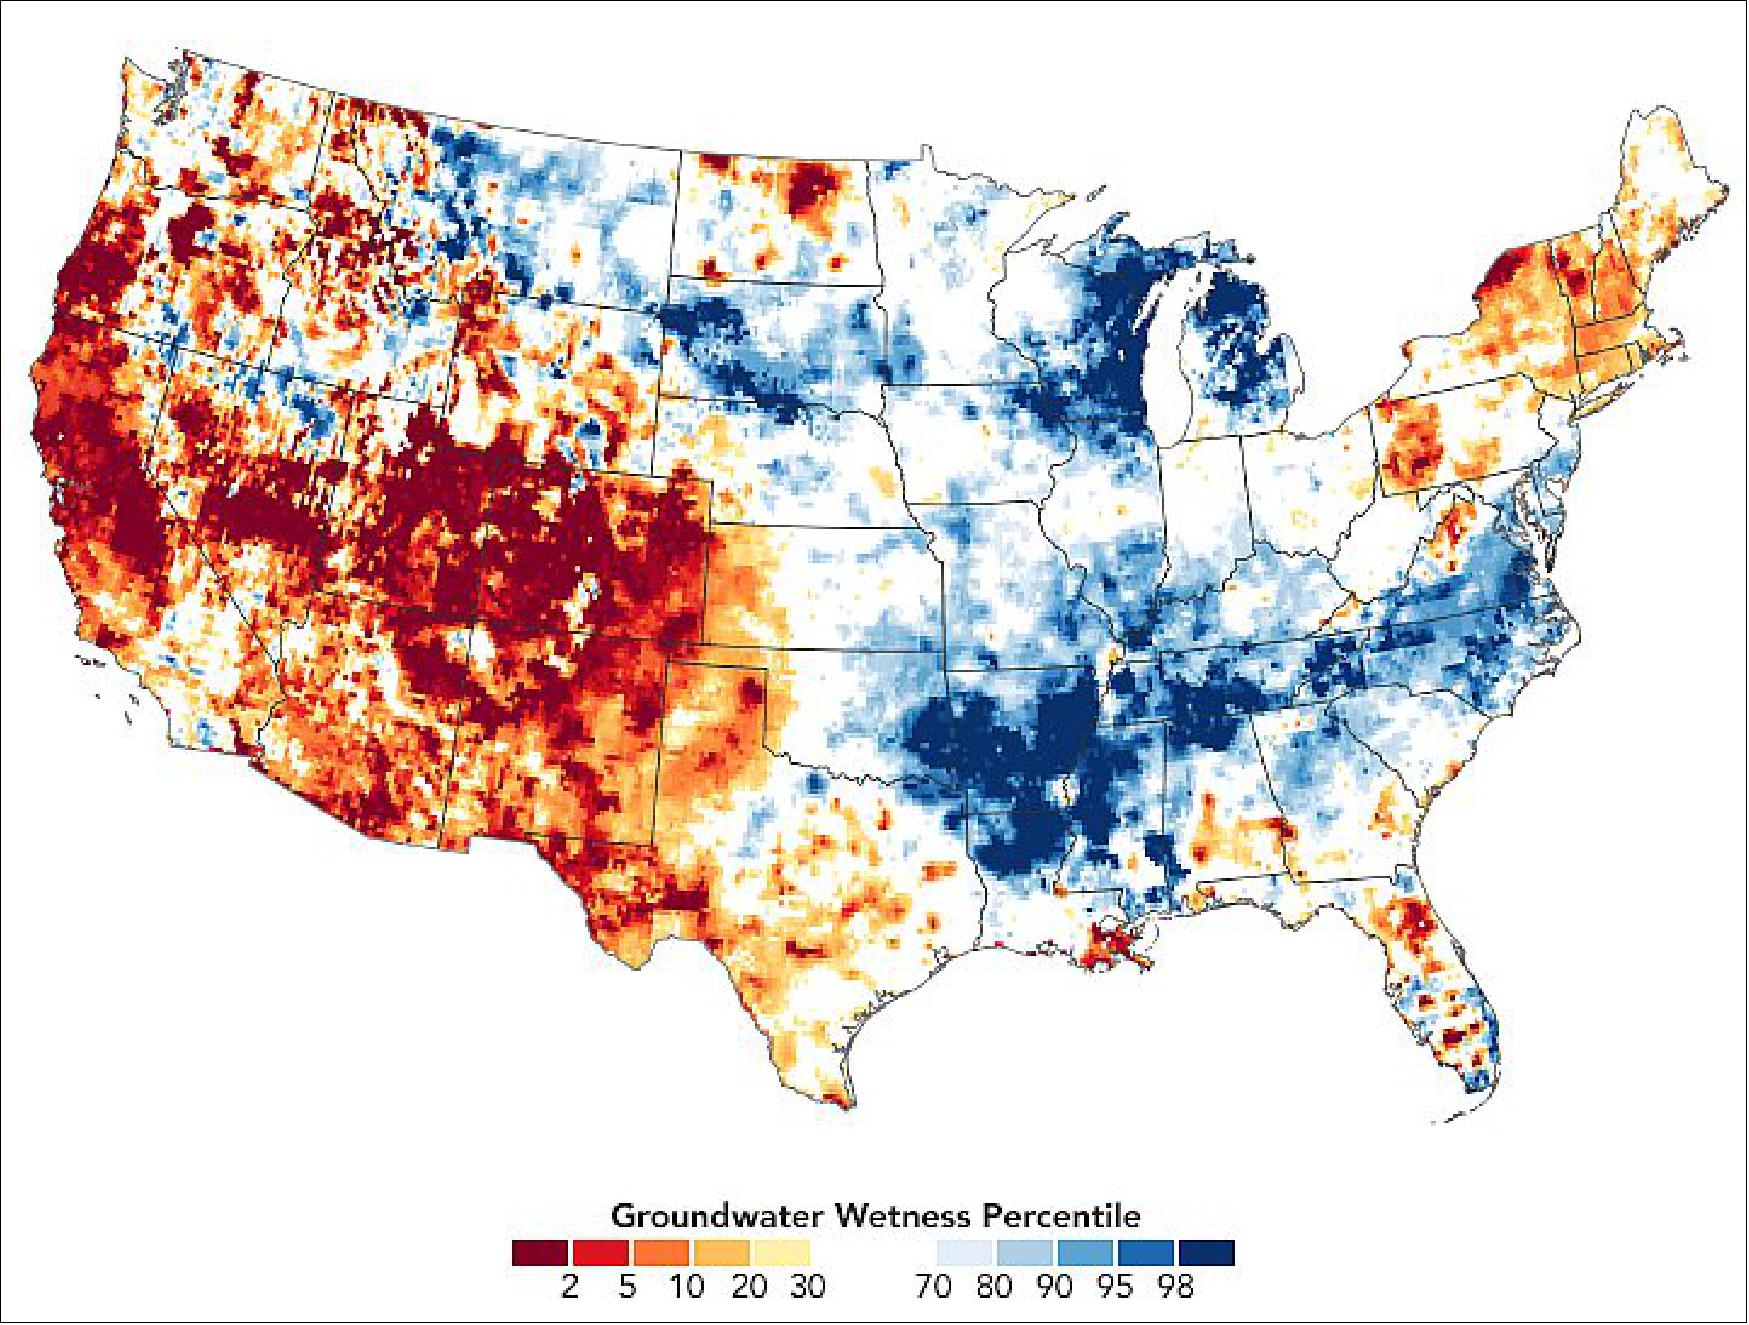
• December 14, 2020: A drought that flared up in the western United States in spring 2020 has expanded and intensified across the summer and fall. In August, a third of the United States was experiencing at least a moderate level of drought. By December, roughly half of that area was, with about 33 percent facing what the U.S. National Drought Monitor classifies as “extreme” or “exceptional drought.” Initially, Colorado, Utah, Nevada, and northern California faced the most severe conditions. Over the summer and fall, the drought intensified in Arizona and New Mexico and spread onto the Great Plains and Texas. 32)
- “Compared to late 2019 and early 2020, when there was very little drought in the continental United States, this is quite an extreme single-year event that developed rapidly over the course of 2020,” said Benjamin Cook, a climate scientist at NASA’s Goddard Institute for Space Studies. “But if you look over longer time scales, I would argue this is really a continuation of a multi-decadal event that began around 2000. There have been some breaks, but the Southwest has been in more-or-less continuous drought conditions since then.”
- The consequences of the unusually dry and warm temperatures in 2020 have shown up in a variety of ways. Several states, particularly California, have endured unusually active and destructive fire seasons. Some farmers have already seen—or anticipate—poor yields as they struggle with a lack of water for crops and livestock. Reservoirs, lakes, and streams in several areas are reaching unusually low levels.
- “The Southwest monsoon was underwhelming this year, and many places in that region rely on that precipitation as part of their water budgets,"” said Christopher Hain, a research meteorologist at NASA’s Marshall Space Flight Center. “Given the La Niña happening now, there is a higher-than-normal chance that winter rains will not help much and below-average precipitation will further exacerbate the drought. That could set the stage for even worse conditions next spring, summer, and fall.”
- La Niña—cooler than normal sea-surface temperatures in the central and eastern tropical Pacific Ocean—tends to cause dry weather in the Southwest U.S. The associated weather patterns push the jet stream north and cause it to curve, driving storms to the Pacific Northwest and the Great Plains instead.
- “The long-term, multi-decadal drought is largely driven by precipitation deficits connected to persistently cold sea surface temperatures in the eastern tropical Pacific—in essence a string of years with long-lasting and intense La Niñas,” said Cook. “However, there is strong evidence from climate models and centuries of tree ring data that suggest about one-third to one-half of the severity of the current drought can be attributed to climate change.”
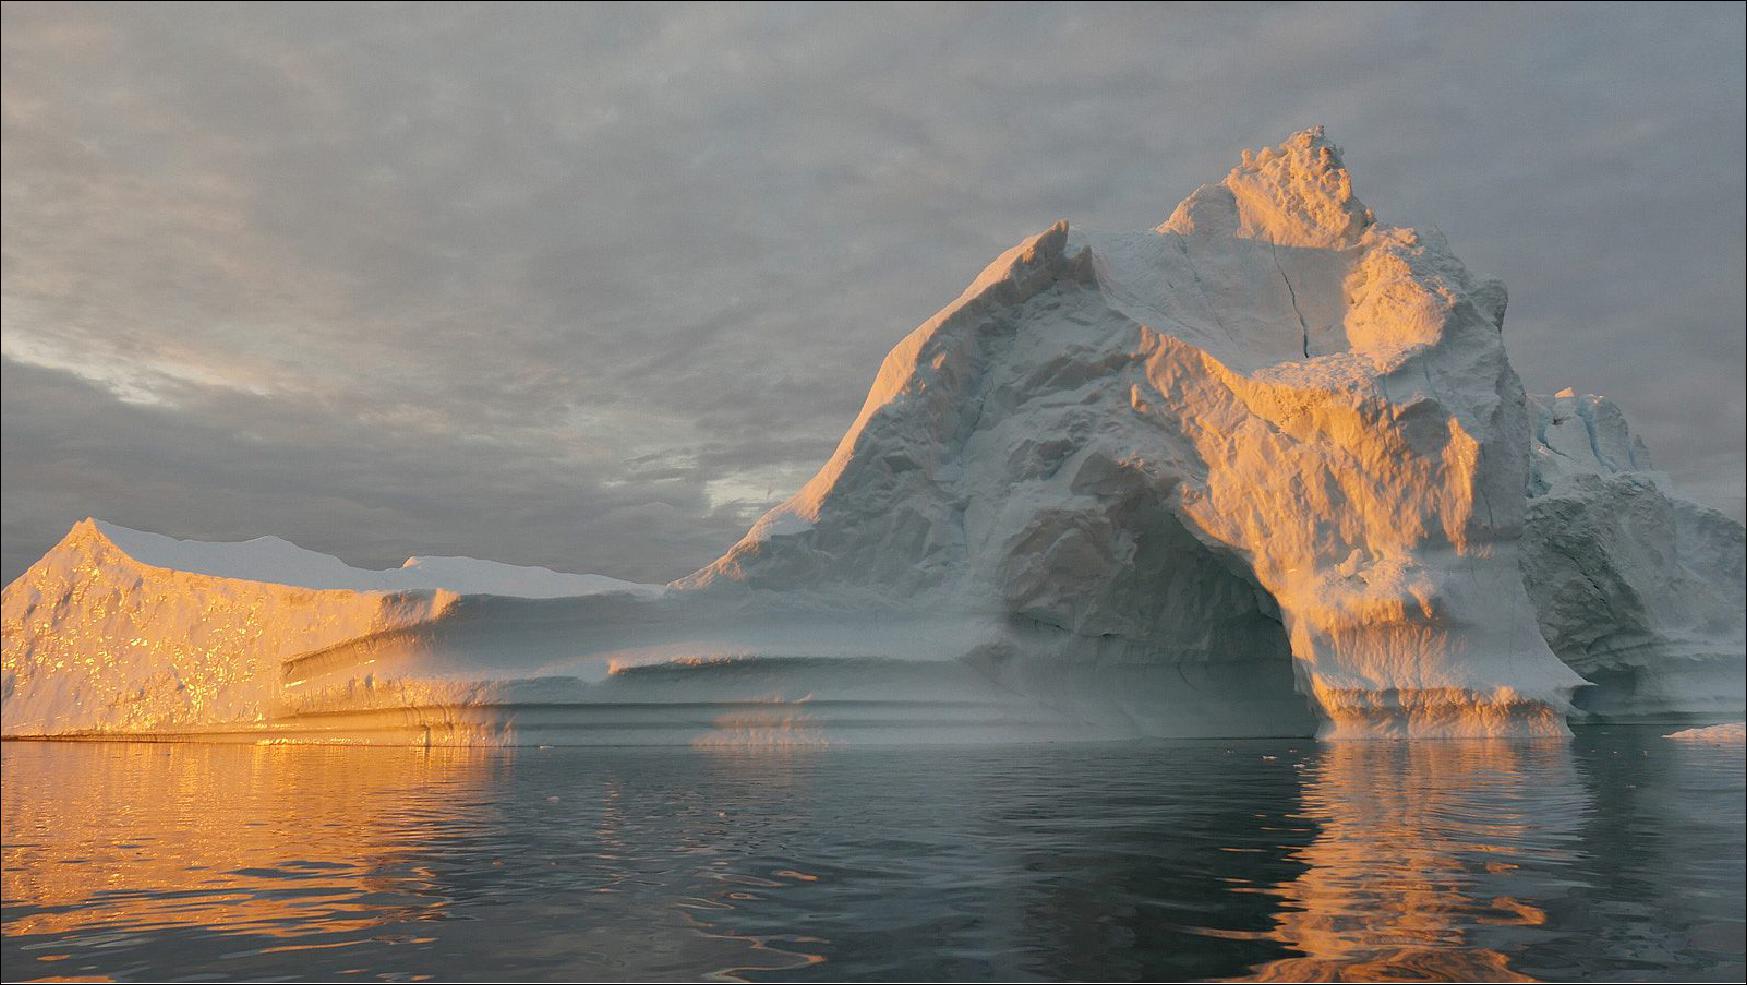
• November 11, 2020: Earth’s ice sheets and glaciers store a vast amount of water on land—as much as 69 percent of the planet’s fresh water, according to the U.S. National Snow & Ice Data Center. But when this ice melts and flows downslope, water once stored on land now contributes to the volume in the seas. 33)
- The planet’s seas have been rising for more than a century, with adverse effects such as increased coastal flooding, beach erosion, and saltwater intrusion into fresh groundwater supplies. There is more than one cause for the rise, but the largest contributor over the past few decades comes from the planet’s melting ice sheets and glaciers.
- One way to track how much sea level rise comes from melting ice sheets and glaciers is to measure how much mass they are losing. Scientists have been making repeat ground-based measurements at select sites for decades—an approach that continues today and extends important long-term records of change. Traditional field measurements are also important for calibrating models and for understanding what causes the changes observed by satellites. But research has shown that field measurements can overestimate ice loss when they are used to extrapolate over larger areas with few observations.
- In the past two decades, Earth-observing satellites have opened up new avenues for observing the planet’s changing ice masses and improving the frequency and coverage of measurements. The method that most directly measures the mass loss of glaciers and ice sheets is called gravimetry: scientists essentially “weigh” Earth’s ice by measuring its gravitational pull on a pair of satellites.
- The main tools for this measurement have been the Gravity Recovery and Climate Experiment Follow On (GRACE-FO) satellites—a joint mission launched in 2018 by NASA and the German Research Center for Geosciences (GFZ)—and GRACE, a predecessor mission between NASA and the German Aerospace Center (DLR) from 2002 to 2017. The twin satellites in each mission detect subtle shifts in Earth’s gravity field. The strength of gravitational forces is determined by mass, so changes observed in Earth’s gravity field indicate a redistribution of mass. Such increases or decreases can be caused by changes in groundwater storage or by the decay of ice sheets and glaciers.
- The GRACE missions each consist of two satellites at the same altitude, with one trailing the other in orbit by an average of 220 kilometers (140 miles), and orbiting Earth from pole to pole about 15 times a day. The key to the measurement is that the distance between the satellites varies ever so slightly depending on the mass of Earth’s surface below.
- For scientists who study how Earth’s ice contributes to sea level rise, these general “mass anomaly” maps are useful, but not enough. Starting early in the first GRACE mission, scientists worked to isolate which gravity anomalies were caused by the mass of ice, as opposed to other factors such as the mass of mountains below the ice sheet. Once scientists had a few years of observations, they could begin to see how the mass of ice was changing.
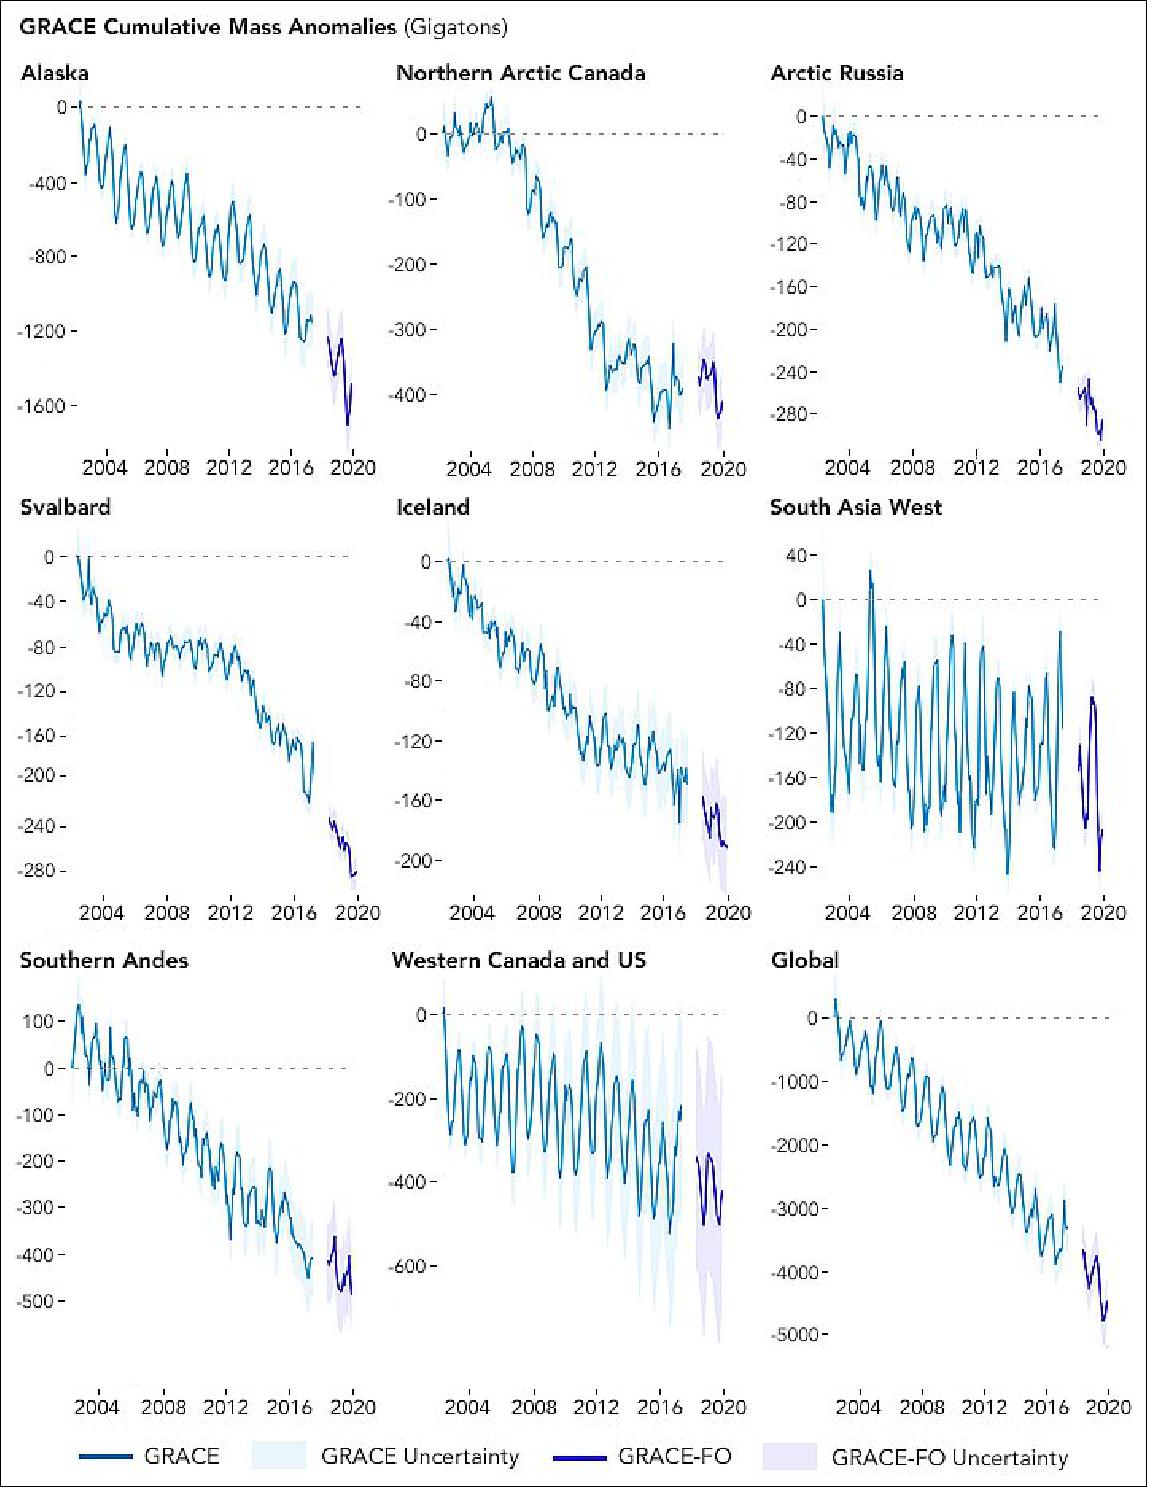
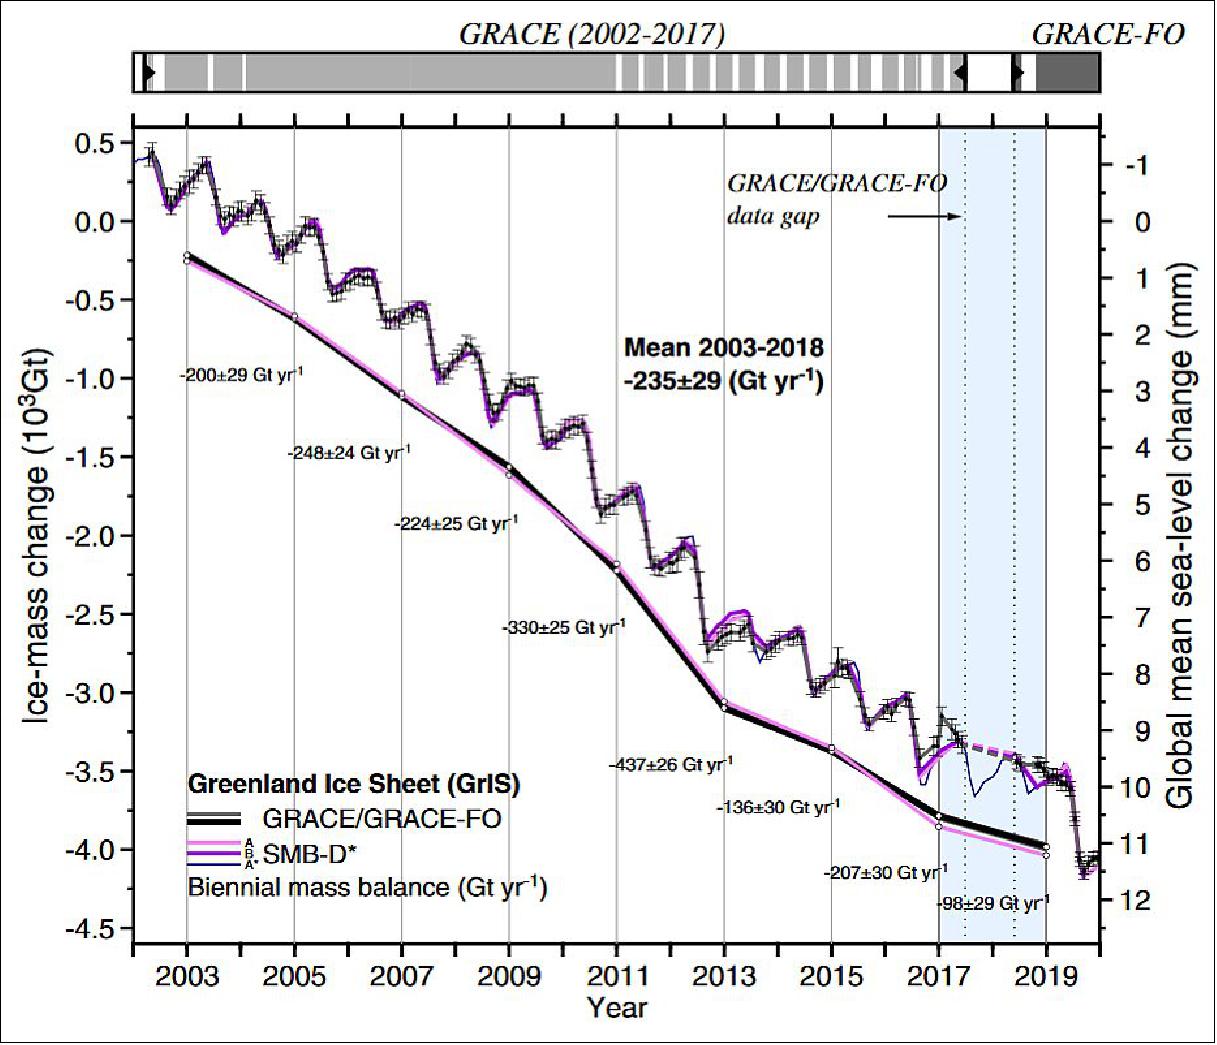
- Scientists now routinely use GRACE to study mass changes at the planet’s largest ice sheets in Greenland and Antarctica. From those measurements, they can calculate “sea level equivalent.” Changes in the mass of ice sheets and glaciers are typically measured in gigatons (Gt). They have figured out that the melting or calving of 1000 gigatons of land ice into the ocean raises global sea level by 2.8 millimeters.
- More recent GRACE-FO data indicate that Greenland has continued to lose a tremendous amount of ice. In just two months during the exceptionally warm summer of 2019, the island lost 600 gigatons of ice—more than double the average annual losses between 2002-2019.
- Melting ice in Antarctica is also contributing to sea level rise. Between 2002 and 2017, scientists found that mass losses from the Greenland and Antarctic ice sheets combined to contribute about 1.2 mm per year to global mean sea level. That’s about one third of the total rise in sea level over that time.
- Ice beyond Greenland and Antarctica has already been a significant contributor to sea level rise. In fact, melting glaciers have contributed more to sea level rise than the polar ice sheets since 1900, though that will likely change in the upcoming century. Scientists analyzing GRACE data found that mountain glaciers had lost about 200 gigatons of ice per year between 2002 and 2016, contributing 8 millimeters to global mean sea level.
- Scientists continue to refine their estimates from GRACE. For instance, they are constantly working to correct for glacial isostatic adjustment—the reshaping of Earth’s crust and redistribution of its mass as the weight of ice is reduced in some places. Gravimetry data are also converging with other measurements, such as laser altimetry, to show an increasingly complete picture of ice’s role in sea level rise, and which factors are most important and driving the observed changes. The modern data are even being used to help understand contributions to sea level rise in the past and to estimate the future evolution.
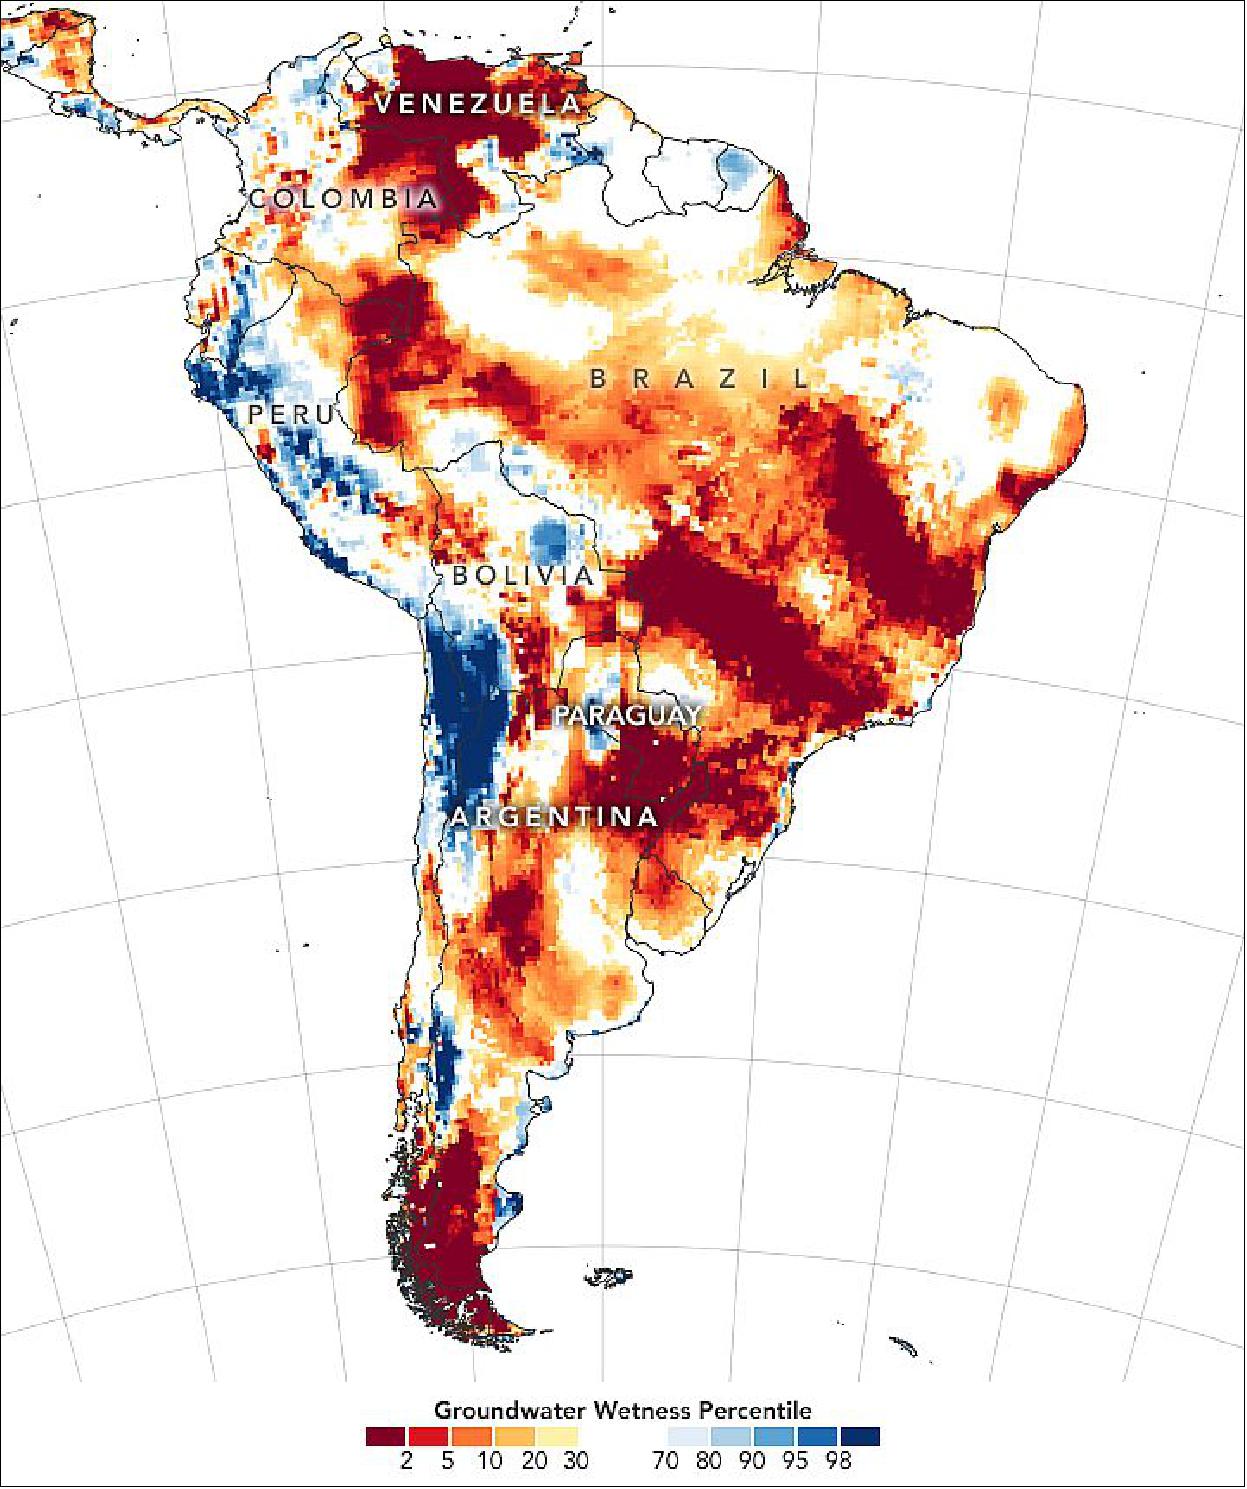
• November 4, 2020: Large parts of South America are in the grip of a serious drought. Signs of the drought began to appear in satellite gravimetry observations of southeastern Brazil in mid-2018, and had spread into parts of Paraguay, Bolivia, and northern Argentina by 2020. 34)
- “This is the second most intense drought in South America since 2002,” said Matthew Rodell, a hydrologist based at NASA’s Goddard Space Flight Center. “The calculation is based on the extent, duration, and volume of water lost during the drought as measured by the GRACE and GRACE-FO satellites.” A drought in eastern Brazil and Venezuela in 2015-16 is the only more intense drought on the record.
- The long period of dry weather in central and southern South America has had widespread consequences. Many of the affected areas have faced unusually intense and widespread outbreaks of fire. Winter corn crops have suffered low yields, and the late arrival of spring rain has delayed new plantings of soy. On key rivers, the lack of water has hampered shipping. Several ships have run aground, and many vessels have had to reduce their cargo in order to navigate to and from inland river ports.
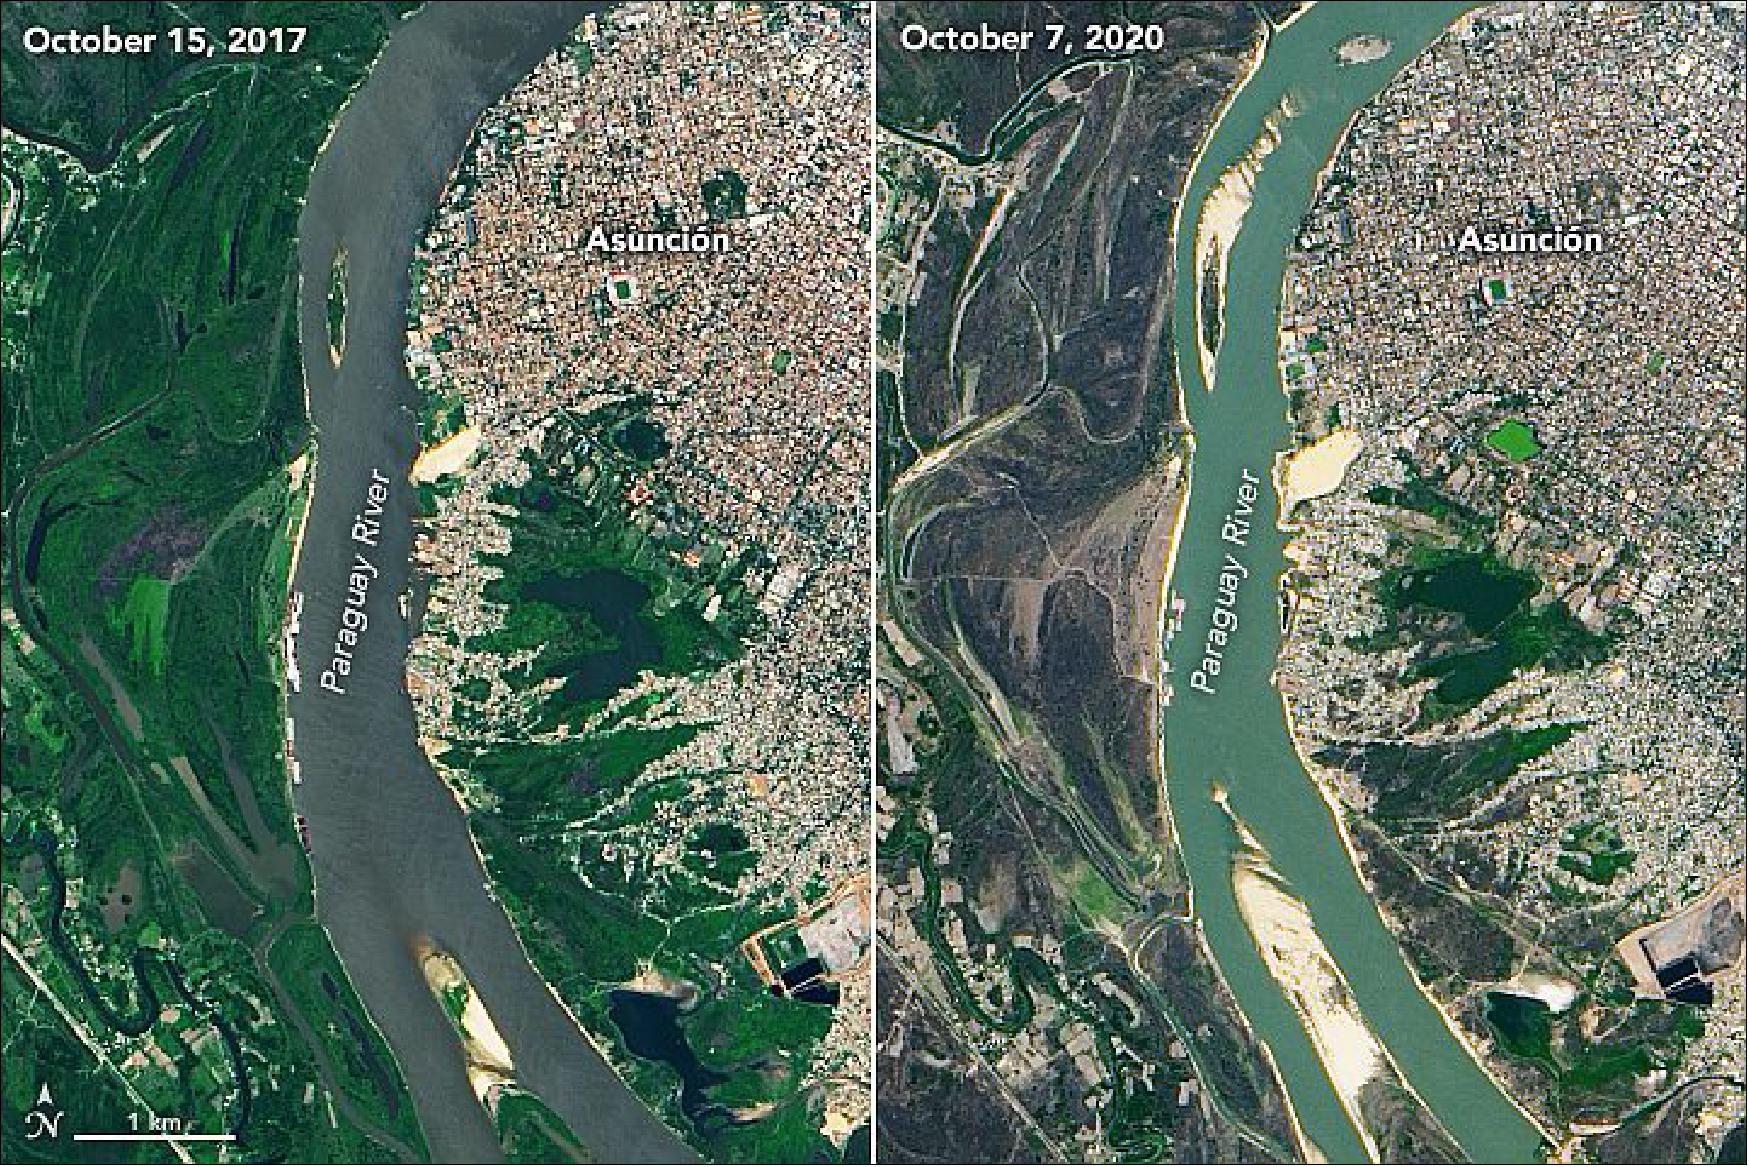
- Both images of Figure 27 were acquired by the Operational Land Imager (OLI) on Landsat-8. The first image shows a stretch of the river on October 7, 2020, when water was at historically low levels. The second image shows the same area on October 15, 2017, when water levels were much higher. The low water has exposed several sandbars and islands that are typically submerged.
- Since oceans play a large role in storing and distributing heat and moisture around the world, prolonged dry or wet spell are often preceded and accompanied by noticeable anomalies in sea surface temperatures. Before the fire season, Yang Chen of the University of California Irvine, forecasted dry, fire-friendly weather in the southeastern Amazon based on unusually high temperatures in the tropical Atlantic ocean. These periods of warm water temperatures are part of what climatologists call the Atlantic Multidecadal Oscillation, and they tend to shift weather patterns in a way that pushes a key rain belt in the tropics northward.
- “Farther south, in Paraguay, Uruguay, and Northern Argentina, you get into an extratropical region where the sensitivity of drought is quite different,” explained Chen. “In extratropical South America, low sea surface temperatures in the tropical Pacific are more closely associated with droughts.” The Oceanic Niño Index (ONI), a measure of sea surface temperatures in the central and eastern equatorial Pacific, dropped below normal in May. NOAA officially declared a La Niña on September 10, 2020. La Niña typically brings wetter conditions to the northern Amazon, but drier weather to the southern part of the continent. Forecasters expect the La Niña to be of moderate strength and persist through at least the end of 2020.
• August 20, 2020: Greenland set a new record for ice loss in 2019, shedding the most mass from its giant ice sheet in any year since at least 1948. 35)
- The large loss - 532 billion tons -is a stark reversal of the more moderate rate of melt seen in the previous two years. And it exceeds Greenland's previous record of 464 billion tons, set in 2012. The record melt will likely raise average global sea level by 1.5 millimeters. Using a hypothetical comparison, all the water combined would cover the entire state of California in more than 1.2 meters of water.
- The findings were published Aug. 20 in the journal Communications Earth & Environment. 36)
- "What I found interesting is such a high variability in the rate of loss for the Greenland Ice Sheet," said Alex Gardner, a researcher at NASA's Jet Propulsion Laboratory in Southern California and a coauthor of the study. "The years 2017 and 2018 were relatively mild after a decade of record losses, then 2019 came back to set a new record."
- To provide ice-loss estimates for the study, an international team of scientists, including Gardner, combined measurements from the GRACE and GRACE Follow-On (Gravity Recovery and Climate Experiment) satellites with data from computer models that simulate snowfall and ice-sheet melting on Greenland.
- Flown between 2002 and 2017, the twin GRACE satellites measured the gravitational pull exerted by massive bodies such as ice sheets: As one satellite passed over a gravitational "bump" on Earth's surface, it would speed up just a bit, changing the distance between it and its twin. Precise measurements of these changes would yield the "weight," or mass, of the object below.
- GRACE-FO picked up the baton in 2018 and has been continuing to monitor changes in ice mass. Together, the two GRACE missions provide a record of total yearly changes in ice mass now approaching 20 years, allowing scientists to see significant global trends and variations from year to year. Despite a nearly one-year gap in the data record from GRACE to GRACE-FO (July 2017 to May 2018), the total yearly change in ice mass could be measured precisely.
- The new findings reveal that climate-related changes in weather patterns over Greenland are a major reason for the large island's increasing rate of loss, according to glaciologist Ingo Sasgen of the Alfred Wegener Institute in Bremerhaven, Germany, who led the study. The five years with the biggest losses all have occurred in the past decade.
- "More and more often, we have stable [atmospheric] high-pressure systems over the ice sheet, which favor the influx of warmer air from the midlatitudes, one of the conditions promoting melt," Sasgen said. A similar pattern was seen in the previous record year of 2012.
- The years 2017 and 2018 were unusually cold and snowy, Sasgen added, leading to a more modest but still pronounced decline in Greenland's "mass balance" - the difference between ice added by snowfall and subtracted both by ice melt and by the ice flowing into the ocean along the ice sheet's margins.
- In 2019, Greenland returned to the pattern more prevalent in recent years: lower rates of snowfall compared to the long-term average. The computer modeling of regional climate helped reveal weather effects, such as lingering high atmospheric pressure and resulting warm air.
- Even as the new study improves understanding of atmospheric effects on Arctic ice melt, others, like NASA's Oceans Melting Greenland (OMG), track the ocean's effects. Both are critical to a complete picture of changes over decades.
- "When you look at the record as a whole, you start to see the long-term trend becoming more clear," Gardner said.
- JPL managed the GRACE mission and manages the GRACE-FO mission for NASA's Earth Science Division in the Science Mission Directorate at NASA Headquarters in Washington. GRACE and GRACE-FO are mission partnerships between NASA and the German Aerospace Center, and NASA and the German Research Centre for Geosciences, respectively. Based in Pasadena, California, Caltech manages JPL for NASA.
• August 14, 2020: As the United States moves into the last weeks of climatological summer, one-third of the country is experiencing at least a moderate level of drought. Much of the West is approaching severe drought, and New England has been unusually dry and hot. An estimated 53 million people are living in drought-affected areas. 37)
- According to the Drought Monitor, more than 93 percent of the land area in Utah, Colorado, Nevada, and New Mexico is in some level of drought; 69 percent of Utah is in severe drought, as is 61 percent of Colorado. More than three-fourths of Oregon, Arizona, and Wyoming are also in drought. The effects of “severe” drought include stunted and browning crops, limited pasture yields, dust storms, reduced well water levels, and an increase in the number and severity of wildfires. Most of those areas had no sign of drought in the mid-summer of 2019.
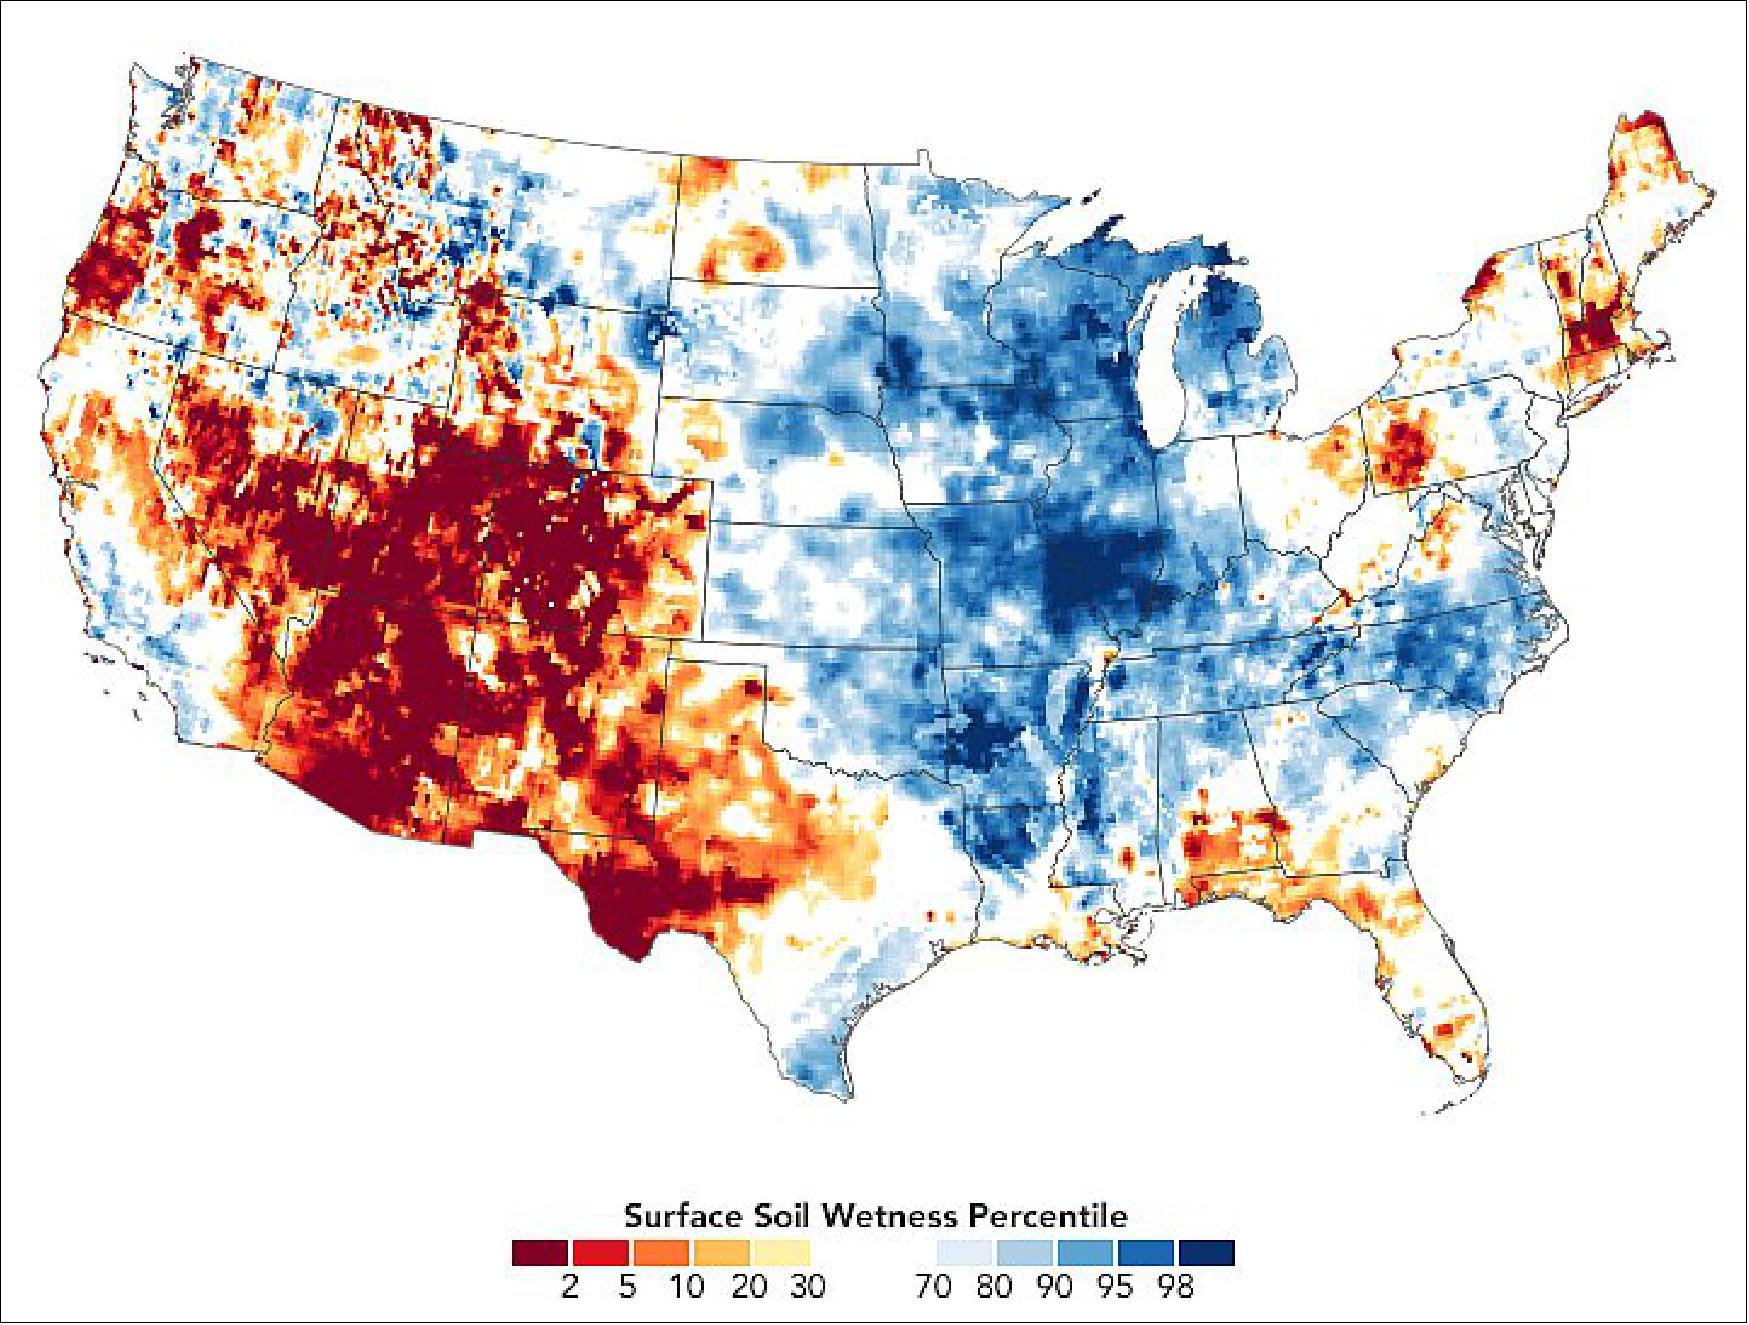
- The GRACE-FO satellites detect the movement of water based on subtle shifts in Earth’s gravity field from month to month. Variations in land topography or ocean tides change the distribution of Earth’s mass and gravity field, as does the addition or subtraction of water. GRACE-FO data are integrated with data from the original GRACE mission (2002-2017) and with current and historical ground-based observations using a sophisticated numerical model of water and energy processes at the land surface.
- Warm air temperatures and minimal snowfall in spring set the stage for the advancing drought. A ridge of high pressure over the northeastern Pacific Ocean has sent the jet stream farther north than usual. And meteorologists pointed to another failure of the southwestern monsoon for much of the parched landscape. In a typical summer, atmospheric high pressure over the southern Rocky Mountains draws moisture in from the Gulf of California and Gulf of Mexico and make July and August the rainiest time of year in Arizona, New Mexico, and the Four Corners region—providing half of the year’s precipitation in some areas.
- But this year the monsoon has failed to deliver. Atmospheric high pressure has been centered farther south than usual, drawing in westerly winds. Extreme heat has baked the region, with several states averaging temperatures 3 to 5 degrees Fahrenheit above normal. Phoenix has already set a record for the most days above 110°F in a calendar year (34), with five months to go. According to the Weather Channel, Las Vegas has not seen measurable rainfall since mid-April, and Cedar City, Utah, has recorded just 0.05 inches of rain this summer, making it the driest on record.
- Forecasts from the NOAA Climate Prediction Center suggest that conditions in the West won't get better any time soon. According to NOAA climatologists, hot and dry weather are expected through late October.
• June 26, 2020: Long-term rainfall deficits, heat waves, and increased evaporation have depleted some of the groundwater supply beneath central and eastern Europe. The 2019-20 winter in Europe was the warmest on record, with little snow. The spring was also drier and warmer than normal, with an historic heat wave in the middle of May. The forecast for summer 2020 is not looking much better. For the third year in a row, Europe is facing potential water woes. 38)
- According to the Copernicus Climate Change Service (C3S), meteorological drought conditions started in eastern Europe in early spring 2020 and migrated across the continent with drier-than-normal weather in April and May. Tributaries and main stems of some of the continent’s rivers—such as the Elbe, Warta, and Danube—fell below normal seasonal flow. In late May and June, surface soil moisture and waterways in some areas rebounded a bit after heavy rain showers. And all of this occurred as 2020 continued to be one of the hottest years on record globally.
- In their seasonal review and forecast, C3S meteorologists predicted below-average precipitation for southern and eastern Europe in June, July, and August. The GEOGLAM Crop Monitor, a Group on Earth Observations initiative to monitor agricultural conditions and food security around the world, put much of central and eastern Europe and southwestern Russia under a “watch” for potential drought impacts on wheat production.
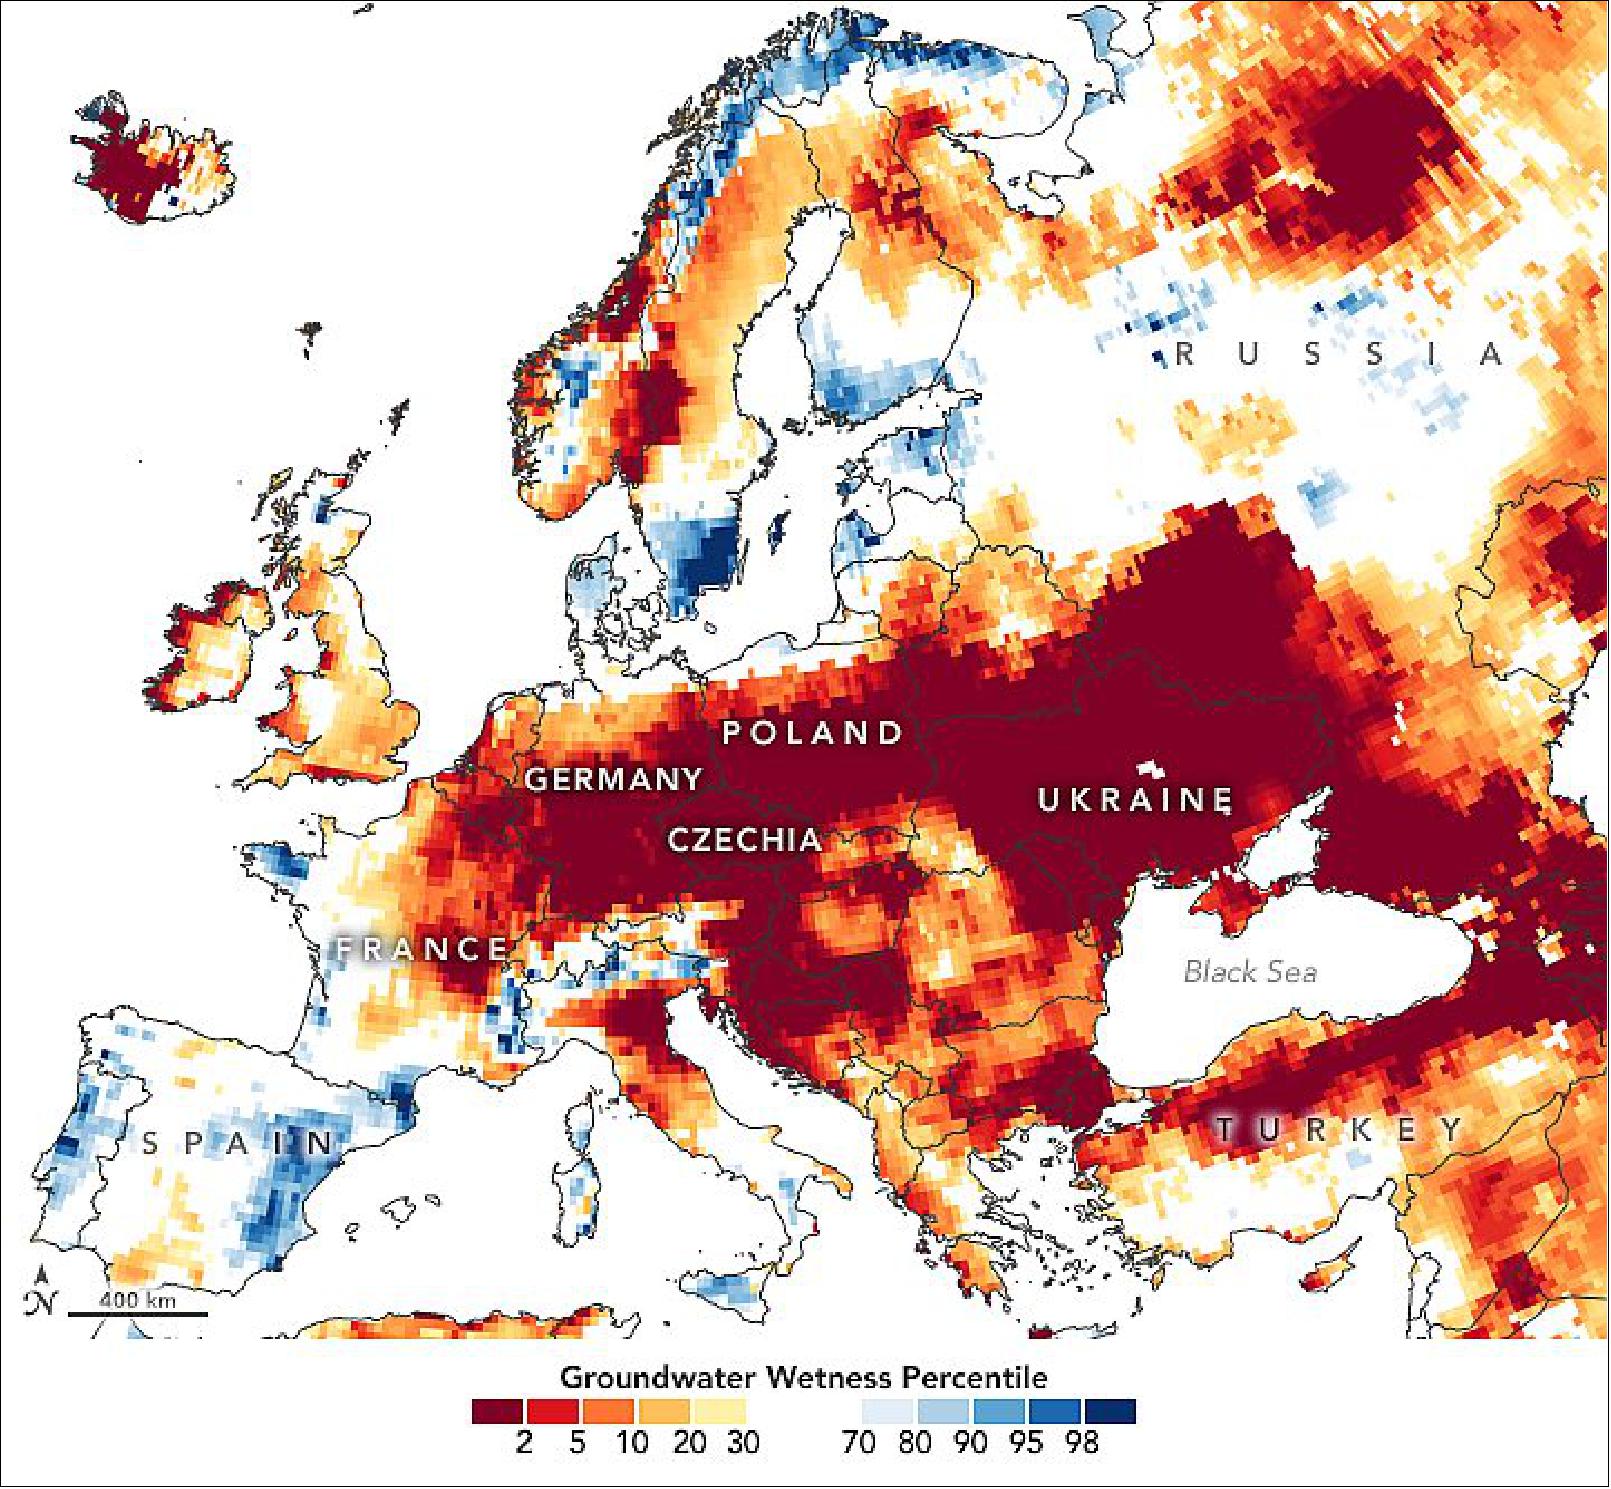
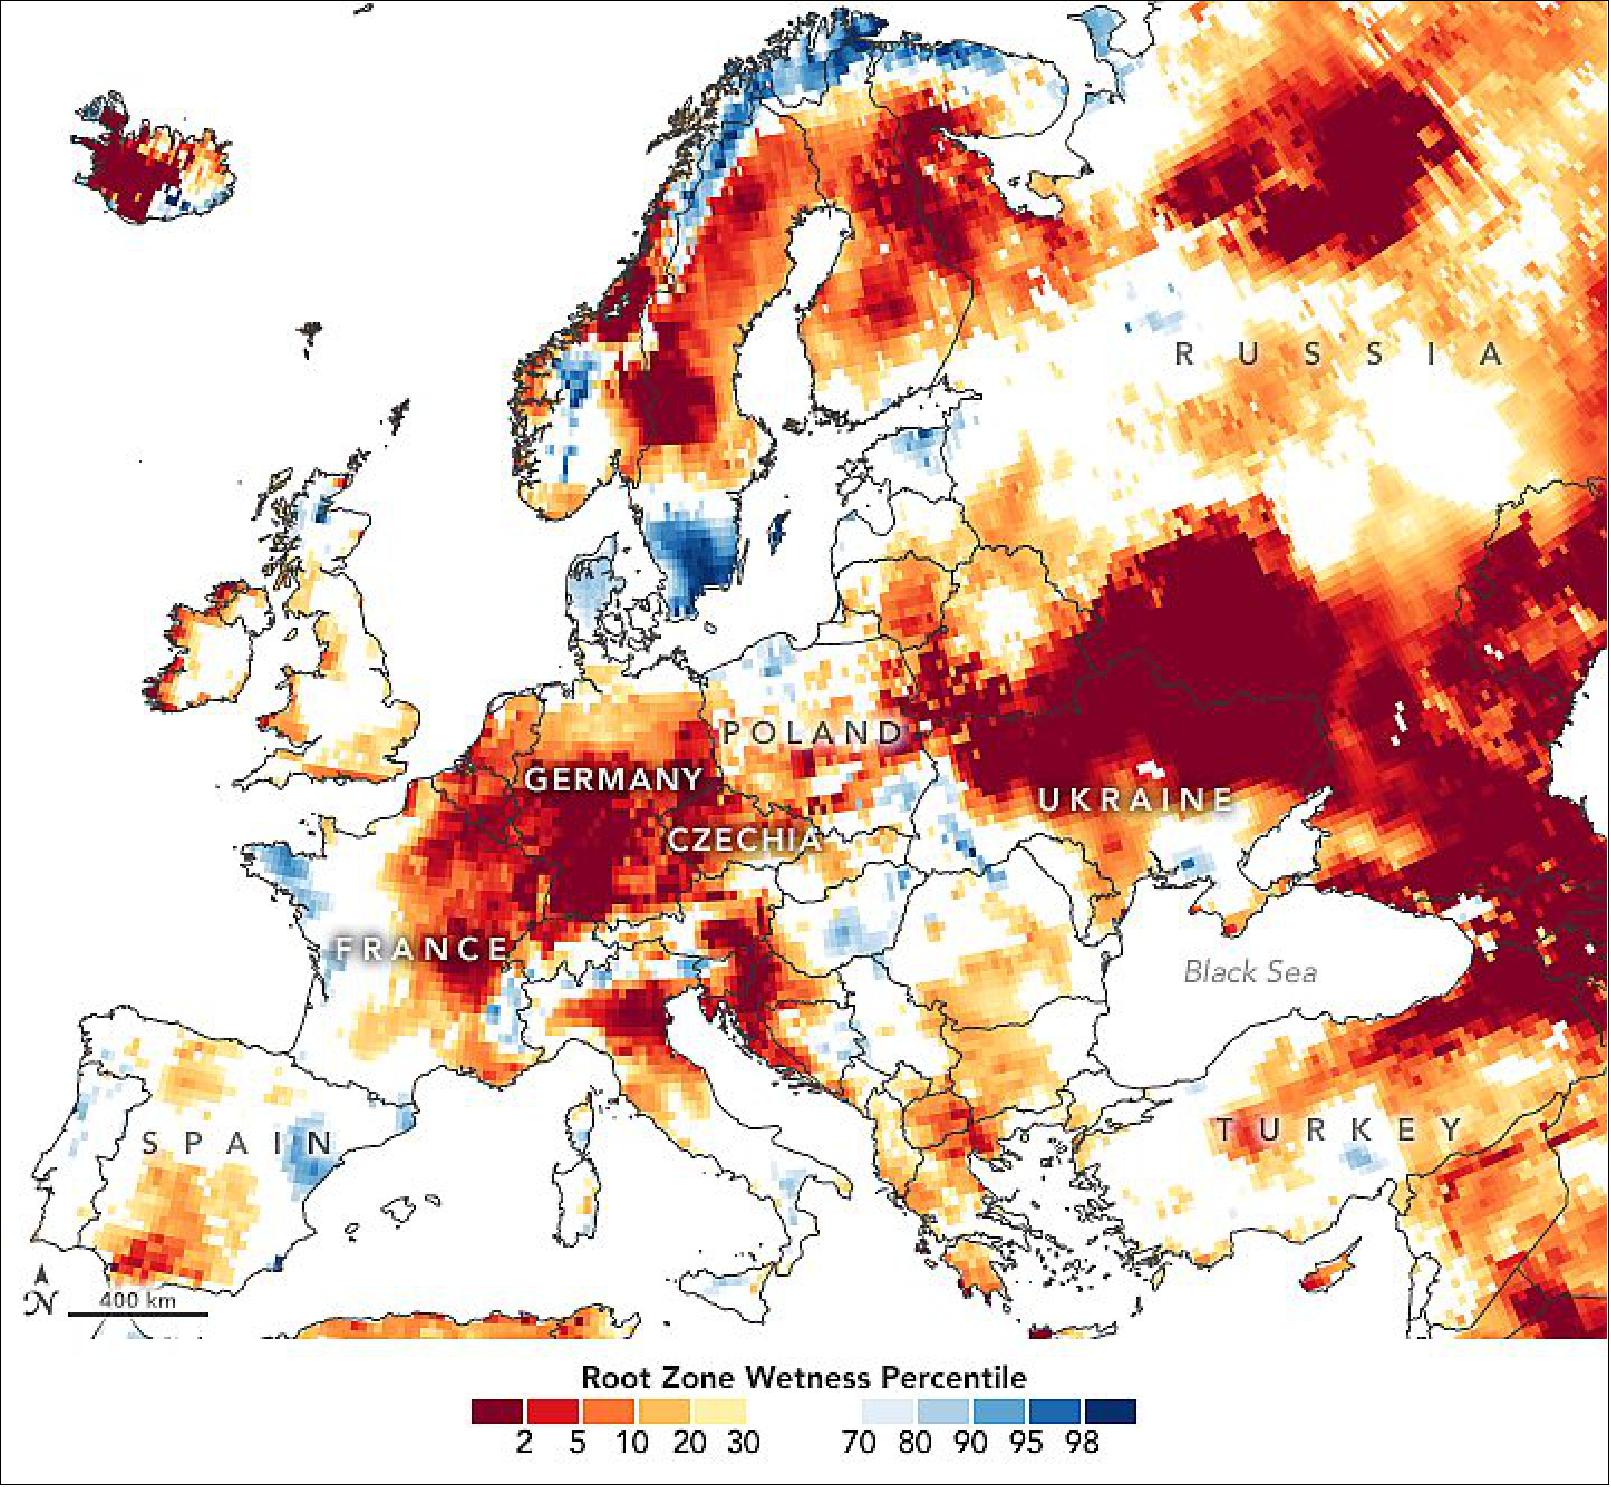
- Note the differences between the groundwater and root zone moisture maps. Monitoring root zone moisture is essential for managing agriculture because it is the water naturally available for growing crops. Soil moisture at Earth’ surface and in the root zone can fluctuate significantly over short periods of time; it can be quickly replenished by rainfall, but also can evaporate rapidly during heat waves and dry spells. In fact, recent rains in parts of Europe have significantly reduced surface moisture deficits.
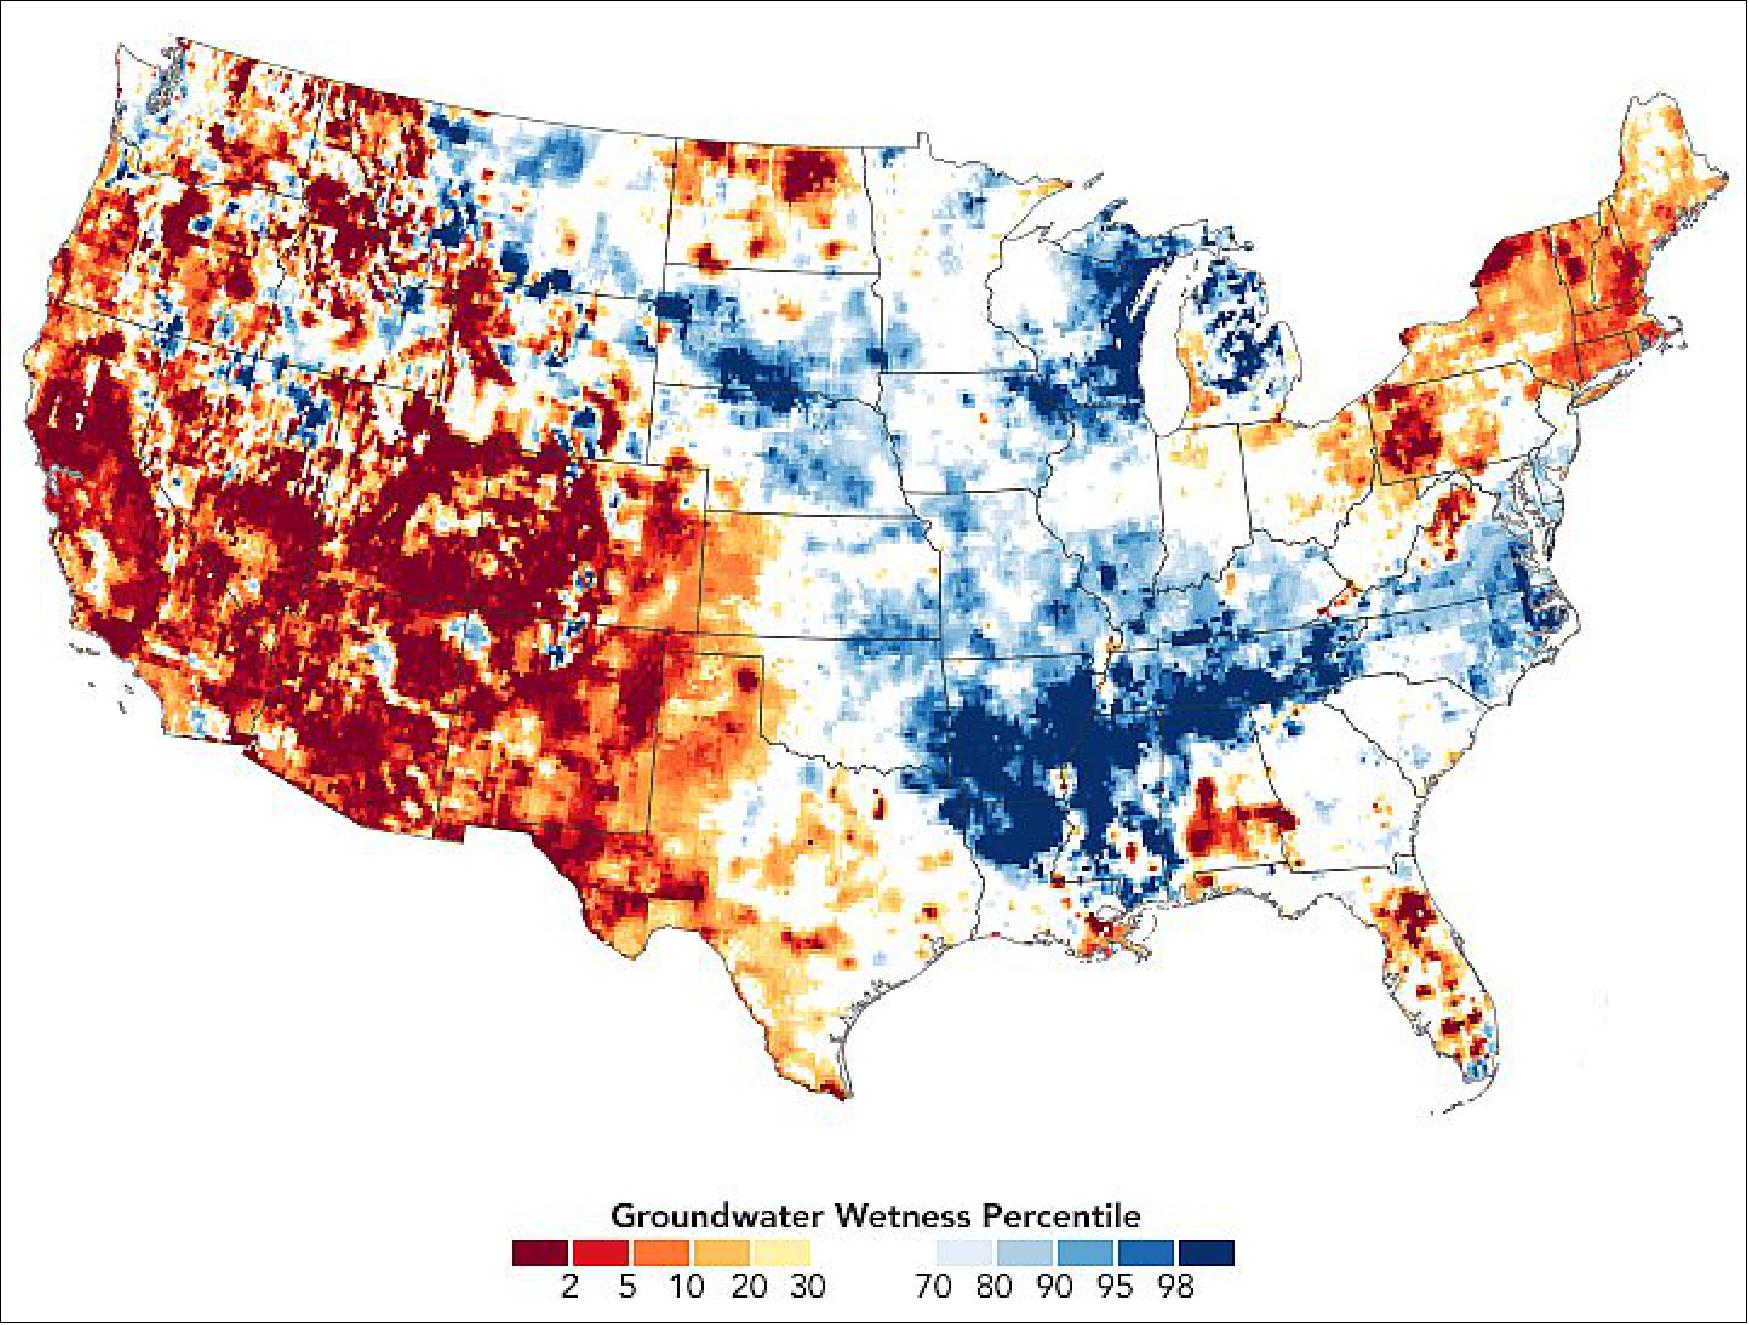
- Groundwater is a deeper resource for crop irrigation and drinking water, and it also sustains streams during dry periods. Unlike surface and root zone moisture, groundwater takes months to rebound, as it has to be slowly and steadily replenished by surface moisture that seeps down through soil and rock to the water table. Because much of Europe experienced drought in the summers of 2018 and 2019, and saw little snow in the winter of 2019-20, much of the continent began this year with a significant deficit.
- “In recent years, Central Europe has experienced a series of droughts caused by exceptionally stable weather patterns and high temperatures that can both be linked to climate change,” said Wolfgang Wagner, a remote sensing scientist at Technische Universität Wien. “The fact that some regions have experienced drought conditions in several consecutive years has already caused significant damage to forests (due to bark beetle infestation) and declines in groundwater levels.”
- After six years of rainfall deficits, the Czech Republic reported this spring that nearly 80 percent of its wells were recording mild to extreme drought. The country’s soil moisture in May was at least 30 percent below normal. Some climatologists called it the country’s worst drought in 500 years. In neighboring Germany, underground water storage has also been depleted in recent years.
- In Ukraine, the water level in the Desna River reached it lowest point in 140 years of observations—a full 5 meters below normal for springtime. The Dnieper watershed, the source of half of the country’s water needs, received just 70 percent of its usual rainfall from September through May. In early June, reservoirs around Kyiv stood at their lowest levels in nearly a century. Extreme rain in late June should significantly improve surface conditions in the near term, but much of it could run off (rather than percolating down to the groundwater) because parched soil does not readily soak up water.
- Polish climatologists reported one of its worst droughts in a hundred years, with agricultural drought in 11 of 16 provinces. More than 40 rivers and streams fell substantially below normal levels by May 2020, low flows that came just months after the Vistula dropped to its lowest level on record in 2019. The low water levels posed trouble for the electric power industry, which sometimes cannot draw enough water for cooling.
- “From the global food security and agricultural commodities perspective, Europe is important because it is one of the largest wheat-producing regions in the world, and also a major maize-producing region. Both wheat and maize are major food security crops,” said Brian Barker, a leader of the GEOGLAM group and scientist at the University of Maryland. “The persistent rainfall deficits, combined with the above-average temperatures since winter, have negatively affected large areas across Europe, reducing forecasted crop yields compared to the five-year average in a number of countries.”
- Both maps are based on data from the GRACE-FO satellites, a pair of spacecraft that detect the movement of water based on variations of Earth’s gravity field. GRACE-FO measures subtle shifts in gravity from month to month. Variations in land topography or ocean tides change the distribution of Earth’s mass; the addition or subtraction of water also changes the gravity field. Those data are integrated with data from the original GRACE mission (2002-2017) and with current and historical ground-based observations, using a sophisticated numerical model of water and energy processes at the land surface.
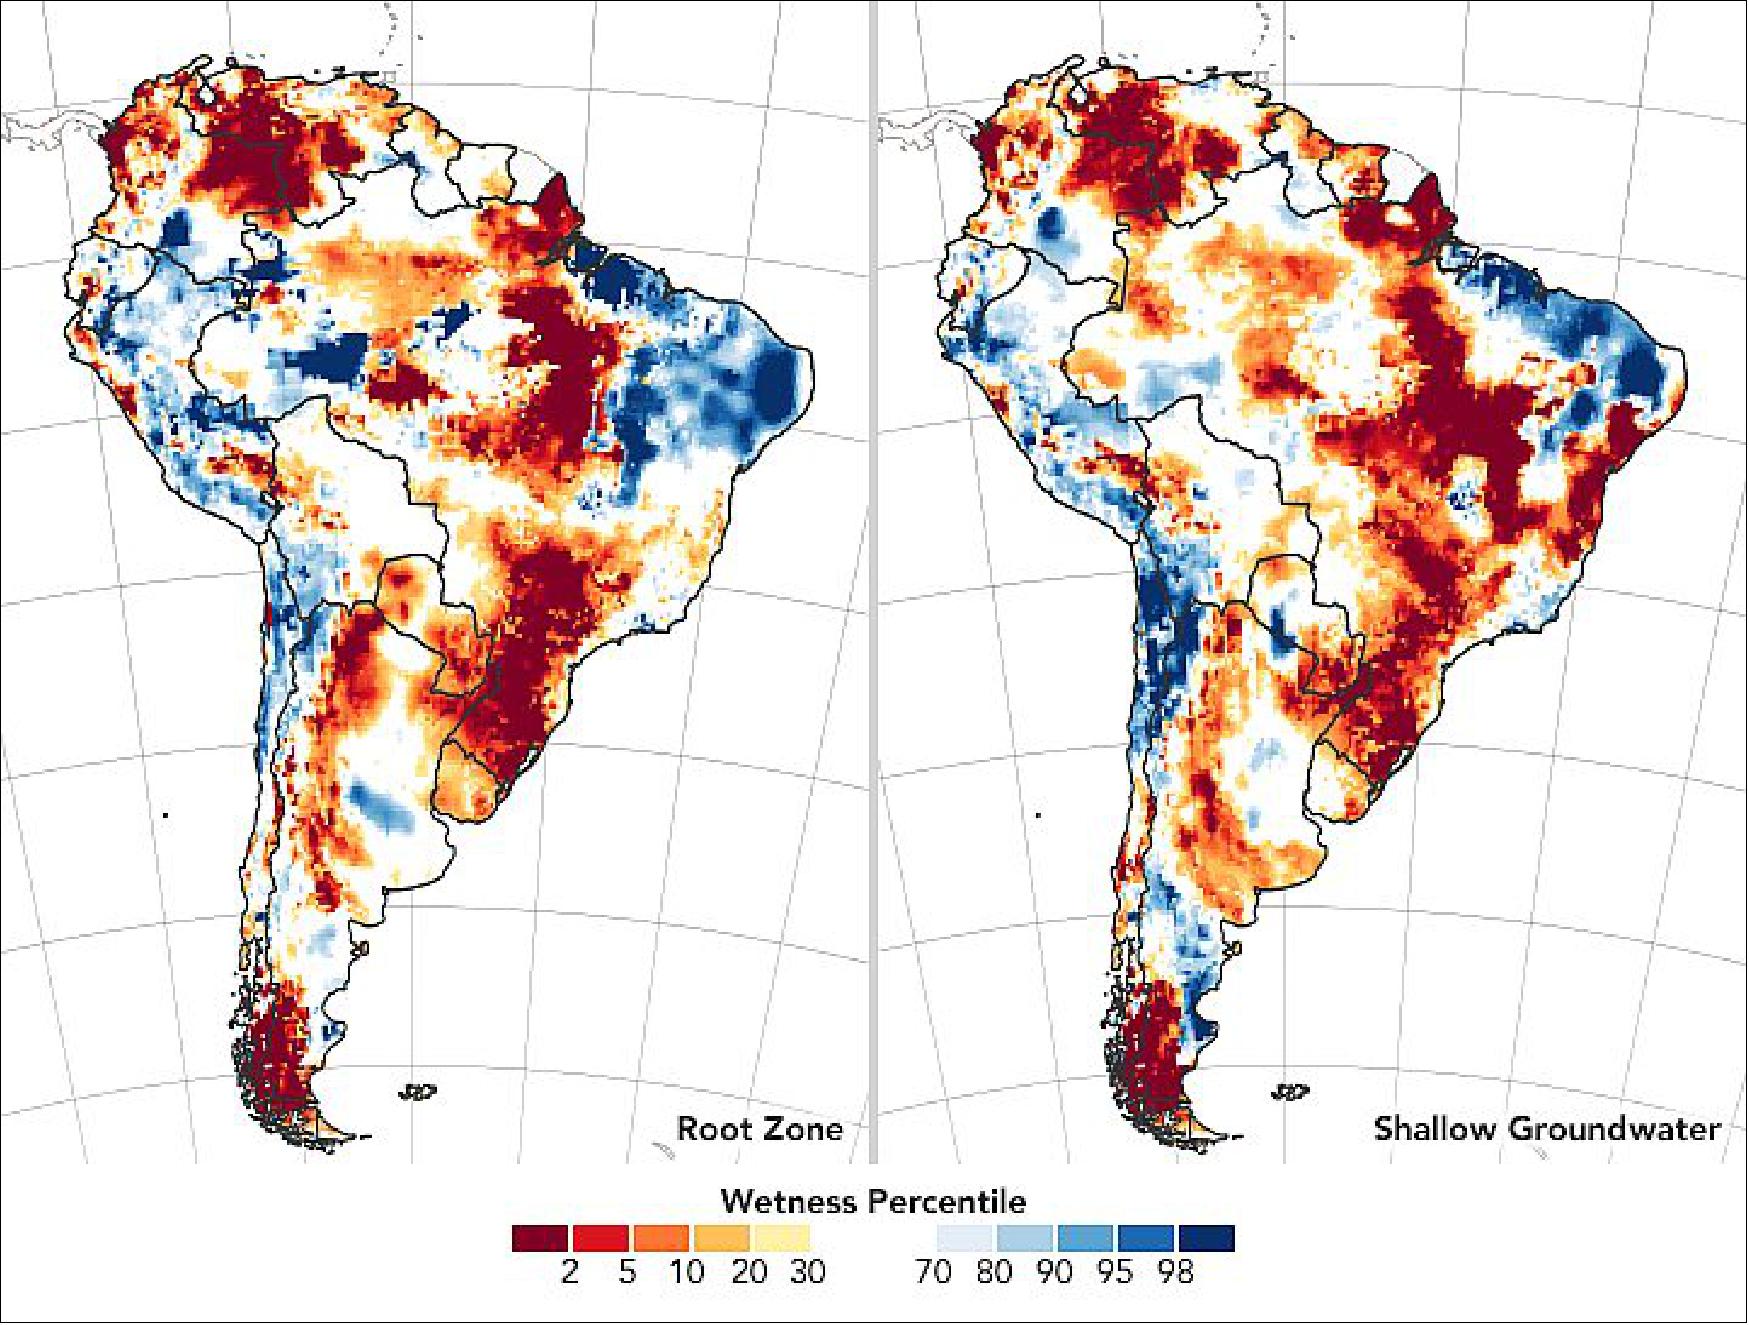
• April 6, 2020: As South America moves into autumn, several parts of the continent are facing rainfall deficits and droughts that might shrink harvests. Twin satellites from NASA and the German Research Center for Geosciences are providing fresh insights into the conditions. The GRACE-FO twin satellites are assessing the state of soil moisture and groundwater on the continent and around the world. 39)
- Rainfall in the summer of 2020, and specifically in March, has been as much as one-third below normal in Brazil’s Mato Grosso do Sul, São Paulo and Paraná states, according to several news reports. Likewise, northern Argentina, Chile, Colombia, and Venezuela all reported rainfall deficits and drought conditions in February and March.
- The dry weather was matched by excessive heat. According to the U.S. National Centers for Environmental Information, South America had its second warmest December to February period in 110 years of records. On a global scale, February marked the 44th consecutive February and 422nd consecutive month with temperatures higher than the 20th Century average.
- The maps of Figure 34 are based on data from the Gravity Recovery and Climate Experiment Follow On (GRACE-FO) satellites, a pair of spacecraft that detect the movement of water based on variations of Earth’s gravity field. GRACE measures subtle shifts in gravity from month to month. Variations in land topography or ocean tides change the distribution of Earth’s mass; the addition or subtraction of water also changes the gravity field. Those data are integrated with other ground-based observations using a numerical model of water and energy processes at the land surface.
- After providing such maps for the United States since 2012, the GRACE team has just started releasing weekly global maps of groundwater and soil moisture. They are are distributed online by the National Drought Mitigation Center at the University of Nebraska-Lincoln (UNL).
- “The global products are important because there are so few worldwide drought maps out there,” said hydrologist and project lead Matt Rodell of NASA’s Goddard Space Flight Center. “Droughts are usually well known when they happen in developed nations. But when there’s a drought in central Africa, for example, it may not be noticed until it causes a humanitarian crisis. So it is valuable to have a product like this where people can say, wow, it’s really dry there and no one’s reporting it.”
- Monitoring soil wetness is essential for managing agricultural crops and predicting their yields because soil moisture is the water available to plant roots. Groundwater is often the source of water for crop irrigation, and it also sustains streams during dry periods.
- “Drought is really a key topic for a lot of projections of climate and climate change. The emphasis is on getting more relevant, more accurate, and more timely drought information, whether it be soil moisture, crop health, groundwater, streamflow, and the GRACE missions are central to this,” said Brian Wardlow, director for the Center for Advanced Land Management Information Technologies at UNL. “These types of tools are absolutely critical to helping us address and offset some of the impacts anticipated, whether they be from population growth, climate change, or just increased water consumption in general.”
• March 31, 2020: NASA researchers have developed new satellite-based, weekly global maps of soil moisture and groundwater wetness conditions and one to three-month U.S. forecasts of each product. While maps of current dry/wet conditions for the United States have been available since 2012, this is the first time they have been available globally. 40)
- “The global products are important because there are so few worldwide drought maps out there,” said hydrologist and project lead Matt Rodell of NASA’s Goddard Space Flight Center in Greenbelt, Maryland. “Droughts are usually well known when they happen in developed nations. But when there’s a drought in central Africa, for example, it may not be noticed until it causes a humanitarian crisis. So it’s valuable to have a product like this where people can say, wow, it’s really dry there and no one’s reporting it.”
- These maps are distributed online by the National Drought Mitigation Center at the University of Nebraska-Lincoln (UNL) to support U.S. and global drought monitoring.
- “Being able to see a weekly snapshot of both soil moisture and groundwater is important to get a complete picture of drought,” said professor Brian Wardlow, director for the Center for Advanced Land Management Information Technologies at UNL, who works closely with Rodell on developing remote sensing tools for operational drought monitoring.
- Monitoring the wetness of the soil is essential for managing agricultural crops and predicting their yields, because soil moisture is the water available to plant roots. Groundwater is often the source of water for crop irrigation. It also sustains streams during dry periods and is a useful indicator of extended drought. But ground-based observations are too sparse to capture the full picture of wetness and dryness across the landscape like the combination of satellites and models can.
A Global Eye on Water
- Both the global maps and the U.S. forecasts use data from NASA and German Research Center for Geosciences’s GRACE-FO (Gravity Recovery and Climate Experiment Follow On) satellites, a pair of spacecraft that detect the movement of water on Earth based on variations of Earth’s gravity field. GRACE-FO succeeds the highly successful GRACE satellites, which ended their mission in 2017 after 15 years of operation. With the global expansion of the product, and the addition of U.S. forecasts, the GRACE-FO data are filling in key gaps for understanding the full picture of wet and dry conditions that can lead to drought.
- The satellite-based observations of changes in water distribution are integrated with other data within a computer model that simulates the water and energy cycles. The model then produces, among other outputs, time-varying maps of the distribution of water at three depths: surface soil moisture, root zone soil moisture (roughly the top three feet of soil), and shallow groundwater. The maps have a resolution of 1/8th degree of latitude, or about 8.5 miles, providing continuous data on moisture and groundwater conditions across the landscape.
- The GRACE and GRACE-FO satellite-based maps are among the essential data sets used by the authors of the U.S. Drought Monitor, the premier weekly map of drought conditions for the United States that is used by the U.S. Department of Agriculture and the Federal Emergency Management Agency, among others, to evaluate which areas may need financial assistance due to losses from drought.
- ”GRACE [provided and GRACE-FO now provides] a national scope of groundwater,” said climatologist and Drought Monitor author Brian Fuchs, at the drought center. He and the other authors use multiple data sets to see where the evidence shows conditions have gotten drier or wetter. For groundwater, that used to mean going to individual states’ groundwater well data to update the weekly map. “It’s saved a lot of time having that groundwater layer along with the soil moisture layers, all in one spot,” Fuchs said. “The high-resolution data that we’re able to bring in allows us to draw those contours of dryness or wetness right to the data itself.”
- One of the goals of the new global maps is to make the same consistent product available in all parts of the world—especially in countries that do not have any groundwater-monitoring infrastructure.
- “Drought is really a key [topic] ... with a lot of the projections of climate and climate change,” Wardlow said. “The emphasis is on getting more relevant, more accurate and more timely drought information, whether it be soil moisture, crop health, groundwater, streamflow—[the GRACE missions are] central to this,” he said. “These types of tools are absolutely critical to helping us address and offset some of the impacts anticipated, whether it be from population growth, climate change or just increased water consumption in general.”
- Both the Center for Advanced Land Management and the National Drought Mitigation Center are based in UNL’s School of Natural Resources, and they are working with international partners, including the U.S. Agency for International Development and the World Bank, to develop and support drought monitoring using the GRACE-FO global maps and other tools in the Middle East, North Africa, South Africa, South East Asia, and India.
U.S. Forecasts Maps for the Lower 48

- Droughts can be complex, both in timing and extent. At the surface, soil moisture changes rapidly with weather conditions. The moisture in the root zone changes a little slower but is still very responsive to weather. Lagging behind both is groundwater, since it is insulated from changes in the weather. But for longer-term outlooks on drought severity—or, conversely, flood risk in low-lying areas—groundwater is the metric to watch, said Rodell.
- “The groundwater maps are like a slowed down, smoothed version of what you see at the surface,” Rodell said. “They represent the accumulation of months or years of weather events.” That smoothing provides a more complete picture of the overall drying or wetting trend going on in an area. Having an accurate accounting of groundwater levels is essential for accurately forecasting near-future conditions.
- The new forecast product that projects dry and wet conditions 30, 60, and 90 days out for the lower 48 United States uses GRACE-FO data to help set the current conditions. Then the model runs forward in time using the Goddard Earth Observing System, Version 5 seasonal weather forecast model as input. The researchers found that including the GRACE-FO data made the resulting soil moisture and groundwater forecasts more accurate.
- Since the product has just been rolled out, the user community is only just beginning to work with the forecasts, but Wardlow sees a huge potential.
- “I think you’ll see the GRACE-FO monitoring products used in combination with the forecasts,” Wardlow said. “For example, the current U.S. product may show moderate drought conditions, and if you look at the forecast and the forecast shows next month that there’s a continued drying trend, then that may change the decision versus if it was a wet trend.”
- The U.S. forecast and global maps are freely available to users through the drought center’s data portal. To download the maps, visit: https://nasagrace.unl.edu/
- GRACE-FO is a partnership between NASA and the German Research Center for Geosciences (GeoForschungsZentrum [GFZ]). Both spacecraft are being operated from GSOC (German Space Operations Center) in Oberpfaffenhofen, Germany, under a GFZ contract with the German Aerospace Center (Deutsches Zentrum für Luft- und Raumfahrt). The Jet Propulsion Laboratory manages the mission for NASA's Science Mission Directorate at NASA Headquarters in Washington. Caltech in Pasadena, California, manages JPL for NASA. The GRACE-FO mission was launched in early 2018.
- Development of the drought/wetness products was funded by NASA’s Applied Sciences–Water Resources, Terrestrial Hydrology, and GRACE-FO Science Team programs.
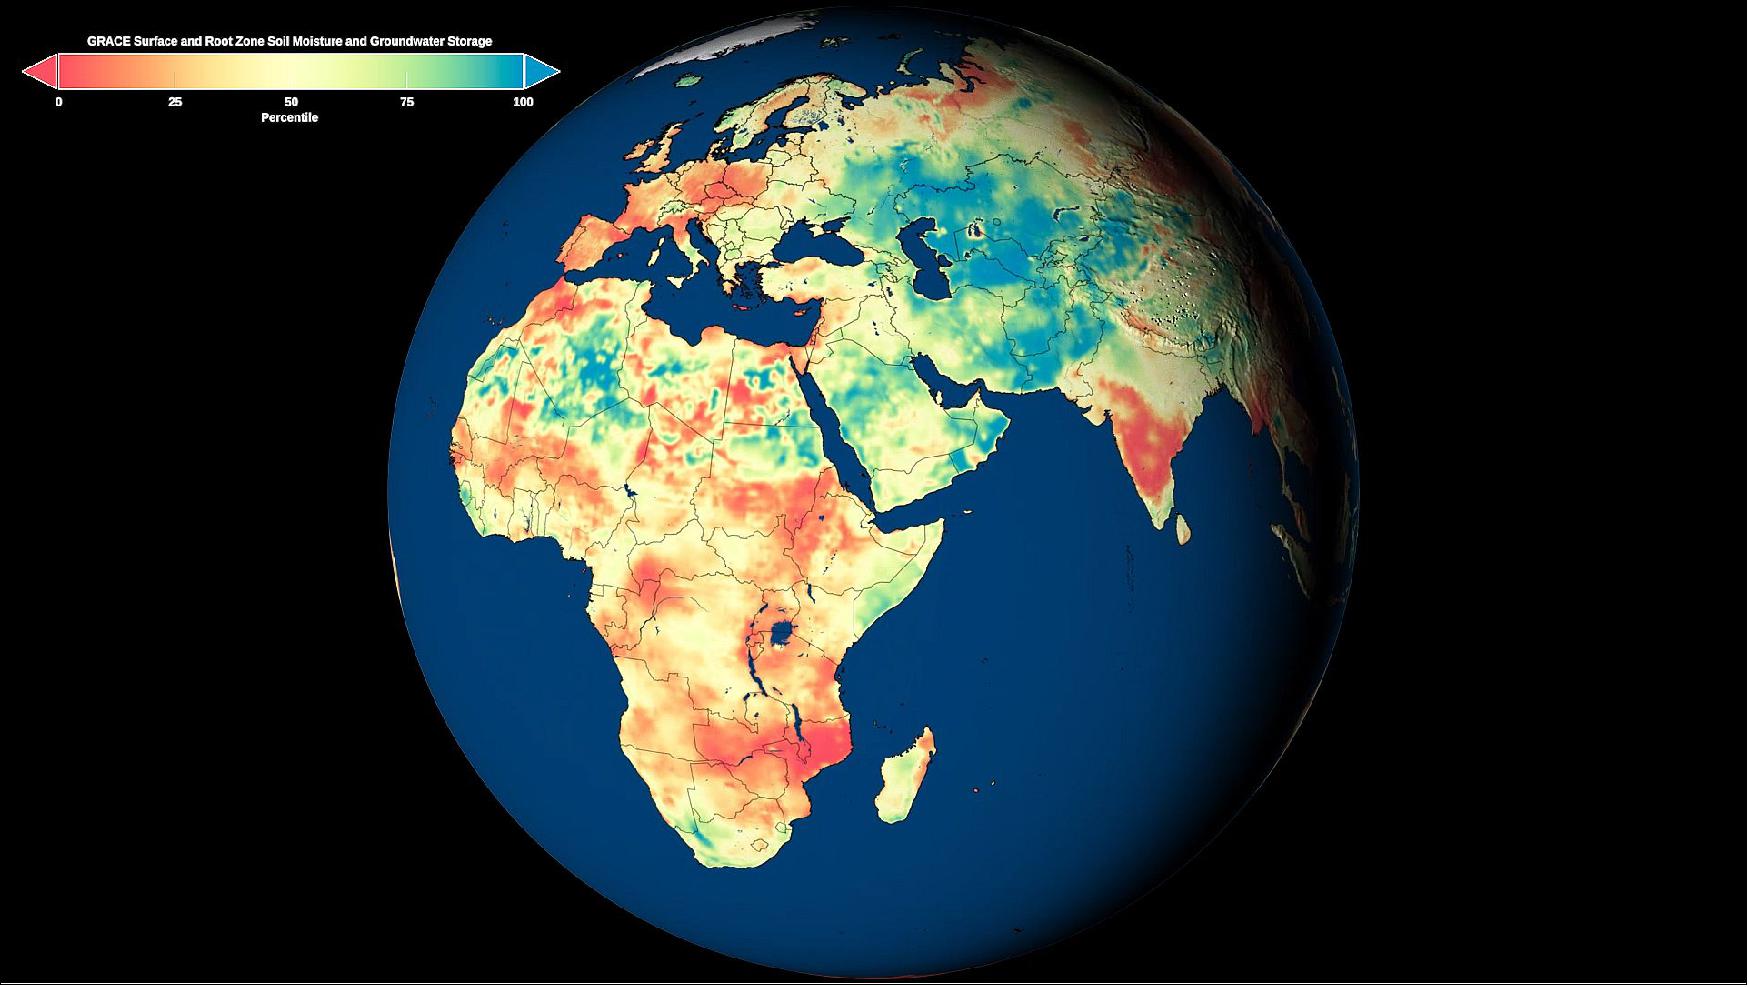
• March 18, 2020: During the exceptionally warm Arctic summer of 2019, Greenland lost 600 billion tons of ice (equivalent to 600 km3) — enough to raise global sea levels by 2.2 millimeters in just two months, a new study shows. 41)
- Led by scientists at NASA's Jet Propulsion Laboratory and the University of California, Irvine, the study also concludes that Antarctica continues to lose mass, particularly in the Amundsen Sea Embayment and the Antarctic Peninsula on the western part of the continent; however, those losses have been partially offset by gains from increased snowfall in the northeast. 42)
- "We knew this past summer had been particularly warm in Greenland, melting every corner of the ice sheet," said lead author Isabella Velicogna, senior project scientist at JPL and a professor at UCI. "But the numbers really are enormous."
- For context, last summer's losses are more than double Greenland's 2002-2019 yearly average.
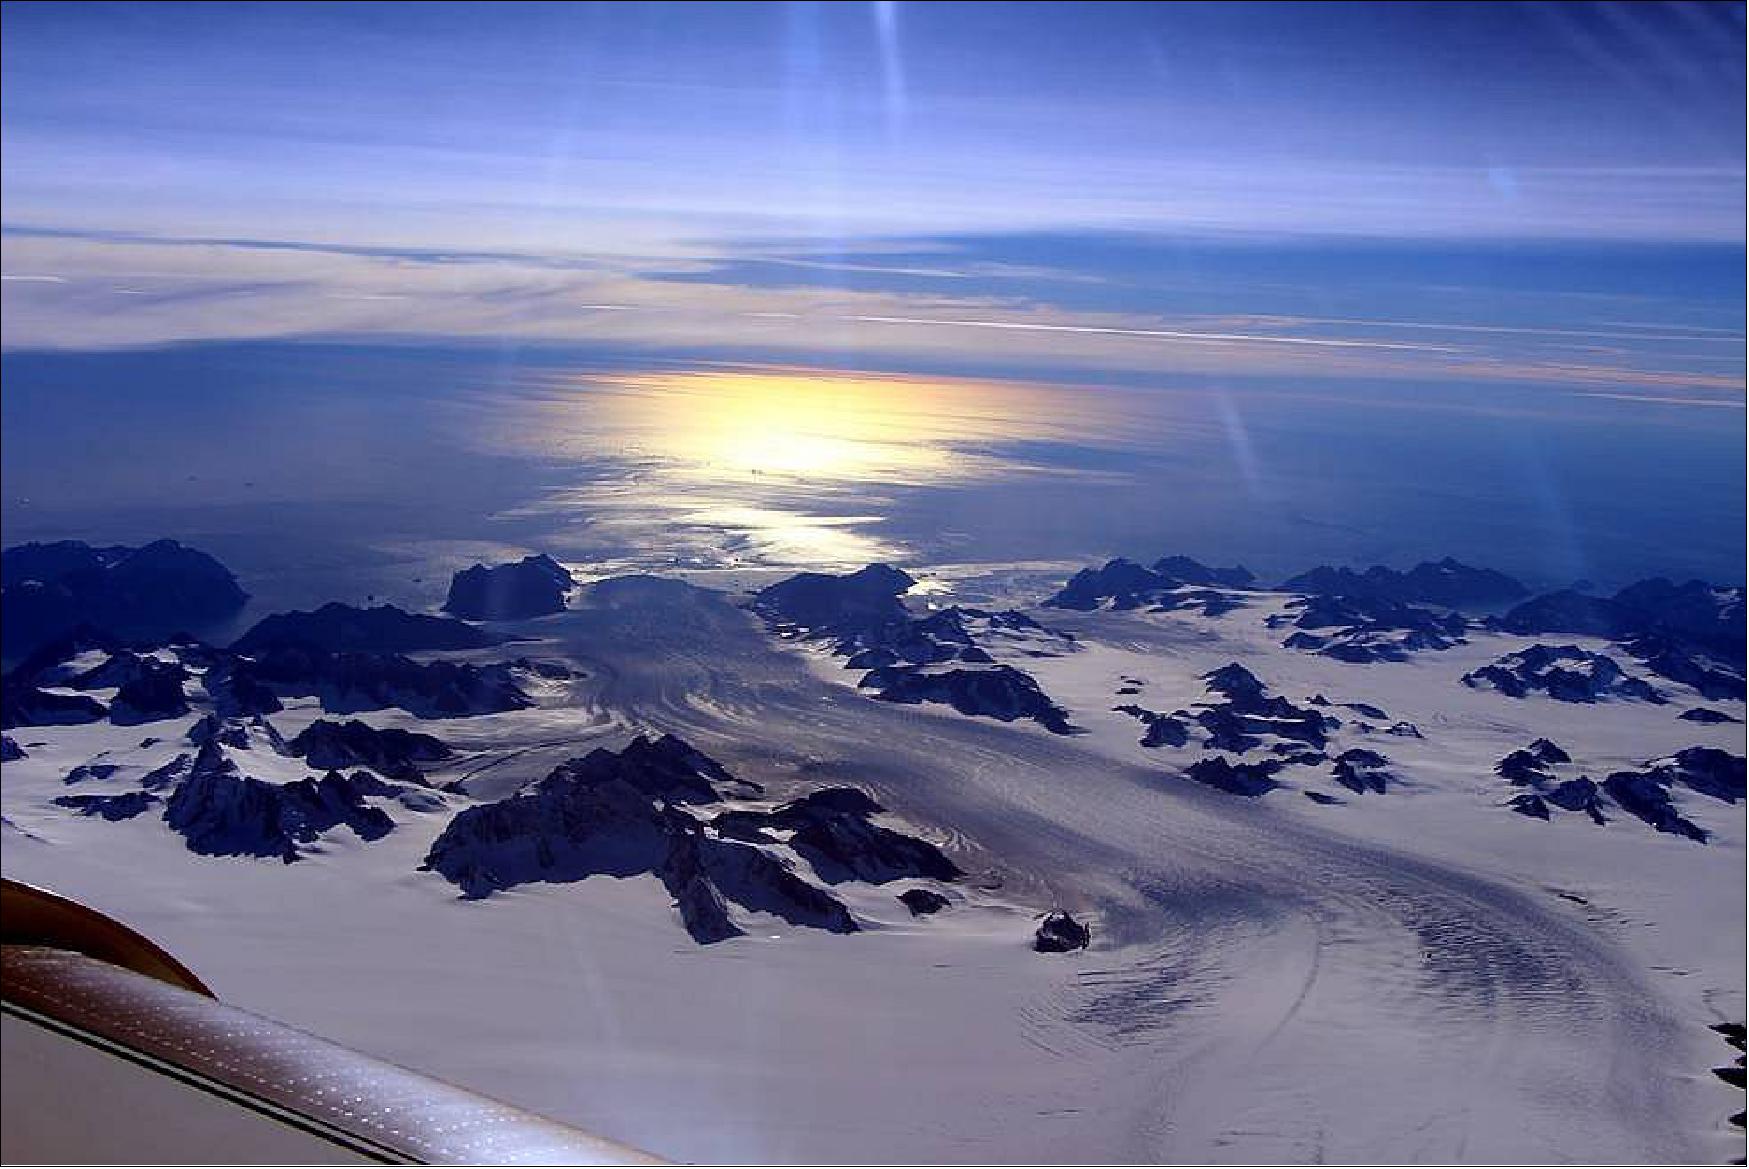
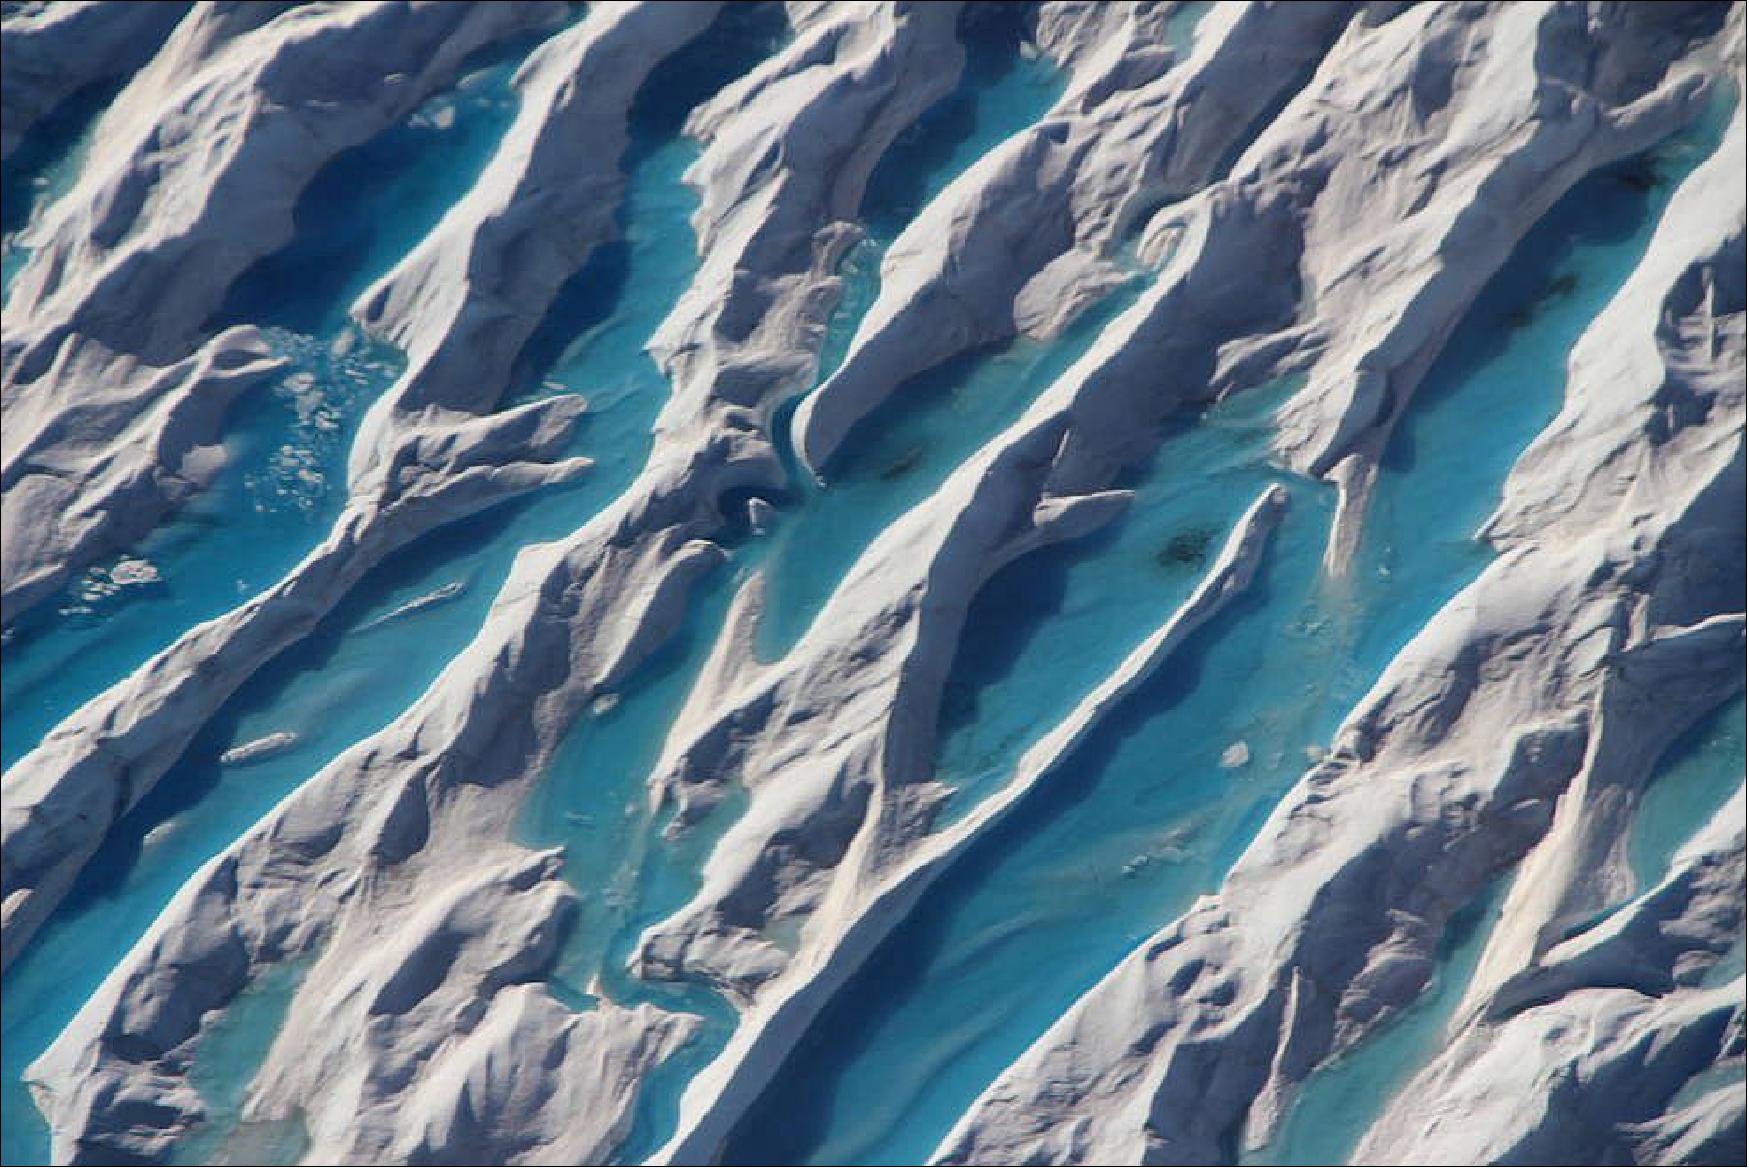
- "In Antarctica, the mass loss in the west proceeds unabated, which will lead to an even further increase in sea level rise," Velicogna said. "But we also observe a mass gain in the Atlantic sector of East Antarctica caused by an uptick in snowfall, which helps mitigate the enormous increase in mass loss that we have seen in the last two decades on other parts of the continent."
- She and her colleagues came to these conclusions in the process of establishing data continuity between the recently decommissioned Gravity Recovery and Climate Experiment (GRACE) satellite mission and its successor, GRACE Follow-On.
- As mission partnerships between NASA and the German Aerospace Center (DLR), and NASA and the German Research Center for Geosciences (GFZ), respectively, the GRACE and GRACE-FO satellites were designed to measure changes to Earth's gravitational pull that result from changes in mass, including water. As water moves around the planet — flowing ocean currents, melting ice, falling rain and so on — it changes the gravitational pull ever so slightly. Scientists use the precise measurements of these variations to monitor Earth's water reserves, including polar ice, global sea levels and groundwater availability.
- The first GRACE mission was launched in 2002 and decommissioned in October 2017. GRACE-FO, based on similar technology and designed to continue the data record of its predecessor, launched in May 2018. Because of this brief gap, the study team used independent data to test and confirm that the GRACE and GRACE-FO data over Greenland and Antarctica were consistent. Velicogna was pleased with the results.
- "It is great to see how well the data line up in Greenland and Antarctica, even at the regional level," she said. "It is a tribute to the great effort by the project, engineering and science teams to make the mission successful."
• August 20, 2019: In May 2019, after the wettest 12 months ever recorded in the Mississippi River Basin, the region was bearing the weight of 8 to 12 inches (200 to 300 mm) more water than average. New data from NASA's GRACE-FO mission, which launched in May 2018, showed that there was an increase in water storage in the river basin, extending east around the Great Lakes. 43)
- Data from the twin GRACE-FO spacecraft are used to measure the change in the mass of water across the planet, providing scientists, decision makers and resource managers with an accurate measure of how much water is retained - not only on Earth's surface, but also in the soil layer and below ground in aquifers. Monitoring these changes provides a unique perspective of Earth's climate and has far-reaching benefits for humankind, such as understanding both the possibility and the consequences of floods and droughts.
- GRACE-FO data will soon be incorporated into the weekly U.S. Drought Monitor maps, an important tool for tracking drought across the United States. Agricultural drought depends not only on rainfall, but also on the quantity and extent of underground water available to plant roots and irrigation. GRACE-FO's estimates of subsurface water are critical to crop and water management.
- The mission also measures mass changes in the thick ice sheets of Greenland and Antarctica. The May 2019 GRACE-FO map of Greenland shows that most of the island continued its long-term trend of ice mass loss. GRACE-FO data from June 2018 through early 2019 (see black-and-white graph) indicate a recent slowdown in Greenland ice loss that has also been observed in data from NASA's Oceans Melting Greenland airborne campaign. This slowdown has been attributed to cooler ocean waters around Greenland for the last few years.
- The GRACE-FO science team is now looking at June 2019 data to assess how the unusually warm weather and rapid ice loss this summer will affect that trend. Greenland's significant ice melt in June and July this year was similar to the strong melting that occurred in the summer of 2012 and led to significant ice loss.
- GRACE-FO launched about a year after the predecessor GRACE mission ceased operations following 15 years in space. "The Earth's climate system has been doing interesting things since we last had observations from the original GRACE mission," said Felix Landerer, the GRACE-FO project scientist at NASA's Jet Propulsion Laboratory in Pasadena, California. "The new GRACE-FO data provide us with crucial information about the changes that are occurring around us. We're excited to be able to make this high-quality data set available to the scientific community."
- GRACE-FO is a partnership between NASA and the German Research Center for Geosciences (GFZ). The twin GRACE-FO spacecraft are operated from the German Space Operations Center in Oberpfaffenhofen, Germany, under a GFZ contract with the German Aerospace Center (DLR). JPL manages the mission for NASA's Earth Science Division in the Science Mission Directorate at NASA Headquarters in Washington. Caltech in Pasadena, California, manages JPL for NASA.
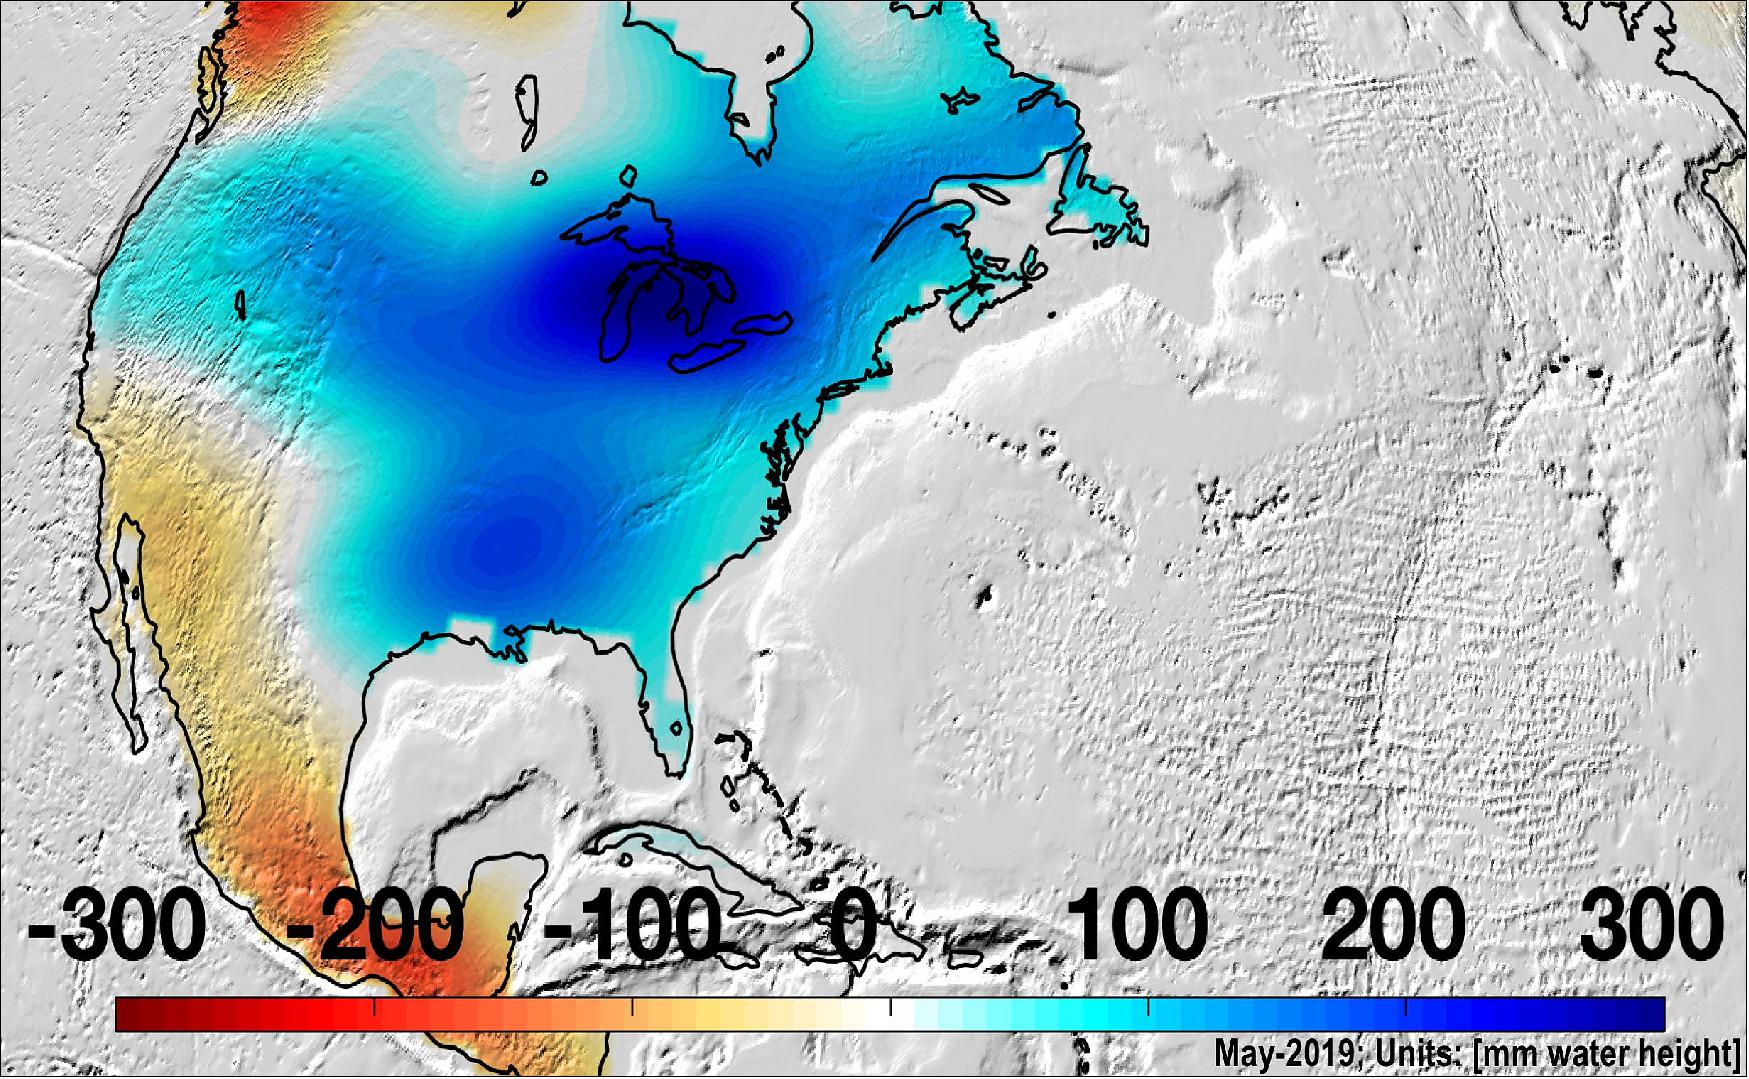
• On 12 June 2019, the GRACE-FO project released their first Level-2 data products, which are now available at NASA’s Physical Oceanography Distributed Active Archive Center (PO.DAAC) and GFZ’s Information System and Data Center (ISDC). This release follows the Level-1 data release on May-24, 2019, which are also available under the above links. 44)
- This first product release includes nine monthly gravity fields from the three mission Science Data System centers (JPL, GFZ, CSR), as well as the corresponding atmosphere and ocean dealiasing (AOD) background model data, spanning the period from June-2018 through April-2019. Subsequent monthly Level-2 products will be available at PO.DAAC and ISDC on a monthly basis starting in July-2019.
• In January 2019, the mission transitioned into the operational science phase (Phase E)with a planned duration of five years from launch. During 8 months of IOC (In Orbit Checkout), the mission collected 5 months of science. Since the Start of Phase E, the mission has collected nearly continuous science and technology demonstration data and delivered data products to the NASA’s Physical Oceanography Distributed Active Archive Center (PO.DAAC). 45)
- The initial gravity fields are consistent with an extrapolation of the trends in water and ice mass changes observed by GRACE. While there are some differences from the extrapolated values, these are very likely real geophysical signals from interannual climate signals. A more detailed verification and validation was part of baseline plan for first 120 days of Phase-E, during which the project fine-tuned the science data processing strategies and calibrations.
• November 01, 2018: The Gravity Recovery and Climate Experiment Follow-On (GRACE-FO) mission has resumed collecting science-quality data and planned in-orbit checks after successfully completing a switchover to a backup system in the microwave instrument (MWI) on one of the mission's twin spacecraft. The in-orbit checks include calibrations and other system tests, and are expected to continue until January, when GRACE-FO will enter the science phase of its mission. 46)
- "The new unit is performing as expected," said Frank Webb, GRACE-FO project scientist at NASA's Jet Propulsion Laboratory in Pasadena, California. "The spacecraft are tracking each other and collecting science-quality data."
- Both GRACE-FO satellites are equipped with redundant systems in their MWIs, which are their primary measurement instruments. The MWIs very precisely measure the distance change between the two satellites.
- The switchover to the backup system was required after an anomaly occurred in a component of the primary system. The primary unit was powered down on 19 July, when an instrument fault monitor detected that it was using less current than expected. After a full investigation by an anomaly response team, the mission team began a series of procedures required to switch over to the new unit. The backup system in the MWI was powered up on 19 October.
- The primary science objective of GRACE-FO – like that of its predecessor GRACE, which operated from 2002 to 2017 – is to track how water is redistributed on Earth by producing highly accurate, monthly gravity field maps. Measurements of changes in Earth's gravity field provide measurements of mass change and enable unique insights into Earth's changing climate, Earth system processes like droughts and sea level changes, and the impacts of human activities on water resources.
• September 14, 2018: The GRACE-FO team plans to switch to a backup system in the Microwave Instrument (MWI) on one of the twin spacecraft this month. Following the switch-over, GRACE-FO is expected to quickly resume science data collection. 47)
- A month after launching this past May, GRACE-FO produced its first preliminary gravity field map. The mission has not acquired science data since mid-July due to an anomaly with a component of the Microwave Instrument on one of the GRACE-FO spacecraft. The mission team is completing its investigation into the cause of the anomaly.
- On July 19, the primary MWI Instrument Processing Unit (IPU) on the GRACE-FO-2 satellite powered down in response to autonomous commands from an instrument fault monitor indicating that the IPU was using less current than expected. The IPU provides various timing references for the satellite as well as onboard digital signal-processing functions for the Microwave Instrument and GPS signals. Each of the two GRACE-FO satellites is equipped with a pair of IPUs — a primary unit and a redundant one — to provide backup in case one unit malfunctions.
- Following several unsuccessful attempts to reactivate the IPU, mission managers at NASA’s Jet Propulsion Laboratory in Pasadena, California, established an anomaly response team on Aug. 6 to investigate the issue. The team is working with the engineers who developed the Microwave Instrument, attempting to reproduce the abnormal behavior in the laboratory to understand the cause of the problem.
- Following completion of the remaining instrument calibrations, the performance and stability of the redundant IPU will be monitored for at least 30 days. Once the instrument’s stable operation has been confirmed, the mission will be on track to enter its science operations phase, beginning with a four-month data-validation period as previously planned.
• July 2, 2018: The LRI (Laser Ranging Interferometer) instrument has been successfully switched on aboard the recently launched twin U.S./German Gravity Recovery and Climate Experiment Follow-On (GRACE-FO) satellites. The LRI, which is being flown as a technology demonstration, has made its first measurements in parallel with GRACE-FO's main microwave ranging instrument, and initial comparisons of the data from the two types of instruments show that they agree as expected. 48)
- "The LRI is a breakthrough for precision distance measurements in space," said LRI Instrument Manager Kirk McKenzie of NASA's Jet Propulsion Laboratory in Pasadena, California, which manages NASA's contribution to the instrument. "It's the first inter-spacecraft laser interferometer and the culmination of about a decade of NASA- and German-funded research and development."
- The GRACE-FO mission, launched on 22 May , continues the work of the original GRACE mission of monitoring phenomena such as the melting of ice sheets and changes in groundwater levels by tracking the changing pull of gravity on the GRACE-FO satellites. The microwave ranging interferometer records these changes in gravity by measuring how they change the distance between the twin spacecraft. By accurately measuring these minute changes as the two spacecraft orbit the planet, scientists are able to calculate month-to-month variations in Earth's gravity field. The LRI is an enabling technology for future GRACE-FO-like missions with potential to significantly improve the accuracy of those missions. The instrument is jointly managed by JPL and the Max Planck Institute for Gravitational Physics (Albert Einstein Institute) in Hannover, Germany.
- The LRI's "first light" operation took place over two days. On 13 June , the two GRACE-FO satellites began sweeping their lasers in spiral patterns in search of each other. Gerhard Heinzel, leader of the space interferometry research group at the Albert Einstein Institute and manager of the German contribution to the LRI, explained the challenge: "There are coin-sized holes on each satellite through which the laser has to be precisely pointed towards the holes in the other satellite over a distance of more than 200 km, while both spacecraft race around Earth at 27,000 km/hour. It is truly mind-boggling."
- In the data that were downlinked the next day, it was clear that each spacecraft had seen several flashes of light during the spiral scans, indicating both LRI instruments received light from the opposite spacecraft and were working as expected. The settings needed to establish a continuous laser link were calculated and uploaded to the satellites, and the LRI delivered its first intersatellite range data at a later downlink that day.
- "The plan for establishing the laser link worked exactly as designed. In fact, the laser link locked in on the first attempt," said Christopher Woodruff, the LRI mission operations lead at JPL.
- In the coming weeks and months, the GRACE-FO research team will work on fine-tuning the operation of this novel instrument and completing their understanding of the data it delivers.
• June 11, 2018: Less than three weeks after launch, the GRACE-FO mission has successfully completed its first mission phase and demonstrated the performance of the precise microwave ranging system that enables its unique measurements of how mass migrates around our planet. 49)
- The twin spacecraft launched May 22 from California's Vandenberg Air Force Base. NASA and German Research Centre for Geosciences (GFZ) engineers and mission controllers at the German Space Operations Center in Oberpfaffenhofen then spent the first few days completing the mission's launch and early operations phase and moving into an 85-day in-orbit checkout period. Science operations will begin when that period has been successfully completed.
- During the initial phase, the twin GRACE-FO satellites were maneuvered into their operational orbit formation approximately 220 km apart. Spacecraft systems were powered on, checked out and found to be performing as expected. Engineers also activated both primary instruments: the accelerometers, which measure forces on the satellites other than gravity, such as atmospheric drag or solar radiation pressure; and the microwave ranging instruments, which precisely measure the distance changes between the two satellites as they orbit Earth. Variations in Earth's gravity field caused by changes in the distribution of Earth's mass on and beneath the planet's surface — such as groundwater withdrawal and ice melt — cause the distance between the two satellites to vary ever so slightly.
- The GRACE-FO microwave ranging instruments allow distance measurements with a precision better than one micron — less than the diameter of a blood cell, or a tenth the width of a human hair.
- During any single orbit of the satellites, some of the largest gravity variations on Earth seen in the satellite ranging data are due to massive mountain ranges. To demonstrate the initial performance of GRACE-FO's microwave ranging system, the team examined its measurements of changes in the distance between the two satellites as they flew over the Himalayas. The results are shown in a figure that team members dubbed "The Himalaya Plot," which may sound like the name of a mystery movie. However, the figure's working name actually refers to the distance changes measured by the microwave ranging system as the satellites flew over the mountains. The plot's wavy lines show how the distance between the satellites varies as the satellites pass over oceans, land areas, and particularly mountains as they orbit Earth. The observed inter-satellite distance changes, which can be as large as hundreds of microns, are in good agreement with expectations. These results give the team confidence that the mission's key microwave ranging system is performing well.
- By measuring even minute changes in distance between the satellites, GRACE-FO can detect the month-to-month variations in Earth's gravity field caused by the movement of mass as small as about a 1 cm of water over an area of about 320 km in diameter.
- GRACE-FO data will provide unique insights into Earth's changing climate, including large-scale changes in our planet's ice sheets and glaciers; Earth system processes that define our environment, such as droughts and earthquakes; and even the impacts of some human activities, such as changes in the levels of aquifers resulting from pumping underground water for use in agriculture. GRACE-FO observations promise to provide far-reaching benefits to society.
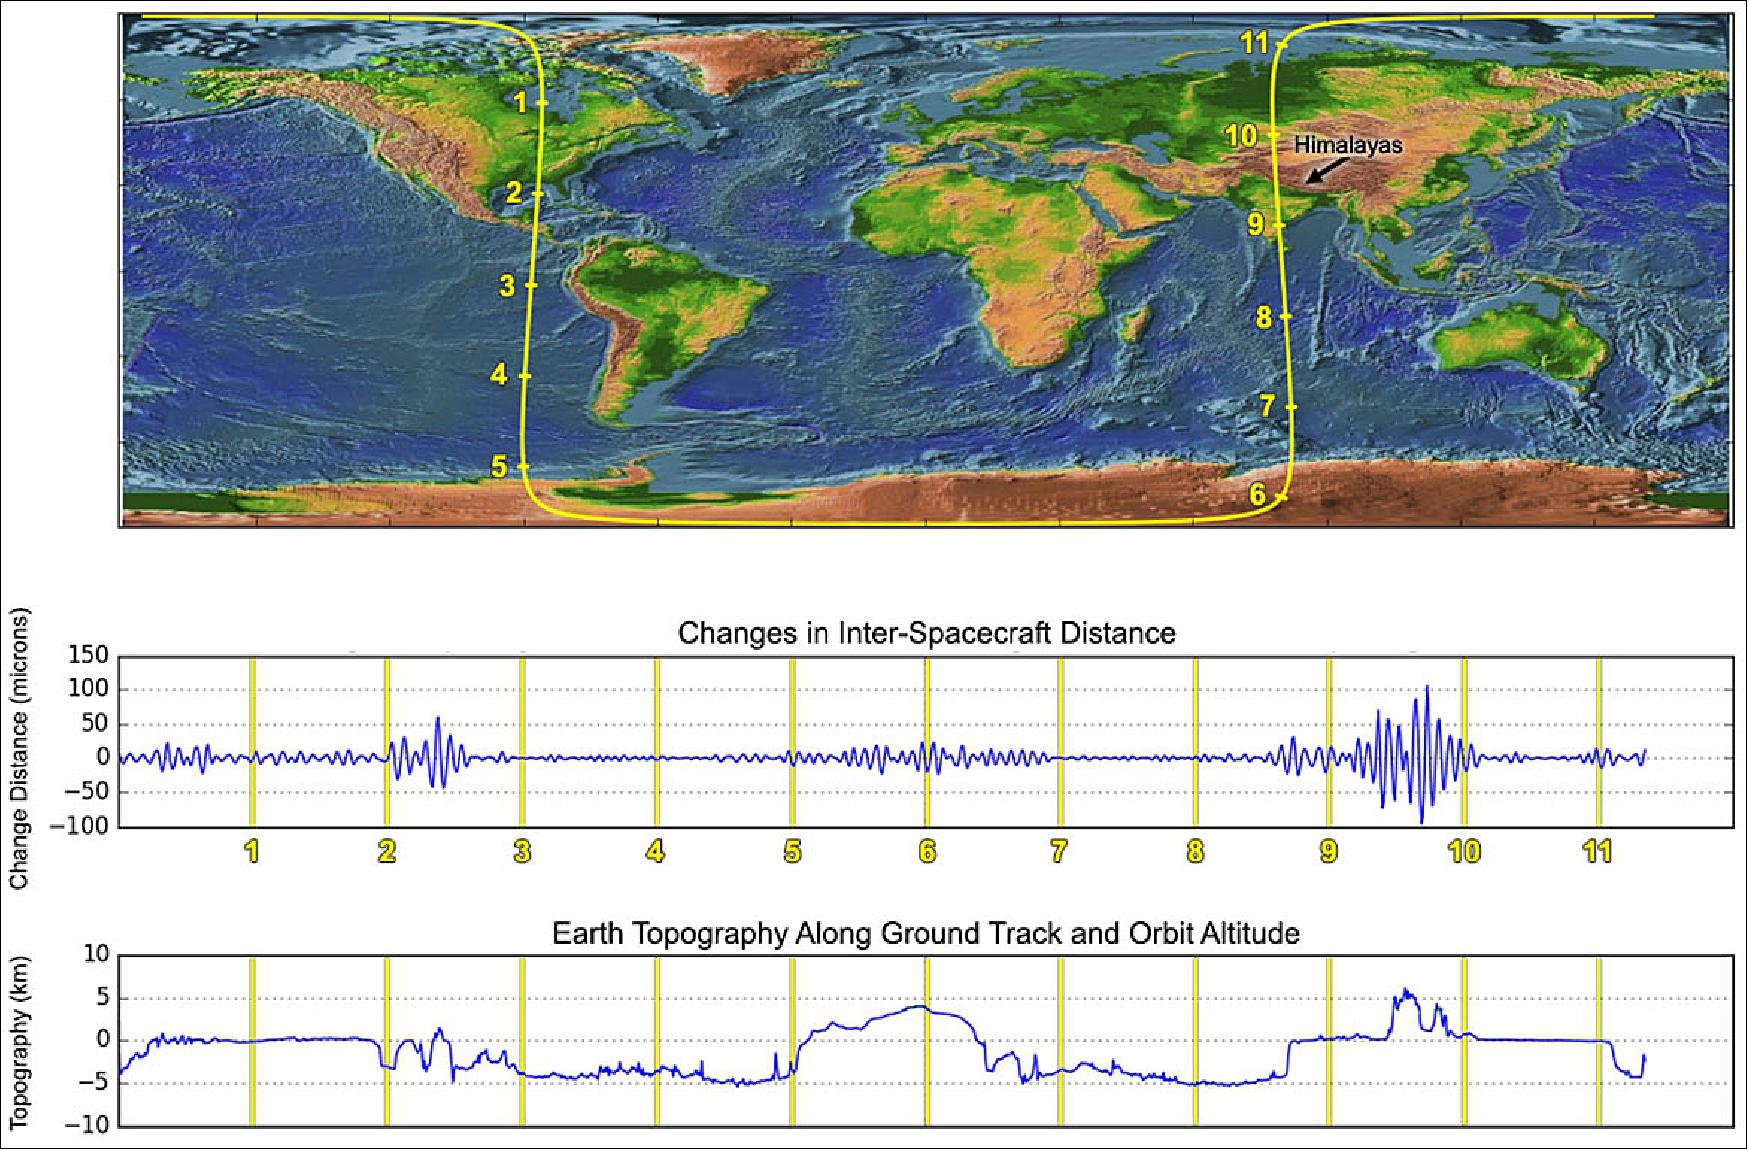
• Ground stations have acquired signals from both GRACE-FO spacecraft. Initial telemetry shows the satellites are performing as expected. The GRACE-FO satellites are at an altitude of about 490 km, traveling about 7.5 km/s. They are in a near-polar orbit, circling Earth once every 90 minutes (Ref. 18). 50)
- The GRACE-FO satellites will spend their first few days in space moving to the separation distance needed to perform their mission. When they reach this distance, the mission begins an 85-day, in-orbit checkout phase. Mission managers will evaluate the instruments and satellite systems and perform calibration and alignment procedures. Then the satellites will begin gathering and processing science data. The first science data are expected to be released in about seven months.
Sensor Complement
The GRACE -FO mission will supplement the original GRACE -1microwave measurement (KBR) with a new LRI (Laser Ranging Interferometer) system. The laser's shorter wavelength and excellent wavelength stability will improve measurement accuracy by a factor of 25. Flying a laser system in addition to the existing microwave system provides this improved measurement capability, yet retains continuity with original GRACE measurements. The microwave system will remain the primary instrument, with the laser system to act as a technology demonstrator instrument.
GRACE-FO consists of two identical satellites in circular polar orbits. Although the orbit is nominally freely decaying and therefore does not have a constant repeating ground-track pattern, the satellite separation is maintained between 170 and 270 km by occasional orbit maintenance maneuvers. The intersatellite distance variations induced by the differential accelerations on the two satellites in orbit are measured using a two-way microwave link. Two frequencies 24 GHz (K-band) and 32 GHz (Ka-band) are used to enable the removal of variable ionospheric delays. It is important to note that the two satellites effectively comprise a single measurement system (Ref. NO TAG#.
The success of the recent satellite gravity missions (CHAMP, GRACE, GOCE)) has demonstrated that the measured Earth's gravity field provides the unique integral measurements of the mass distribution and redistribution in the complete Earth system that are indicators of phenomena such as ice sheet mass balances and isostatic adjustments, terrestrial water storage changes, sea level rises and ocean circulations, tectonic and seismologic activities. As of 2014, the continuity of these measurements is of high importance in many scientific and societal fields. 51)
KBR (K-Band Ranging)
For GRACE-FO, KBR is the key science (and heritage) instrument of the GRACE-1 mission (it is now referred to as the MWI (Microwave Instrument). The objective is ultra-precise satellite-to-satellite tracking (SST) in low-low orbit. The measurement method employed is referred to as DOWR (Dual One Way Ranging). In this approach, each of the two satellites transmits a carrier signal and measures the phase of the carrier generated by the other satellite relative to the signal it is transmitting. The sum of the phases generated is proportional to the range change between the satellites, while the phase variation due to long-term instability in each clock cancels out. 52)
K-band has a radio frequency of about 24 GHz and Ka-band is near 32 GHz. The GRACE K- and Ka-band frequencies are in an exact 3-to-4 ratio on each satellite. The KBR system can measure the range (with a bias) to the µm level.
Variations in the gravity field cause the range between the two satellites to vary. The relative range is measured by KBR (a microwave link which is integrated with a GPS receiver). The measured range variations are corrected for non-gravitational effects by an accelerometer called SuperSTAR. KBR consists of the following elements: USO (Ultra Stable Oscillator), the MWA (Microwave Assembly), the horn, and IPU (Instrument Processing Unit). The IPU and the SPU (Signal Processing Unit) constitute the heart of the instrument system. 53)
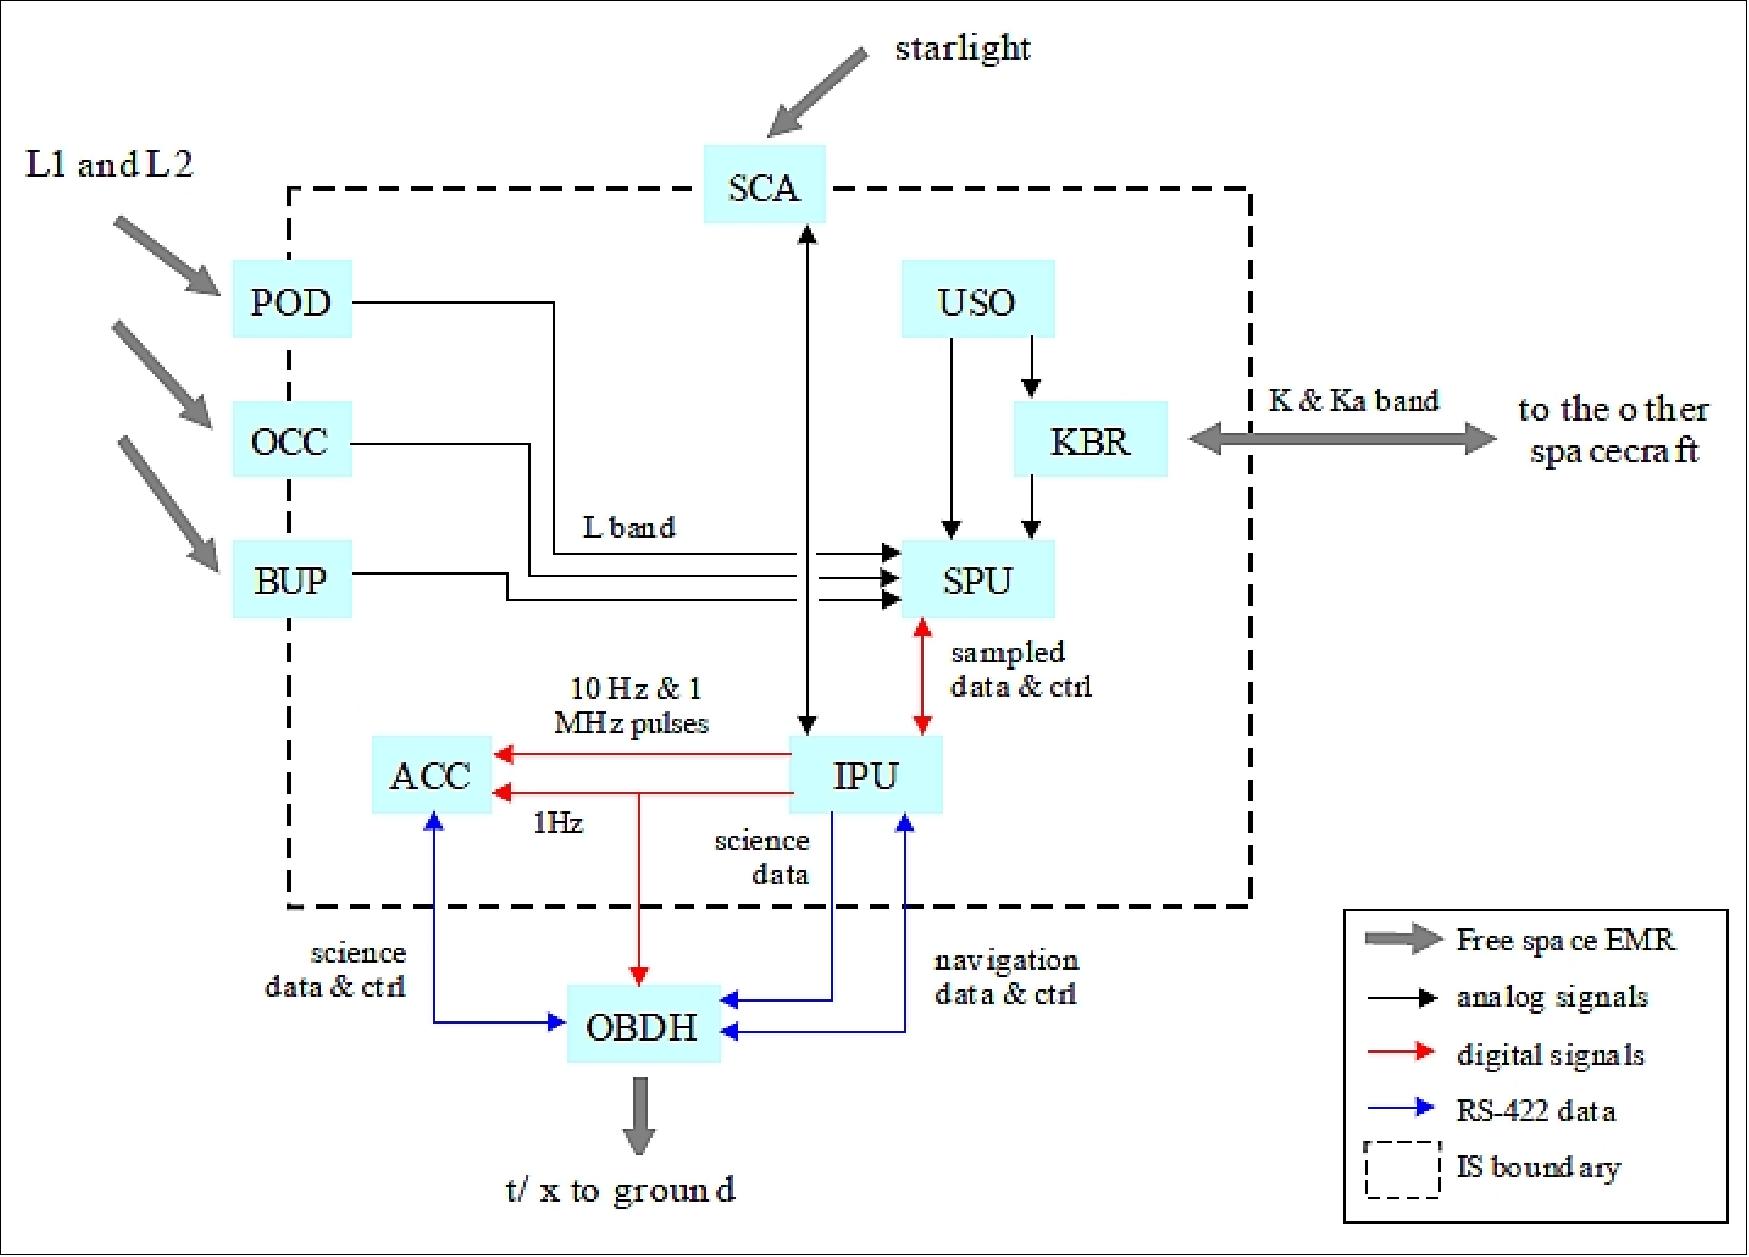
Legend to Figure 42: The IPU, SPU, KBR and ACC are internally redundant, and the ultra-stable oscillator (USO) is redundant.
USO (a heritage instrument of GRACE-1/GRAIL) serves as the frequency reference. The microwave assembly, or sampler, is used for up-converting the reference frequency to 24 and 32 GHz; down-converting the received phase from the other satellite; and for amplifying and mixing the received and the reference carrier phase. The horn is used to transmit and receive the carrier phase between the satellites. - The IPU is used for sampling and digital signal processing of not only the K-Band carrier phase signal, but also the signals received by the GPS antenna and the star cameras. Each satellite transmits carrier phase to the other at two frequencies, allowing for ionospheric corrections. The transmit and receive frequencies are offset from each other by 0.5 MHz in the 24 GHz channel, and by 0.67 MHz in the 32 GHz channel. This shifts the down-converted signal away from DC, enabling more accurate measurements of the phase. The 10 Hz samples of phase change at the two frequencies are downlinked from each satellite, where the appropriately decimated linear combination of the sum of the phase measurements at each frequency gives an ionosphere-corrected measurement of the range change between the satellites.
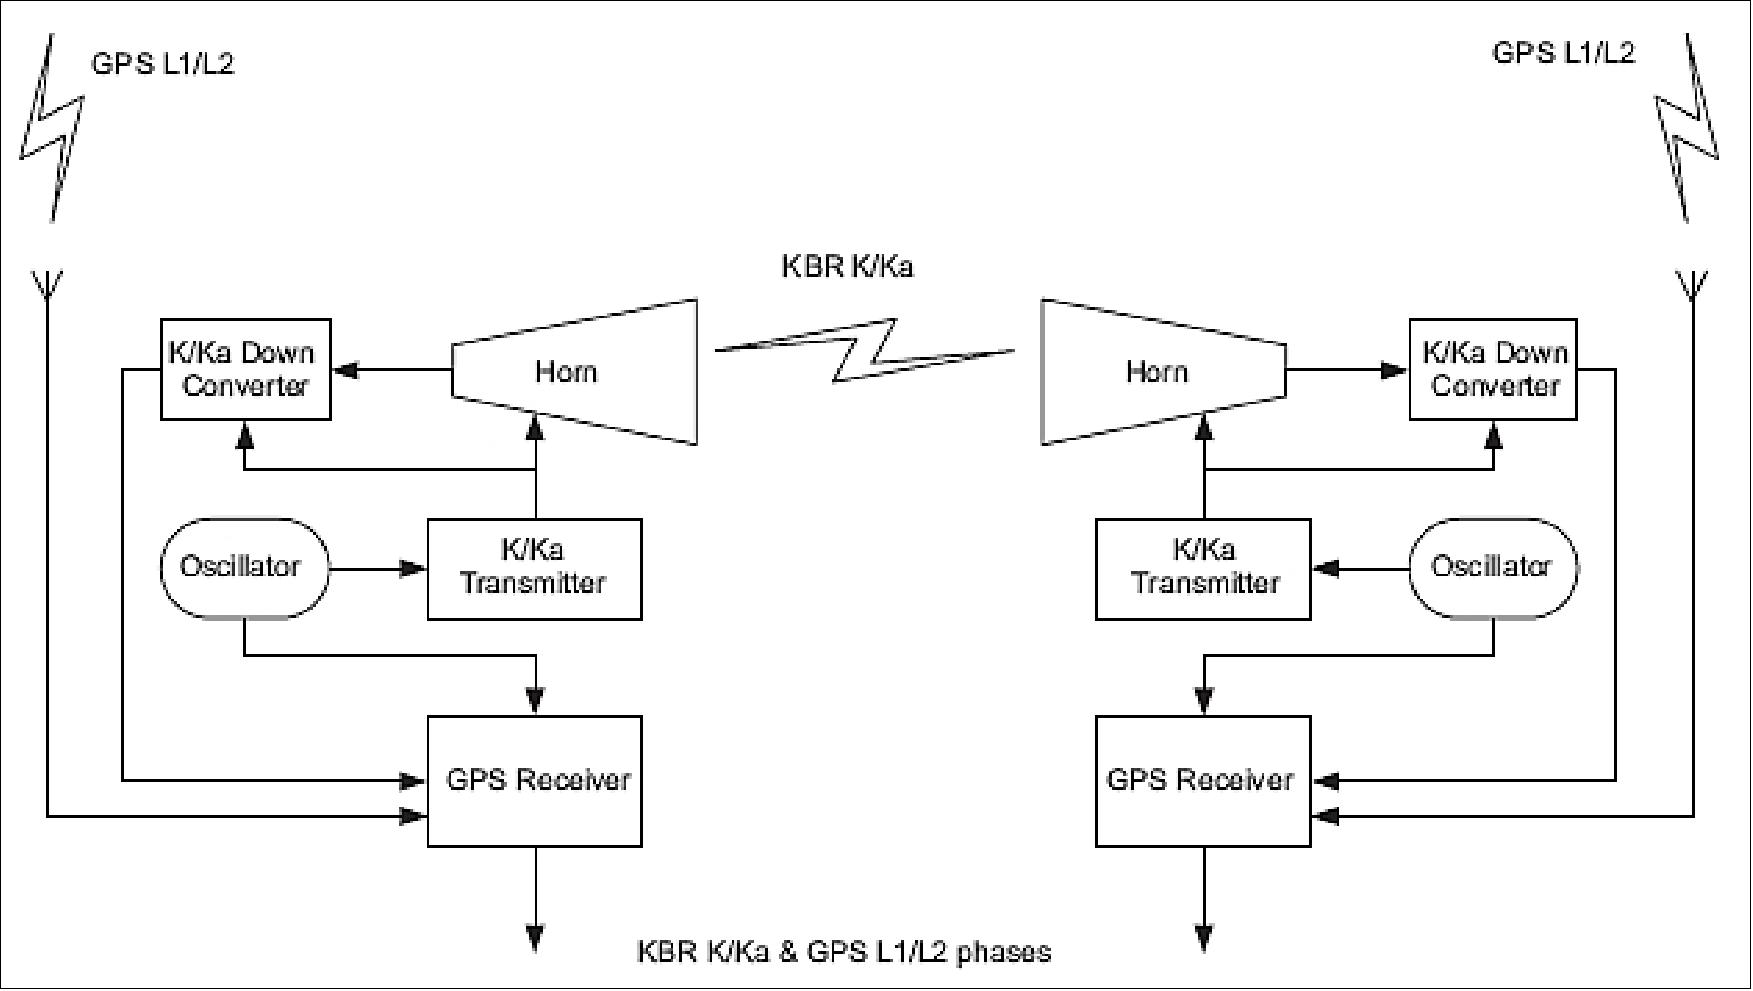
LRI (Laser Ranging Interferometer)
The most significant difference to the GRACE-1 mission is the additional inclusion of an experimental LRI as a technology demonstrator. The objective of LRI is to measure the same range fluctuations as the KBR (K-Band Ranging) instrument, but with less noise, and in addition provides precise measurements of the relative pointing of the satellites to each other. As the LRI is an experimental complimentary instrument, it has less stringent lifetime and reliability requirements than the primary KBR instrument. It is hoped, however, that both instruments can be operated in parallel for a large part of the mission life and thus produce better final results by new combinations of their data, mutual calibration and consistency checks etc. If the LRI performs better than the KBR, as hoped, it will probably be used in future GRACE-type missions as primary instrument. 55)
In addition, LRI will be the first spaceborne laser interferometer to measure distance variations between remote spacecraft, with significant implications for other missions using the same basic measurement such as LISA (Laser Interferometer Space Antenna).
The LRI instrument is a joint US-German development with additional contributions from Australia. NASA will provide the laser, cavity assembly, and ranging processor; the German Space Program (DLR) will provide the measurement optics and steering mirror assembly along with instrument integration and testing. The addition of the LRI instrument is complicated by the fact that its design must be adapted to the existing spacecraft platform design.
The various collaborative institutions of the RFI (Radio Frequency Interference) project are simply referred to as the “RFI consortium”, the main participants are: NASA/JPL (Jet Propulsion Laboratory), Pasadena, CA, USA; Max Planck Institut für Gravitationsphysik, Hannover, Germany; STI (SpaceTech International) Immenstaad, EADS Astrium Immenstaad, Germany; DLR (German Aerospce Center), GFZ (GeoForschungsZentrum), Potsdam, Germany; Tesat Spacecom, Backnang, Germany; ANU (Australian National University), Acton, Australia.
LRI Architecture
The instrument hardware on both spacecraft is identical. It consists of a single frequency laser, a Fabry Perot reference cavity, a triple mirror assembly (TMA) and an[OBS (Optical Bench Subsystem), consisting of the optical bench assembly (OBA) and associated electronics (OBE)] and the instrument electronics, the so called laser ranging processor (LRP). Figure 44 shows an overview sketch of the whole instrument configuration.
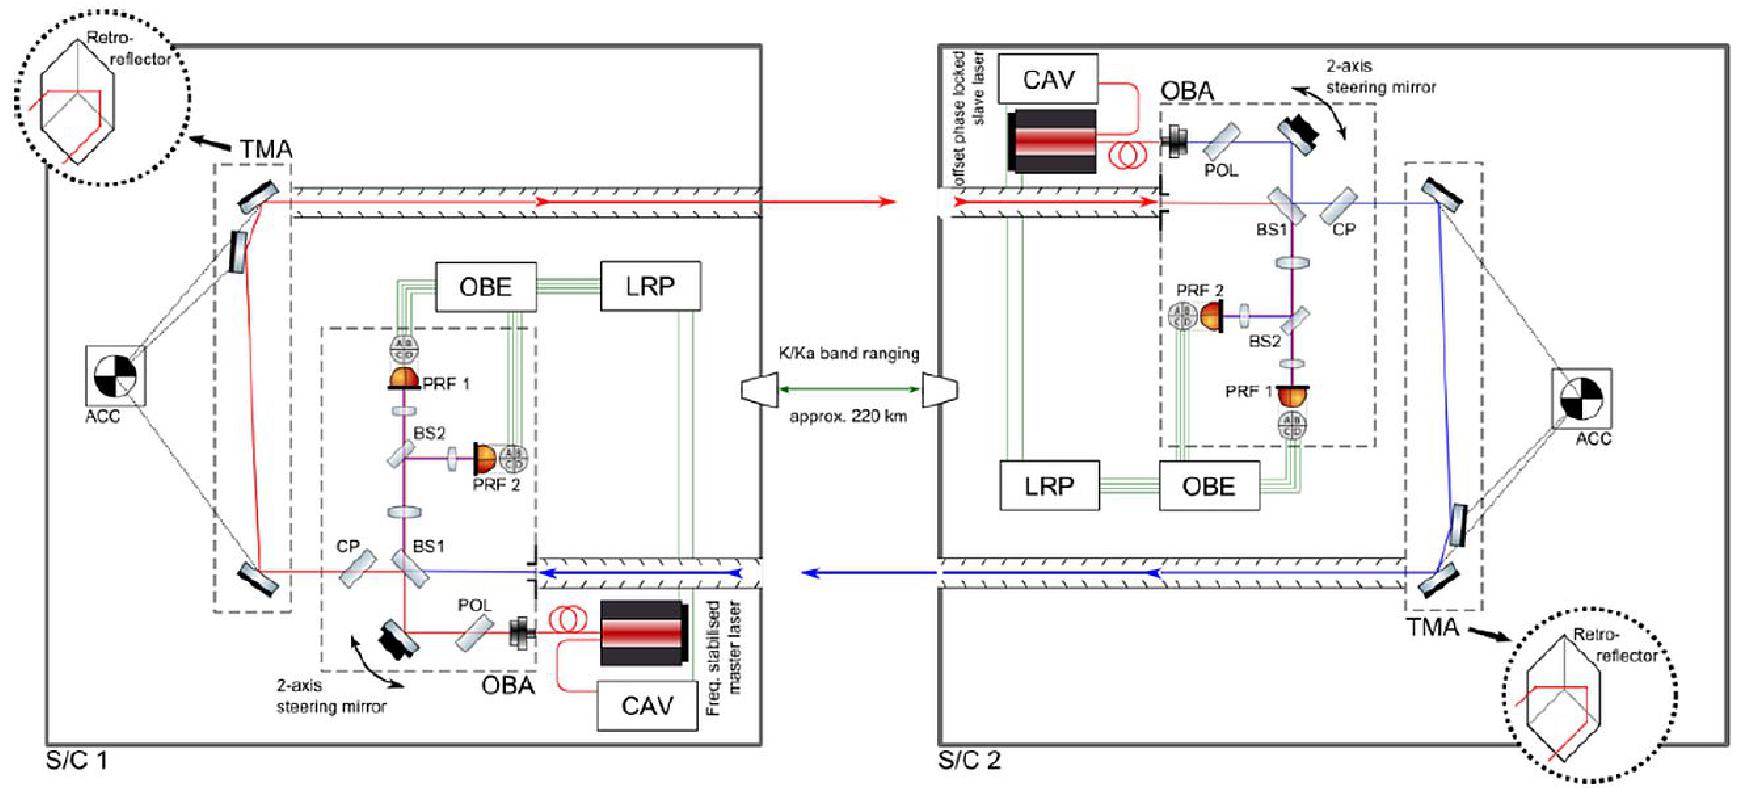
On one spacecraft (the master S/C), the laser is frequency locked to the reference cavity via a fiber link and the beam is launched via the fiber injector onto the OBA. On the OBA it is directed to the quadrant photo receiver as well as to the other spacecraft by means of a beam splitter.
The top level instrument requirement is the ranging noise requirement of:
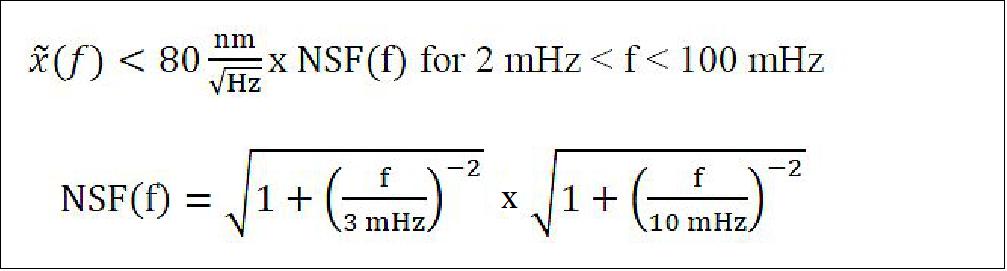
From this requirement several key and driving design requirements for the free space optics part of the LRI (which is the OBA, the TMA and the instrument baffles) and the OBA are derived and listed in Table 1.
Parameter | Requirement LRI | Requirement OBA |
Beam diameter | 5±0.5 mm | 5±0.5 mm |
Free aperture (over FOR) | > 3 x beam diameter | > 3 x beam diameter |
Beam propagation factor M2 | < 1.2 | < 1.2 |
Wavefront planarity (1 e-2) | < λ/8 | < λ/12 |
Beam alignment error | < 50 µrad | < 10 µrad |
FOR (Field of Regard) (1 e-2) | > 4.5 mrad | > 4.5 mrad |
Beam walk on QPR (over FOR) | - | < 10 µm |
Ranging noise | < 80 nm/√Hz x NSF(f) | < 5 nm/√Hz x NSF(f) |
Rotational coupling factor | < 200 µm/rad (in pitch and yaw) | < 80 µm/rad (in pitch and yaw) |
Pointing stability | < 20 µrad over 1 orbit | < 15 µrad over 1 orbit |
Table 2: Key and driving LRI optical design requirements
The beam diameter requirement is derived from the overall power budget, taking required power at the distant spacecraft and heterodyne signal loss under the influence of co-alignment errors into account. The same is true for M2, the required wavefront planarity and the beam co-alignment. The field of regard defines the required laser beam steering range relative to the S/C because of pointing misalignments after launch (caused by uncertainty of the S/C pointing due to star camera errors, launch settling and optimized pointing for the microwave ranging system) and spacecraft AOCS pointing performance of about ±300 µrad.
The straightforward approach of routing the laser beam back and forth along the connecting line between the two spacecraft’s centers of mass is not possible in GRACE-FO since that path is blocked by existing components such as the KBR horn antennas. Hence, an alternative design is used, the so-called ‘racetrack’ configuration shown in Figure 45 (Ref. NO TAG#.
The key geometric element of this design is the system of three mirrors on each spacecraft used to route the beam through each spacecraft. These three mirrors form a corner cube configuration, i.e. their mirror planes are perpendicular to each other. For small rotations of the device, the beam spots are nearly stationary and the corner cube doesn’t need to be complete — only the actually reflecting segments need to be present. This arrangement has a number of useful special properties: The intersection point of the three mirror planes (the vertex of the retro-reflector), can be located outside the mirror device, allowing the effective fiducial measurement point to be placed inside the accelerometer housing. Additionally, two important parameters are invariant under rotation around the vertex, namely:
• the round-trip path length, which is twice the distance between the beam starting point and a plane normal to the beam direction and intersecting the vertex
• the propagation direction of the reflected beam which is always anti-parallel to the incident beam.
These are essential elements to construct a system with high immunity to spacecraft attitude jitter.
The second fundamental ingredient is the frequency domain scheme of offset phase locking. The laser in one of the spacecraft (called S/C 1) in the otherwise perfectly symmetrical setup is designated as master laser and locked in frequency to an on-board reference cavity, to minimize noise originating from laser frequency fluctuations. When arriving at the other spacecraft (S/C 2), the light has picked up a Doppler shift of a few MHz, either positive or negative. Due to the beam divergence and the small apertures necessary to cope with misalignments, less than 1 nW out of 25 mW laser power, are received at S/C 2, such that direct retro-reflection is infeasible. Instead, a local laser is phase-locked to the incoming light with a frequency offset chosen such that after picking up once more the Doppler shift (with the same sign) on the way back to S/C 1, the beat note between the light arriving back at S/C 1 and the local, stabilized, laser at S/C 1 is in the sensitive frequency range of the phasemeter (approximately 2 - 15 MHz).
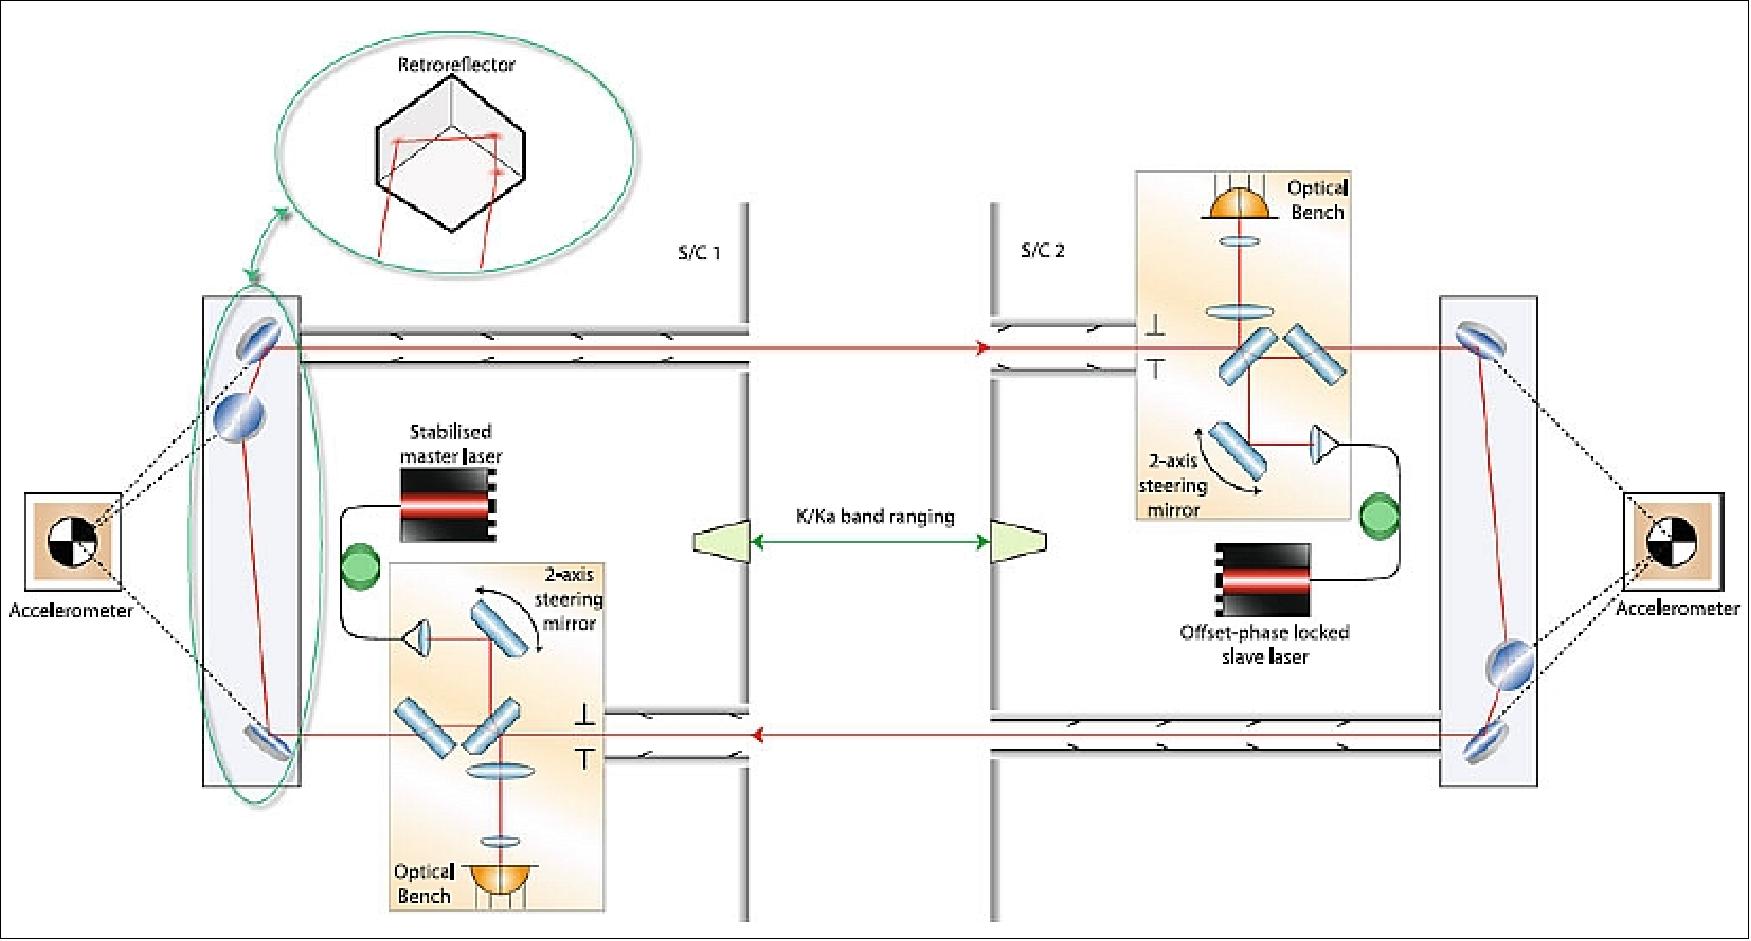
Legend to Figure 45: The microwave ranging system is labelled K/Ka band ranging is centered on axis.
Optical bench: The optical bench features the ultra-stable fiber injector (FIA), the beam fine steering mirror (FSM), superposition of the laser signal, imaging optics as well as the photoreceiver frontends (PRFs) with the quadrant photodiodes. Its key functions are to:
- launch the laser beam to other S/C (via TMA)
- superimpose the received beam and the local oscillator on the PRFs
- convert the optical heterodyne signal to electrical signal and provide to LRP
- enable the beam steering (by LRP command) to cover the field of regard
- enable closed loop beam steering (by LRP) to keep the received beam and the transmitted beam co-aligned
- image the OBA entrance aperture and the FSM onto the PRFs (for beam size adaption, avoidance of beam walk, avoidance of diffraction rings).
Figure 46 shows the setup of the optical bench hardware during the assembly and test campaign at STI. The individual components are either placed in or attached to the optical bench body out of titanium. This approach has been selected to achieve a low thermal noise (due to the high thermal mass enclosing the components) and high beam pointing stability (due to the symmetry of the titanium body with respect to the plane containing the beam). The optical components are out of BK7G18, which is well CTE-matched to titanium, further improving the thermal stability of the OBA.

The first function of the lens system is to simultaneously image both the receive aperture and the steering mirror pivot plane onto the photodetector such that a beam tilt at either the aperture or steering mirror leads to a pure tilt (i.e. without beam walk) on the photodetector. To achieve the correct imaging for both beams, the steering mirror and the aperture on the optical bench must have the same effective distance from the lens system. In addition the imaging system is used to match the beam size to the (smaller) quadrant photodetector.
A high-fidelity optical imaging in the classical sense is not necessary here, since the quadrant photodetector has only four ‘pixels’. The main requirement is a small coupling of tilt into the length measurement. Aberrations of the imaging system are largely common to both beams. The remaining residual coupling is mainly caused by the different spatial profile of the two beams and residual beam misalignments.
The path length through a single beamsplitter is angle dependent which leads to a coupling of the spacecraft attitude jitter into the round-trip length measurement. The coupling factor for yaw is dominant and amounts to 2.2 mm/rad for a 7 mm thick fused silica beamsplitter. For pitch, the coupling factor is quadratic and nominally at a turning point. These coupling factors as a function of spacecraft rotation are shown in Figure 47.
The yaw coupling factor of 2.2 mm/rad is too large by about 20 - 50 times for typical assumed spacecraft pointing jitter and noise budgets. It can be almost completely removed by adding a compensation plate made from the same material as the main beamsplitter but rotated by 90 degrees. This shifts the coupling factor for yaw also to a nominal minimum working point. The coupling factor with a 1 mrad error from the nominal minimum amounts to only 10 µm/rad with the compensation plate. These coupling factors were estimated using simple raytracing along the sensitive path of the interferometer and for nominally perfect geometry.
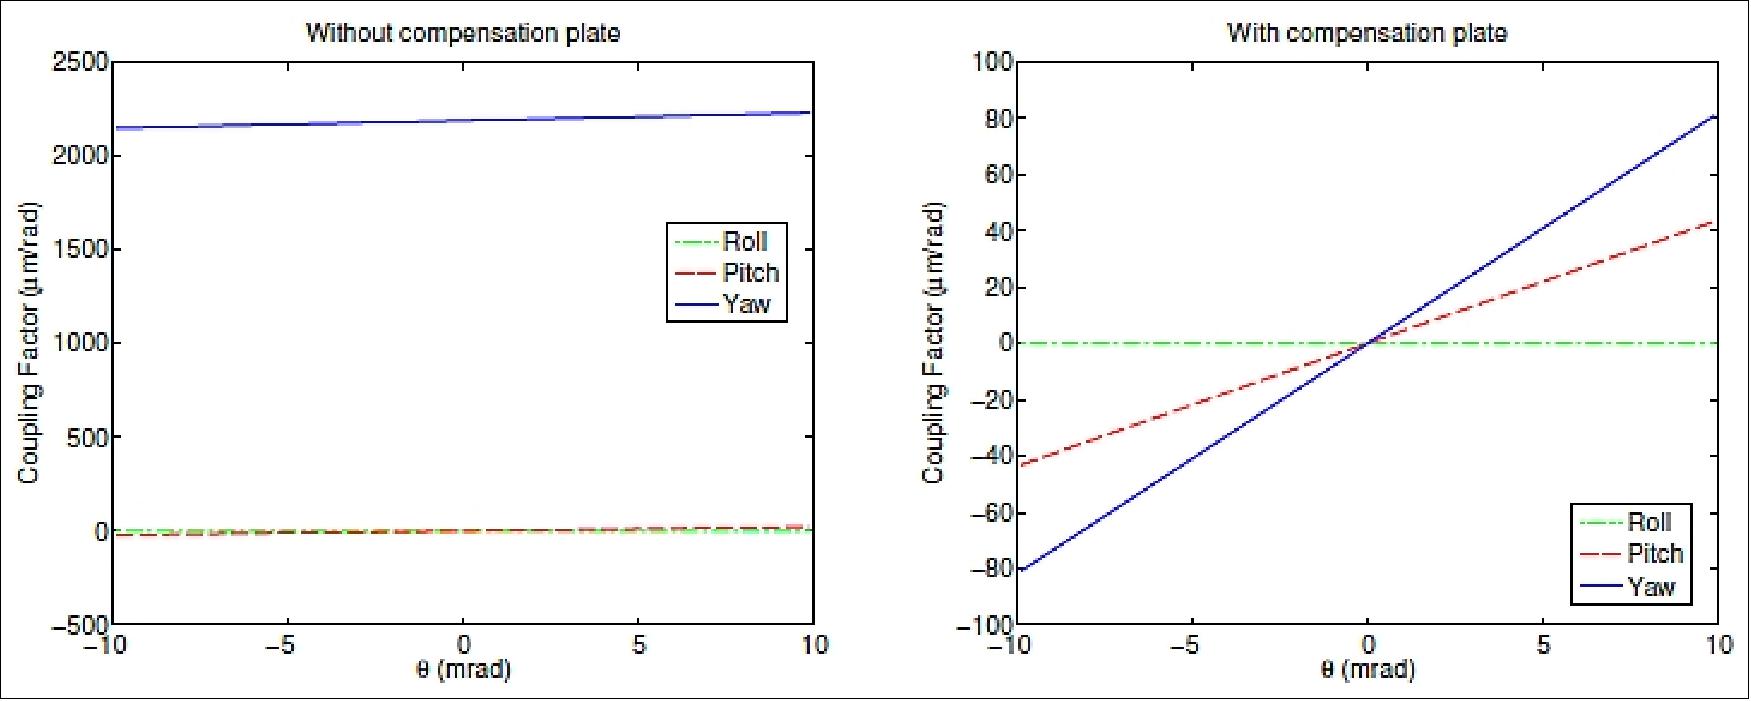
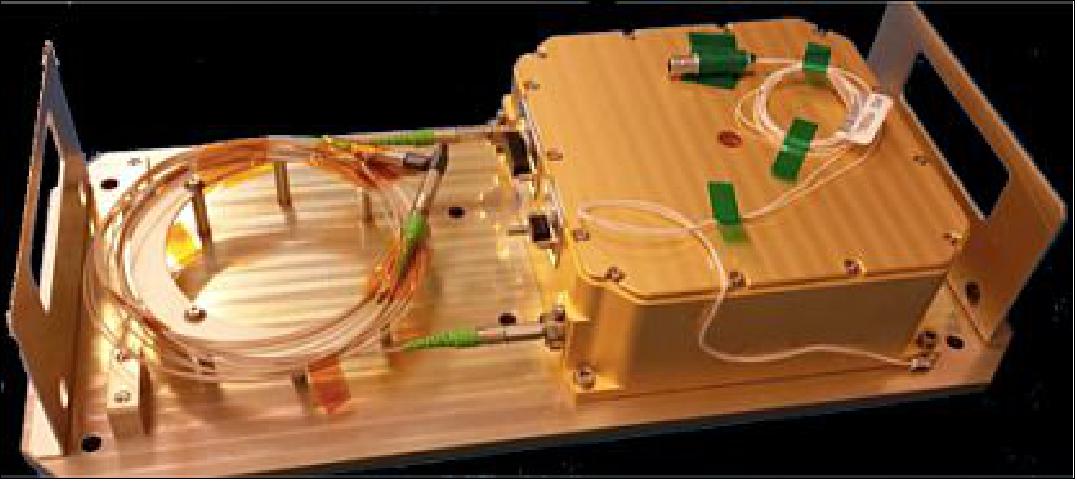
Satellite pointing: The orientation of the GRACE satellites to each other is controlled to a level of a few mrad based on the orbits of the satellites and the star cameras. The actuators are magnetic torque rods and cold gas thrusters in case the Earth’s magnetic field lines are unfavorably aligned or if the disturbances are such that the magnetic torque rods have insufficient control authority. GRACE-FO will use the same basic attitude control scheme. While this level of attitude control is sufficient for the microwave ranging system due its wide beam and receive field of view, these misalignments are too large for the laser interferometer, which requires about 100 µrad pointing accuracy. Therefore, active pointing control is required.
For the LRI instrument of the GRACE Follow-on mission, the pointing control must be implemented internally in the instrument itself. The DWS (Differential Wavefront Sensing) function of the interferometer is used as sensor, and a single steering mirror per spacecraft as actuator, that simultaneously optimizes the interferometer contrast in the receive path as well as the transmit beam pointing.
Beam pointing control does not eliminate the coupling of spacecraft jitter completely from the measurement, since the spacecraft still has a variable physical misalignment which leads to varying beam paths. For example, an offset of the triple mirror vertex from the accelerometer reference point (the effective rotation point after using the accelerometer output in data processing) leads to a coupling of satellite attitude jitter into the measured round-trip length variations. Typical numbers lead to a static alignment requirement of the order of 100 µm for the vertex location in the two directions orthogonal to the beam axis.
Other effects that also lead to such coupling include effects on the optical bench such as incomplete compensation of the beamsplitter path length error by the compensation plate, differential-mode aberrations in the beam compressor lens system, stray light and diffraction effects in the triple mirrors and baffles, etc. It is expected that these effects will be mostly a systematical and reproducible function of the 2D pointing error of the spacecraft, such that they can be at least partially removed in data post-processing if an accurate measurement of the instantaneous pointing error is available. In the LRI, the feedback signal fed to the steering mirror will serve this purpose and will therefore be recorded and downloaded as science data.
DWS (Differential Wavefront Sensing) and Steering Mirror Control: DWS is a well known technique for measuring with high sensitivity the angle between two wavefronts in a laser interferometer. Figure 49 illustrates the basic principle of the DWS technique.
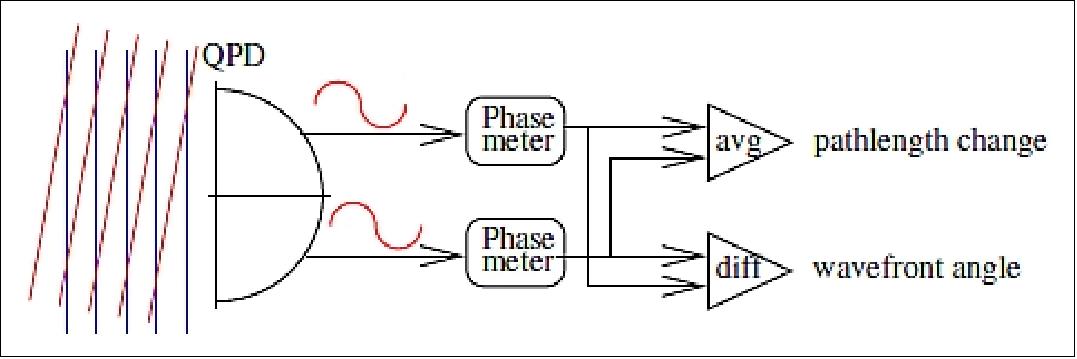
The photodetector is split into 4 segments which are connected to separate phasemeter channels. The average of the measured phases represents the path length signal similar to what a single-element diode would produce, and the difference between ‘left’ and ‘right’ or ‘top’ and ‘bottom’ represents the angle between the wavefronts in horizontal and vertical direction, respectively.
The conversion factor from geometrical angle to electrical phase difference can be very large and contributes to the high sensitivity of the method. With some simplifying assumptions it is given by: k ~16 r (3λ)-1 . → for the case of two flat-top beams, where “r “is the beam radius, and “λ“ is the optical wavelength.
Numerical simulations yield factors of about 20000 rad/rad for the real situation of one Gaussian and one flat-top beam and the planned LRI parameters.
Further benefits of the DWS sensing method are that the result is to first order independent of small lateral movements of the photodiode (or, equivalently, a common-mode beam walk of both beams), and that many noise sources of the path length measurement such as laser frequency noise cancel. In laboratory experiments with comparable parameters, sensitivities of a few nrad/√Hz have been reached.
In the LRI case, the DWS signal represents the relative angle between the received beam and the local oscillator beam. Since the optical bench is rigidly mounted in the spacecraft, the angle of the received beam w.r.t. the optical bench represents the misalignment of the local spacecraft’s optical axis w.r.t. to the the other spacecraft. The angle of the local oscillator beam w.r.t. the optical bench, on the other hand, is directly controlled by and only depends on the steering mirror. Figure 50 illustrates the principle of operation of the steering mirror control loop.
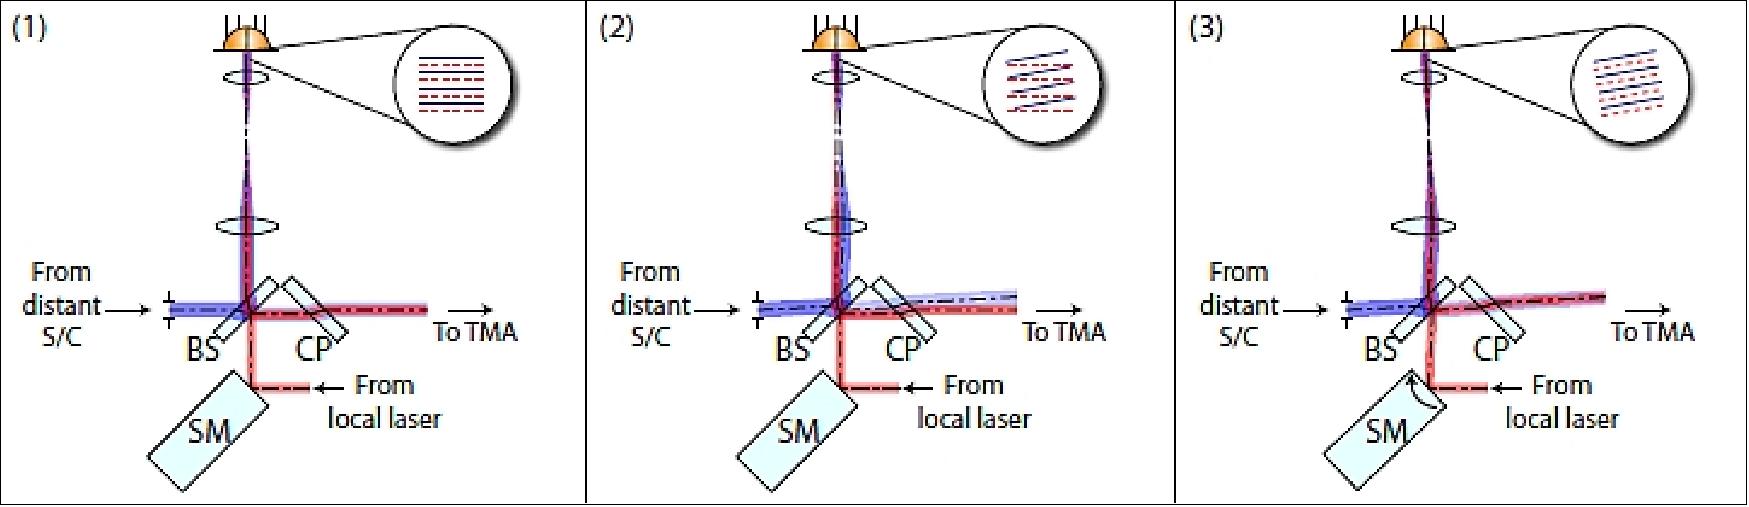
Legend to Figure 50: From left to right: (1) nominal situation with spacecraft perfectly aligned, (2) spacecraft misalignment produces a non-zero DWS signal on the photodetector, (3) feedback to steering mirror makes DWS signal zero and makes the outgoing beam parallel to the incoming beam. SM - steering mirror, BS - beamsplitter, CP - compensation plate.
Three situations are shown in Figure 50. The first is the nominal situation where the incoming beam and the local beam are aligned. The illustration in the middle shows the situation when the spacecraft alignment changes, leading to a non-zero DWS signal and also to a misalignment between the incoming and outgoing beam directions. Consequently, both the local heterodyne efficiency and the power received at the other spacecraft decrease. Closing the steering mirror control loop (right part of Figure 50) zeros the DWS signal by rotating the steering mirror until the local and incoming beams are parallel on the photodetector. This yields not only optimal interference contrast on the photodetector, but also ensures that local and received beams are parallel at the beamsplitter BS.
Together with the second property of the triple mirror (“the propagation direction of the reflected beam which is always anti-parallel to the incident beam”), this leads to the outgoing beam being parallel to the incoming beam, independent of the local spacecraft orientation. The transmitted beam thus always points back to the other spacecraft, and the local spacecraft can be considered an “active retroreflector”. This very useful behavior only occurs when no lenses or other curved optical elements are included in the main round-trip beam path, since such elements would change the beam direction. As a consequence, the same unmodified laser beam needs to serve both as transmit beam the propagation direction of the reflected beam which is always anti-parallel to the incident beam.
Receive aperture radius | 4 mm |
Laser power | 25 mW |
Effective received power (a) | ~200 pW |
Table 3: Parameters chosen as baseline design
Legend to Table 3: The value for the “Transmission efficiency for receive path” parameter includes the reflection from the beamsplitter and loss in the imaging optics, but neither the photoreceiver efficiency nor the heterodyne efficiency. The heterodyne efficiency is, however, included in the effective power computation. The “Transmit efficiency” includes the fiber power splitter, transmission through the components on the optical bench and the TMA.
Case (a) for the effective received power applies to perfect alignment, while case (b) represents a misalignment of both transmitter and receiver of 100 µrad each. This misalignment is not the actual spacecraft orientation, but only the beam pointing error due to residual errors and offsets in the beam steering control loop and optics.
The information about the real spacecraft pointing is still required to compensate residual coupling effects of that pointing into the path length measurement. As the DWS signal has been driven to near zero by the loop, it is not useful for that purpose any more, but the information must be obtained from the feedback signal to the steering mirror instead. This requires either a very linear and predictable mirror actuator, or an internal sensor within the actuator that yields an accurate representation of the actual mirror angle.
Laser frequency stabilization subsystem:
In laser frequency stabilization systems, an independent, stable frequency reference is compared to the frequency of the laser. This measurement is then used by a feedback system to change the laser frequency so that it matches the independent reference. The stability of the frequency reference sets the ideal limit to the frequency stabilization system.
A common means to provide a stable laser frequency is to form an optical cavity by attaching mirrors to the ends of a ‘spacer’ made of a material of with a very low thermal expansion coefficient. The laser frequency is locked to the length of the cavity by comparing the laser output frequency with light which has resonated in the cavity. Glasses such as zerodur or ULE have thermal expansion coefficients of order 3 x 10⁻⁸/K. The optical cavity can be insulated from external sources of heat, so that temperature fluctuations experienced by the cavity are reduced (Ref. 55).
The laser frequency stabilization goal adopted for this development is a frequency noise power spectral density of 30 Hz/√Hz over the frequency range of interest, 10 mHz to 100 mHz, corresponding to length scales of 700 km to 70 km. Performance at lower frequencies (longer length scales) is also of interest but is expected to be limited more by atmospheric drag calibration than by laser frequency stability. Frequency stability is limited by brownian motion noise of the spacer to about one order of magnitude lower than the adopted goal. Performance approaching the brownian-noise limit has been achieved in laboratories. The project adopted a less ambitious goal to ensure that the system can survive launch vibration and on-orbit thermal extremes.
The cavity is based on a design available from Advanced Thin Films and used successfully in laboratory tests. The spacer is made out of ULE. The spacer cross-section tapers from the middle towards each end and is designed to be mounted vertically to reduce distortions due to ground vibration. While mounting in the center is not as important for use in space, the vertical mounting has potentially improved performance when testing prior to launch. The length of the spacer is 77.5 mm. End mirrors were attached using optical contacting. The mirror coating was chosen to achieve a finesse of about 10,000. This is lower than typical for laboratory use, but eases requirements on alignment of the injection optics, which must survive launch and the space thermal environment.
The cavity is mounted from a flange by titanium flexures bonded to the spacer, as shown in Figure 51. The flange is part of a titanium vacuum enclosure which serves as the first stage of a two-stage thermal isolation enclosure. It provides a controlled vacuum environment to reduce fluctuations of refraction within the cavity and eliminates convection between the cavity and the vacuum enclosure. Laser light is injected into the cavity via a single-mode optical fiber. An optical bench made out of zerodur contains optics to match the spatial mode from the output of the fiber into the cavity. The optical bench is also made of zerodur and is mounted to the cavity using titanium flexures. A photodetector is mounted to the vacuum flange to allow the alignment of the injection optics to be checked using light transmitted through the cavity. Light output from the cavity is mixed with the input light from the laser with a beam-splitter and transmitted through a window on the bottom of the vacuum enclosure to a second photodetector.
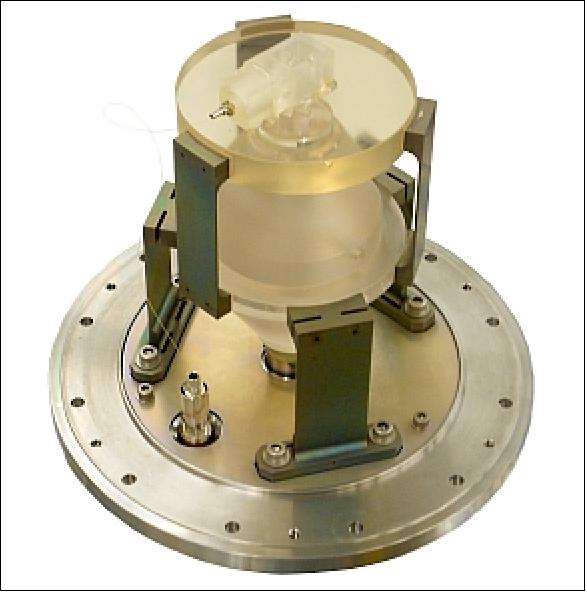
Figure 52 shows the cavity mounted within the titanium vacuum enclosure which has been coated with gold to reduce radiative heat transfer between the cavity and the enclosure can and also between the vacuum can and the external aluminum thermal shield shown next to the cavity. The current implementation includes a vacuum valve and ion gage on the vacuum flange for testing purposes. For the planned flight unit, the valve and gage will be removed to reduce volume and mass. Heaters and temperature sensors are attached near the top and the bottom of the outer aluminum enclosure to control the temperature of the ends of the enclosure.
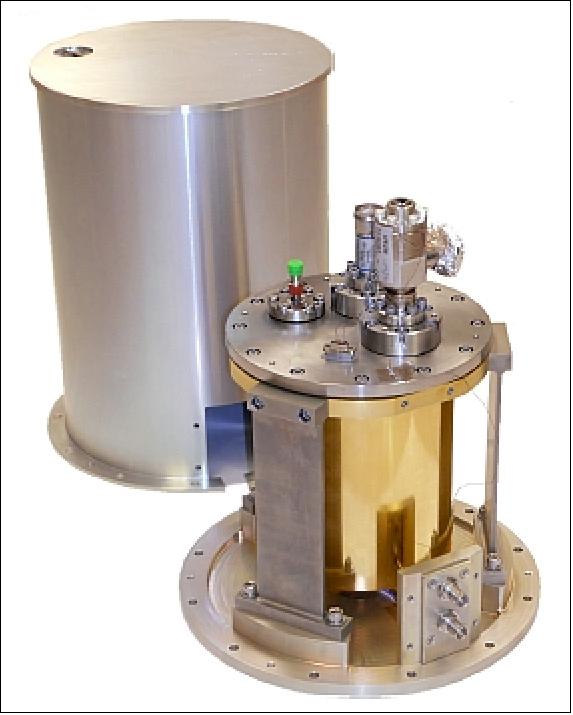
Status of LRI in fall 2014 (Ref. NO TAG#:
• LRI has a transponder architecture:
- Cavity stabilization on S/C-1, offset phase lock on S/C-2
- Tripple mirror and steering mirror keep pointing to other S/C, independent of local S/C rotation.
• LRI design well chosen to fulfill the requirements
- LRI will improve the distance measurement in comparison to KBR (K-Band Ranging)
- Latest tests show the subsystems are working together as predicted
- Flight model production has started.
ACC (Accelerometer)
ACC (of SuperSTAR heritage on GRACE) is an improved accelerometer developed by ONERA, France. The objectives are: 56) 57)
• Better thermal stability through a new electronic design
• Improvement of thermal characterization (on ground and through temperature housekeeping)
• On-ground characterization of differential bias and scale factor between both FM accelerometers.
ACC is designed to measure the weak level of acceleration sustained in orbit by the satellites of the GRACE‐Follow‐on mission. The electrostatic space accelerometer of ONERA is very similar to the SuperSTAR instrument operating for the last 10 years on board the twin GRACE-1 satellites. The ACC also takes into account the return of experience learned from the six GRADIO accelerometer models composing the three axis gravity gradiometer of the GOCE mission of ESA, which demonstrates both the robustness and the achieved performances of this family of space instruments. In addition to thermal stability improvement and of better operation reliability, the GRACE Follow-on instrument shall exhibit a more accurate pre launch calibration, a lowered noise level at low frequency bandwidth and a better stability in order to fit with the laser interferometer ranging demonstration.
The GFO accelerometer is similar to the GRACE one. Its operation is based on highly accurate position and attitude control of an inertial Titanium alloy proof mass of 72 gram. Exhibiting a resolution better than 10-10 ms-2 Hz-1/2, the accelerometer measures the satellite’s linear acceleration along three axes (denoted by: XACC, YACC and ZACC) and angular acceleration about these same axes (respectively Φ, Θ, Ψ). The three accelerometer axes have different characteristics. The XACC axis is designed to withstand a high voltage to levitate the proof mass and compensate Earth’s gravity during ground tests of the YACC and ZACC axes. These axes are defined with respect to the geometry of the electrodes surrounding the proof mass (Ref. 51).
The accelerometer outputs are obtained from the measurements of the analog voltages which provide the electrostatic forces needed for keeping the proof mass at the center of the electrode cage. The accelerometer is thus constituted by two subsystems: the SU (Sensor Unit) and the ICU (Interface Control Unit).
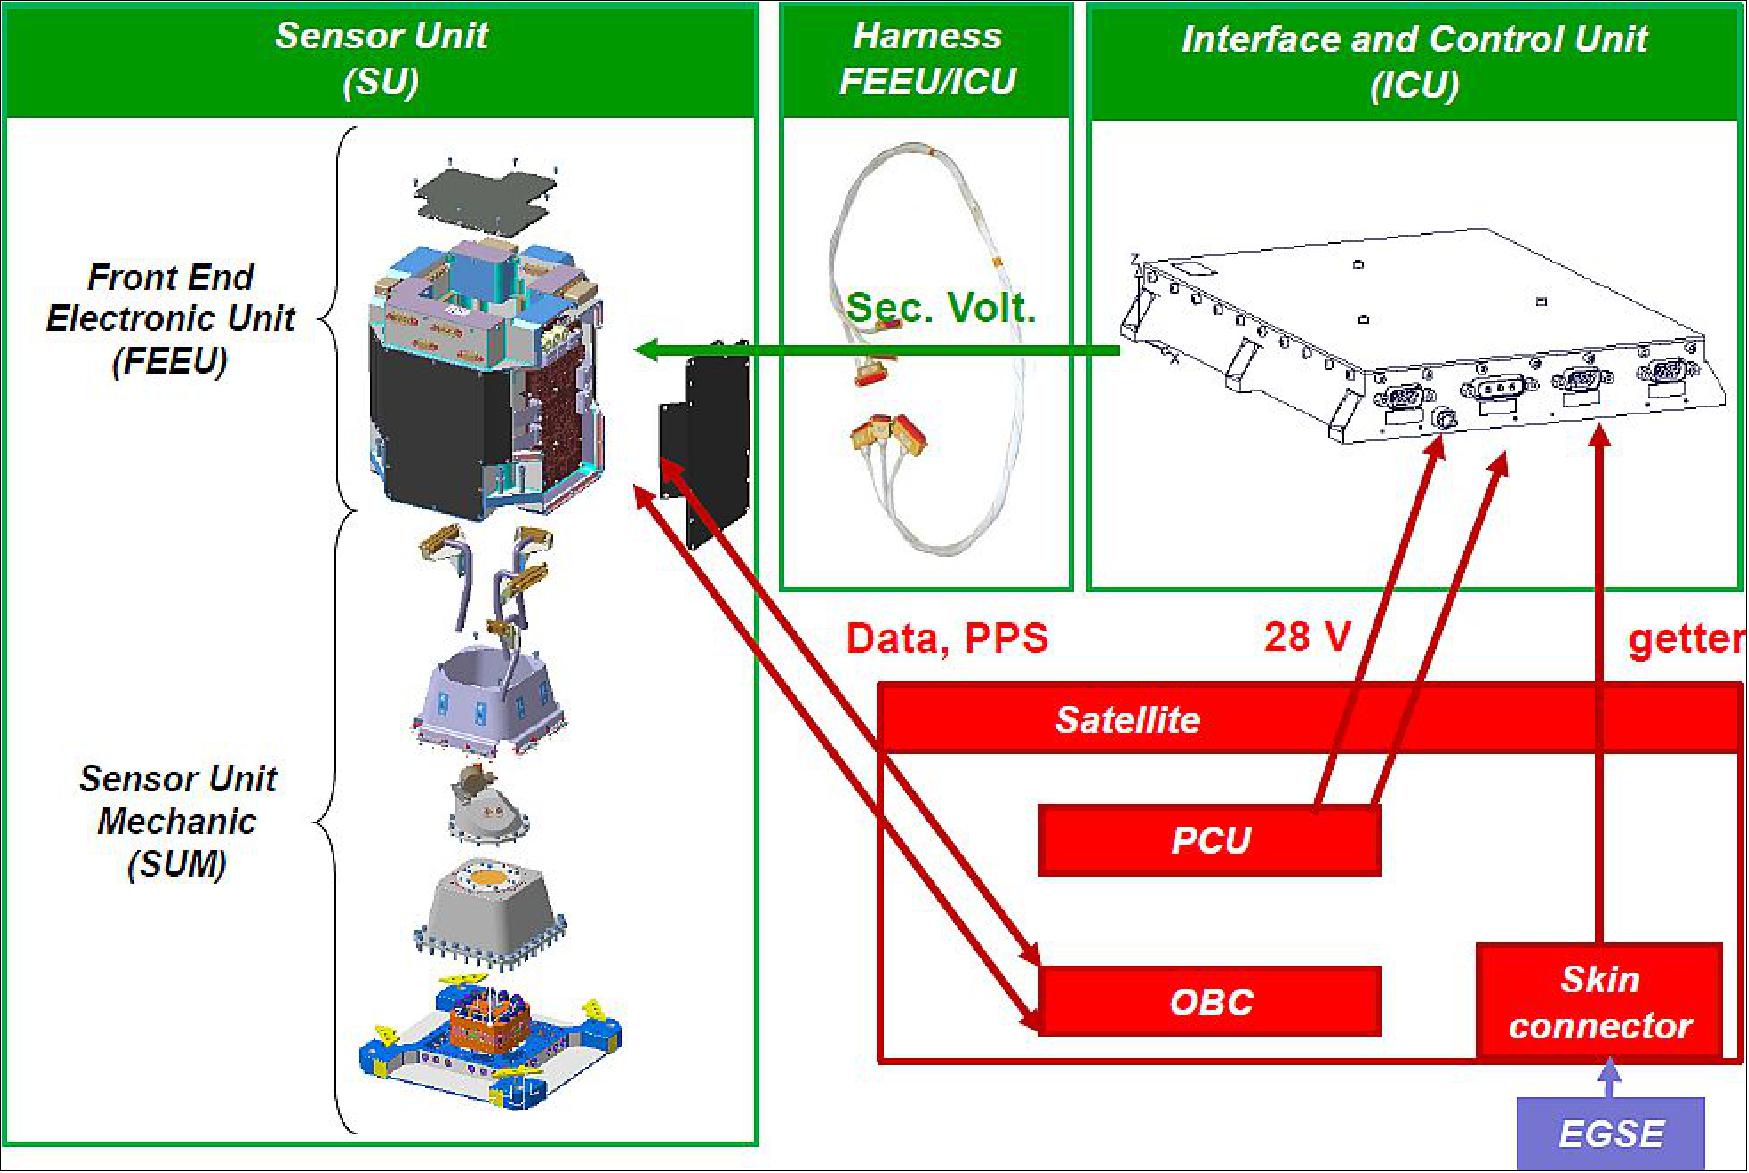
The SU consists of the parallelepipedic proof mass, suspended inside an electrode cage made in gold coated ultra low expansion silica. The motion of the proof mass is detected by capacitive sensors and servo-controlled using the same electrodes to apply the quasi DC actuation voltages. This core (mass and electrode cage) is mounted on a sole-plate and enclosed inside a tight housing inside which a good level of vacuum is maintained with a getter material. During on ground storage, a small ion pump also helps to maintain the vacuum and is also used to monitor the level of residual pressure through its current measurement. The SU mechanical (SUM) assembly is surrounded by four boxes containing the FEEU (Front End Electronics Unit). The FEEU boxes contain respectively:
- the position sensing, analog control loops and Analog to Digital Sigma Delta converters for the 2 YACC and ZACC ultra sensitive axes and Φ rotation acceleration outputs
- the position sensing, analog control loops and Analog to Digital Sigma Delta converters for the XACC less sensitive axis and Θ and Ψ rotations acceleration outputs
- the precise and stable references voltages Vp for actuation linearization, Vd for position sensing and Vref for Analog to Digital accurate conversion
- the FPGA which leads the digital operations and insures the interface with nominal and redundant data links to the satellite.
The SU, sensor mechanics associated with the front end electronics units, is thermally controlled in a range of ± 0.1ºC over one orbit.
The ICU (Interface Control Unit), which could be far from the SU, includes only the DC/DC converters for the generation of the secondary regulated power lines (+3.3 V, +5 V, ±15 V, ±48 V) from the satellite nominal and redundant power buses.
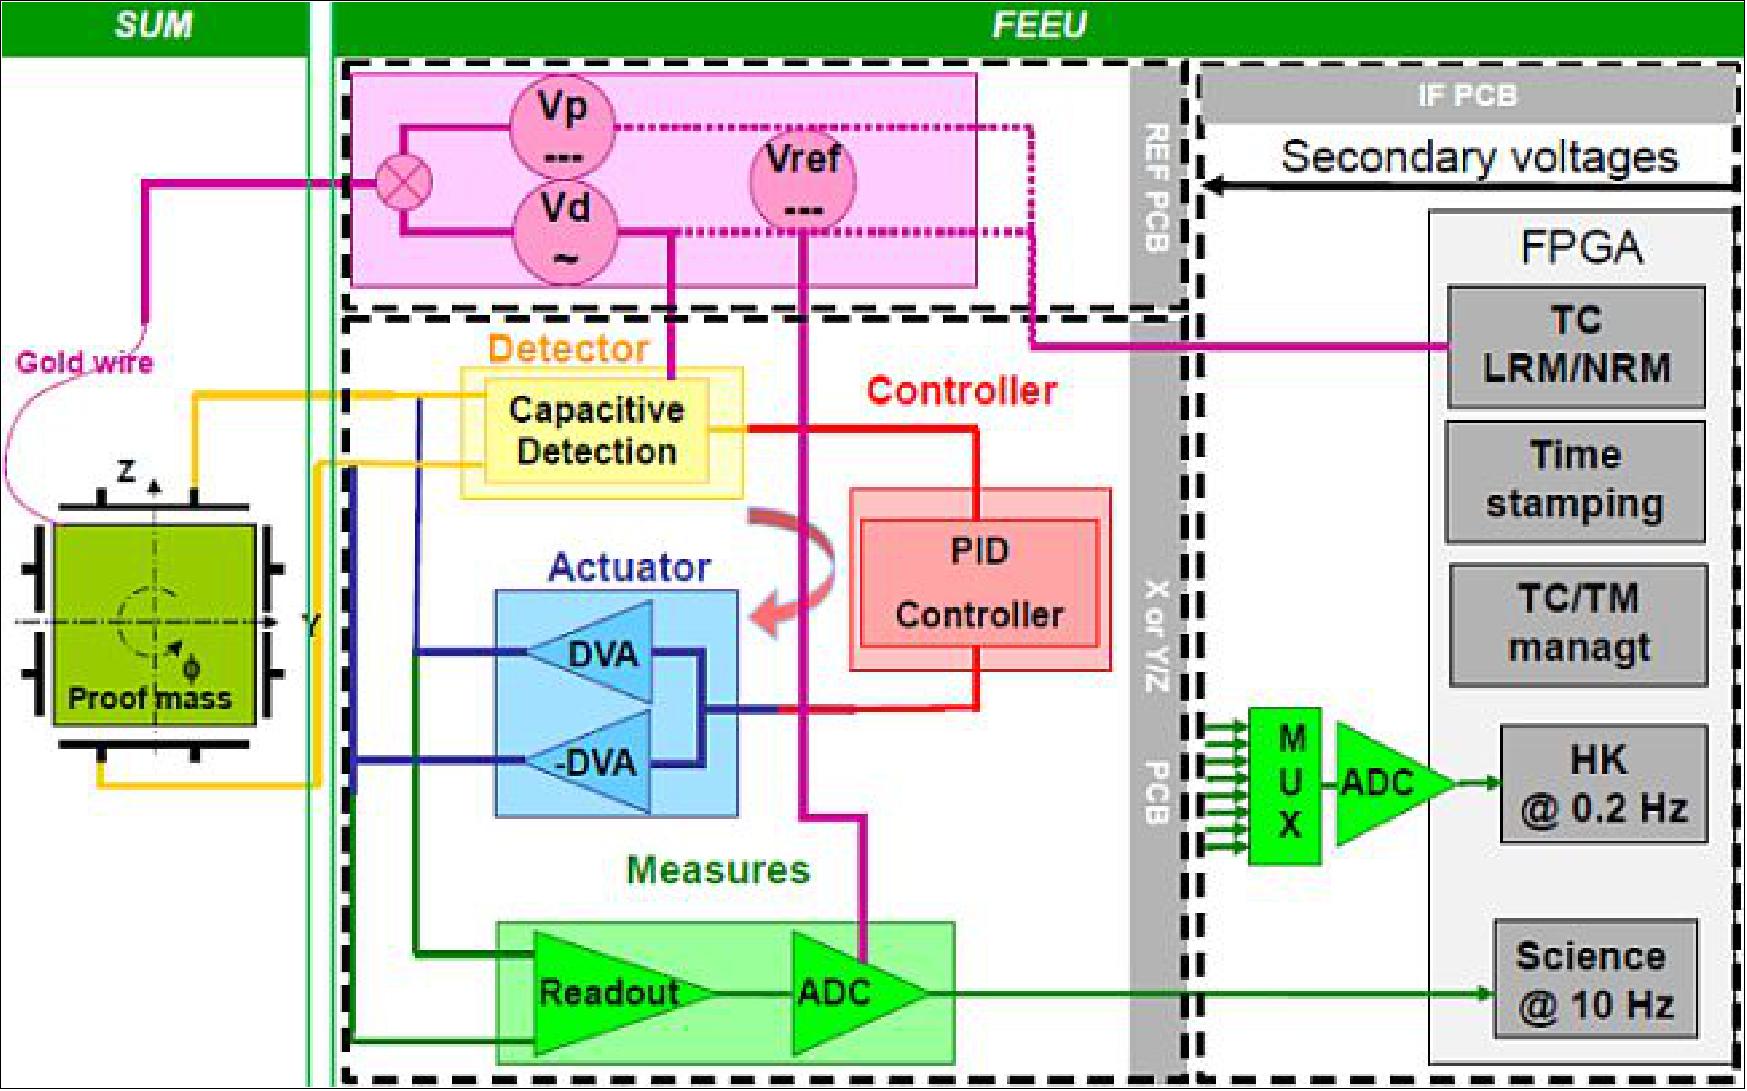
Performance: The performances required for the GFO accelerometer are the same as the GRACE ones. They are mainly driven by the maximum acceleration control range of ±2.5 x 10⁻⁴ms-2 requested due to the system excitation by the spacecraft thrusters and by the measurement range, respectively, of ±5 x 10⁻⁴ms-2 along the XACC axis and of ±5 x 10⁻⁵ms-2 along the YACC and ZACC axes.
Figure 55 presents the exhaustive sources of noise of the acceleration measurement along the satellite to satellite axis (drag axis).
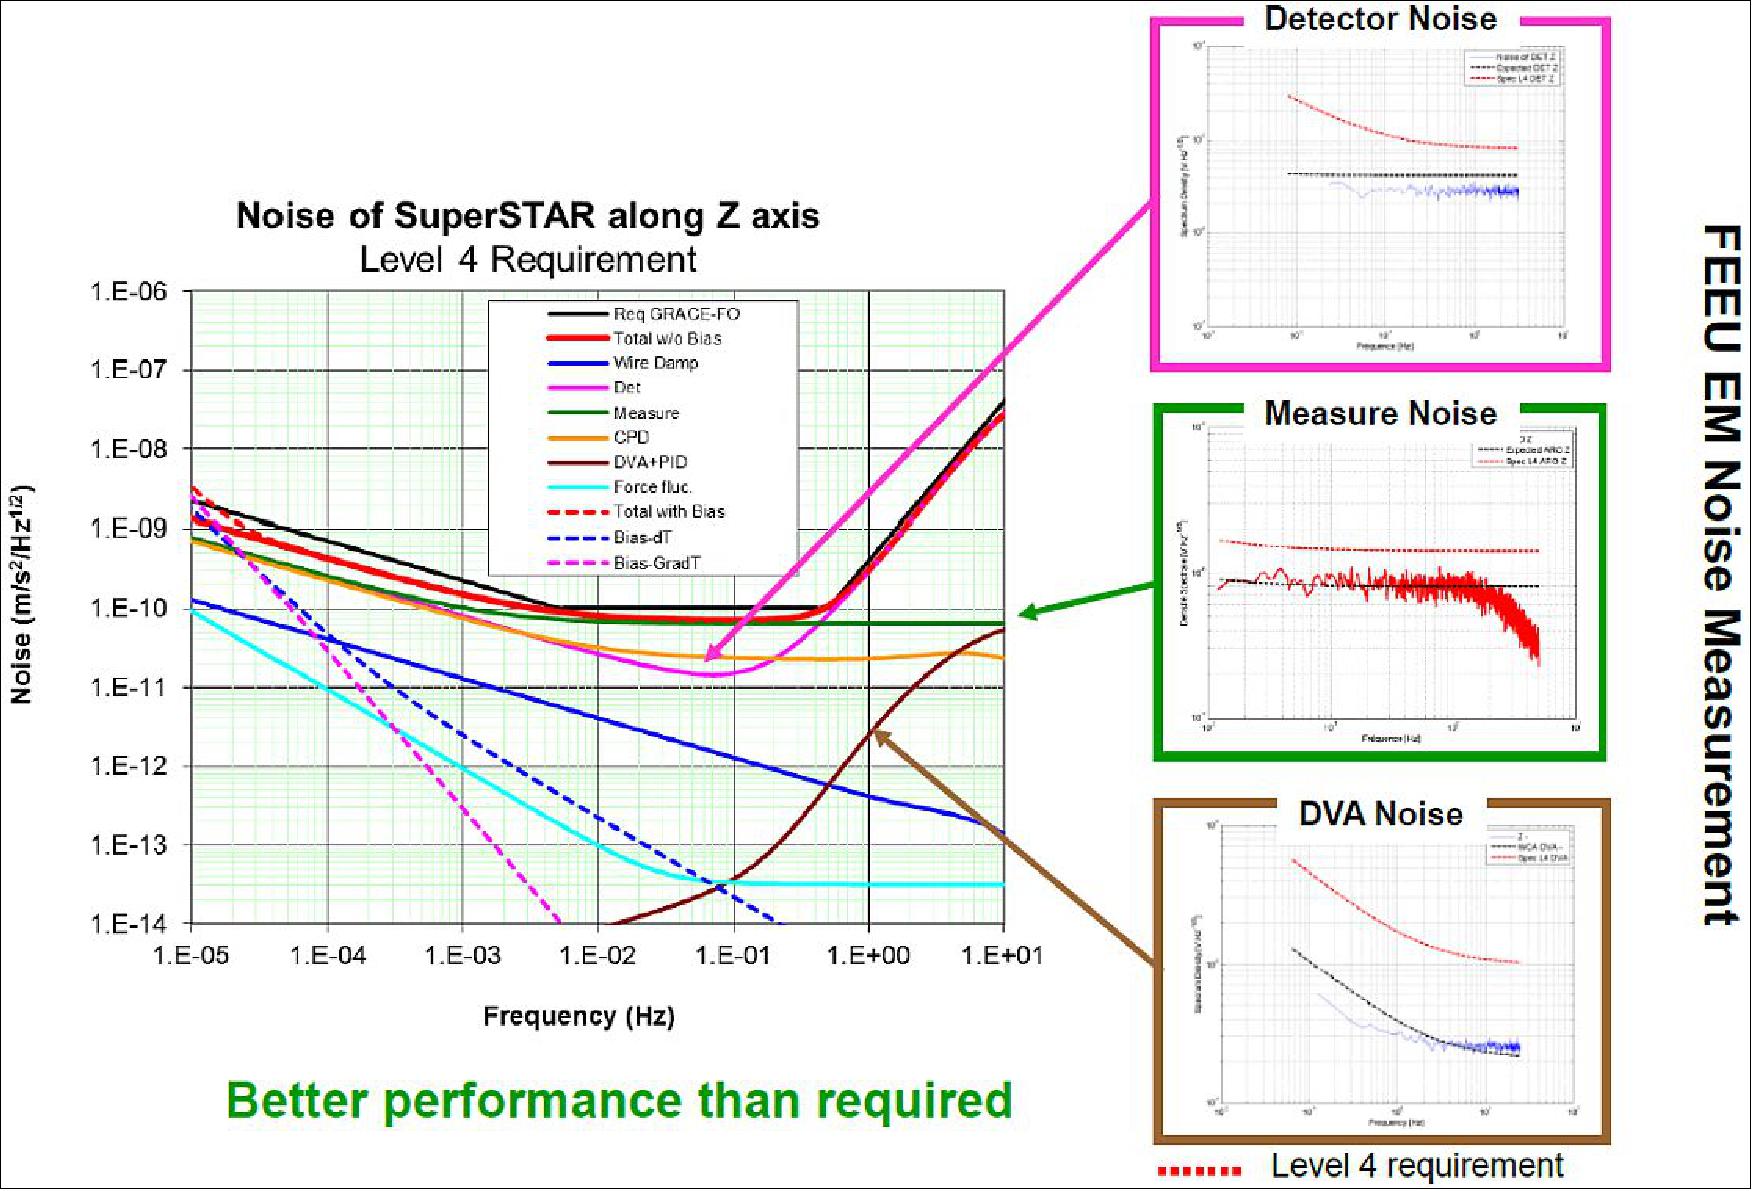
Development status of GFO accelerometer:
• September 2015: The GFO accelerometer will be delivered to Airbus DS in December 2015. 58)
• The CDR (Critical Design Review) was held in September 2014 and is successful (Ref. 57).
• The accelerometer EM (Engineering Model) has been built in 2013 and the verification of the design and performance is under completion since the beginning of 2014. The CDR (Critical Design Review) was held in September 2014, followed by the realization of the 3 accelerometer Flight Models : one for each satellite and a spare model. The delivery of the accelerometer is foreseen for September 2015, for a launch in August 2017.
Next gravity missions: As GFO prepares, the future NASA mission GRACE-2 (or GRACE-II), which will not start before 2020, ESA is presently performing preliminary studies of the NGGM (Next Generation of Gravity Mission). 59)
SCA (Star Camera Assembly)
SCA is of GRACE-1 and CHAMP heritage. The objective is the precise measurement of satellite attitude. SCA consists actually of two DTU (Technical University of Denmark) star camera assemblies (2 cameras with sensor heads), each with a FOV of 18º x 16º and one DPU (Data Processing Unit). Both assemblies are rigidly attached to the accelerometer, and view the sky at a 45º angle with respect to the zenith, on the port and starboard sides. The SCA is used for both: science as well as AOCS; the two assemblies provide the primary precise attitude determination for each satellite. The baffles are used to avoid the degradation due to solar heating. SCA measures the S/C attitude to an accuracy of < 0.3 mrad (with a goal of 0.1 mrad) by autonomous detection of star constellations using an onboard star catalog.
TriG-RO [Tri-GNSS (GPS+ Galileo+GLONASS) Radio Occultation receiver]
NASA/JPL (Jet Propulsion Laboratory) is developing a next-generation GNSS space science receiver, the TriG receiver. The receiver will upgrade the capabilities offered by the current state of the art BlackJack/IGOR GPS science receivers in order to meet NASA’s decadal survey recommendations. This includes the ability to track not only GPS, but additional GNSS signals, including Galileo, CDMA GLONASS and Compass.
The TriG receiver is a NASA funded instrument. The hardware development is at Moog Broad Reach (formerly Broad Reach Engineering), the software development and complete end-to-end testing is at NASA/JPL. While the TriG instrument was in particular developed for the FormoSat-7/COSMIC-2 (Taiwan- US constellation), it is also intended to be used for a number of upcoming missions: DESDynI (Deformation, Ecosystem Structure, and Dynamics of Ice), ICESat-2 (Ice, Cloud and land Elevation Satellite-2), Jason-CS (Jason Continuity of Service), SWOT (Surface Water Ocean Topography), DSAC (Deep Space Atomic Clock), GRACE-FO, and other NASA/NOAA missions. 60)
The next generation TriG science instrument provides the following observation capabilities:
• POD (Precise Orbit Determination)
• GNSS-RO (GNSS Radio Occultation)
• Neutral Atmosphere, Ionosphere, and Scintillation
• GNSS-R (GNSS Reflections)
TriG receives all L-band GNSS signals (GPS, Galileo, GLONASS, Compass) and DORIS.
- TriG has a separate science processor and a navigation processor (dual processor architecture)
- TriG possesses higher SNR compared to its previous generation receivers (particularly for RO and reflection)
- TriG is tolerant to a total ionizing dose of 40 kRad
- TriG offers a greater flexibility to accommodate future requirements.
References
1) M. Watkins, M. Gross, B. Tapley, S. Bettadpur, F. Flechtner, B. Doll, J. Munder, C. Reigber, J.-C Raimondo, “GRACE Follow-On Mission Status,” AIAA Space 2010 Conference & Exposition: 'Future Earth Science Missions and Enabling Activities,' Aug. 30 to Sept. 2, 2010, Anaheim CA, USA
2) Bryant Loomis, “Simulation study of a follow-on gravity mission to GRACE,” Dissertation, University of Colorado at Boulder, 2009, Publication Number: AAI3387503; ISBN: 9781109535563
3) “Gravity Recovery and Climate Experiment-Follow-On (GRACE-FO) Mission,” GFZ, URL: https://www.gfz-potsdam.de/sektion/globales-geomonitoring-und-schwerefeld/projekte/gravity-recovery-and-climate-experiment-follow-on-grace-fo-mission
4) I. Panet, J. Flury, R. Biancale, T. Gruber, J. Johannessen, M. R. van den Broeke, T. van Dam, P. Gegout, C. W. Hughes, G. Ramillien, I. Sasgen, L. Seoane, M. Thomas, “Earth System Mass Transport Mission (e.motion): A Concept for Future Earth Gravity Field Measurements from Space,” Surveys in Geophysics, DOI 10.1007/s10712-012-9209-8, published online: 31 Oct. 2012
5) Th. Gruber, J. L. Bamber, M. F. P. Bierkens, H. Dobslaw, M. Murböck, M. Thomas, L. P. H. van Beek, T. van Dam, L. L. A. Vermeersen, P. N. A. M. Visser, “Simulation of the time-variable gravity field by means of coupled geophysical models,” Earth System Science Data (ESSD), Vol. 3, pp.19-25, 2011, URL: http://www.earth-syst-sci-data.net/3/19/2011/essd-3-19-2011.pdf
6) Pierluigi Silvestrin, Bernardo Carnicero Dominguez, Roger Haagmans, Luca Massotti, Amanda Regan, Christian Siemes, ”Satellite formations and constellations for synergetic missions: a paradigm for international cooperation in Earth observation,” Proceedings of the 66th International Astronautical Congress (IAC 2015), Jerusalem, Israel, Oct.12-16, 2015, paper: IAC-15-B1.1.4
7) ”GRACE-FO Will Help Monitor Droughts,” NASA/JPL, 14 May 2018, URL: https://www.jpl.nasa.gov/news/news.php?release=2018-098
8) Stephen Clark, “NASA procures satellites for new gravity mission,” Spaceflight Now, Dec. 2, 2012, URL: http://spaceflightnow.com/news/n1212/02grace/#.UPat5JGQk9Y
9) Frank Flechtner, Mike Watkins, Phil Morton, Frank Webb, “Status of the GRACE Follow-on Mission,” Joint GSTM (GRACE Science Team Meeting)/SPP Final Colloquium, 17, Sept, 2012, GFZ, Potsdam, Germany
10) ”Twin Spacecraft to Weigh in on Earth's Changing Water,” NASA News, 30 April 2018, URL: https://gracefo.jpl.nasa.gov/news/126/twin-spacecraft-to-weigh-in-on-earths-changing-water/
11) ”German-built gravity research satellites are on the way to the launch site at Vandenberg Air Force Base in California – launch is planned for spring 2018,” Airbus, 12 Dec. 2017, URL:http://www.airbus.com/newsroom/press-releases/en/2017/12/AdieuGRACE-FO.html
12) ”Next-Generation GRACE Satellites Arrive at Launch Site,” NASA, 13 Dec. 2017, URL: https://www.nasa.gov/feature/jpl/next-generation-grace-satellites-arrive-at-launch-site
13) ”Transport to Vandenberg launch site in California planned for December,” Airbus DS, 10 Nov. 2017, URL: http://www.airbus.com/newsroom/press-releases/en/2017/11/GRACE-FO-satellites.html
14) ”GRACE-FO satellites get an earful,” Airbus DS, May 2, 2017, URL: https://www.airbus.com/en/newsroom/press-releases/2017-05-grace-fo-satellites-get-an-earful
15) ”Airbus completes first GRACE-FO satellite for NASA/JPL,” Airbus Press Release, October 28, 2016, URL: https://www.airbus.com/en/newsroom/news/2016-10-airbus-defence-and-space-completes-first-grace-fo-satellite-for-nasajpl
16) Michael Watkins, Phil Morton, Frank Flechtner, Franz-Heinrich Massmann, “Status of the GRACE Follow-on Mission, GSTM (GRACE Science Team Meeting) 2014, Potsdam, Sept. 29-Oct. 1, 2014, URL: https://www.gfz-potsdam.de/en/section/global-geomonitoring-and-gravity-field/projects/gravity-recovery-and-climate-experiment-follow-on-grace-fo-mission/gstm/gstm-2014/
17) “GRACE Follow-On Mission: GFZ signs agreement with NASA,” GFZ Press Release, 11 Feb. 2014, URL: https://www.gfz-potsdam.de/en/press-public-relations/news/details/grace-follow-on-mission-gfz-signs-agreement-with-nasa
18) ”Twin Spacecraft Launch to Track Earth’s Water Movement,” NASA, Release 18-038, 22 May 2018, URL: https://www.nasa.gov/press-release/twin-spacecraft-launch-to-track-earth-s-water-movement
19) ”The NEXT Five from Iridium to Launch on May 19 with GRACE-FO Fairing Cohabitation,” Satnews Daily, 9 April 2018, URL: http://www.satnews.com/story.php?number=1270618808
20) ”Iridium strikes deal with GFZ German Research Centre for Geosciences to launch five additional spare Iridium NEXT satellites as well as NASA/GFZ's Gravity Recovery and Climate Experiment Follow-on (GRACE-FO) Mission,” Iridium Communications Inc., Jan. 31, 2017
21) ”Tracking changes of Earth’s gravity field – satellite mission GRACE Follow-On will be launched with SpaceX,” GFZ, Jan. 31,2017, URL: http://www.gfz-potsdam.de/en/media-communication/news/details/article/das-erdschwerefeld-im-blick-mission-grace-fo-startet-auf-einer-rakete-von-spacex/
22) Jeff Foust, ”Iridium buys eighth Falcon 9 launch, shares with Earth science mission,” Space News, Jan. 31, 2017, URL: http://spacenews.com/iridium-buys-eighth-falcon-9-launch-shares-with-earth-science-mission/
23) Benjamin Schlepp, Michael Kirschner, Theodore H. Sweetser, William M. Klipstein, Serge Dubovitsky, ”Flight Dynamics Challenges for the GRACE Follow-On Mission,” 25th International Symposium on Space Flight Dynamics (ISSFD), Munich, Germany, Oct.19-23, 2015, URL: http://elib.dlr.de/98835/1/ISSFD2015_FD%20Challenges%20for%20GRACE-FO_Schlepp.pdf
24) ”NASA Finds New Way to Monitor Underground Water Loss,” NASA/JPL News, 5 April 2022, URL: https://www.jpl.nasa.gov/news/nasa-finds-new-way-to-monitor-underground-water-loss?utm_source=iContact&utm_medium=email&utm_campaign=nasajpl&utm_content=media-earth20220405-1
25) Donald W. Vasco, Kyra H Kim, Tom G. Farr, J. T. Reager, David Bekaert, Simran S. Sangha, Jonny Rutqvist & Hiroko K. Beaudoing, ”Using Sentinel-1 and GRACE satellite data to monitor the hydrological variations within the Tulare Basin, California,” Scientific Reports, volume 12, Article number: 3867, Published: 09 March 2022, https://doi.org/10.1038/s41598-022-07650-1, URL: https://www.nature.com/articles/s41598-022-07650-1.pdf
26) ”Soggy Autumn in the Pacific Northwest,” NASA Earth Observatory, Image of the Day for 10 December 2021, URL: https://earthobservatory.nasa.gov/images/149195/soggy-autumn-in-the-pacific-northwest
27) Ian J. O’Neill , Jane J. Lee, ”Satellites Show How Earth’s Water Cycle Is Ramping Up as Climate Warms,” NASA Feature, 27 May 2021, URL: https://www.nasa.gov/feature/jpl/satellites-show-how-earth-s-water-cycle-is-ramping-up-as-climate-warms
28) Madeleine Pascolini-Campbell, John T. Reager, Hrishikesh A. Chandanpurkar & Matthew Rodell, ”A 10 per cent increase in global land evapotranspiration from 2003 to 2019,” Nature, Volume 593, pp: 543-547, Published: 26 May 2021, https://doi.org/10.1038/s41586-021-03503-5
29) ”Fine-Tuning Irrigation in Asia,” NASA Earth Observatory, Image of the Day for 21 April 2021, URL: https://earthobservatory.nasa.gov/images/148203/fine-tuning-irrigation-in-asia
30) ”Drought Conditions Continue in Spring 2021,” NASA Earth Observatory, Image of the Day for 1 April 2021, URL: https://earthobservatory.nasa.gov/images/148123/drought-conditions-continue-in-spring-2021?src=eoa-iotd
31) ”Turkey Experiences Intense Drought,” NASA Earth Observatory, Image of the Day for 16 January 2021, URL: https://earthobservatory.nasa.gov/images/147811/turkey-experiences-intense-drought
32) ”The Drying U.S. West,” NASA Earth Observatory, Image of the Day for 14 December 2020, URL: https://earthobservatory.nasa.gov/images/147655/the-drying-us-west
33) ”Taking a Measure of Sea Level Rise: Gravimetry,” NASA Earth Observatory, Image of the Day for 11 November 2020, URL: https://earthobservatory.nasa.gov/images/147437/taking-a-measure-of-sea-level-rise-gravimetry
34) ”Severe Drought in South America,” NASA Earth Observatory, Image of the Day for 4 November 2020, URL: https://earthobservatory.nasa.gov/images/147480/severe-drought-in-south-america
35) ”Study: 2019 Sees Record Loss of Greenland Ice,” NASA/JPL News, 20 August 2020, URL: https://www.jpl.nasa.gov/news/news.php?release=2020-162
36) Ingo Sasgen, Bert Wouters, Alex S. Gardner, Michalea D. King, Marco Tedesco,Felix W. Landerer, Christoph Dahle, Himanshu Save& Xavier Fettweis, ”Return to rapid ice loss in Greenland and record loss in 2019 detected by the GRACE-FO satellites,” Nature Communications Earth Environment, Published: 20 August 2020, Vol. 1, Issue 8, https://doi.org/10.1038/s43247-020-0010-1, URL: https://www.nature.com/articles/s43247-020-0010-1.pdf
37) ”A Third of the U.S. Faces Drought,” NASA Earth Observatory, Image of the Day for 14 August 2020, URL: https://earthobservatory.nasa.gov/images/147118/a-third-of-the-us-faces-drought
38) ”Signs of Drought in European Groundwater,” NASA Earth Observatory, Image of the Day for 26 June 2020, URL: https://earthobservatory.nasa.gov/images/146888/signs-of-drought-in-european-groundwater
39) Ellen Gray, ”Measuring Drought in South America,” NASA Earth Observatory, 6 April 2020, URL: https://earthobservatory.nasa.gov/images/146537/measuring-drought-in-south-america
40) Ellen Gray, ”NASA, University of Nebraska Release New Global Groundwater Maps and U.S. Drought Forecasts,” NASA GRACE-FO, 31 March 2020, URL: https://www.nasa.gov/feature/goddard/2020/nasa-university-of-nebraska-release-new-global-groundwater-maps-and-us-drought-forecasts
41) ”GRACE, GRACE-FO Satellite Data Track Ice Loss at the Poles,” NASA/JPL Feature, 18 March 2020, URL: https://www.nasa.gov/feature/jpl/grace-grace-fo-satellite-data-track-ice-loss-at-the-poles
42) Isabella Velicogna, Yara Mohajerani, A Geruo, Felix Landerer, Jeremie Mouginot, Brice Noel, Eric Rignot, Tyler Sutterley, Michiel van den Broeke, J. M. van Wessem, David Wiese, ”Continuity of ice sheet mass loss in Greenland and Antarctica from the GRACE and GRACE Follow‐On missions,” Geophysical Research Letters, Published: 18 March 2020, https://agupubs.onlinelibrary.wiley.com/doi/10.1029/2020GL087291
43) ”GRACE-FO Shows the Weight of Midwestern Floods,” NASA/JPL News, 20 August 2019, URL: https://www.jpl.nasa.gov/news/news.php?release=2019-168
44) ”GRACE-FO First Gravity Field Data Now Available,” NASA/JPL News, 24 June 2019, URL: https://gracefo.jpl.nasa.gov/news/145/grace-fo-first-gravity-field-data-now-available/
45) Frank Webb, Frank Flechtner, Felix Landerer, Phil Morton, Michael Watkins, Himanshu Save, Christoph Dahle, Srinivas Bettadpur, Robert Gaston, Michael Gross, ”Gravity Recovery and Climate Experiment Follow-On Mission,” Proceedings of the 70th IAC (International Astronautical Congress), Washington DC, USA, 21-25 October 2019, paper: IAC-19.B1.1, URL: https://iafastro.directory/iac/proceedings/IAC-19/IAC-19/B1/2/manuscripts/IAC-19,B1,2,4,x54184.pdf
46) ”GRACE-FO Resumes Data Collection,” NASA, 01 November 2018, URL: https://www.nasa.gov/feature/jpl/grace-fo-resumes-data-collection
47) ”GRACE-FO Satellite Switching to Backup Instrument Processing Unit,” NASA, 14 September 2018, URL: https://www.nasa.gov/feature/jpl/grace-fo-satellite-switching-to-backup-instrument-processing-unit
48) ”First Laser Light for GRACE Follow-On,” NASA/JPL, 2 July 2018, URL: https://www.jpl.nasa.gov/news/news.php?release=2018-158
49) ”GRACE-FO Turns on 'Range Finder,' Sees Mountain Effects,” NASA/JPL News Release 2018-133, 11 June 2018, URL: https://www.jpl.nasa.gov/news/news.php?release=2018-133
50) ”Successful launch of the climate research mission GRACE Follow-On,” Albert Einstein Institute Hannover, 22 May 2018
51) Damien Boulanger, Phuong-Anh Huynh, Bernard Foulon, Bruno Christophe, “A new generation of ultra-sensitive electrostatic accelerometers for GRACE Follow-on and towards the next generation of gravity missions,” Proceedings of the 65th International Astronautical Congress (IAC 2014), Toronto, Canada, Sept. 29-Oct. 3, 2014, paper: IAC-14-B1.3.2
52) Charles Dunn, Willy Bertiger, Yoaz Bar-Sever, Shailen Desai, Bruce Haines, Da Kuang, Garth Franklin, Ian Harris, Gerhard Kruizinga, Tom Meehan, Sumita Nandi, Don Nguyen, Tim Rogstad, J. Brooks Thomas, Jeff Tien, Larry Romans, Michael Watkins, Sien-Chong Wu, Srinivas Bettadpur, Jeongrae Kim, “Instrument of Grace,” GPS World, March 25, 2003
53) W. Bertiger, Y. Bar-Sever, S. Desai, C. Dunn, B. Haines, D. Kuang, S. Nandi, L. Romans, M. Watkins, S. Wu, “GRACE: Millimeters and Microns in Orbit,” ION-GPS 2002, Portland, OR, Sept. 24-27, 2002
54) Jeongrae Kim, Seung Woo Lee, “Flight performance analysis of GRACE K-band ranging instrument with simulation data,” Acta Astronautica, Vol. 65, 2009, pp. 1571-1581
55) W. M. Folkner, G. deVine, W. M. Klipstein, K. McKenzie, R. Spero, R. Thompson, N. Yu, M. Stephens, J. Leitch, R. Pierce, T. T.-Y. Lam, D. A. Shaddock, “Laser Frequency Stabilization for GRACE-2,” ESTF 2011 (Earth Science Technology Forum 2011), Pasadena, CA, USA, June 21-23, 2010, URL: https://trs.jpl.nasa.gov/handle/2014/41635
56) Damien Boulanger, Bruno Christophe, Bernard Foulon, Vincent Lebat, Francoise Liorzou, Eddy Perrot, “Design update and characteristics improvement of the electrostatic accelerometer for the GRACE Follow-on mission,” Joint GSTM (GRACE Science Team Meeting)/SPP Final Colloquium, 17, Sept, 2012, GFZ, Potsdam, Germany
57) B. Christophe, B. Foulon, F. Liorzou, V. Lebat, D. Boulanger, E. Perrot, P-A Huynh, “Development status of the GRACE Follow-On accelerometer and first results of the Engineering Model testing,” Proceedings of the GSTM (GRACE Science Team Meetring), Potsdam, Germany, Sept. 29-Oct. 1, 2014
58) B. Christophe, B. Foulon, F. Liorzou, V. Lebat, D. Boulanger, E. Perrot, P-A Huynh, ”Development status of GRACE Follow-On accelerometers,” GRACE Science Team Meeting, Austin Texas, USA, Sept. 21-23,2015
59) Basem Elsaka, Jean-Claude Raimondo, Phillip Brieden, Tilo Reubelt, Jürgen Kusche, Frank Flechtner, Siavash Iran Pour, Nico Sneeuw, Jürgen Müller, “Comparing seven candidate mission configurations for temporal gravity field retrieval through full-scale numerical simulation,” Journal of Geodesy, 2014, Vol. 88, pp:31–43, URL: http://link.springer.com/article/10.1007%2Fs00190-013-0665-9#page-2
60) Tom Meehan, Stephan Esterhuizen, Garth Franklin, Jeffrey Tien, Larry Young, Brian Bachman, Tim Munson, David Robison, Ted Stecheson, “Development Status of NASA's TriG GNSS Science Instrument,” IROWG-2 (International Radio Occultation Working Group), Workshop, Estes Park, CO, USA, March 28- April 3, 2012, URL: http://www.irowg.org/docs/Presentation/meehan.pdf
The information compiled and edited in this article was provided by Herbert J. Kramer from his documentation of: ”Observation of the Earth and Its Environment: Survey of Missions and Sensors” (Springer Verlag) as well as many other sources after the publication of the 4th edition in 2002. - Comments and corrections to this article are always welcome for further updates. (eoportal@symbios.space)