GOSAT (Greenhouse gases Observing Satellite) / Ibuki
EO
JAXA
Atmosphere
Cloud type, amount and cloud top temperature
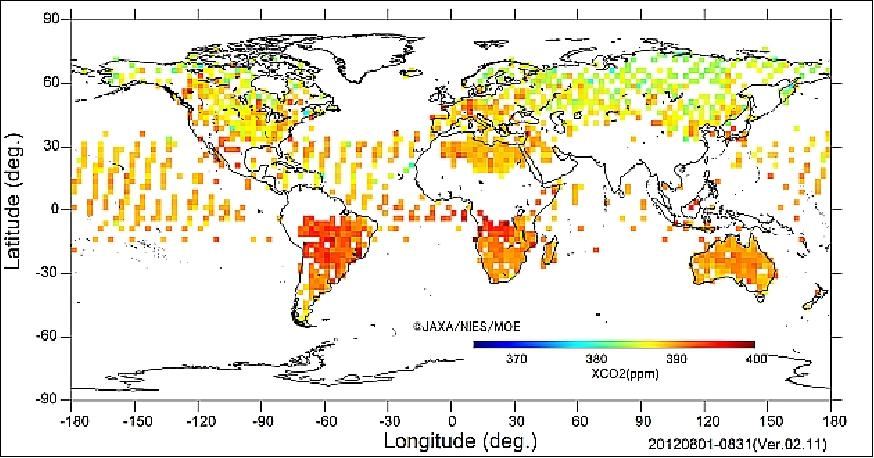
GOSAT is a mission within the Global Change Observation Mission (GCOM) program of Japan. This mission monitors Greenhouse Gases (GHGs) sources and sinks on a subcontinental scale.
Quick facts
Overview
| Mission type | EO |
| Agency | JAXA, MOE (Japan), NIES (Japan) |
| Mission status | Operational (extended) |
| Launch date | 23 Jan 2009 |
| Measurement domain | Atmosphere, Land |
| Measurement category | Cloud type, amount and cloud top temperature, Atmospheric Temperature Fields, Aerosols, Vegetation, Ozone, Trace gases (excluding ozone) |
| Measurement detailed | Atmospheric pressure (over sea surface), Cloud cover, Aerosol optical depth (column/profile), O3 Mole Fraction, CH4 Mole Fraction, Normalized Differential Vegetation Index (NDVI), CO2 Mole Fraction, Atmospheric pressure (over land surface), HDO (column/profile), Chlorophyll Fluorescence from Vegetation on Land |
| Instruments | TANSO-FTS, TANSO-CAI |
| Instrument type | Imaging multi-spectral radiometers (vis/IR), Atmospheric chemistry |
| CEOS EO Handbook | See GOSAT (Greenhouse gases Observing Satellite) / Ibuki summary |
Related Resources
Summary
Mission Capabilities
The operational instrument on board GOSAT is the Thermal and Near infrared Sensors for carbon Observation (TANSO). TANSO comprises two units, a Fourier Transform Spectrometer (FTS) alongside a Cloud and Aerosol Imager (CAI). TANSO-FTS detects gas absorption and emission over four spectral bands, covering a spectral range of 0.75 - 15 µm. The reflective radiative energy is measured by the visible light (VIS) and short wavelength infrared (SWIR) ranges, whilst the emissive radiation from Earth’s surface and the atmosphere is measured by the medium wavelengths infrared (MWIR) and thermal infrared (TIR) ranges. Included in these spectra are the absorption lines of major GHGs. TANSO-CAI is an Ultraviolet (UV), VIS, Near-infrared (NIR) and SWIR radiometer designed to measure and correct for cloud and aerosol interference. TANSO-CAI visualises the state of the atmosphere and ground surface during daytime, which is then used to determine cloud and aerosol existence in the field of view of TANSO-FTS. Once detected, cloud characteristics and aerosol amounts are calculated, allowing any effects of cloud or aerosols on the spectra obtained by TANSO-FTS to be corrected.
Performance Specifications
TANSO-FTS has a swath width of 1000 km and resolution of 10.5 km. The UV, VIS and NIR channels of TANSO-CAI have a swath width of 1000 km and 0.5 km resolution, while the SWIR channel has a swath width of 750 km and 1.5 km resolution. GOSAT measurements of carbon dioxide and methane have a relative accuracy of 1% and 2% respectively. While GOSAT operates on a global scale, individual measurements are taken on a sub-continental basis.
GOSAT maintains a sun-synchronous orbit with an inclination of 98.06° at an altitude of 666 km, with a period of 98.18 minutes and repeat cycle of three days.
Space and Hardware Components
The GOSAT spacecraft uses a three-axis stabilised bus manufactured by Mitsubishi Electric Corporation (MELCO). The structure consists of the mission module, in which the payloads are located, and the bus module. The bus module is a carbon fibre reinforced plastics (CFRP) cylinder, and the mission module consists of a honeycomb panel, the surface of which is reinforced by CFRP. GOSAT features an Attitude and Orbit Control Subsystem, an Electrical Power Subsystem which uses a 50 V unregulated bus, a Paddle Subsystem consisting of two solar array paddle wings, a Reaction Control Subsystem, Mission Data Handling Subsystem with 48 GB memory, Direct Transmission Subsystem, a Telemetry Tracking and Command Subsystem responsible for demodulating and distributing commands from the ground station to each subsystem and a Thermal Control Subsystem which maintains a moderate temperature range for each component of the satellite. The overall spacecraft mass is 1750 kg with a payload mass of 391 kg.
GOSAT (Greenhouse gases Observing Satellite) / Ibuki
Spacecraft Launch Mission Status Sensor Complement References
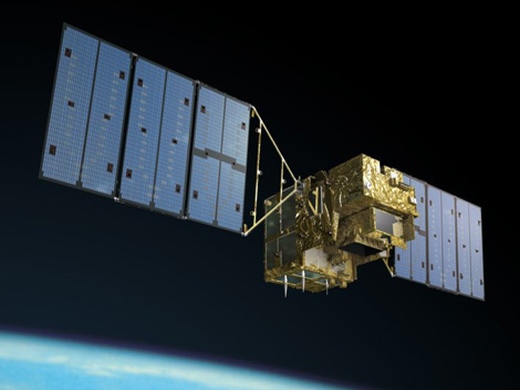
GOSAT (nickname Ibuki meaning "breath" or "puff") is a JAXA mission within the GCOM (Global Change Observation Mission) program of Japan. The GOSAT mission goals call for the study of the transport mechanisms of greenhouse gases such as carbon dioxide (CO2) and methane (CH4).
The emphasis is on atmospheric monitoring to clarify the sources and sinks of CO2 on a sub-continental scale. The overall mission objective is to contribute to environmental administration by estimating the Green House Gases (GHGs) source and sink on a sub-continental scale and to support the Kyoto protocol that was adsorbed at COP3/UNFCCC (3rd session of the conference in the framework of climate change) in 1997. The protocol calls for a reduction of greenhouse gases, in particular, CO2; it requires all parties to reduce their emissions by 5% below the level of the year 1990, for the period of 2008-2012. Specific GOSAT objectives are: 1) 2) 3) 4) 5) 6) 7) 8) 9) 10) 11)
• Observation of the CO2 and CH4 column density (CH4 column density during orbital nighttime):
- at a spatial scale of 100-1000 km
- with relative accuracy of 1% for CO2 (4ppmv, 3 month average) and 2% for CH4
- during the Kyoto Protocol's first commitment period (2008 to 2012).
• Reduction of CO2 annual flux estimation errors by half (0.54GtC/yr to 0.27GtC/yr) in identifying the greenhouse gas source and sink at the subcontinental scale with the data obtained by GOSAT in conjunction with that from the ground-based instruments.
The mission priority is on:
- Short wave infrared observation
- CO2 and CH4 column density (during the orbital day time)
Secondary mission goals are:
- Thermal infrared observation
- CO2 and CH4 altitude profile
- CO2 and CH4 CH4 column density (during orbital night time)
- Observation of other trace gases (O3, etc.)
- Provision of other products (temperature profile, Earth radiation)
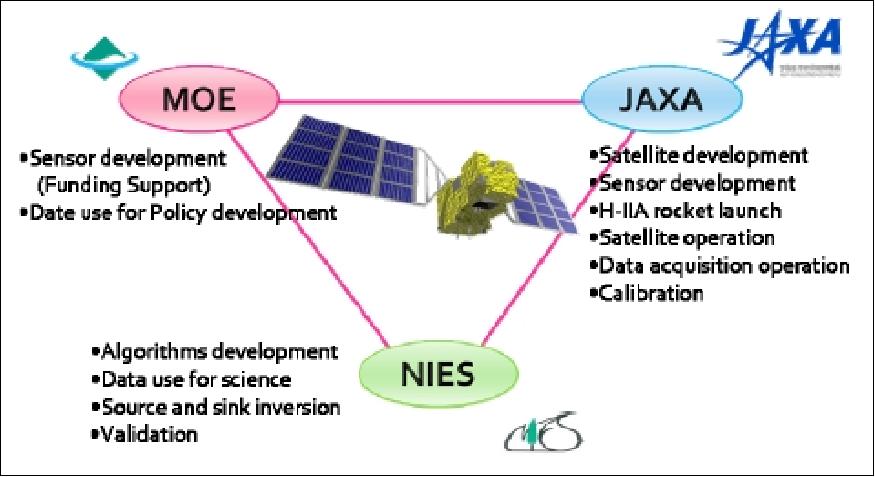
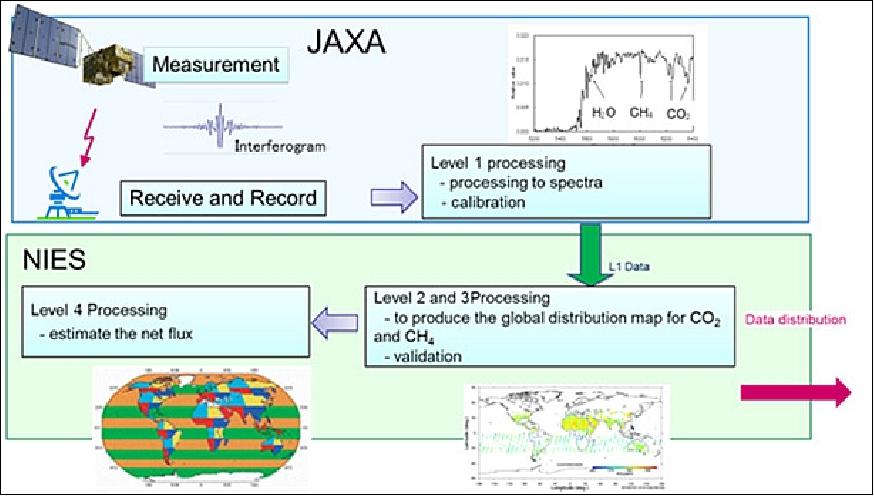
GOSAT is a joint project of JAXA (Japan Aerospace Exploration Agency) and NIES (National Institute of Environmental Studies) with instrument development/funding by Japan's MOE (Ministry of the Environment ). In this arrangement, JAXA is responsible for the satellite and instrument development, launch and operation of the spacecraft (including data acquisition), while NIES is in charge of data analysis (algorithm development) and utilization.
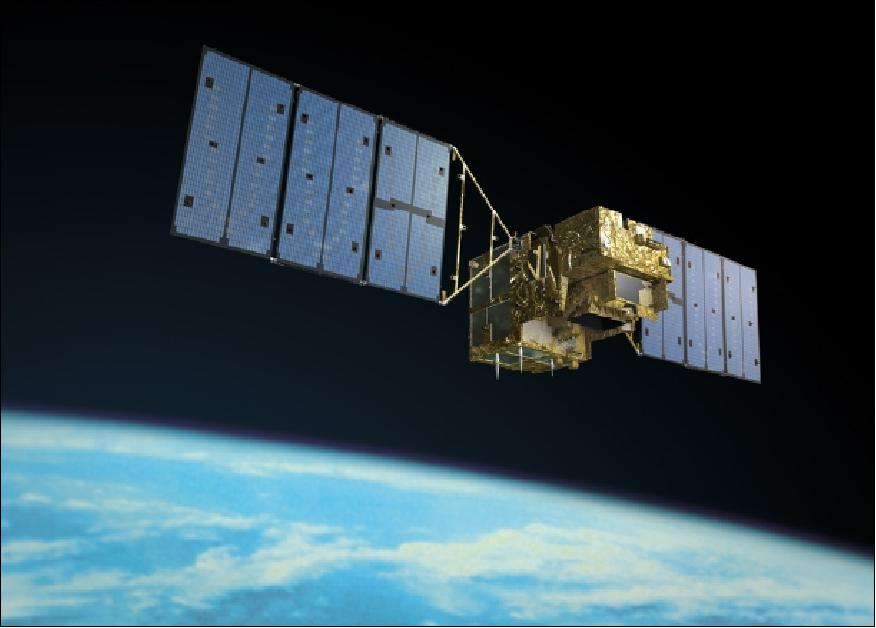
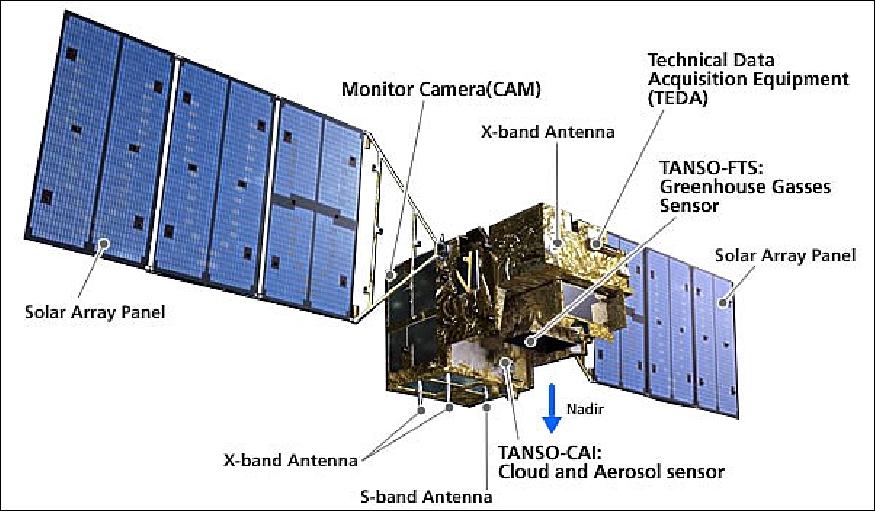
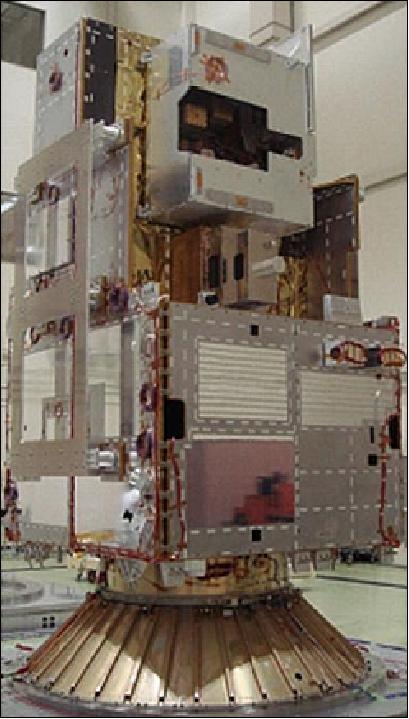
Spacecraft
The spacecraft bus is three-axis stabilized with a structure size of 2.0 m (length) x 1.8 m width) x 3.7 m height). The structure consists of the mission module in which the mission sensors (payload) are loaded and the bus module containing the bus components. The mission module and the bus module (CFRP cylinder) can be separated so that the assembly is performed easily. The mission module consists of the honeycomb panel reinforced by CFRP on the surface.
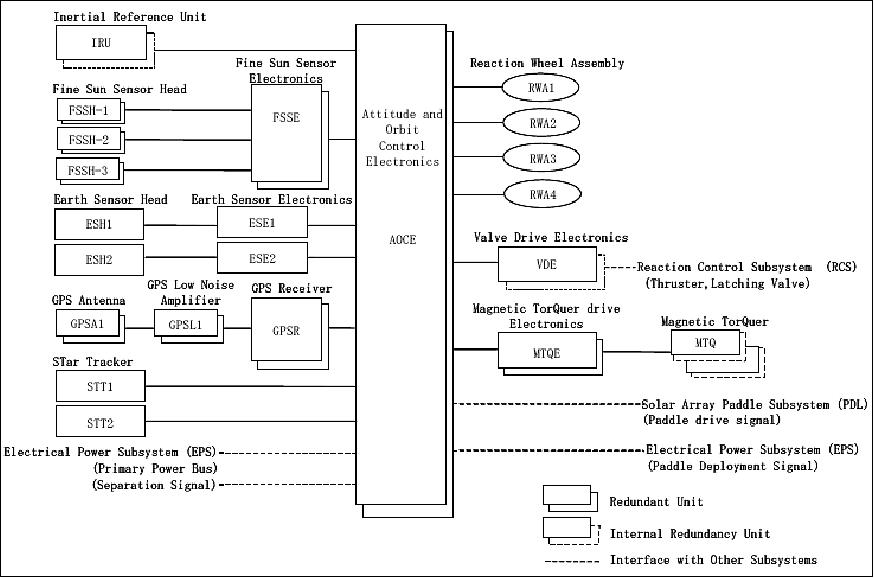
• The AOCS (Attitude & Orbit Control Subsystem) is based on a zero-momentum design, attitude is sensed by Earth sensors, star trackers, IRU (Inertial Reference Unit), and a GPS receiver. Actuation is provided by a RWA (Reaction Wheel Assembly) and by MTQ (Magnetic Torquers).
AOCS consists of the AOCE (Attitude and Orbit Control Electronics), the IRU (Inertial Reference Unit), the FSSA (Fine Sun Sensor Assembly), ESA (Earth Sensor Assembly), the GPSR (Global Positioning System Receiver), STT (STar Tracker), the RWA (Reaction Wheel Assembly), the VDE (Valve Drive Electronics), and the MTQE (Magnetic TorQuer Drive Electronics). Figure 3 presents a block diagram of the AOCS. 12)
• The EPS (Electrical Power Subsystem) uses a 50 V unregulated bus, the solar panels are of rigid padpole design with 3.8 kW of power (EOL), and 4 pairs of NiCd batteries with energy of 35 Ah for solar eclipse operations (note: the NiCd batteries have flight heritage).
• The PDL (Paddle Subsystem) consists of two paddle wings, deployment mechanisms, paddle drive mechanisms. The solar array paddles are folded and attached at the side panels of the satellite by the hold and deploy mechanisms during the launch phase. The two paddle wings are deployed by the ordnance controller. The length of the paddle wing is about 6 m from the attachment to the tip. One wing generates over 2.0 kW at the end of mission life (EOL) with the condition that the sunlight is normal to the paddle surface. The power needed to drive the bus subsystems is generated by one wing, and partial observation of the mission sensors is possible even if one paddle wing fails.
• The RCS (Reaction Control Subsystem) is a monopropellant hydrazine blowdown system. RCS consists of 2 tanks of 550 mm diameter, four 20 N thrusters ,eight 1 N thrusters, tubes, pressure sensors, filters and valves. If a thruster of the four 1 N thrusters fails, AOCE (Attitude and Orbit Control Electronics) switches the control thrusters to the other four 1 N thrusters automatically.
• MDHS (Mission Data Handling Subsystem). The data from mission sensors is multiplexed by MDHS, recorded in a memory, and send to DT subsystem. The memory size of MDHS is 48 GByte.
• DT (Direct Transmission Subsystem). The data from MDHS is modulated at the X-band modulator, and converted to RF signal. And it is amplified at the XSSPA and transmitted to the ground station.
• TTC Telemetry Tracking and Command Subsystem). TTC consists of TTC-RF and TTC-DH. It receives the command from the ground station, demodulates and distributes to each subsystem. It gathers telemetry data from each subsystem, edits, records and transmits to the ground station. It also has the autonomous function and increase the flexibility of the operation.
• The TCS (Thermal Control Subsystem) maintains the temperature of the satellite at moderate temperature range for the each component. Thermal control is performed passively using heat pipes, MLI and OSR, and performed actively using a heater controlled thermostat.
The overall S/C mass is about 1750 kg with a payload mass of 391 kg. The overall design life is 5 years. The spacecraft is being manufactured by MELCO (Mitsubishi Electric Corporation), Kamakura Works, Japan as the prime contractor of GOSAT. 13) 14) 15)
Spacecraft bus dimensions (main body) | 2.0 m x 1.8 m x 3.7 m |
Wing span | 13.7 m |
Spacecraft mass, power | 1750 kg, 3.8 kW (EOL) |
Spacecraft design life | 5 years |
RF communications | TT&C in S-Band, (uplink at 2 kbit/s, downlink at 30 kbit/s |
Spacecraft Environment Survey Equipment
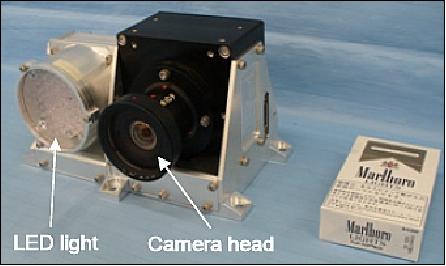
Use of CAMs (Monitor Cameras): A total of 8 CAMs are being accommodated at strategic locations on GOSAT with the objective to monitor the spacecraft exterior in orbit. The CAMs are capable of capturing clear images during the eclipse using LED (Light-Emitting Diode) light sources. The images acquired by the CAMs are being used to grasp the satellite status accurately (e.g. deployment status of the solar array paddles, contamination during the rocket fairing separation event); they also play important roles by responding to anomalies promptly. 17)
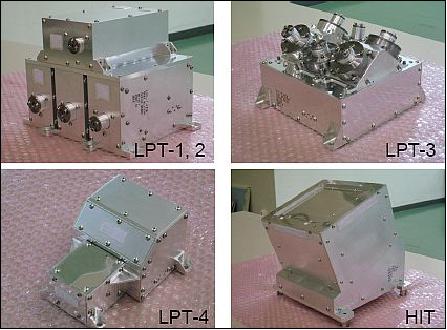
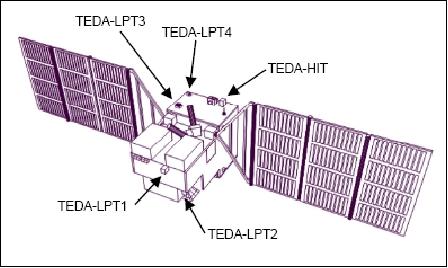
TEDA (Technical Data Acquisition Equipment). TEDA is onboard space environment measurement system with the objective to monitor the orbital radiation environment. TEDA consists of four LPT1-4 (Light Particle Telescope) assemblies and one HIT (Heavy Ion Telescope) device. LPT discriminates electrons, protons, and alpha particles and analyzes their quantitative energy, while HIT characterizes the fluxes and energy distributions of heavy ions having masses from that of helium (He) to iron (Fe). 18)
JAXA experienced unfortunate failures of the solar array paddle and the power system on the Earth observing satellites ADEOS and ADEOS-II in 1997 and 2003, respectively. As GOSAT has been the 'first satellite' that JAXA initiated its development following these setbacks, the policy of 'achieving high reliability' was designated as the 'first priority' for the design and development phases of GOSAT.
To achieve high reliability, the GOSAT project adopted the following policies for its development:
- Maximum utilization of flight-proven components
- Elimination of single-point failure probabilities with the provision of functional redundancy
- Thorough tests of the mission duty cycles.
Launch
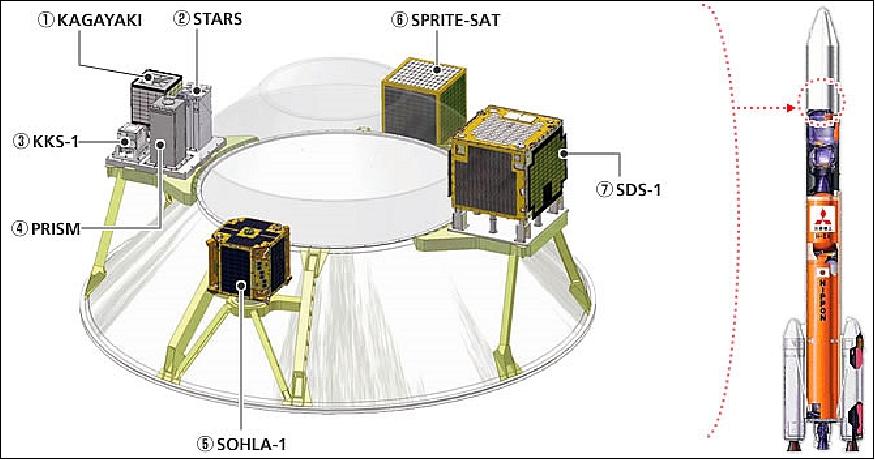
The launch of GOSAT took place on January 23, 2009 on a JAXA launcher (H-IIA vehicle). The launch site is the Yoshinobu Launch Complex at the Tanegashima Space Center, Kagoshima, Japan (launch provider: Mitsubishi Heavy Industries, Ltd.). The seven secondary payloads on this flight are: 19) 20)
- SDS-1 (Small Demonstration Satellite-1) of JAXA (~100 kg)
- SOHLA-1 (Space Oriented Higashiosaka Leading Association-1), Japan (50 kg)
- SpriteSat (Tohoku University), Japan (microsatellite of ~50 kg)
- PRISM (Picosatellite for Remote‐sensing and Innovative Space Missions) of ISSL of the University of Tokyo, 5 kg
- Kagakaki (SORUNSat-1), Japan, 20 kg
- KKS-1 (Kouku Kosen Satellite-1) of Tokyo Metropolitan College of Industrial Engineering), nanosatellite of 3 kg
- STARS-1 (Space Tethered autonomous Robotic Satellite-1) of Kagawa University, Japan, ~ 10 kg.
Orbit: Sun-synchronous circular orbit, altitude = 666 km, inclination = 98º, revisit cycle of 3 days, LTAN (Local Time at Ascending Node) at 13:00 ± 0.15 hours.
RF communications: The downlink is provided in X-band (8 GHz) with a data rate of 120 Mbit/s. The TT&C data link is not DRTS compatible (2 kbit/s uplink, 30 kbit/s downlink). Science data is received and level-0 processed at JAXA/EOC (Earth Observation Center) in Hatoyama, Japan. Another acquisition station is Svalbard (Spitzbergen, Norway). 21)
A new observable from space: SIF (Solar-Induced chlorophyll Fluorescence)
2014: Remote sensing of terrestrial vegetation fluorescence from space is of great interest because it can potentially provide global coverage of the functional status of vegetation. For example, fluorescence observations may provide a means to detect vegetation stress before chlorophyll reductions take place. Although there have been many measurements of fluorescence from ground- and airborne-based instruments, there has been scant information available from satellites. 22)
Photosynthesis is the conversion by living organisms of light energy into chemical energy and fixation of atmospheric carbon dioxide into sugars; it is the key process mediating 90% of carbon and water fluxes in the coupled biosphere-atmosphere system.
Until about 2010, most of the information that has been acquired by remote sensing of the Earth's surface about vegetation conditions has come from reflected light in the solar domain. There is, however, one additional source of information about vegetation productivity in the optical and near-infrared wavelength range that has not been globally exploited by satellite observations. This source of information is related to the emission of fluorescence from the chlorophyll of assimilating leaves; part of the energy absorbed by chlorophyll cannot be used for carbon fixation and is thus re-emitted as fluorescence at longer wavelengths (lower energy) with respect to the absorption.
The fluorescence signal originates from the core complexes of the photosynthetic machinery where energy conversion of APAR (Absorbed Photosynthetically Active Radiation) occurs. Because the photosynthetic apparatus is an organized structure, the emission spectrum of fluorescence that originates from it is well known; it occurs as a convolution of broadband emission from 650 to 800 nm with two peaks in the VNIR (Visible and Near-Infrared) at 685 and 740 nm, respectively, as shown in Figure .
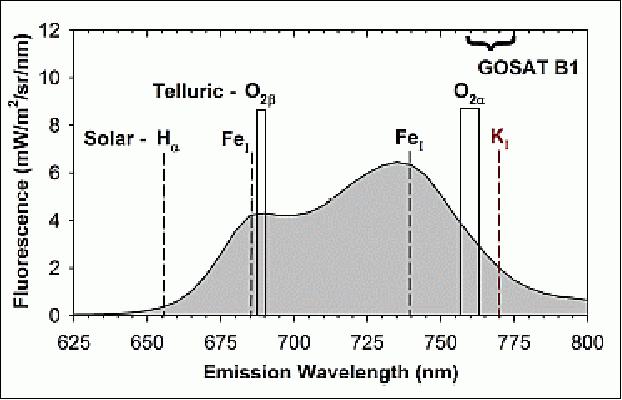
The measurement of SIF (Solar-Induced chlorophyll Fluorescence) from space is challenging, because its signal (typically 1–5% in NIR) must be differentiated from the much larger reflectance signal. SIF has been detected from ground- and airborne-based instrumentation by exploiting the fact that SIF is a proportionally larger fraction of the total radiance within dark lines and bands of the atmospheric spectrum. These dark features include both very narrow solar Fraunhofer lines and wider telluric absorption features such as the O2-B band at 687 nm and the O2-A band near 760 nm.
The only spaceborne detection of SIF to date was achieved by Guanter et al. (2007) with the MERIS (MEdium Resolution Imaging Spectrometer) on Envisat. MERIS has two channels near the O2-A band, one near the peak absorption at 760.6 nm with a 3.75 nm bandwidth, and one used as a reference band in the nearby continuum at 753.8 nm. MERIS makes measurements at a moderate spatial scale for land studies (better than 300 m/pixel in its Full Resolution mode). 23)
The GOSAT research team (Ref. 22) used high-spectral resolution data from the TANSO-FTS instrument on GOSAT near the 770 nm Fraunhofer line to derive chlorophyll fluorescence and related parameters such as the fluorescence yield at that wavelength. TANSO-FTS measures backscattered solar radiation in three bands centered at 0.76, 1.6, and 2.0 µm in two perpendicular polarizations (referred to as P and S). It has a nadir ground footprint of 10.5 km diameter. Chlorophyll fluorescence can be measured within band 1 that extends from approximately 758-775 nm and encompasses the O2-A band. The primary function of the O2-A band for GOSAT is to account for the effects of cloud and aerosol within the CO2 and CH4 bands.
The research team performed monthly mean scaled SIF measurements with TANS-FTS during the growing season of 2009 in July and December on a global scale. The expected seasonal variation is definitively shown, namely, higher Northern Hemisphere terrestrial activity in July versus higher activity in the Southern Hemisphere in December.
There is indeed evidence that high-resolution spectrometers enable new avenues in global carbon cycle research, including the first accurate retrievals of chlorophyll fluorescence from space as an indicator of photosynthetic activity. 24)
During photosynthesis, part of the solar radiation absorbed by chlorophyll is re-emitted at longer wavelengths (fluorescence). Using new, high-resolution spectrometers, this chlorophyll fluorescence from space now be measured, which can, in turn, be used to quantify photosynthetic activity and efficiency globally. Such measurements are important to reduce uncertainties in the global carbon cycle. Indeed, the ability to control the Earth's carbon budget in a warming climate depends critically on knowing where, when, and how CO2 is exchanged between the land and atmosphere. The GPP (Gross Primary Production), that is the gross uptake of atmospheric CO2 through photosynthesis, constitutes the largest flux component in the global carbon budget. However, considerable uncertainties remain in GPP estimates and its seasonality.
The OCO-2 (Orbiting Carbon Observatory-2) mission of NASA will be launched in July 2014. The spectrometer aboard OCO-2 will make precise measurements of carbon dioxide in the atmosphere, recording 24 observations/s versus GOSAT's single observation every four seconds, resulting in almost 100 times more observations of both carbon dioxide and fluorescence than GOSAT. It is expected that the OCO-2's fluorescence data will extend the GOSAT time series and allow the project to observe large-scale changes to photosynthesis in a new way. 25)
Mission Status
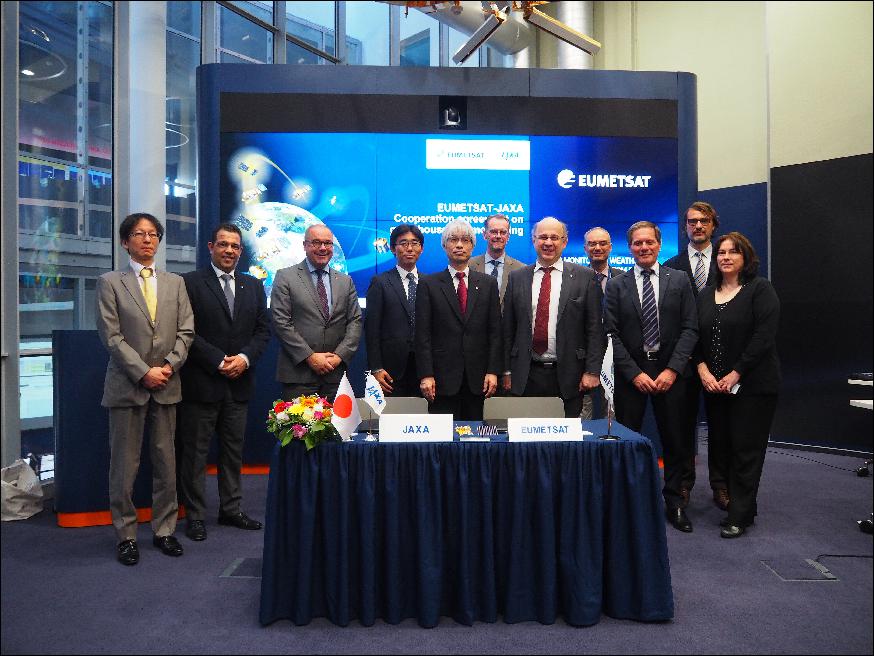
• May 14, 2019: EUMETSAT and JAXA (Japan Aerospace Exploration Agency) have signed an agreement which will result in the agencies working closely together to monitor greenhouse gases in the Earth's atmosphere. 26)
- Mr Kazuo Tachi, on behalf of the Director General of JAXA's Space Technology Directorate 1 Ryoichi Imai, and EUMETSAT Director-General Alain Ratier signed the agreement at a ceremony at EUMETSAT's Darmstadt headquarters today.
- Japan's GOSAT (Greenhouse Gases Observing Satellite) was the world's first satellite mission specifically designed for monitoring greenhouse gases. Instruments on the low-Earth-orbiting satellite measure carbon dioxide and methane for a decade. GOSAT-2 was launched in October 2018 as the successor to GOSAT.
- "This cooperation with EUMETSAT is crucial to promote the satellite data to support improving national greenhouse gases inventories reports as well as precise understanding of the status of global greenhouse gases," Tachi said. "JAXA also would like to enhance GOSAT and GOSAT-2 data utilization in weather forecasting operations through cooperation with EUMETSAT."
- "The agreement between EUMETSAT and JAXA will support the implementation of the international part of the agreed European Roadmap Towards an Operational CO2 Monitoring System, which is essential for deepening understanding of climate change," Ratier said.
• On 23 January 2018, the GOSAT/Ibuki spacecraft was 9 years on orbit, operating nominally. 27)
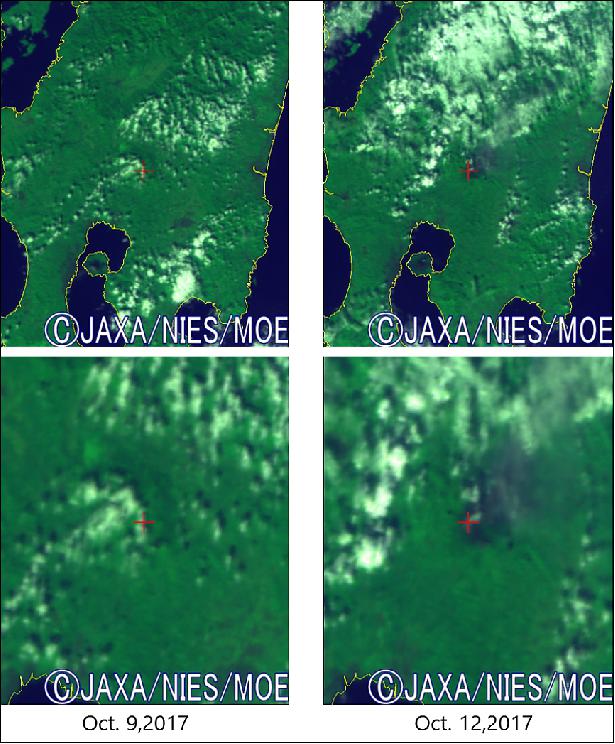
• October 2017: Mt. Shinmoedake located at the prefectural border of Kagoshima and Miyazaki (Japan) has erupted since October 11, 2017. Figure 12 shows the volcanic smoke observed by TANSO-CAI on October 9 before eruption and at 1:37 pm on October 12 after the eruption with the enlarged figure around the Mt. Shinmoedake. 28)
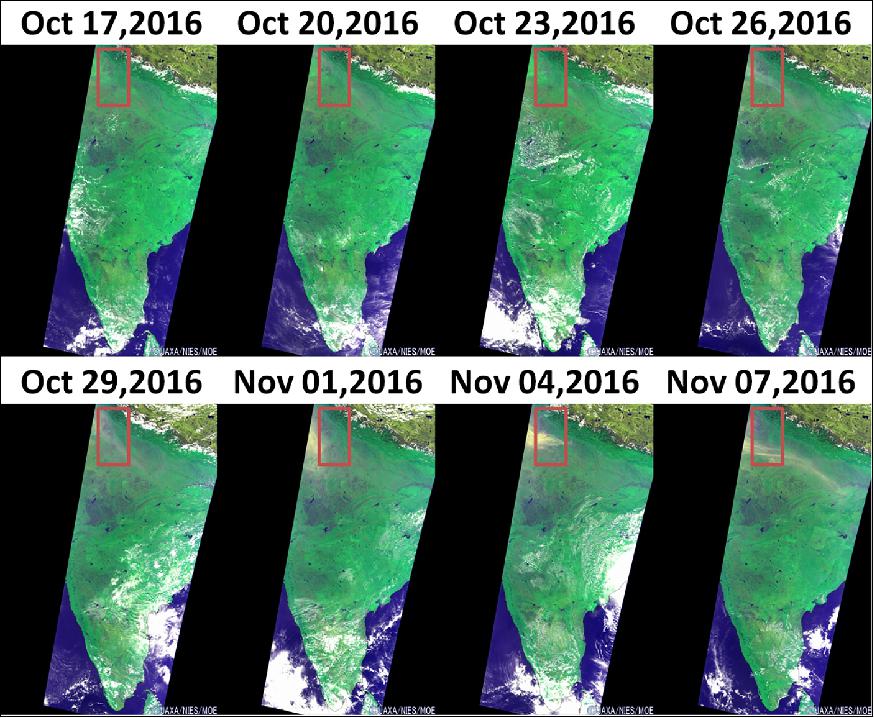
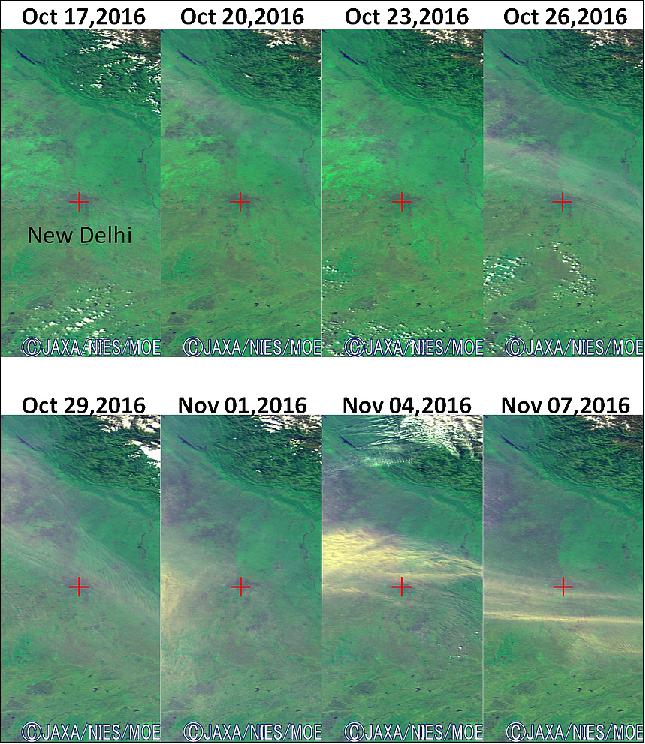
• October 2016: The Indian government took emergency action to close schools and halt building construction in New Delhi due to air pollution on November 6, 2016. In New Delhi, air pollution by automobile exhaust and construction dust is a serious problem. In addition, controlled burn for cropping in neighboring states from October to November spur air pollution. Figure 13 shows the controlled burn smoke observed by TANSO-CAI. Figure 14 is the enlarged figure around the center of New Delhi marked with a red cross. 29)
- Many farmers in neighboring states cultivate winter wheat in November after harvest of rice crop in September. For this double-cropping, farmers burn the leftover straw to prepare the winter wheat crop quickly.
• June 2016: The GOSAT spacecraft and its payload are operational in the summer of 2016. 30)
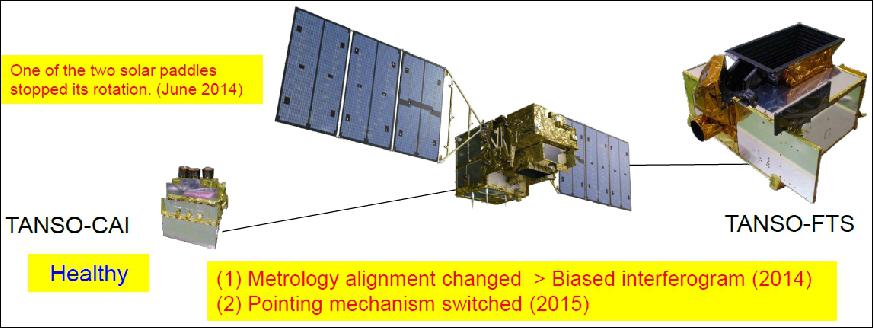
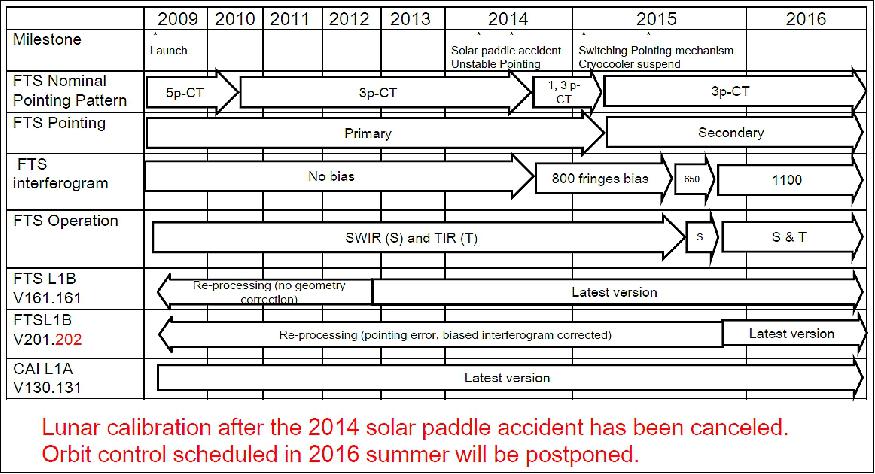
Three major anomalies of the satellite system affecting TANSO-FTS occurred in the period 2024-2015:
- a failure of one of the two solar paddles in May 2014
- a switch to the secondary pointing system in January 2015
- and most recently a cryocooler shutdown and restart in August 2015. 32)
• May 20, 2016: A recent provisional analysis of GOSAT observational data shows (Figure 17) that the global atmospheric monthly mean CO2 concentration observed vertically through the whole atmosphere exceeded 400 ppm in December 2015 for the first time since GOSAT was launched in 2009. The three Japanese parties, MOE, NIES and JAXA have published the whole-atmospheric monthly mean CO2 concentrations (observations made vertically through the whole atmosphere) analyzed and estimated from GOSAT observations from May 2009 to January 2016, and the trend line of the global CO2 mean (average seasonal cycle removed). 33) 34)
Monthly mean CO2 in January 2016 | 401.1 ppm (parts per million) |
CO2 trend (CO2 trend is a value on the CO2 trend line derived by removing averaged seasonal fluctuations from the monthly CO2 time series), January 2016 | 399.6 ppm |
CO2 growth in the past one year (CO2 growth refers to an increase of CO2 level on the trend line in the last one year), January 2016 - January 2015 | 2.5 ppm/yr |
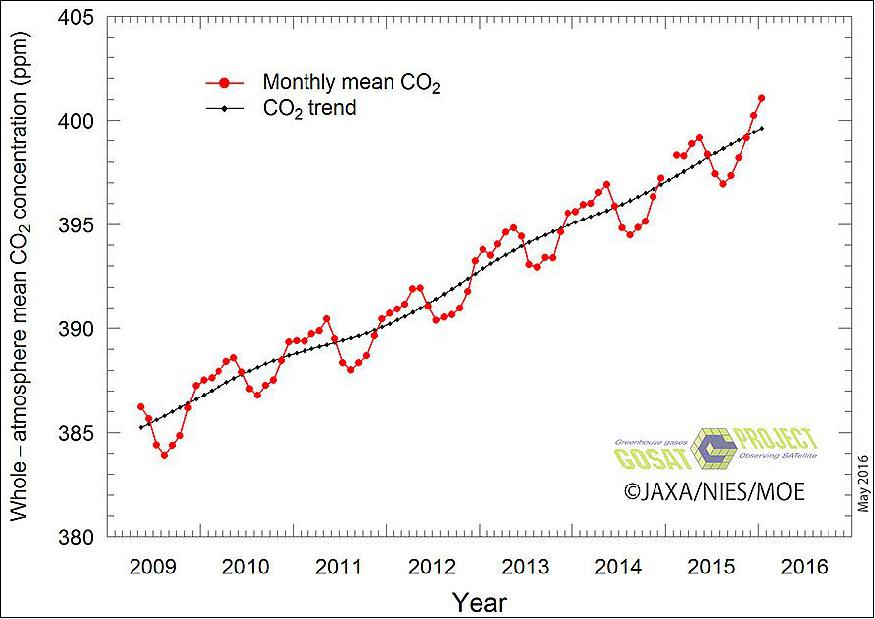
Legend to Figure 17: The plot demonstrates the whole-atmosphere monthly mean concentration of carbon dioxide (CO2), calculated by using GOSAT data that reflect CO2 levels in all layers of the atmosphere. It is also showing seasonal oscillation and yearly rise over the analyzed period. It is also confirmed that the trend line of the whole-atmosphere CO2 mean (average seasonal cycle removed) increases monotonously. The value and the growth of the trend line are important to discuss global warming issues.
According to a provisional analysis (until January 2016), the monthly mean concentration exceeded 400 ppm for the first time and it recorded 400.2 ppm in December 2015. It also recorded 401.1 ppm in January 2016, and it is observed that the concentration has increased in winter towards spring in the Northern Hemisphere.
Several meteorological agencies such as the WMO (World Meteorological Organization) have already reported that the global monthly mean CO2 concentration based on data obtained at surface-level monitoring sites has exceeded 400 ppm. However, it is the first time that the whole-atmospheric CO2 mean exceeded 400 ppm monitored by GOSAT, which can observe CO2 concentrations from the surface to the top of the atmosphere (about 70 km). It means that CO2 concentrations are increasing not only at the global surface but also in the global atmosphere.
• Nov. 16, 2015: The whole-atmosphere monthly mean concentration of carbon dioxide (CO2), calculated by using GOSAT (Ibuki) data that reflect CO2 levels in all layers of the atmosphere, was found to have reached 398.8 ppm in May 2015, while showing seasonal oscillation and yearly rise over the analyzed period. It was also confirmed that the trend line of the whole-atmosphere CO2 mean, derived by removing averaged seasonal fluctuations from the monthly CO2 time series, had reached 398.2 ppm in July 2015. The trend line is expected to exceed 400 ppm within the year 2016, given that the rising trend continues. The GOSAT observation elucidates for the first time that CO2 concentration averaged over all layers of the atmosphere will soon reach the level of 400 ppm, and demonstrates the importance of global greenhouse gas monitoring from space. 35)
- The whole-atmosphere mean CO2 concentration was calculated based on GOSAT measurement. Observational data collected by the satellite over a period exceeding six years, between May 2009 and July 2015, were used for this calculation (Figure 18). Over the analyzed period, the monthly mean CO2 concentration continually rose, with seasonal fluctuations due to photosynthetic activity by plants that intensifies and subsides over a single year in the Northern Hemisphere. The monthly mean reached 398.8 ppm in May 2015.
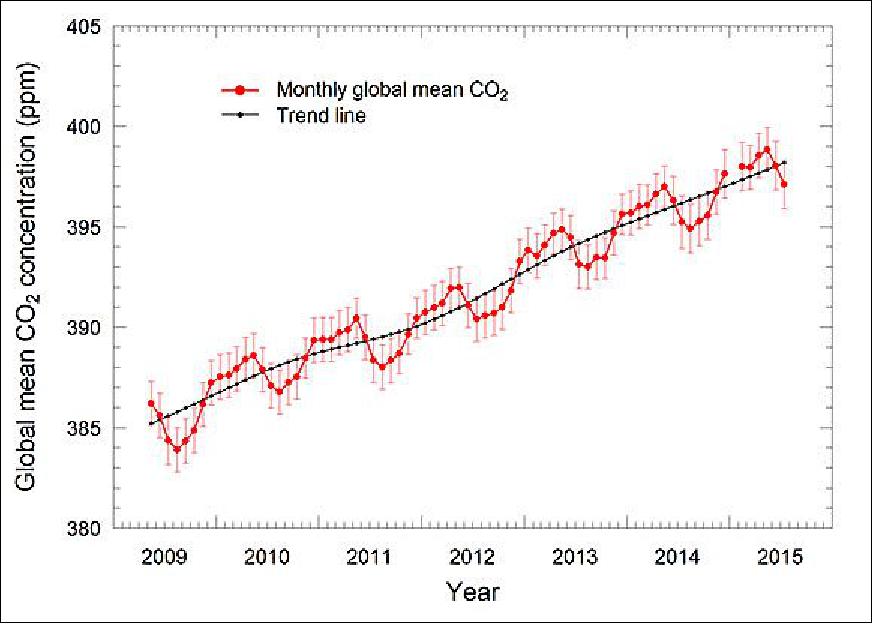
Legend to Figure 18: The error bar on the red circle indicates the uncertainty (one standard deviation) associated with the whole-atmosphere monthly mean.
• March 19, 2015: The MOE (Ministry of the Environment) of Japan, JAXA (Japan Aerospace Exploration Agency ), NIES (National Institute for Environmental Studies), and NASA (National Aeronautics and Space Administration) have come to an understanding regarding cooperation on the GOSAT (Greenhouse Gases Observation Satellite), the GOSAT-2 (Greenhouse Gases Observing Satellite-2) and the OCO-2 (Orbiting Carbon Observatory-2) missions. - Mr. Mochizuki, Minister of the Environment, Dr. Okumura, President of JAXA, Dr. Sumi, President of NIES, and Mr. Bolden, Administrator of NASA, signed the MOU (Memorandum of Understanding) on March 17, 2015, in Tokyo. 36)
- GOSAT, its successor GOSAT-2, and OCO-2 are satellite missions that observe the concentration and distribution of greenhouse gases in Earth's atmosphere from outer space for the purpose of studying climate change. In addition, GOSAT/GOSAT-2 contribute to the international effort toward the prevention of warming, including the monitoring greenhouse gas absorption and emissions.
- The calibration and validation of spaceborne greenhouse gas data among different satellite missions has been limited. Cooperation under this MOU will enable the Parties to improve the quality of satellite data through calibration campaigns and the effective use of ground-based observation data. Under the MOU, the parties will cross-calibrate instruments on the 3 CO2 missions, implement common validation, participate in joint mission science teams, and conduct joint presentations in international conferences.
• Dec. 5, 2014: A validation study has shown that the greenhouse gases observation sensor, "TANSO-FTS" onboard GOSAT/Ibuki observes column-averaged CO2 concentrations (hereinafter, "CO2 concentrations") to a precision (random error) of 0.5% (approximately 2 ppm) in comparison to the data acquired from ground-based observations. This study investigated the detectability of enhanced CO2 concentrations due to anthropogenic emissions, by satellite observation. 37)
- CO2 concentrations acquired by Ibuki comprise not only those pertaining to anthropogenic emissions but also encompass photosynthetic uptake and respiration-release by plants; emissions due to forest fires; and sink/source by ocean. These processes should be considered when interpreting the information on anthropogenic CO2 emissions from the CO2 concentrations acquired by Ibuki.
- Initially, the spatiotemporal distribution of CO2 concentrations originating from anthropogenic CO2 emissions are estimated using the data for anthropogenic CO2 emission rates from fossil fuel consumption (emission inventory) - a value based on the data for nighttime lights on the earth's surface as observed by satellite, as well as the information from the database for fossil fuel power plants and an atmospheric tracer transport model. - Subsequently, on the basis of this estimate, the observational data for CO2 concentrations acquired by Ibuki are classified into two categories: data including contamination by anthropogenic CO2 emissions (top panel in Figure 19) and those not including this contamination. The individual observational data sets including anthropogenic contamination are subtracted using averaged values for the data not including contamination, and values for CO2 concentrations from forest fires and plant activities are then subtracted from the data. These calculations produce the figures for anthropogenic CO2 concentrations using observational data from Ibuki (bottom panel in Figure 19).
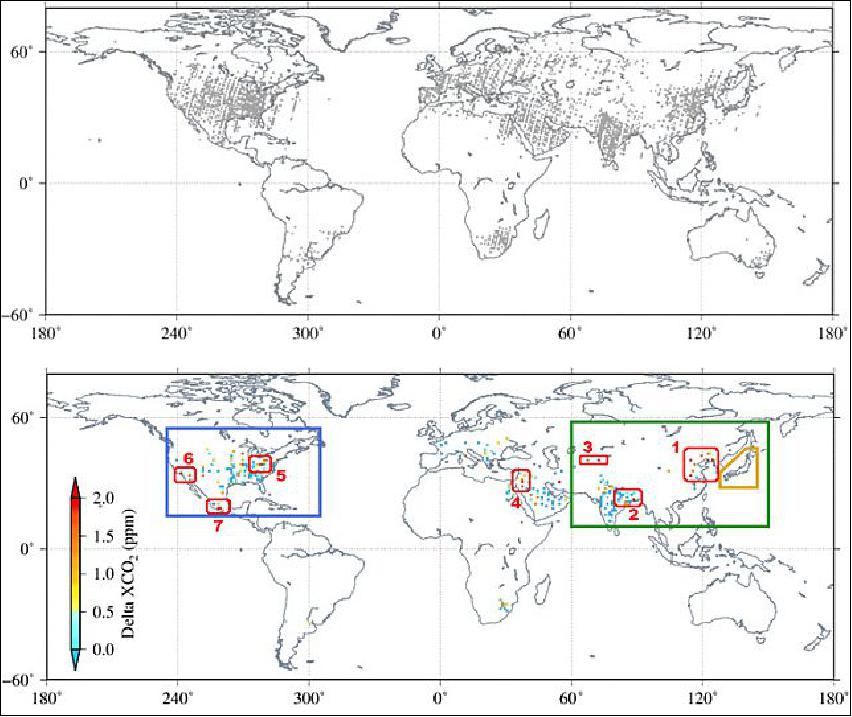
Regions with higher CO2 concentrations from anthropogenic activities are shown in the bottom of Figure 19 and summarized in Table 3. The regions in Table 3 can be identified as those with dense populations or industrial zones with fossil fuel power plants and developments of oil and gas fields.
No in Figure 19 | Rough range of the region for high concentrations of anthropogenic CO2 emissions derived from Ibuki | Countries, regions or major cities in the region | Maximum value of the concentrations of anthropogenic CO2 emissions for the region (1º x 1º in 3.5 years) |
1 | Lat.: 33º-46º N, Long.: 114º-127º E | China: Zhangjiakou, Anshan, Harbin, and Tianjin | 3.8 ppm |
2 | Lat.: 20º-23º N, Long.: 84º-89º E | India: Kolkata (Calcutta) | 2.0 ppm |
3 | Lat.: 40º-41º N, Long.: 67º-73º E | Eastern part of Uzbekistan, Southern edge of Kazakhstan, Eastern area of Kyrgyzstan, Northern edge of Tajikistan | 2.6 ppm |
4 | Lat.: 30º-32º N, Long.: 37º-38º E | Northwestern part of Saudi Arabia, Jordan | 1.8 ppm |
5 | Lat.: 38º-41º N, Long.: 79º-83º W | The United States: Pittsburgh | 2.1 ppm |
6 | Lat.: 33º-35º N, Long.: 114º-119º W | The United States: Los Angeles | 4.5 ppm |
7 | Lat.: 17º-19º N,Long.: 99º-102º W | Mexico: Acapulco | 2.4 ppm |
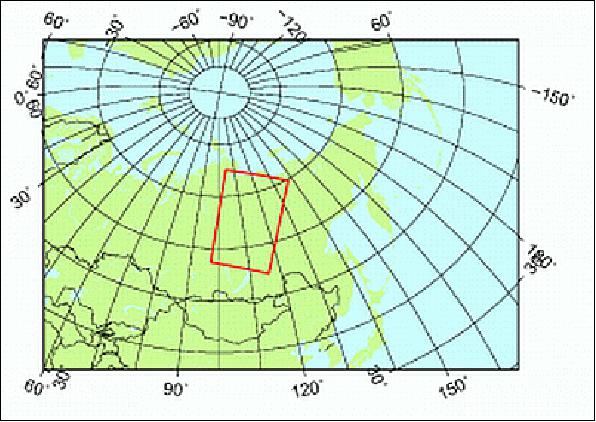
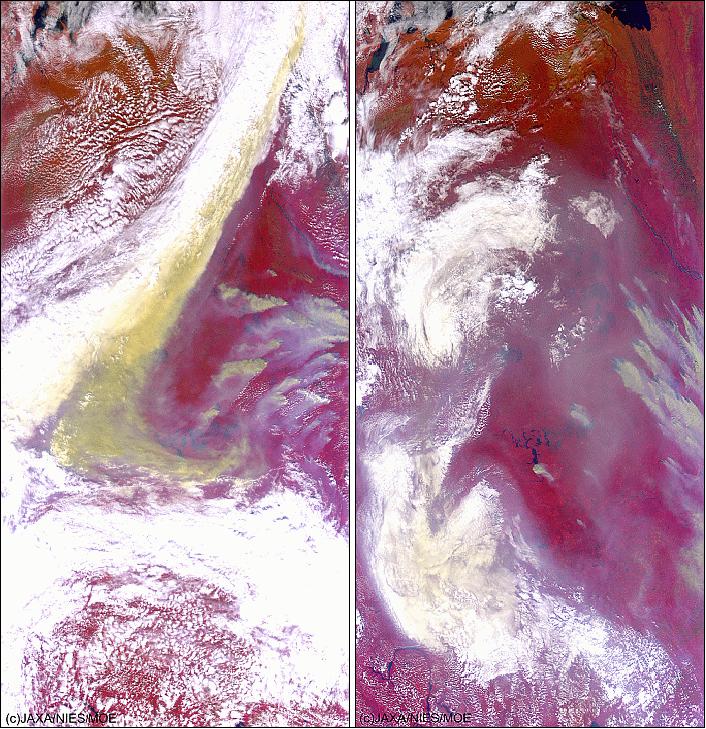
• Aug.1, 2014: The TANSO-CAI instrument on GOSAT/Ibuki captured the smoke of wildfires in Russia on two occasions (Figures 21). 38)
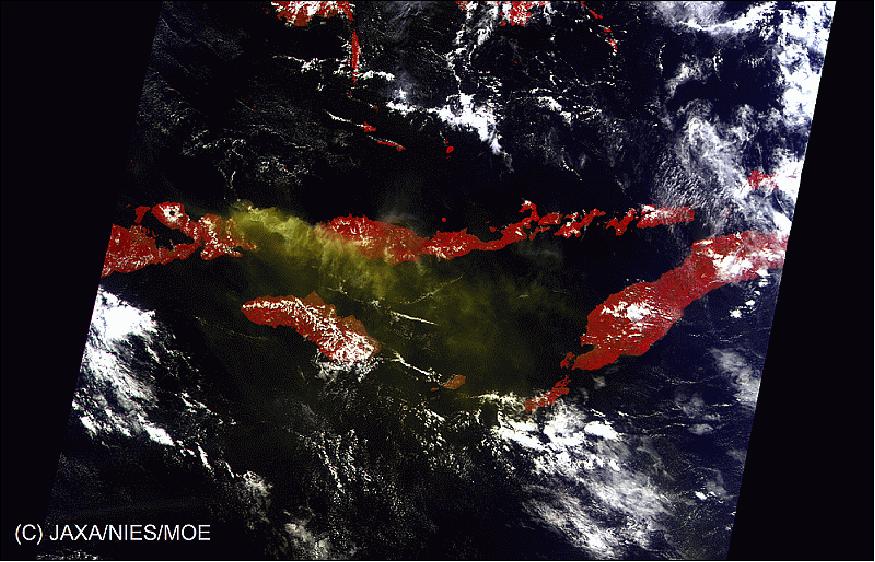
• June 6, 2014: The TANSO-CAI instrument on GOSAT/Ibuki captured the plume of ash cloud from the Sangeang Api volcano in Indonesia. 39)
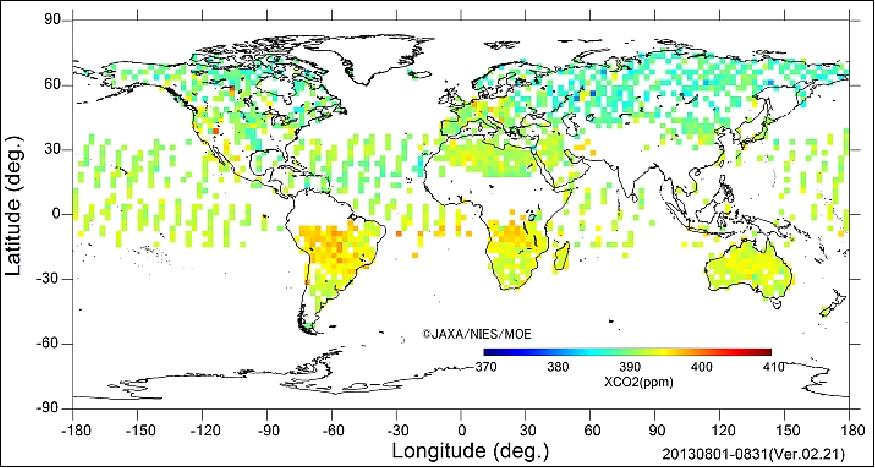
• May 2014: Global distributions of GHGs (Greenhouse Gases) such as CO2 and CH4 has been measured by GOSAT and analyzed with precision less than 1%, however, it should/can be improved further. 40)
- These data are used to estimate regional monthly CO2 and CH4 fluxes, and also used to detect GHG's temporal and spatial changes. These fluxes should be validated and improved.
- GOSAT has been operating more than five years, and now in the extended operation period. It is strongly expected that GOSAT will survive for several more years. Long term GOSAT data will contribute to GHG transport and carbon cycle sciences.
Along with the mission extension, the reprocessing of the L1B products was completed with the v161161 algorithm for all of GOSAT data. To retrieve XCO2 & XCH4 with high accuracy and precision (Ref. 42):
1) The well calibrated and characterized spectra is the key for spaceborne XCO2 and XCH4.
2) The next vicarious calibration will be performed in June 2014 to determine the radiometric degradation.
3) The new method was developed to characterize the non-linear response of Oxygen A-band, and will start the processing for large data sample soon.
• On January 23, 2014, GOSAT/Ibuki was 5 years on orbit. The spacecraft and its payload are operating nominally. With a nominal design life of 5 years and the good health of the spacecraft, the mission life was extended (by JAXA, NIES and MOE) for another 4 years (a contract was signed with the same operations team). 41) 42)
• Sept. 2013: First estimates of the global distribution of CO2 surface fluxes were estimated and published using total column CO2 measurements retrieved by the SRON-KIT RemoTeC algorithm from GOSAT (Greenhouse gases Observing SATellite). The global source–sink estimates of CO2 were from data over a period of eighteen months from 1 June 2009 to 1 December 2010.43)
• Summer 2013: The GOSAT spacecraft and its payload are operating nominally (four years on orbit as of January 23, 2013). TANSO-FTS, the main instrument of GOSAT, has been continuously measuring CO2 and CH4 distributions globally every three days. The data of the two payloads, TANSO-FTS and TANSO-CAI, are processed by JAXA to Level 1 products. Their higher level products are processed by NIES (National Institute for Environmental Studies) and distributed to researchers and general users through GUIG (GOSAT User Interface Gateway). 44) 45)
• December 2012: The GOSAT data of global CO2 fluxes on a monthly and regional basis for the one-year period between June 2009 and May 2010 is now being distributed publicly. These flux values were estimated from ground-based CO2 monitoring data and improved GOSAT-based CO2 concentration data. 46)
• Fall 2012: The GOSAT spacecraft and its payload are operating nominally.
• In June 2012, the GOSAT spacecraft and its payload are operating nominally. 48)
The spacecraft is over 3 years on orbit and acquires absorption spectra in the SWIR to TIR regions with the cloud/aerosol imager. Radiometric calibration on orbit in 3 years: 49)
- Vicarious calibration field campaign with in-situ measurements and aircraft under-flight of GOSAT collaborated with NASA ACOS (Atmospheric CO2 Observations from Space) research.
- Intercomparison attempt with other TIR sensors of IASI and AIRS
- Annual degradation monitoring at uniform desert sites.
• June 2012: OCO/GOSAT collaboration.
Immediately after the loss of OCO (Orbiting Carbon Observatory) of NASA/JPL (launch failure on Feb. 24, 2009), the GOSAT project team invited the OCO team to participate in the GOSAT data analysis. 50)
• In Nov. 2011, GOSAT captured the floodings in Thailand and Cambodia (Figure 26). 52)
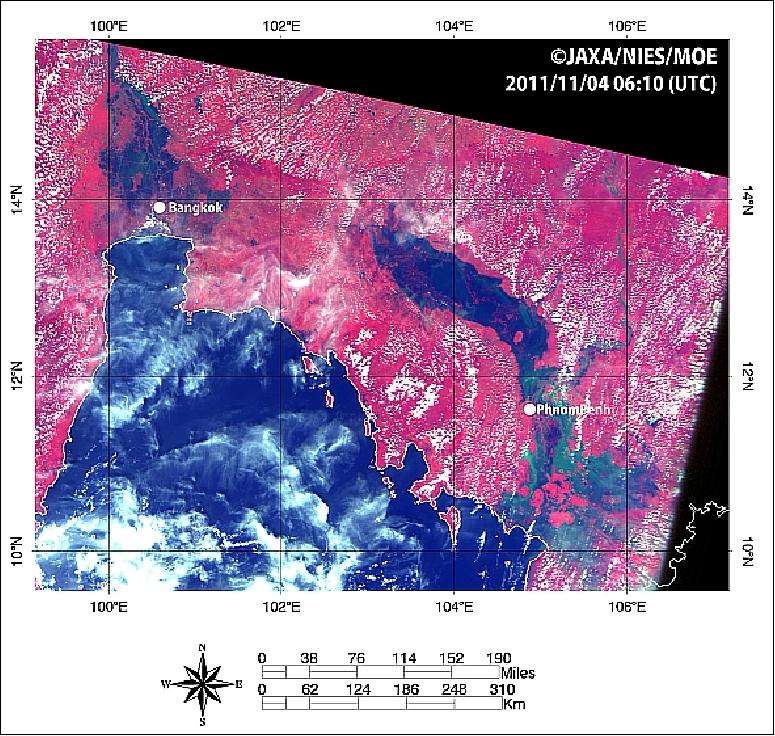
Legend to Figure 26: The water is shown in blue, terrestrial vegetation in red, and clouds in white. The white line is the contour line of mean sea level.
• October 2011: Using observational data from GOSAT and ground-based data, the estimation of monthly regional CO2 sources and sinks (net fluxes) and their uncertainty was carried out. It was demonstrated that the CO2 concentration data retrieved from GOSAT soundings can reduce the uncertainty of fluxes estimated from ground-based data alone.53)
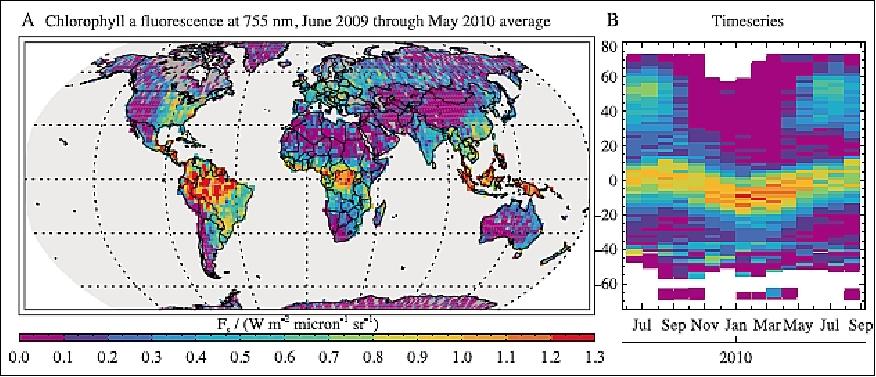
• Using GOSAT data, a research team from JPL, Germany, and Japan has shown that it is possible to pick up this fluorescent glow from space over the entire planet, and thereby infer details about the health and activity of vegetation on the ground. Terrestrial GPP (Gross Primary Production) constitutes the largest flux component in the global carbon budget, however significant uncertainties remain in GPP estimates and its seasonality. 54)
The fluorescence signal can be measured from space using high resolution spectra covering Fraunhofer lines (narrow absorption features in the solar spectrum) in the 660–800 nm range. By measuring the fractional depth of these lines, Fs can be accurately estimated, independent of scattering and albedo effects. For the retrieval of steady‐state solar induced chlorophyll fluorescence, the project used radiance spectra measured in the red spectral range between 756–759 nm and also 770.5–774.5 nm, recorded by the TANSO-FTS instrument. The solar‐ induced fluorescence signal Fs was retrieved using an iterative least squares fitting technique. A unique and critical step in the data processing is the correction of an observed zero‐level offset in acquired GOSAT O2 A-band spectra. Without correction, the offset strongly biases Fs because its impact on Fraunhofer line depth is indistinguishable from fluorescence.
After correction, the annual average of Fs clearly reveals the contrast between highly active vegetation and barren or snow‐covered surfaces (Figure 27 a). Fluorescence maxima appear over tropical evergreen forests as well as the eastern United States followed by Asia and central Europe. Overall, the global map of chlorophyll fluorescence also captures many small‐scale features such as enhanced signal in southeastern Australia or the comparatively low values of the Iberian Peninsula. The temporal evolution of fluorescence is of particular interest because the seasonal variation of atmospheric carbon dioxide is dominated by the seasonality of GPP and respiration. The research team observed a pronounced seasonal cycle in the northern hemisphere as well as seasonal shifts in the location of maximum fluorescence in the tropics (Figure 27 b). The southern hemisphere, conversely, exhibits a far smaller seasonal variability.
• The GOSAT mission is operating nominally in the summer of 2011. The overall functions and performances are good and well within design objectives. The radiometric response has been carefully monitored and calibrated. In addition, proper corrections have been applied for the level 1 processing. 55)
On-orbit operation: Grid observation is a nominal operation mode for TANSO-FTS. In parallel, sun glint over the ocean and target observations such as validation points, mega cities, power plants, are inserted between nominal grid observations. Every day, an observation plan with a series of time and pointing angles is uploaded from the ground.
The operation cycle lasts 12 days with 3 patterns together with grid observations:
- Pattern A, no sun glint and no target observations except for limited validation sites
- Pattern B, sun glint and target observations requested by research announcement users
- Pattern C, sun glint and limited validation sites.
Each pattern continues for 3 days and the order is patterns A, B, C, and B. Once a month, the back side of the solar diffuser plate, the analog circuit electric, and the ILSF (Instrument Line Shape Function) calibrations are being performed.
• The GOSAT/Ibuki mission is operational in 2011 (two years on orbit as of January 23, 2011).
Acquired data are provided to research and public users with applying the Level 1 and 2 processing. The algorithm for Level 1 and 2 are also being updated during this phase, in order to improve the data quality for precise measurement of CO2 and CH4. - After the launch, the on-orbit characterization of performance, calibration, and health monitoring of TANSO has been continuously conducted for the updating of the Level-1 and -2 processing algorithms. - During the over one-year operational period, a few undesirable anomalies were noticed on the measurement data which are: 56) 57)
4) Pointing instability during acquisition:
5) Shift of ZPD (Zero Path Difference) position: The turnaround time is a loss of observation time which has to be minimized. During turnarounds, both FTS and pointing mechanisms are activated at the same time. Micro vibrations caused by the pointing mirror motion affect the laser fringe count. Sometimes the controller misses laser fringes at the turnaround position and ZPD shifts gradually (Ref. 55).
6) Degradation of sampling laser intensity
7) Offset of pointing positions.
Unfortunately, some of these anomalies affect the data qualities. To minimize the degradation of the data quality, counter operation techniques are applied as well as the additional quality assessments (quality flags are set).
• In Feb. 2010, JAXA completed the initial validation of the concentration of carbon dioxide (CO2) and methane (CH4) based on the analysis results of observation data in the clear region taken by GOSAT/Ibuki. Accordingly, JAXA started to provide the above results (Level 2 products of CO2 and CH4 column densities) as well as information on cloud covering to the general public on February 18, 2010. 58)
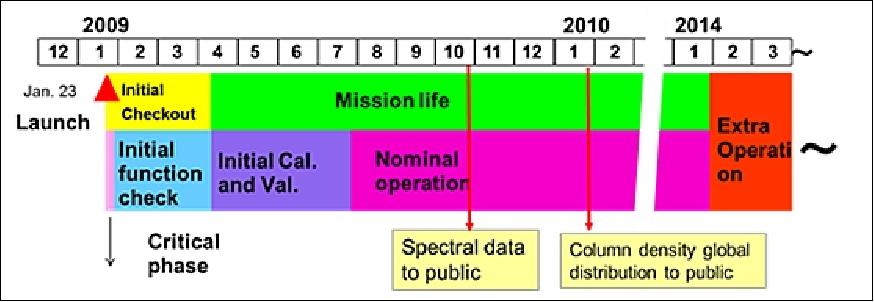
• Oct. 30, 2009: Recently, an initial calibration of Level 1 data products, radiance spectrum and images observed by IBUKI, has been completed and the project will begin to release them to general users.
In the future, after further calibration and validation of the data, the atmospheric concentration of carbon dioxide and methane data and corresponding analyzed products will be made available to registered users among the general public from around the end of January, 2010 target period. 59)
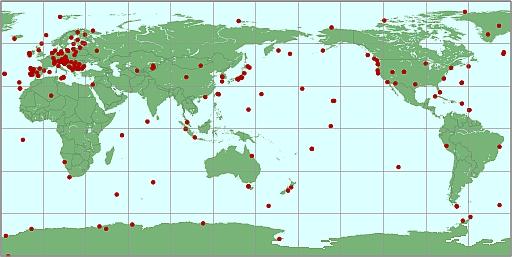
Note: The greenhouse gases are regularly observed with 286 ground observation stations from 59 countries (Figure 30) and the data is distributed worldwide through World Data Center for Greenhouse Gases (WDCGG) which is operated by JMA (Japan Meteorological Agency) and WMO (World Meteorological Organization). 60)
• In late May 2009, the GOSAT mission is operating in an initial calibration and validation mode. The initial calibration of the mounted sensors, as well as tuning of the computer processing system, is underway at JAXA and at NIES (National Institute for Environmental Studies). 61)
• The TEDA instrument on GOSAT has been sending its observation data since its turn on 31 January 2009. The initial observed data of TEDA shows reasonable agreement with model predictions. GOSAT TEDA is expected to reveal the temporal and spatial structure of space radiation environment in detail in its planned five years mission (Ref.18).
• In April/May 2009, GOSAT/Ibuki is in an initial calibration and validation mode. A preliminary analysis of clear-sky carbon dioxide and methane column averaged dry air mole fraction over land was performed for the period April 20-28, 2009. These carbon dioxide and methane data show a hemispheric gradient, with largest values in the Northern Hemisphere, broadly in agreement with existing ground-based measurements. 62) 63)
• "First light" light of the sensors TANSO-FTS and TANSO-CAI occurred on Feb. 7, 2009 during the course of an initial functional checkup when the instruments were activated and observed some regions over Japan. 64) 65)
Sensor Complement
TANSO-FTS (Thermal And Near infrared Sensor for carbon Observation - Fourier Transform Spectrometer)
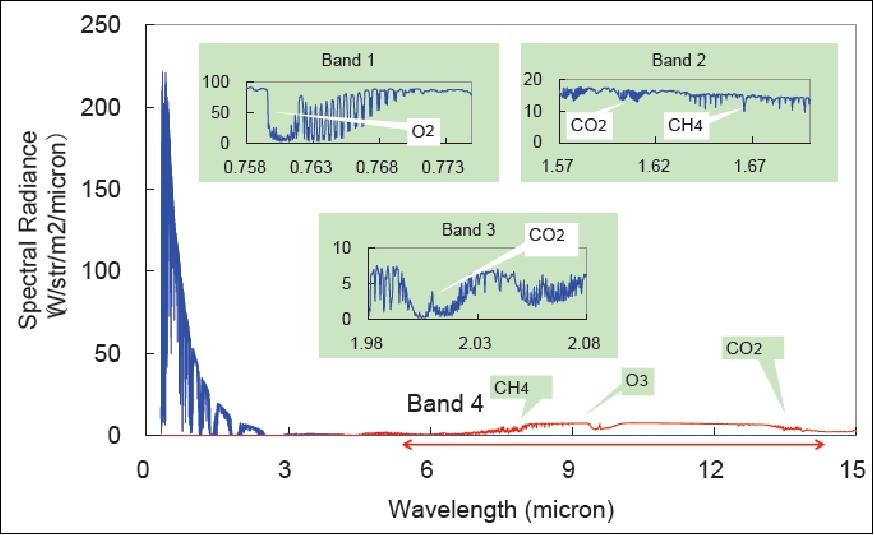
TANSO-FTS features high optical throughput, fine spectral resolution, and a wide spectral coverage (from VIS to TIR in four bands). The reflective radiative energy is covered by the VIS and SWIR (Shortwave Infrared) ranges, while the emissive portion of radiation from Earth's surface and the atmosphere is covered by the MWIR (Midwave Infrared) and TIR (Thermal Infrared) ranges. These spectra include the absorption lines of greenhouse gases such as carbon dioxide (CO2) and methane (CH4). 66) 67) 68) 69) 70) 71) 72) 73) 74) 75) 76) 77)
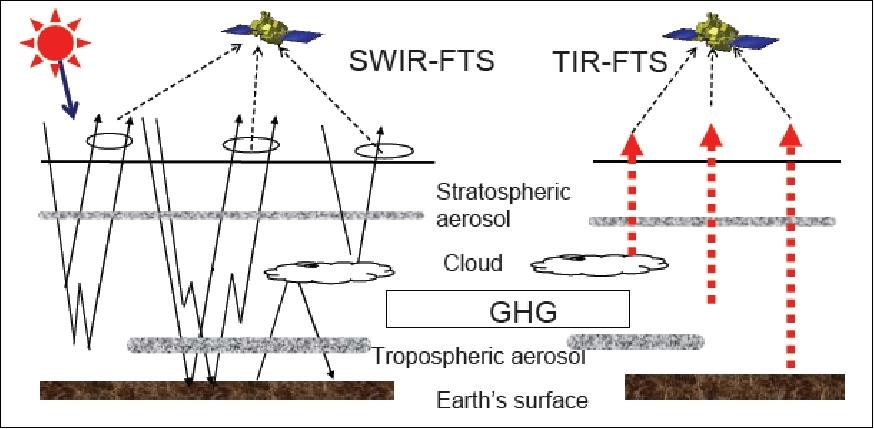
Figure 32 illustrates the spectral coverage and absorption lines of GOSAT observations. From these spectral data, CO2, CH4, and ozone (O3), which are major GHG (Greenhouse Gases), are observed. The column density of CO2 is mainly retrieved from the 1.6 µm region absorption lines, of which intensities are less temperature-dependent and not interfered by other molecules. The oxygen (O2) A band absorption at 0.76 µm is being used to estimate the effective optical path length.
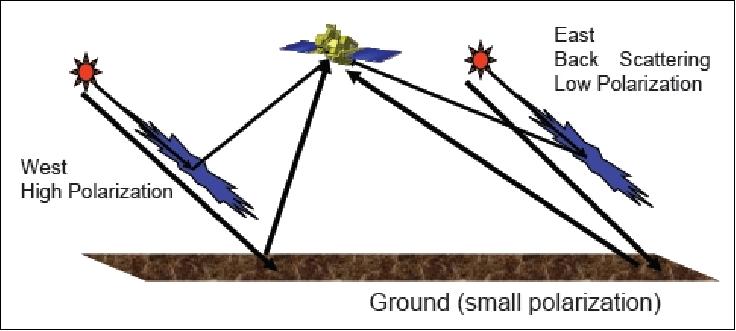
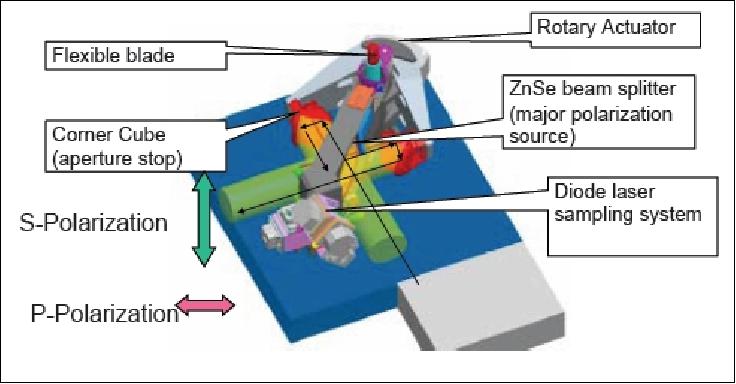
The polarization of the scene flux is also acquired by measuring the P and S polarization simultaneously. The path radiance (P) is highly polarized while the surface reflected radiance (S) is less polarized as shown in Figure 33. In addition, as the instrument itself has the polarization sensitivity, the radiative transfer of SWIR is well defined by measuring and characterizing polarization.
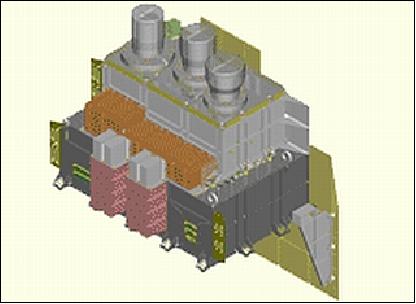
The instrument was built by the ABB Bomem Remote Sensing Group of Quebec City, Canada, a Swiss-Swedish electrical engineering company under contract to NEC Toshiba Space Systems. The TANSO-FTS design employs a nadir-viewing instrument to monitor the greenhouse gases in the troposphere (the troposphere happens to be the main atmospheric layer in which the greenhouse effect is taking place) - and the nadir-viewing monitoring concept is considered the best scheme feasible to measure the radiative flux in the troposphere. The observation geometry is illustrated in Figure 34. The TANSO-FTS instrument has a mass of 250 kg, power consumption of 310 W, size: 1.2 m x 1.1 m x 0.7 m.
Ground pointing mechanism and foreoptics | ||||
Configuration | 2-axis whiskbroom scanner (fully redundant) | |||
Scanning | Cross-track direction: ± 35º; Along-track direction: ± 20º | |||
FOV (swath) | 750 km (5-point observation in cross track) | |||
IFOV | 10.5 km | |||
FTS (Fourier Transform Spectrometer) | ||||
Scan speed | 0.25, 0.5, 1 interferogram/s | |||
Spectral band No | 1 | 2 | 3 | 4 |
Spectral range | VIS | SWIR | SWIR | MWIR/TIR |
Coverage (µm) | 0.758-0.775 | 1.56-1.72 | 1.92-2.08 | 5.5-14.3 |
Target gases | O2 | CO2, CH4 | CO2 | CO2, CH4, O3 |
Spectral resolution | 0.5 cm-1 | 0.2 cm-1 | 0.2 cm-1 | 0.2 cm-1 |
Detector type | Si | InGaAs | InGaAs | PC-MCT |
Calibration | Solar irradiance, deep space, moon, diode laser | blackbody, deep space | ||
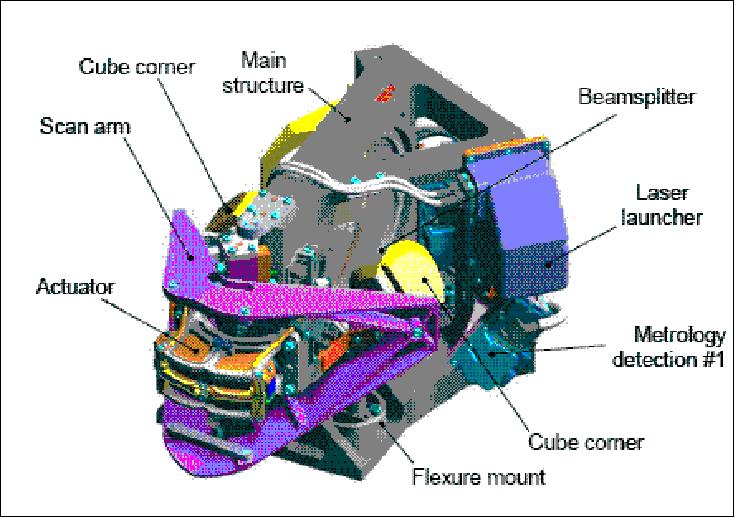
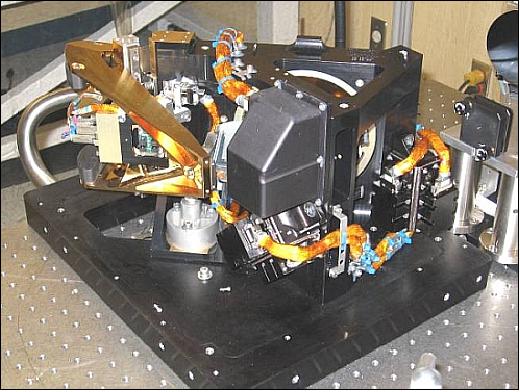
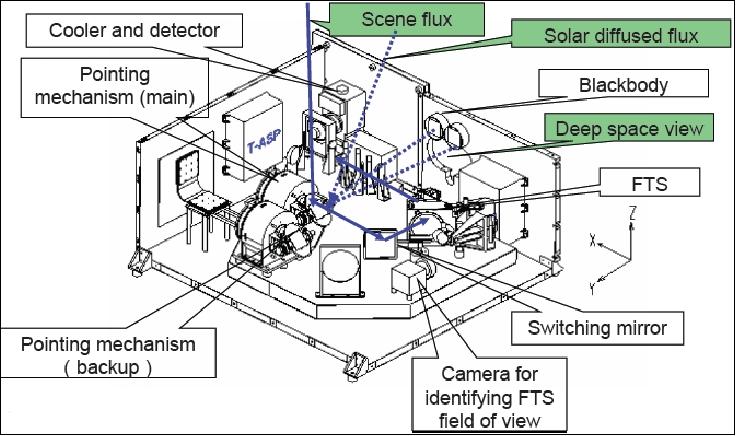
The main TANSO-FTS elements are: scanning/pointing mechanism, relay optics, FTS, and detector arrays in the focal plane. A single FTS configuration was chosen with a beamsplitter capable of covering the required wide spectral range. The instrument employs a dual-pass flexible blade Michelson FTS (Fourier Transform Spectrometer) design as well as a diode laser sampling system to reduce the instrument size and mass. FTS is a double pendulum type interferometer with two corner cube reflectors. The maximum optical path difference of 2.5 cm provides an unapodized spectral resolution of 0.2 cm-1 across a wide spectral range going from 0.75 - 15 µm with a ZnSe beam splitter and a fully redundant 1.31 µm DFB (Distributed Feedback) laser. A photoconductive (PC) HgCdTe sandwich detector (also referred to as MCT) in the MWIR/TIR ranges and a pulse-tube cryocooler provide high linearity and low-noise level performance. The TANSO interferometer accommodates an optical beam of more then 70 mm in diameter to provide the high throughput needed for Earth observation. The scan arm motion is induced by a voice coil actuator driven by a sophisticated control algorithm. The TANSO interferometer design uses well-proven technologies; it benefits from the space heritage of the ACE-FTS instrument operating onboard the Canadian SciSat-1 mission since February 2004.
The overall concept design/performance and operational scenarios of TANSO-FTS were verified with a BBM (Breadboard Model) instrument version, flown in an aircraft demonstration series (completion of test flights in May 2003).
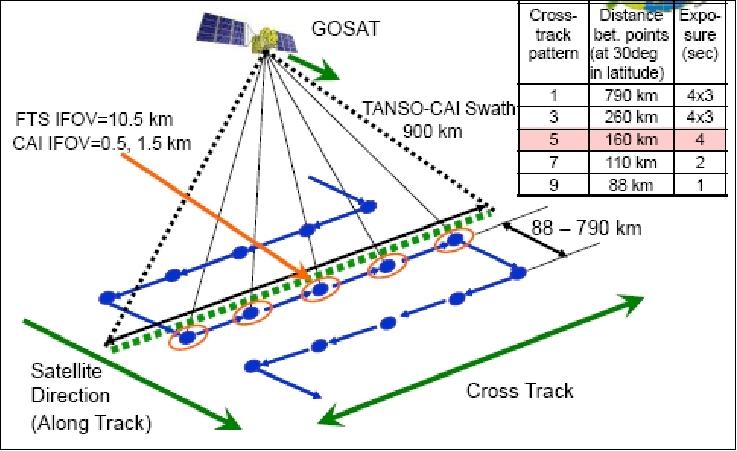
The number of cross-track observation points is variable and can be selected in such a way as to satisfy the SNR and spatial resolution requirements. FTS employs a dichroic filter to be able to observe all spectral bands for all observation points.
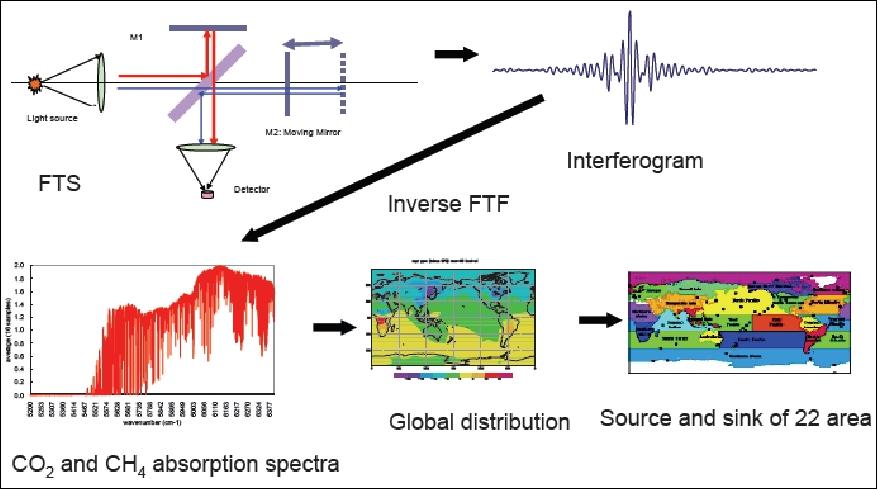
On the ground, the FTS interferograms are being transformed into spectra (which include the absorption spectra of GHGs) using FFT (Fast Fourier Transform) algorithms. The global GHG source-and-sink characteristics on a sub-continental scale are being retrieved from the global GHG distribution data with a chemical transfer model.
TANSO-CAI (Thermal And Near infrared Sensor for carbon Observation - Cloud and Aerosol Imager)
TANSO-CAI is a radiometer in the spectral ranges of ultraviolet (UV), visible, and SWIR to correct cloud and aerosol interference. The imager has continuous spatial coverage, a wider field of view, and higher spatial resolution than the FTS in order to detect the aerosol spatial distribution and cloud coverage. Using the multispectral bands, the spectral characteristics of the aerosol scattering can be retrieved together with optical thickness. In addition, the UV-band range observations provide the aerosol data over land. With the FTS spectra, imager data, and the retrieval algorithm to remove cloud and aerosol contamination, the column density of the gases can be the column density of the gases can be retrieved with an accuracy of 1%.
Spectral band No | Center wavelength (µm) | Bandwidth (nm) | Spatial resolution (km) (IFOV) | No of pixels (cross-track) |
1 | 0.380 | 20 | 0.5 | 2000 |
2 | 0.674 | 20 | 0.5 | 2000 |
3 | 0.870 | 20 | 0.5 | 2000 |
4 | 1.620 | 90 | 1.5 | 500 |
Swath (FOV) | 1000 km | |||
Instrument mass, power, size | 40 kg, 100 W, 0.5 m x 0.4 m x 0.5 m | |||
TANSO-CAI consists of two units, CAI-OPT (Optical unit) and CAI-EL (Electronics unit). CAI-OPT is a radiometer with collecting optics, linear array detectors, preamps and analog to digital converters. CAI-EL is almost the same as FTS-EL.
TANSO Instrument Operations
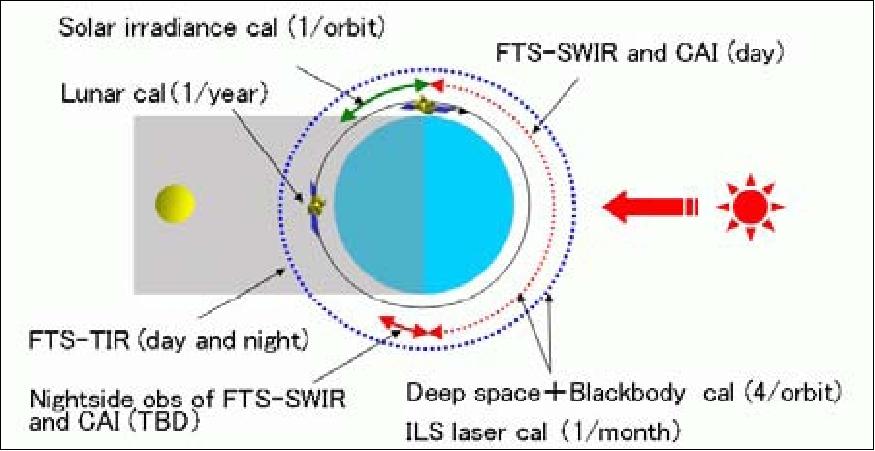
During the daytime period of the orbit both SWIR and MWIR/TIR of the TANSO-FTS and the TANSO-CAI imager data are acquired. During the nighttime passage, only FTS MWIR/TIR data is acquired. At sunrise, the direct sunlight is introduced into the FTS through the spectralon diffuser plates for SWIR radiance calibration. Two diffusers with different exposure times are being used to correct the long-term diffuser degradation. In addition, the 1.55 µm diode laser light is introduced through the diffuser plate into the FTS to calibrate the instrument function onboard. The pointing mechanism views the deep space and inner blackbody periodically for the zero level and MWIR/TIR radiance calibration. 78)
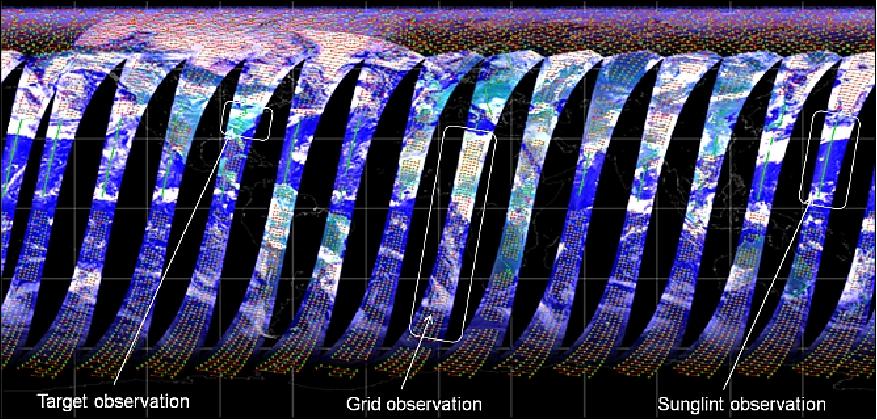
The TANSO operation on orbit during daytime is illustrated in Figure 42. The FTS normally observes by separate pointings in the cross-track direction with 800 km swath by the pointing mirror. The CAI 3 bands cover the FTS observation swath with 1000 km for cloud detection within the FTS field of view, while only band 4 is slightly narrow. The FTS observations are combined with normal observation of 5 points cross-track with acquisition of on-orbit calibration data, sunglint observation over the ocean, and target observations for calibration and validation sites and tracking of large cities and vicinities. Figure 42 shows the observation pattern during the daytime on 5 June 2010. The red shows the normal grid observation. The continuous green over the ocean shows the sunglint observation to look at strong shining ocean areas. The target observations are operated over China and the U.S. east coast colored in green. 79)
Lunar calibration is achieved by rotating the spacecraft into the direction of the moon. This provides a stable calibration reference for both instruments. Lunar calibration is considered once per year.
The TANSO-CAI instrument features less on-board calibration than the FTS interferometer. The sensitivity and stability against time and temperature variations were characterized in pre-flight tests. On-board calibration uses a blackbody and nightside observations. The lunar observation will be operated once a year with particular pixels at full moon. 80)
Opportunities for Coordinated CO2 Observations from GOSAT and OCO
GOSAT of JAXA and OCO (Orbiting Carbon Observatory) of NASA are the first two satellites designed to make global measurements of atmospheric carbon dioxide (CO2) with the precision and sampling needed identify and monitor surface sources and sinks of this important greenhouse gas. Because the operational phases of the OCO and GOSAT missions overlap in time, there are numerous opportunities for comparing and combining the data from these two satellites to improve our understanding of the natural processes and human activities that control the atmospheric CO2 and it variability over time. 81)
Comparisons of GOSAT and OCO measurement approaches: GOSAT retrieves XCO2 from the same CO2 and O2 absorption bands used by OCO, but uses a high resolution Fourier transform spectrometer (TANSO-FTS) rather than a grating spectrometer to make its measurements. An independent Cloud and Aerosol Imager (TANSO-CAI) is used to identify cloudy scenes. The grating and FTS techniques both offer unique advantages for this application. For example, TANSO-FTS provides greater spectral coverage and slightly higher spectral resolution, while the OCO instrument provides greater spatial resolution and slightly higher signal-to-noise ratios in each sounding. Comparisons of XCO2 retrievals from these two measurement techniques could help to identify and correct subtle measurement biases that might otherwise be missed.
Combining the OCO and GOSAT datasets would benefit the carbon cycle science community by increasing the spatial coverage and decreasing the interval between observations by either satellite, alone. To combine these datasets without introducing biases, the OCO and GOSAT measurements must be validated by a common measurement standard. Fortunately, the OCO and GOSAT mission plans are quite synergistic, providing numerous opportunities for cross validation.
Parameter | GOSAT | OCO |
Gases measured | CO2, CH4, O2, O3, H2O | CO2, O2 |
Instruments | SWIR/TIR FTS, CAI | Grating spectrometer (OCO instrument) |
Total mass, power | 1750 kg, 4 kW | 460 kg, 890 W |
Orbit | Sun-synchronous | Sun-synchronous |
Orbital altitude, inclination | 666 km, 98º | 705 km, 98.2º |
Revisit time | 3 days | 1 day |
Launch vehicle | H-IIA | Taurus-XL (3110) |
Nominal mission life | 5 years | 2 years |
Launch of mission | January 23, 2009 | February 24, 2009 (however,OCO experiened a launch failure) |
References
1) A. Kuze, K. Kondo, T. Hamazaki, "Greenhouse Gases Monitoring from the GOSAT Satellite," MWE (Microwave Workshop and Exhibition) 2005, Yokohama, Japan, Nov. 9-11, 2005, pp. 377-382
2) M. Kasuya, T. Hamazaki, "Overview of the Greenhouse Gases Observing Satellite (GOSAT)," Proceedings of WSANE 2005 (Workshop for Space, Aeronautical and Navigational Electronics 2005), KARI, Daejeon, Korea, March 3-5, 2005, pp. 145-149
3) M. Suzuki, K. Shibasaki, H. Shimoda, T. Ogawa, " Overview of GCOM-A1 Satellite Program," Proceedings of the IEEE/IGARSS 2000 Conference, Honolulu, HI, July 24-28, 2000
4) K. Shibasaki, M. Suzuki, Y. Yamamoto, "Ozone Dynamics Ultraviolet Spectrometer (ODUS) on Board GCOM-A1," Proceedings of the IEEE/IGARSS 2000 Conference, Honolulu, HI, July 24-28, 2000
5) M. Suzuki, T. Sano, A Kuze, K. Shibasaki, S. Sobue, C. Ishida, H. Shimoda, T. Ogawa, "GCOM-Al Program I. - Program Overview," Proceedings of IGARSS 2002, Toronto, Canada, June 24-28, 2002
6) T. Hamazaki, "GOSAT Project and Mission Overview," 12th ASSFTS (Atmospheric Science from Space using Fourier Transform Spectrometry) Workshop, May 18-20, 2005, Quebec City, Canada, URL: https://web.archive.org/web/20120824020700/http://bernath.uwaterloo.ca:80/ASSFTS/Media/ASSFTS%20Presentations/pdfPres/Hamazaki.pdf
7) http://www.jaxa.jp/projects/sat/gosat/index_e.html
8) http://www.jaxa.jp/article/interview/vol28/index_e.html
9) G. Inoue, T. Hamazaki, T. Yokota, "GOSAT and Carbon Cycle Research," Proceedings of the 26th ISTS (International Symposium on Space Technology and Science) , Hamamatsu City, Japan, June 1-8, 2008, 2008-Keynote-04v
10) GOSAT Project pamphlet, 6th Edition 2nd Revision, Feb. 2012, http://www.gosat.nies.go.jp/eng/GOSAT_pamphlet_en.pdf
11) Masahiro Kasuya, Masakatsu Nakajima, Takashi Hamazaki, "Greenhouse Gases Observing Satellite (GOSAT) Program Overview and Its Development Status," Transactions of JSASS (Japan Society for Aeronautical and Space Sciences), Vol. 7, No.ISTS26, pp. To_4_5-To_4_10, 2009, URL: https://www.jstage.jst.go.jp/article/tstj/7/ists26/7_ists26_To_4_5/_pdf
12) N. Hosokawa, Y. Nakashiki, T. Anzai, Y. Nishida, T. Tohara, K. Inoshiro, M. Wakao, T. Nakamura, "Design of Attitude and Orbit Control System for Greenhouse Gases Observing Satellite (GOSAT)," Proceedings of the 26th ISTS (International Symposium on Space Technology and Science) , Hamamatsu City, Japan, June 1-8, 2008, paper: 2008-d-46
13) Masahiro Kasuya, Masakatsu Nakajima, Takashi Hamazaki, "Greenhouse Gases Observing Satellite (GOSAT) Program Overview and Its Development Status," Proceedings of the 26th ISTS (International Symposium on Space Technology and Science) , Hamamatsu City, Japan, June 1-8, 2008, paper: 2008-o-4-01v
14) T Ishizu, H. Hasegawa, H. Miyazaki, M. Kasuya, "GOSAT Proto Flight Model Development," Proceedings of the 26th ISTS (International Symposium on Space Technology and Science) , Hamamatsu City, Japan, June 1-8, 2008, paper: 2008-o-4-03v,
15) Y. Sasaki, H. Matsumoto, T. Goka, T. Nakamura, K. Terasawa, H. Kitamura, "Technical data acquisition equipment for GOSAT," 30th International Cosmic Ray Conference (ICRC-07), Merida, Mexico, July 3-11, 2007
16) "Overview of the Ibuki (GOSAT)," JAXA, URL: http://www.jaxa.jp/countdown/f15/overview/ibuki_e.html
17) Toshiyuki Nakamura, Takashi Hamazaki, Masahiro Kasuya, Masakatsu Nakajima and the GOSAT team, "On-orbit Environment Observation Around Satellite Using Monitor Cameras on Greenhouse gases Observing Satellite (GOSAT)," Proceedings of the 60th IAC (International Astronautical Congress), Daejeon, Korea, Oct. 12-16, 2009, IAC-09.D1.5.3
18) Yasutomo Sasaki, Haruhisa Matsumoto, Takahiro Obara, "Preliminary result of radiation measurement on GOSAT," Proceedings of the 27th ISTS (International Symposium on Space Technology and Science) , Tsukuba, Japan, July 5-12, 2009, paper: 2009-r-2-23
19) http://www.jaxa.jp/countdown/f15/overview/sub_payload_e.html
20) Yosuke Nakamura, Naomi Murakami, Yuta Horikawa, Hiroshi Tachihara, Hiroshi Horiguchi, Keiichi Hirako, Hidekazu Hashimoto, "Vitalization of Japanese Small Satellite Community through Publicity-offered Piggy-back Launch," Proceedings of the Symposium on Small Satellite Systems and Services (4S), Funchal, Madeira, Portugal, May 31-June 4, 2010
21) Toshiaki Takeshima, "GOSAT Mission Operation System," Nov. 5, 2008, URL: http://www.gosat.nies.go.jp/eng/proposal/download/WS/10_Takeshima.pdf
22) J. Joiner, Y. Yoshida, A. P. Vasilkov, Y. Yoshida, L. A. Corp, E. M. Middleton, "First observations of global and seasonal terrestrial chlorophyll fluorescence from space," Biogeosciences, Volume 8, pp. 637–651, 2011, URL http://www.biogeosciences.net/8/637/2011/bg-8-637-2011.pdf
23) L. Guanter, L. Alonso, L. Gómez-Chova, J. Amorós-López, J. Vila-Francés, J. Moreno, " Estimation of solar-induced vegetation fluorescence from space measurements, Geophysical Research Letters, Vol. 34, 2007, L08401, doi:10.1029/2007GL029289, 2007
24) Christian Frankenberg, Joseph Berry, Luis Guanter, Joanna Joiner, "Remote sensing of terrestrial chlorophyll fluorescence from space," Feb. 15, 2013, SPIE News room, DOI: 10.1117/2.1201302.004725, URL: https://spie.org/x92267.xml
25) Laurie J. Schmidt , Alan Buis, "How Does Your Garden Glow? NASA's OCO-2 Seeks Answer," NASA/JPL, May 5, 2014, URL: http://www.jpl.nasa.gov/news/news.php?release=2014-141
26) "EUMETSAT, Japanese space agency to cooperate on greenhouse gas monitoring," EUMETSAT, 14 May 2019, URL: https://web.archive.org/web/20200204060011/https://www.eumetsat.int/website/home/News/DAT_4393827.html
27) "Earth Observation Satellites in Operation," JAXA, URL: http://global.jaxa.jp/projects/
28) "Eruption of Mount Shinmoedake volcano," EORC-JAXA, October 2017, URL: http://www.eorc.jaxa.jp/GOSAT/news/news_201710_2.html
29) "Controlled Burn and Air Pollution in India," EORC-JAXA, December 2016, URL: http://www.eorc.jaxa.jp/GOSAT/news/news_201612.html
30) Akihiko Kuze, Kei Shiomi, Hiroshi Suto, "How GOSAT has provided uniform-quality spectra and optimized global sampling patterns for seven years," 12th International Workshop on Greenhouse Gas Measurements from Space (IWGGMS-12)," Kyoto University, Kyoto, Japan, June7- 9, 2016, URL: https://www.omc.co.jp/iwggms12/pdf/Session_2/5_Akihiko_Kuze.pdf
31) Akihiko Kuze, Hiroshi Suto, Kei Shiomi, Shuji Kawakami, Makoto Tanaka, Yoko Ueda, Akira Deguchi, Jun Yoshida, Yoshifumi Yamamoto, Fumie Kataoka, Thomas E. Taylor, Henry L. Buijs, "Update on GOSAT TANSO-FTS performance, operations, and data products after more than 6 years in space," Atmospheric Measurement Techniques, Vol. 9, 2016, pp: 2445–2461, doi:10.5194/amt-9-2445-2016, URL: http://www.atmos-meas-tech.net/9/2445/2016/amt-9-2445-2016.pdf
32) Current operational status: "2014-2015 Solar Paddle Incident and Pointing Mechanism Switch," JAXA/EORC, URL: http://www.eorc.jaxa.jp/GOSAT/currentStatus_1.html
33) "Whole-atmosphere monthly mean CO2 concentration based on GOSAT observations — Recent data," NIES, GOSAT Project, May 20, 2016, URL: http://www.gosat.nies.go.jp/en/recent-global-co2.html
34) "Whole-atmospheric monthly CO2 concentration tops 400 ppm - Preliminary GOSAT monitoring results -," JAXA Press Release, May 20, 2016, URL: http://global.jaxa.jp/press/2016/05/20160520_ibuki.html#pict
35) "Public release of whole-atmosphere monthly mean carbon dioxide concentration based on observations by Greenhouse gases Observing Satellite "IBUKI" (GOSAT)," JAXA, NIES, MOE, Press Release, Nov. 16, 2015, URL: http://global.jaxa.jp/press/2015/11/20151116_ibuki.html#ref
36) "JAXA, NIES, MOE and NASA signed a Memorandum of Understanding for cooperation on GOSAT, OCO-2 and GOSAT-2 missions," JAXA, March 19, 2015, URL: http://global.jaxa.jp/projects/activity/int/topics.html#topics4041
37) "IBUKI (GOSAT) Satellite's Historically Unprecedented Observation of Anthropogenic CO2 Emissions of Mega-City Regions from Space," JAXA Press Release, Dec. 5, 2014, URL: http://global.jaxa.jp/press/2014/12/20141205_ibuki.html
38) "GOSAT Ibuki captures the smoke of wildfires in Russia," NIES, August 1, 2014, URL: http://www.gosat.nies.go.jp/eng/related/2014/201408.htm
39) "GOSAT "IBUKI" captures the plume of ash cloud from the Sangeang Api volcano in Indonesia," NIES, June 6, 2014, URL: http://www.gosat.nies.go.jp/eng/related/2014/201406.htm
40) T. Yokota, N. Kikuchi, Y. Yoshida, A. Bril, S. Oshchepkov, M. Inoue, I. Morino, O. Uchino, H.-S. Kim, H. Takagi, M. Saito, S. Maksyutov, A. Yuki, S. Kanekon, F. Kawazoe, M. Ajiro, "Progress of NIES GOSAT Project in 2013 – 2014 and expected outcomes in the extended operation period," Proceedings of the IWGGMS-10 (10th International Workshop on Greenhouse Gas Measurements from Space) ESA/ESTEC, The Netherlands, May 5-7, 2014, URL: http://www.congrexprojects.com/2014-events/14c02/programme
41) T. Yokota, "GOSAT Mission Operation Extended after Nominal Lifetime," NIES GOSAT Project Letter, Issue No 30, March 2014, p. 10, URL: http://www.gosat.nies.go.jp/eng/newsletter/newsletter30e.pdf
42) H. Sato, A. Kuze, K. Shiomi. K. Yotsumoto, M. Nakajima, T. Hirabayashi, "Space.based Carbon Monitoring by GOSAT and GOSAT-2," Proceedings of the IWGGMS-10 (10th International Workshop on Greenhouse Gas Measurements from Space) ESA/ESTEC, The Netherlands, May 5-7, 2014, URL: http://www.congrexprojects.com/2014-events/14c02/programme
43) S. Basu, S. Guerlet, A. Butz, S. Houweling, O. Hasekamp, I. Aben, P. Krummel, P. Steele, R. Langenfelds, M. Torn, S. Biraud, B. Stephens, A. Andrews, D. Worthy, "Global CO2 fluxes estimated from GOSAT retrievals of total column CO2," Atmospheric Chemistry and Physics, Vol. 13, pp. 8695–8717, Sept. 3, 2013, URL: http://www.atmos-chem-phys.net/13/8695/2013/acp-13-8695-2013.pdf
44) Masataka Ajiro, Hiroshi Watanabe, Akira Yuki, Fumie Kawazoe, Sayaka Kanekon and Tatsuya Yokota, "GOSAT higher level products and their distribution status," Proceedings of the 29th ISTS (International Symposium on Space Technology and Science), Nagoya-Aichi, Japan, June 2-8, 2013, paper: 2013-n-58
45) "NIES GOSAT Project Newsletter," July 2013, Issue No 28, URL: http://www.gosat.nies.go.jp/eng/newsletter/newsletter28e.pdf
46) "On the public release of carbon dioxide flux estimates based on the observational data by the Greenhouse gases Observing SATellite "IBUKI" (GOSAT)," JAXA, Dec. 5, 2012, URL: http://www.jaxa.jp/press/2012/12/20121205_ibuki_e.html
47) http://www.gosat.nies.go.jp/index_e.html
48) Midori Sasaki, "Japanese Satellite Challenge to the Global issues - Update of the GOSAT project," 5th session of COPUOS (Committee on the Peaceful Uses of Outer Space), UNOOSA, Vienna, Austria, June 6-15, 2012, URL: http://www.oosa.unvienna.org/pdf/pres/copuos2012/tech-05.pdf
49) K. Shiomi, H. Suto, A. Kuze, S. Kawakami, S. Fukagawa, M. Nakajima, Y. Mitomi, R. Higuchi, N. Sekio, F. Kataoka, T. Hashiguchi, K. Kowata, "GOSAT on-orbit calibration over 3 years," Proceedings of the 8th International Workshop on Greenhouse Gas Measurements from Space (IWGGMS), Pasadena, CA, USA, June 18-20, 2012, URL: https://docs.google.com/file/d/0B-MSd
NUpXGayVjR0WlB3Q2tUVlk/edit?pli=1
50) David Crisp and the ACOS/OCO-2 Science Team, "Retrievals of XCO2 from GOSAT TANSO-FTS Spectra by the ACOS/OCO-2 Team: Progress and Plans," Proceedings of the 8th International Workshop on Greenhouse Gas Measurements from Space (IWGGMS), Pasadena, CA, USA, June 18-20, 2012, URL: https://docs.google.com/file/d/0B-
MSdNUpXGayYkRORFlXMUU3UDQ/edit?pli=1
51) "SHIZUKU and IBUKI Status," GSICS (Global Space-based Inter-Calibration System) Executive Panel Meeting, College Park, MD, USA, May 30-June 1, 2012, URL: https://web.archive.org/web/20171024133150/http://www.wmo.int/pages/prog/sat/meetings/documents/GSICS-EP-12_Doc_02-07_JAXA-GOSAT-GCOM-W1.pdf
52) "IBUKI captures the floodings in Thailand and Cambodia," NIES, Nov. 18, 2011, URL: http://www.gosat.nies.go.jp/index_e.html
53) "On Estimating Global Monthly Carbon Dioxide Fluxes by Region, utilizing the observational data obtained by the Greenhouse gases Observing SATellite 'IBUKI' (GOSAT)," JAXA, October 28, 2011, URL: http://www.jaxa.jp/press/2011/10/20111028_ibuki_e.html
54) Christian Frankenberg, Joshua B. Fisher, John Worden, Grayson Badgley, Sassan S. Saatchi, Jung‐Eun Lee, Geoffrey C. Toon, André Butz, Martin Jung, Akihiko Kuze, Tatsuya Yokota, "New global observations of the terrestrial carbon cycle from GOSAT: Patterns of plant fluorescence with gross primary productivity," Geophysical Research Letters, Vol. 38, L17706, doi:10.1029/2011GL048738, 2011
55) Akihiko Kuze, Hiroshi Suto, Kei Shiomi, Masakatsu Nakajima, "GOSAT TANSO Calibration and Characterization of 2 Years on Orbit Operation," Proceedings of the 28th ISTS (International Symposium on Space Technology and Science), Okinawa, Japan, June 5-12, 2011, paper: 2011-n-29
56) Hiroshi Suto, Akihiko Kuze, Kei Shiomi, Masakatsu Nakajima, "On-orbit Status of TANSO-FTS on GOSAT," Proceedings of the SPIE Remote Sensing Conference, Toulouse, France, Vol. 7826, Sept. 20-23, 2010
57) Kei Shiomi, Masakatsu Nakajima, Akihiko Kuze, Toshiaki Takeshima, Shuji Kawakam, Hiroshi Suto, "One-Year Operation of TANSO-FTS on GOSAT and Follow-on Mission Feasibility," ICSO 2010 (International Conference on Space Optics), Rhodes Island, Greece, Oct. 4-8, 2010, URL: http://congrex.nl/ICSO/Papers/Session%208b/FCXNL-10A02
-1987894-1-SHIOMI_ICSO_PAPER.pdf
58) "IBUKI to provide analysis results of observation data (CO2 and methane concentration)," Feb. 16, 2010, URL: http://www.jaxa.jp/projects/sat/gosat/topics_e.html
59) "Public Release of Observation Data (Radiance Spectrum and Images) from "IBUKI" Greenhouse gases Observing SATellite (GOSAT)," October 30, 2009, URL: http://www.jaxa.jp/press/2009/10/20091030_ibuki_e.html
60) Takashi Hamazaki, "Greenhouse Gases Observing Satellite (GOSAT) and its initial calibration and validation results," Proceedings of the 60th IAC (International Astronautical Congress), Daejeon, Korea, Oct. 12-16, 2009, IAC-09.B1.2.9
61) "Initial Analysis of Observation Data (Greenhouse Gas Concentrations) from "IBUKI" Greenhouse gases Observing SATellite (GOSAT)," May 28, 2009, JAXA, URL: http://www.jaxa.jp/press/2009/05/20090528_ibuki_e.html
62) Initial Analysis of Observation Data (Greenhouse Gas Concentrations) from "IBUKI" Greenhouse gases Observing SATellite (GOSAT)," May 28, 2009, URL: http://www.jaxa.jp/press/2009/05/20090528_ibuki_e.html#at1
63) Takashi Hamazaki, Masakatsu Nakajima, Akihiko Kuze, Hiroshi Suto, Shuji Kawakami, Kei Shiomi, Haruhisa Shimoda, "Initial in-flight results of TANSO-FTS on GOSAT," ASSFTS14 (International Workshop on Atmospheric Science from Space using Fourier Transform Spectrometry), CNR, Florence, Italy, May 6-8, 2009, URL: https://web.archive.org/web/20171102094443/http://assfts14.ifac.cnr.it/index.php/assfts14/assfts14/paper/viewFile/8/34
64) IBUKI (GOSAT) "First Light", JAXA, Feb. 10, 2009, URL: http://www.eorc.jaxa.jp/en/imgdata/topics/2009/tp090210.html
65) "Greenhouse Gases Observing Satellite "IBUKI" (GOSAT) "First Light" Acquired by Onboard Sensors," Feb. 9, 2009, URL: http://www.jaxa.jp/press/2009/02/20090209_ibuki_e.html
66) http://www.abb.com/cawp/seitp202/3efdf790cda
92196c12570af0033e675.aspx
67) K. Kondo, A. Kuze, T. Hamazaki, "Sensor system for Greenhouse Gas Observing Satellite (GOSAT)," Proceedings of SPIE's 49th Annual Meeting `Optical Science and Technology, Infrared Spaceborne Remote Sensing,' Vol. 5543, edited by Marija Strojnik, Denver CO, USA, Aug. 2-3, 2004
68) T. Hamazaki, Y. Kaneko, A. Kuze, K. Kondo, "Fourier transform spectrometer for Greenhouse Gases Observing Satellite (GOSAT)," Proceedings of SPIE, Vol. 5659 , `Enabling Sensor and Platform Technologies for Spaceborne Remote Sensing,' G. J. Komar, J. Wang, T. Kimura, Editors, Jan. 2005, pp. 73-80, Conference location: Honolulu, HI, USA, Nov. 9, 2004
69) A. Kuze, "GOSAT FTS Design and BBM Test Results," 12th ASSFTS (Atmospheric Science from Space using Fourier Transform Spectrometry) Workshop, May 18-20, 2005, Quebec City, Canada, URL: https://web.archive.org/web/20120824020712/http://bernath.uwaterloo.ca:80/ASSFTS/Media/ASSFTS%20Presentations/pdfPres/Kuze.pdf
70) H. Suto, A. Kuze, Y. Kaneko, T. Hamazaki, "Characterization of TANSO-FTS on GOSAT," American Geophysical Union (AGU), Fall Meeting 2006, San Francisco, CA, USA, Dec. 11-15, 2006
71) A. Kuze, T. Urabe, H. Suto, Y. Kaneko, T. Hamazaki, "The instrumentation and the BBM test results of Thermal And Near infrared Sensor for carbon Observation (TANSO) on GOSAT," Proceedings of SPIE Optics Photonics Conference, Vol. 6297, `Infrared Spaceborne Remote Sensing 2006,' edited by Marija Strojnik, San Diego, CA, USA, Aug. 13-17, 2006
72) F. Chateauneuf, M.-A. Soucy, G. Perron, L. Levesque, J. Tanii, "Reliability enhancement activities for the TANSO interferometer," Proceedings of SPIE Optics Photonics Conference, Vol. 6297, `Infrared Spaceborne Remote Sensing 2006,' edited by Marija Strojnik, San Diego, CA, USA, Aug. 13-17, 2006, doi: 10.1117/12.680062
73) T. Hamazaki, Y. Kaneko, A. Kuze, H. Suto, "Greenhouse Gases Observation from Space with TANSO-FTS on GOSAT," OSA Hyperspectral Imaging and Sounding of the Environment (HISE) Topical Meeting and Tabletop Exhibit, Feb. 15-17,2007, Santa Fe, NM, USA
74) Juro Ishida, Masakatsu Nakajima, "TANSO Proto Flight Test Results," Proceedings of the 26th ISTS (International Symposium on Space Technology and Science) , Hamamatsu City, Japan, June 1-8, 2008 , 2008-o-4-04v
75) Henry Buijs, "History of Fourier Transform Spectrometer Technology Development," Proceedings of the 26th ISTS (International Symposium on Space Technology and Science) , Hamamatsu City, Japan, June 1-8, 2008, 2008-o-4-06v
76) Masakatsu Nakajima, Takashi Hamazaki, "Thermal and Near Infrared Sensor for Carbon Observation (TANSO-FTS)," Proceedings of the 26th ISTS (International Symposium on Space Technology and Science) , Hamamatsu City, Japan, June 1-8, 2008, paper: 2008-o-4-02v
77) Takashi Hamazaki, "Greenhouse Gases Observations from Space - Overview of TANSO on GOSAT," Proceedings of the 7th ICSO (International Conference on Space Optics) 2008, Toulouse, France, Oct. 14-17, 2008
78) K. Shiomi, S. Kawakami, T. Kina, M. Yoshida, N. Sekio, Y. Mitomi, F. Kataoka, "GOSAT Calibration Plan," URL: http://envisat.esa.int/envisatsymposium/proceedings
/posters/3P5/462261sh.pdf
79) Kei Shiomi, Tomoko Kina, Shuji Kawakami, Toshiaki Takeshima, "Calibration of operational GOSAT Level 1 products," Proceedings of the SPIE Remote Sensing Conference, Toulouse, France, Vol. 7826, Sept. 20-23, 2010, 'Sensors, Systems, and Next-Generation Satellites XIV,' edited by Roland Meynart, Steven P. Neeck, Haruhisa Shimoda, doi: 10.1117/12.865459
80) K. Shiomi, H. Suto, S. Kawakami, A. Kuze, M. Nakajima, "TANSO On-Orbit and Vicarious Calibration Plan," Proceedings of the 26th ISTS (International Symposium on Space Technology and Science) , Hamamatsu City, Japan, June 1-8, 2008 , paper: 2008-o-4-08v
81) David Crisp and the OCO Team, "Opportunities for Coordinated Observations of CO2 with the Orbiting Carbon Observatory (OCO) and Greenhouse Gases Observing Satellite (GOSAT)," Proceedings of the 26th ISTS (International Symposium on Space Technology and Science) , Hamamatsu City, Japan, June 1-8, 2008, paper: 2008-o-4-09v
The information compiled and edited in this article was provided by Herbert J. Kramer from his documentation of: "Observation of the Earth and Its Environment: Survey of Missions and Sensors" (Springer Verlag) as well as many other sources after the publication of the 4th edition in 2002. - Comments and corrections to this article are always welcome for further updates (eoportal@symbios.space).
Spacecraft Launch Mission Status Sensor Complement References Back to top