GHGSat-D (Greenhouse Gas Satellite - Demonstrator) / Claire
EO
Atmosphere
Cloud type, amount and cloud top temperature
Cloud imagery
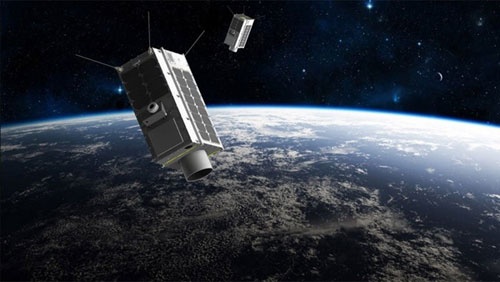
Launched from India in June 2016 as a secondary payload to the Indian Space Research Organisation‘s (ISRO’s) CartoSat-2C spacecraft, GHGSat-D (Greenhouse Gas Satellite-Demonstrator) is a commercial microsatellite of GHGSat Incorporation of Montreal, Canada. GHGSat-D (nicknamed Claire) offers commercial satellite imagery as a global reference for remote sensing greenhouse gas (GHG) and air quality gas (AQG) emissions from industrial sites.
Quick facts
Overview
| Mission type | EO |
| Agency | GHGSat |
| Mission status | Operational (extended) |
| Launch date | 22 Jun 2016 |
| Measurement domain | Atmosphere |
| Measurement category | Cloud type, amount and cloud top temperature, Trace gases (excluding ozone) |
| Measurement detailed | Cloud imagery, CH4 Mole Fraction |
| Instruments | C&A (Demo), WAF-P (Demo) |
| Instrument type | Imaging multi-spectral radiometers (vis/IR), Atmospheric chemistry |
| CEOS EO Handbook | See GHGSat-D (Greenhouse Gas Satellite - Demonstrator) / Claire summary |
Summary
Mission Capabilities
GHGSat-D features the Imaging Spectrometer and Cloud and Aerosol (C&A) instruments. The primary instrument is the imaging spectrometer, a compact high-resolution imager that operates in the Short Wave Infrared Region (SWIR), with design based on a Fabry-Perot interferometer. The imaging spectrometer measures methane concentrations by collecting and spectrally decomposing solar backscattered radiation in the shortwave infrared and provides images of the ground target and spectroscopic information on target greenhouse gases.
The secondary sensor, C&A, consists of an ultraviolet (UV) filter, a commercial lens assembly and a micro-hyperspectral sensor to measure clouds and aerosols and enhance retrievals from the primary instrument.
Performance Specifications
The demonstrator satellite can measure greenhouse gas concentrations, specifically carbon dioxide (CO2) and methane (CH4). The primary instrument (Imaging Spectrometer) has a spatial resolution of less than 50 m per pixel, and a maximum swath width of 15 km, while the secondary instrument (C&A) has a spatial resolution of less than 150 m.
GHGSat-D undergoes a sun-synchronous orbit, at an altitude of 512 km and an inclination of 97.5°. The LTDN (Local Time on Descending Node) is 0930 hours with a pointing accuracy of approximately 0.4°.
Space and Hardware Components
GHGSat-D enables the Nanosatellite for Earth Monitoring and Observation-Aerosol Monitoring (NEMO-AM) bus designed by University of Toronto, Institute for Aerospace Studies/ Space Flight Laboratory (UTIAS/SFL). It is a low cost high performance bus that detects the aerosol content in the atmosphere with a ground resolution of up to 200 m.
GHGSat-D (Greenhouse Gas Satellite - Demonstrator) microsatellite mission / Claire
Spacecraft Launch Mission Status Sensor Complement Ground Segment References
GHGSat is a commercial venture of GHGSat Inc. of Montreal, Canada, a subsidiary of Xiphos Systems Corporation. GHGSat’s mission is to become the global reference for remote sensing of greenhouse gas (GHG) and air quality gas (AQG) emissions from industrial sites, using satellite technology. GHGSat will offer products (commercial satellite imagery) and value-added emissions monitoring services based on its satellite data. The mission is financed by Sustainable Development Technology Canada, The Boeing Company, and by a number of customers and vendors. 1) 2) 3)
Background: In the summer of 2011, Quebec and California announced that they would implement a market-based “cap and trade” system to attribute a value to each ton of carbon emitted by industrial operators. Industrial operators would therefore be motivated to better measure their emissions, so that they could control and ultimately reduce them. 4)
This announcement inspired GHGSat’s founders. They understood that where there was a value to a ton of carbon, industrial operators and their government regulators would need precise measurements of emissions from industrial facilities, at attractive prices. GHGSat’s parent company had already been working closely with a partner company through the 2000’s for the Canadian Space Agency to develop key technologies to make such measurements from a satellite. They therefore began customer interviews, technical evaluations and financial analyses to determine whether they could profitably offer a solution.
They discovered an existing multi-billion-dollar market for carbon emissions, growing steadily as ever more jurisdictions imposed taxes or implemented carbon trading mechanisms, being served by a vast array of measurement products and services. They believed that their spectrometer technology could disrupt this large and growing market by offering a single solution with better precision and lower cost than alternatives, across a wide range of industries, anywhere in the world.
Within 3 months of the announcement, they secured two blue-chip customers, developed a preliminary technical solution, recruited a core set of vendors, and developed a business plan. GHGSat was incorporated in December 2011, secured initial financing through 2012, and began development in the spring of 2013.
R&D progress: In just over two years from spring of 2013 to summer of 2015, GHGSat followed an accelerated development process to design, manufacture, integrate, assemble and test its first satellite system, designated “GHGSat-D” and later named “Claire”.
• The underlying science leveraged similar satellite measurements pioneered by NASA, ESA (European Space Agency), and JAXA (Japanese Aerospace Exploration Agency) over 30 years.
• The primary instrument was designed to provide similar precision, but with 100 x better spatial resolution than the current state-of-the-art in order to measure emissions from targeted sites. Expert external reviewers were recruited to evaluate the design, and to support development.
• In order to meet a reasonable budget and to reduce risk, the primary instrument was designed to fit in a nanosatellite with proven space heritage. This resulted in a total satellite cost on order of 1% of that for other greenhouse gas measurement missions.
• The system was built and tested at component, sub-system, and integrated levels. External references were used where possible to verify performance.
• The system was awarded a US patent in January 2016, and a filing for the same was made under the Patent Cooperation Treaty in May 2015.
GHGSat-D Team: GHGSat recruited a core set of vendors for its first satellite:
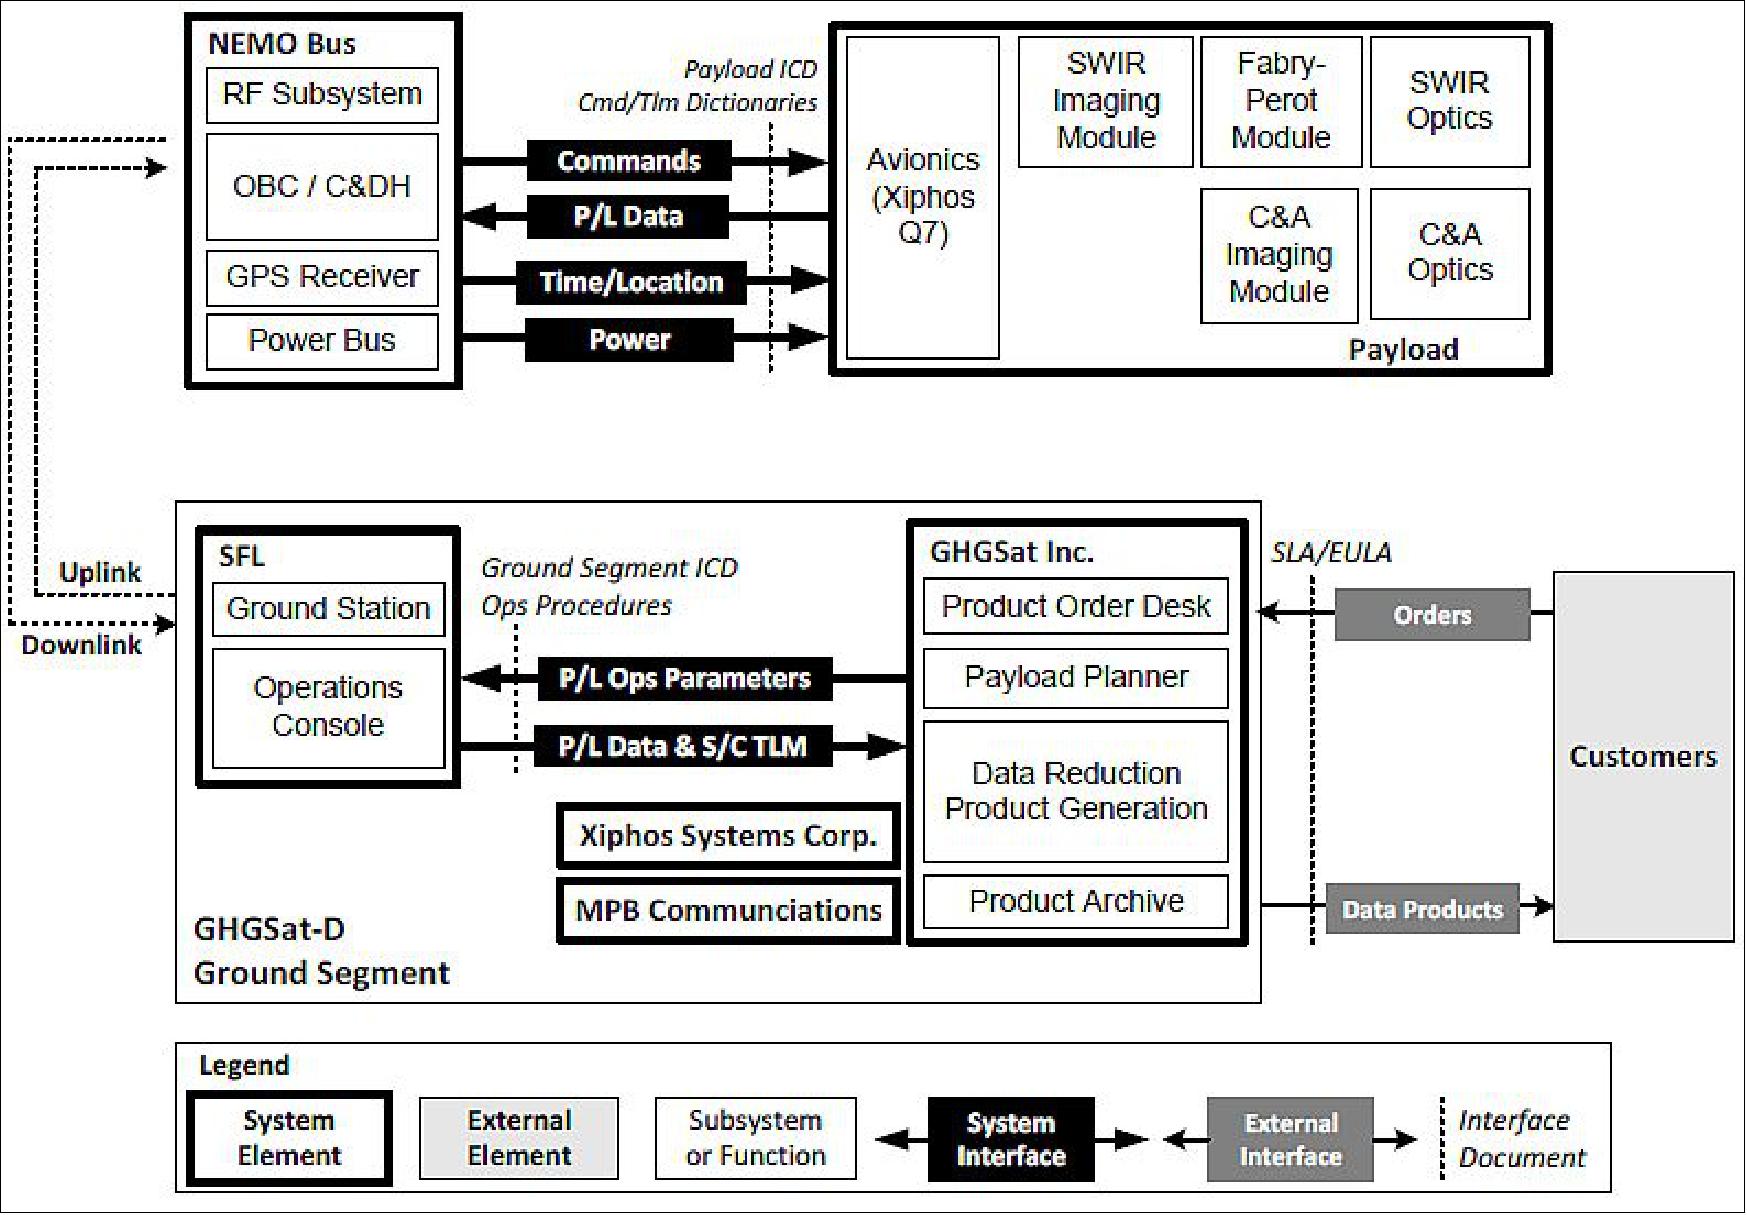
• Xiphos Systems Corporation provided the complete processing infrastructure for GHGSat algorithms, include both the payload processor (using Xiphos’ Q7 hybrid processor) and the post-processing chain on the ground.
• MPB Communications Inc. provided the payload, including both the primary (short-wave infrared, or SWIR) and secondary (visible-near infrared, or VNIR) payload.
• UTIAS/SFL (University of Toronto Institute for Aerospace Studies/ Space Flight Laboratory) provided the satellite bus, based on its NEMO-class bus, as well as launch and operations services for GHGSat-D.
• James Sloan, Professor Emeritus from the University of Waterloo, provided expert support to GHGSat as GHGSat-D’s mission scientist.
This core group of vendors was supported by a number of additional partners and subcontractors.
Spacecraft
The satellite is a next generation greenhouse gas monitoring satellite. The satellite will demonstrate an advanced miniature hyperspectral SWIR imaging spectrometer for monitoring targeted greenhouse gas emitters such as area fugitive sources (tailing ponds and landfills) and stacks (emissions such as flaring and venting). A secondary instrument will measure clouds and aerosols in order to enhance retrievals from the primary instrument. The 15 kg satellite will be a precursor to a commercial constellation of greenhouse gas monitoring satellites as part of a service provided by GHGSat Inc.
Parameter | Demonstrator Satellite | Comments |
Species observed | Carbon dioxide (CO2), Methane (CH4) | Operational satellites will also target SOx, NOx, Other |
Measurement precision | Target 1% of background | Approximately 4 ppm CO2, 18 ppb CH4 |
FOV (Field of View) | Approx. 12 km x 12 km, >200,000 pixels | Programmable; observation mode can be adapted on orbit |
Spatial resolution | < 50 m per pixel | Variable binning possible within field of view (e.g. background, plume, hotspots, etc.) |
Detection threshold | Can detect modest leaks from individual wells | Several factors influence threshold, incl. species, wind, aerosols, albedo, etc. |
GHGSat’s novel technology will enable GHG and AQG measurement with better accuracy at a fraction of the cost of comparable alternatives. Owners of industrial facilities will be able to monitor all of their facilities, local or remote, anywhere in the world, with a common technology, in near-real-time. Significantly improved emissions information will enable industries to better measure, control, and ultimately reduce emissions of GHGs and AQGs.
Industrial facilities worldwide are increasingly subject to emissions caps, both for greenhouse gases and atmospheric pollutants. GHGSat will provide a satellite-based remote sensing solution, designed to monitor individual industrial facilities in regulated industries including oilsands, power generation and waste management. The ability to precisely and repeatedly measure total emissions from a point source (such as a stack), or area source (such as a tailings pond or hydro reservoir) will enable accuracies comparable to continuous monitoring solutions at a cost comparable to indirect estimation processes.
Mission Requirements
GHGSat-D is designed to meet the following key requirements:
1) Technical:
• Target any site in the world between 60° South and 80° North
• Quantify the carbon dioxide total atmospheric columns above target sites
• Generate images of target sites, for geolocation purposes
• Quantify greenhouse gas columns at a ground sample distance of 50 m or less
• Quantify GHG columns in a field of view of at least 12 km x 12 km at altitude of 500 km
2) Operational:
• Operate for minimum of one year on orbit
• Be capable of observing at least 1,000 target sites or more per year with GHGSat-D alone
• Verify GHGSat data products by comparison with other available ground- and space-based measurements
• Support various satellite tasking priorities.
3) Quality:
• Produce a data product containing spatially resolved mixing ratio of carbon dioxide within the field of view. The target precision will be 1% of the atmospheric background level.
• Produce a data product containing spatially resolved mixing ratio of methane within the field of view. The target precision will be 1% of the atmospheric background level.
• Produce emission rate estimates where single-site GHG emission rates as low as 50 kt CO2eq/yr are quantified. The detection threshold and emissions rate precision for specific sites will depend on gas species, local meteorological conditions, season, terrain and other variables.
• Determine the presence of clouds and aerosols in the full field of view of the payload.
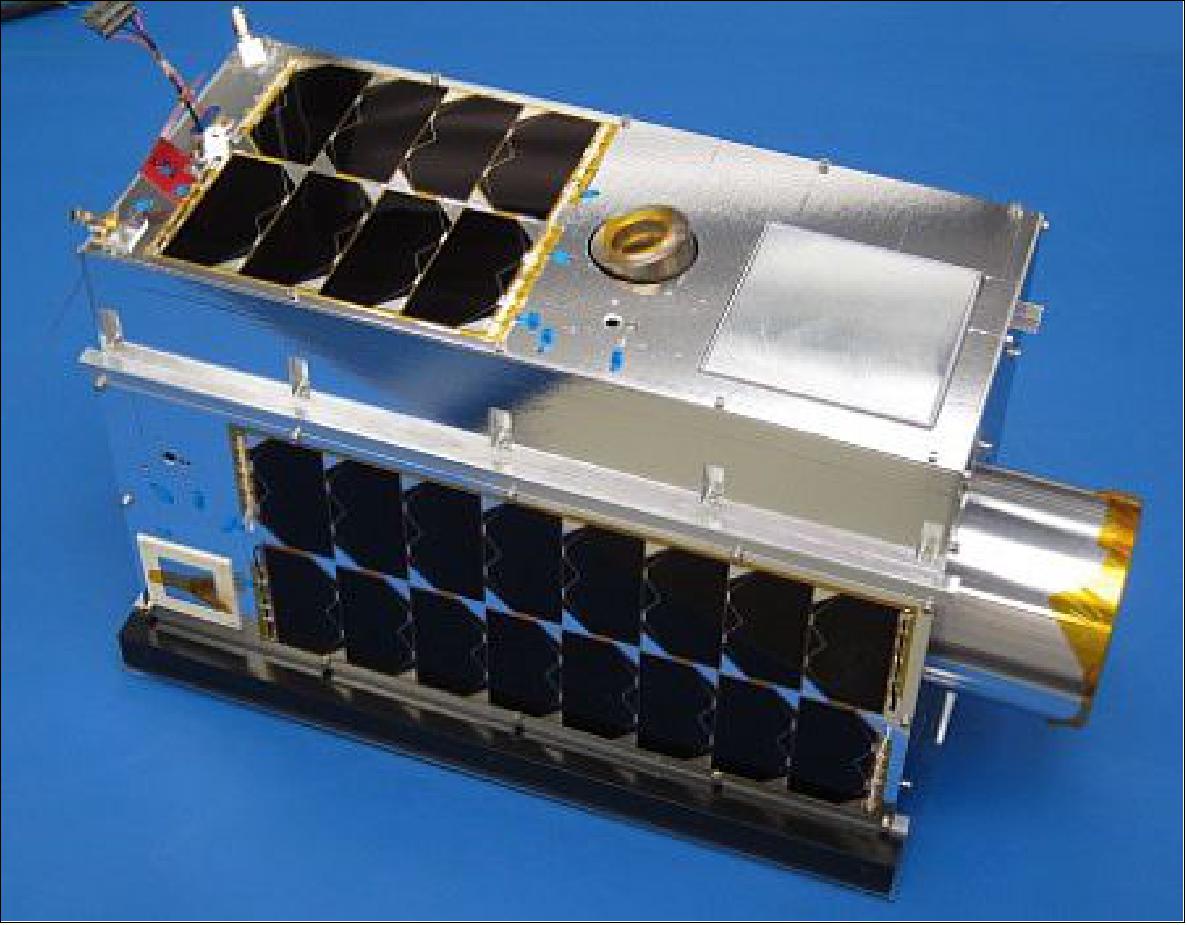
UTIAS/SFL (University of Toronto, Institute for Aerospace Studies/ Space Flight Laboratory) designed and built the GHGSat-D (aka “Claire”) microsatellite demonstrator for GHGSat Inc. GHGSat’s industrial team for the GHGSat-D satellite includes UTIAS/SFL (spacecraft), MPB Communications Inc. (payload) and Xiphos Systems Corporation (avionics and ground segment).
The low-cost and high-performance of SFL’s NEMO-AM bus is an enabler for this mission. GHGSat-D has a launch mass of 15 kg ( 9 kg of which are dedicated to the payload) and a volume of 20 x 30 x 42 cm. In addition, there is a mezzanine of size 7 x 18 x 42 cm on one side (-X).
Power generation is provided with body-mounted solar cells; three 26 W hr Li-Ion batteries deliver a nominal operating voltage of 12.3 V regulated to 5 and 3.3 V for distribution to the satellite subsystems. Reaction wheels and magnetic torque rods are employed for precise attitude control to ensure accurate pointing to observation targets. 6)
ADCS (Attitude and orbital Determination and Control Subsystem): The entire ADCS on GHGSat-D draws heritage from that found on SFL’s BRITE satellites, which in turn draw partial heritage from several other SFL missions. Attitude determination on GHGSat-D is achieved with a suite of onboard sensors. For coarse attitude determination, a set of five sun sensors plus a magnetometer provide a full three axis solution with flight heritage from four SFL spacecraft. For fine attitude determination, a star-tracker is mounted directly to the payload itself for optimum alignment stability over temperature. Fine and coarse attitude control on GHGSat-D is achieved using a set of three orthogonal reaction wheels. Detumbling and momentum dumping capabilities are provided by a set of three orthogonal vacuum core magnetorquers.
The reaction wheels used on GHGSat-D are provided by Sinclair Interplanetary and are a high-torque variant of the wheels on NEMO-AM. The additional torque provided by this variant of the wheel is expected to improve slew rates without having a significant impact on pointing performance.
Orbit determination on GHGSat-D is accomplished via a Novatel OEMV-1G GPS Receiver. This particular receiver and its associated antenna have over twelve years of flight heritage from SFL missions. To simplify operations, both the payload and the spacecraft will be connected to and can request position, velocity and time information from the GPS receiver.
The anticipated level of pointing accuracy is approximately 0.4º, corresponding to less than 30% of the instrument’s field of view. This will ensure that target sites will be located in the central portion of the images.
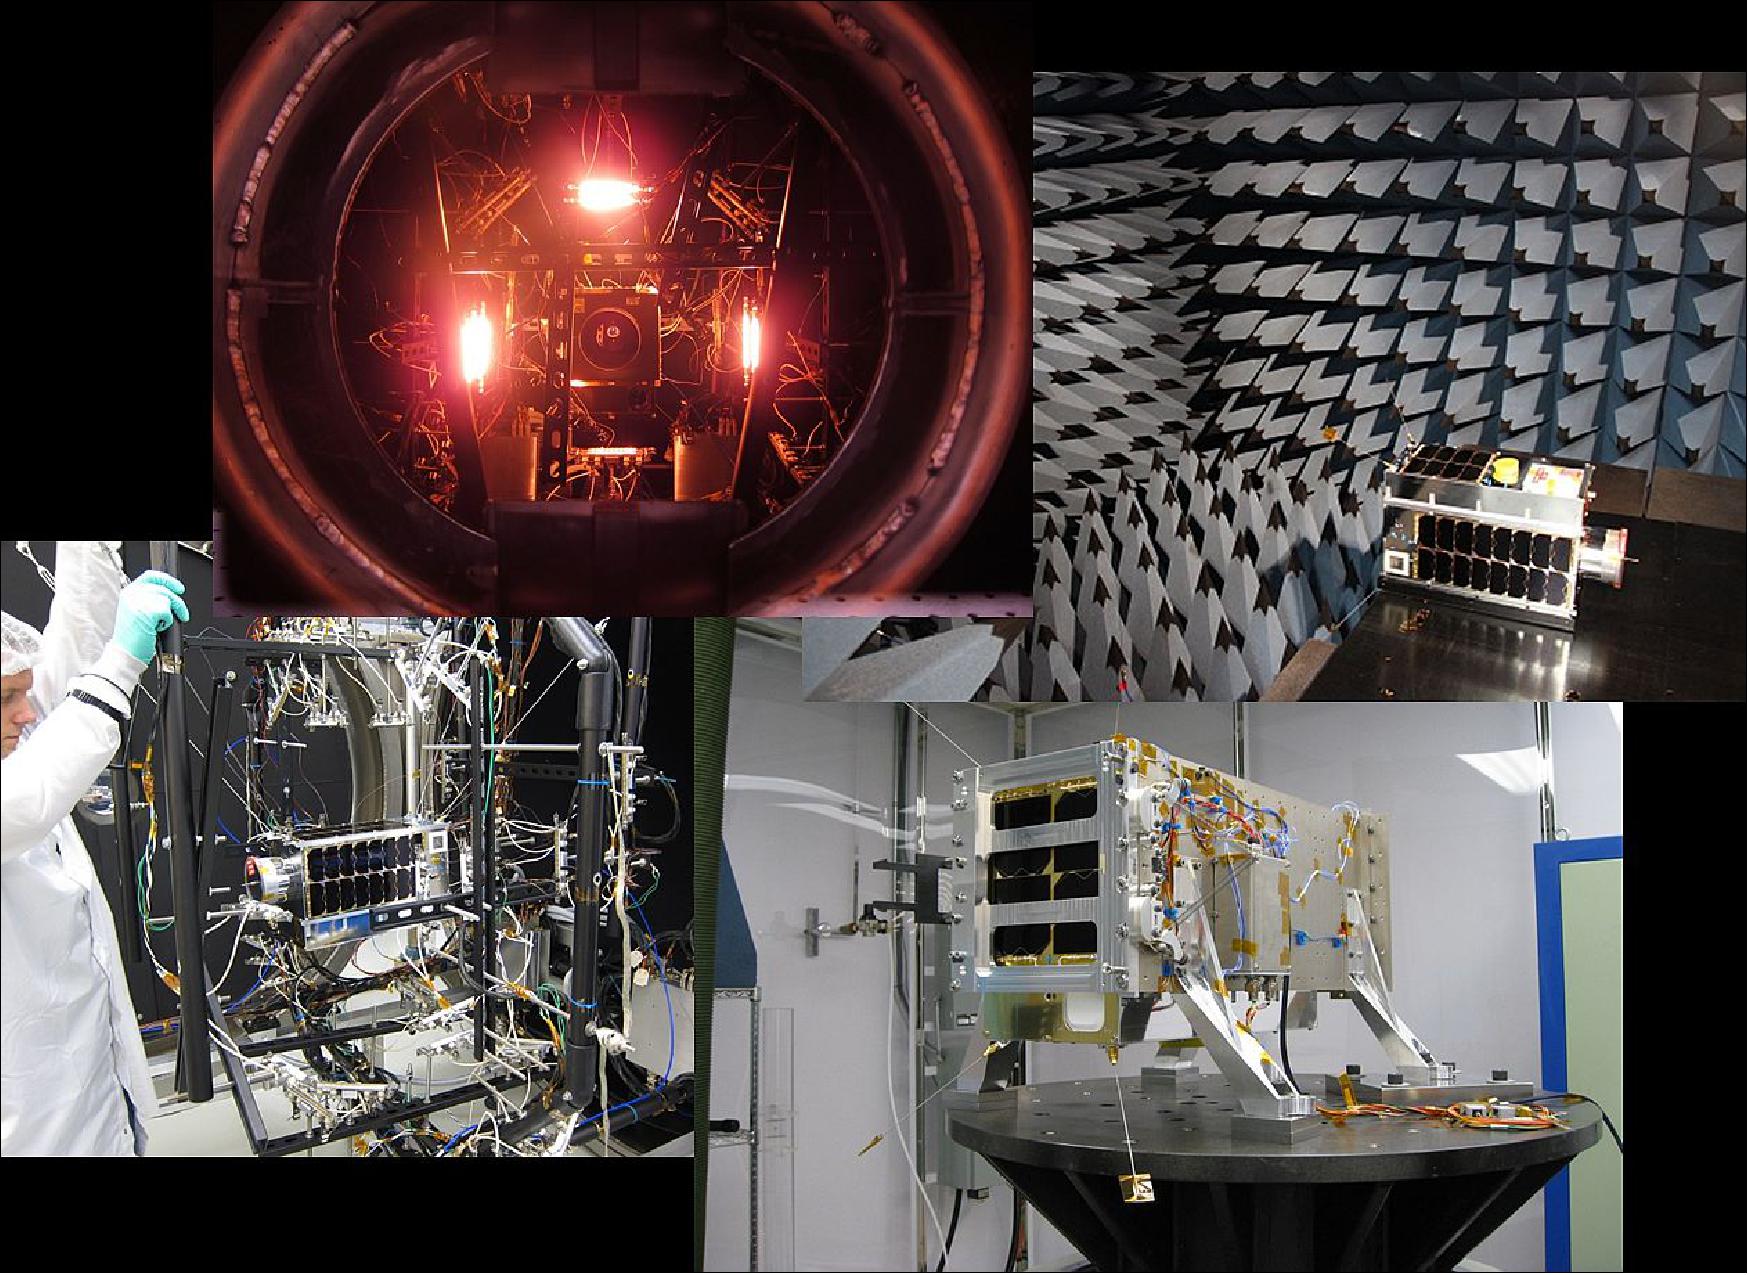
On Nov. 25, 2015, GHGSat announced it has successfully completed testing of its demonstration satellite, which will soon provide a new way to measure greenhouse gas emissions from industrial facilities anywhere in the world, enabling emissions reductions in a wide range of industries. “All systems go! This milestone is the culmination of two years of intense effort by a team of Canadian engineers and scientists,” said Stéphane Germain, President of GHGSat.
The final round of satellite testing included thermal vacuum tests to simulate the temperature cycling and vacuum environment typical of low Earth orbit, as well as vibration tests to simulate the loads that the satellite will experience during launch (Figure 3). System performance was validated using NASA satellite data, laboratory tests and end-to-end simulations. Satellite testing was performed at the component, subsystem and system levels. 7)
Launch: GHGSat was launched on June 22, 2016 (03:56 UTC) as a secondary payload to ISRO's CartoSat-2C spacecraft. The launch site was SDSC (Satish Dhawan Space Center) in India and the launch vehicle is PSLV-C34. 8)
In January 2015, GHGSat Inc. signed a launch contract with Antrix Corporation, the commercial arm of ISRO (Indian Space Research Organization). The launch was arranged through UTIAS/SFL. 9)
Orbit: Sun-synchronous circular orbit, altitude = 512 km, inclination = 97.5º, local time on descending node (LTDN) = 9:30 hours.
Secondary Payloads
The secondary payloads (19 satellites) on this flight were:
• SkySat-C1, an imaging minisatellite (120 kg) of Terra Bella of Mountain View, CA, USA.
• GHGSat, a microsatellite (15 kg) of GHGSat Inc., Montreal, Canada
• BIROS (Bi-spectral InfraRed Optical System), a minisatellite 130 kg) of DLR, Germany.
- BIROS carries onboard the picosatellite BEESAT-4 (Berlin Experimental and Educational Satellite-4) of TU Berlin(1U CubeSat, 1 kg) and release it through a spring mechanism [ejection by SPL (Single Picosatellite Launcher ) after the successful check-out and commissioning of all relevant BIROS subsystems]. After separation, it will perform experimental proximity maneuvers in formation with the picosatellite solely based on optical navigation.
• M3MSat (Maritime Monitoring and Messaging Microsatellite) of DRDC (Defence Research and Development Canada) and CSA (Canadian Space Agency).
• LAPAN-A3, a microsatellite (115 kg) of LAPAN (National Institute of Aeronautics and Space of Indonesia) Jakarta, Indonesia.
• SathyabamaSat, a 2U CubeSat of Sathyabama University (1.5 kg), India.
• Swayam, a 1U CubeSat of the College of Engineering (1 kg), Pune, India.
• 12 Flock 2p Earth observation satellites (3U CubeSats) of Planet Labs (each with a mass of 4.7 kg), San Francisco, CA.
Mission Status
• June 1, 2020: While carbon dioxide is more abundant in the atmosphere and therefore more commonly associated with global warming, methane is around 30 times more potent as a heat-trapping gas. Given its importance, Canadian company GHGSat have worked in collaboration with the Sentinel-5P team at SRON Netherlands Institute for Space Research to investigate hotspots of methane emissions during COVID-19. 10)
- Carbon dioxide is generally produced by the combustion of fossil fuels, while fossil fuel production is one of the largest sources of methane emissions. According to the World Meteorological Organization's State of the Global Climate report last year, current carbon dioxide and methane concentrations represent respectively 150% and 250% of pre-industrial levels, before 1750.
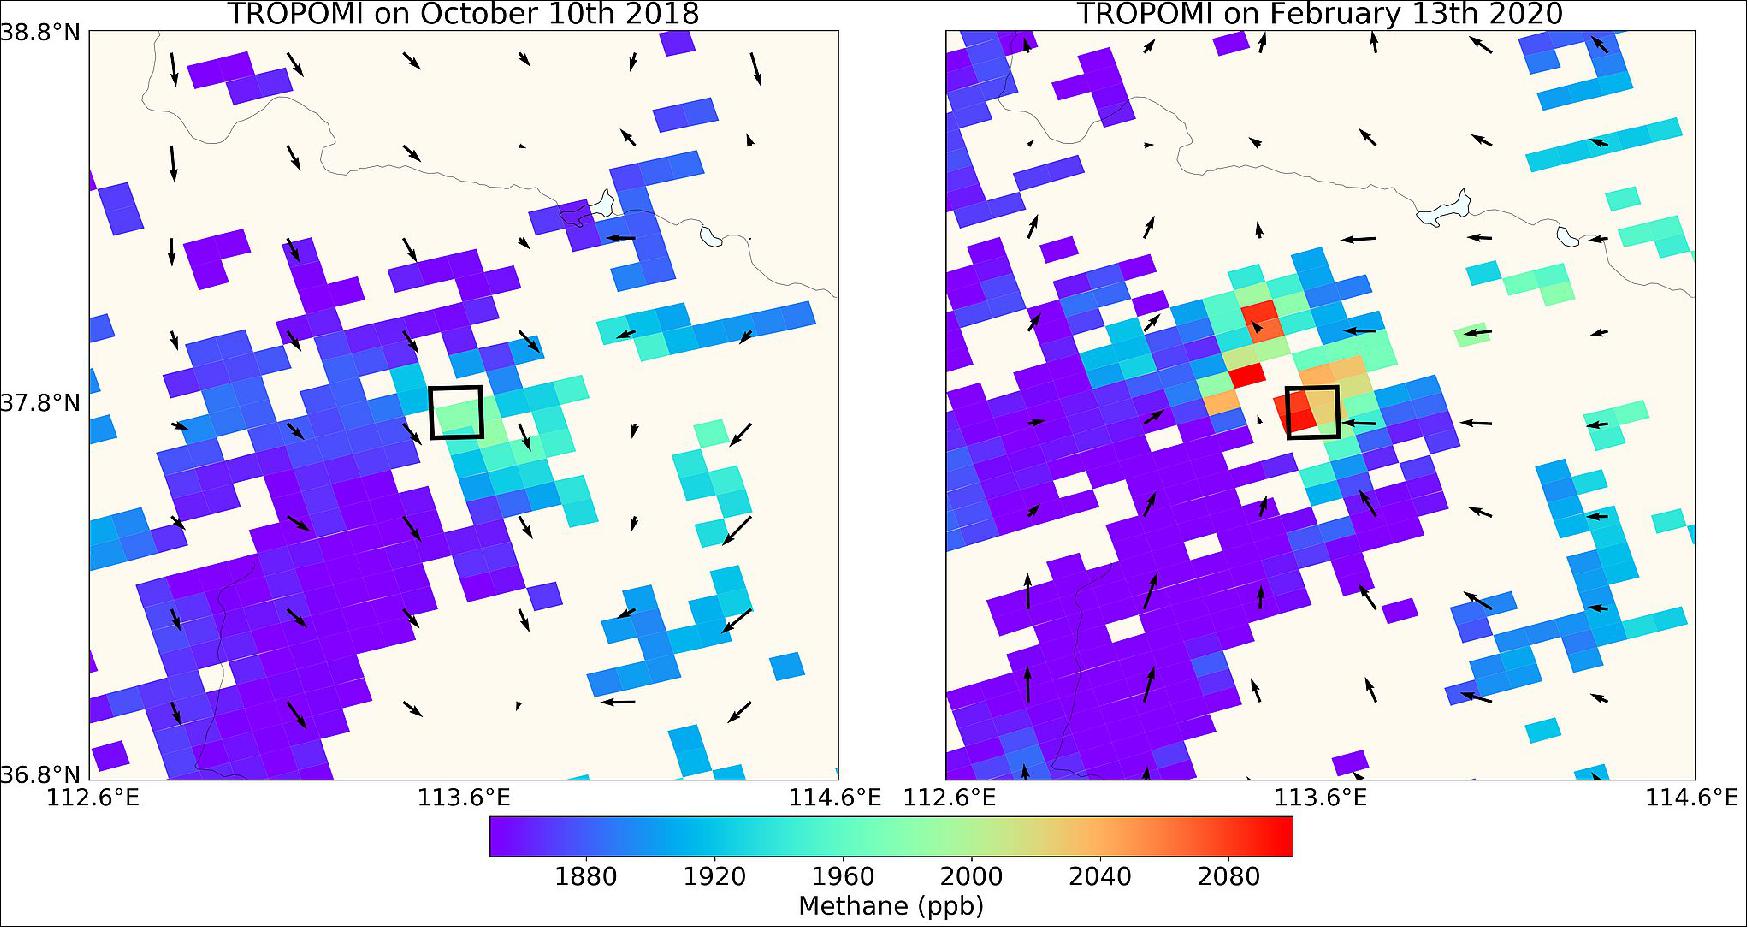
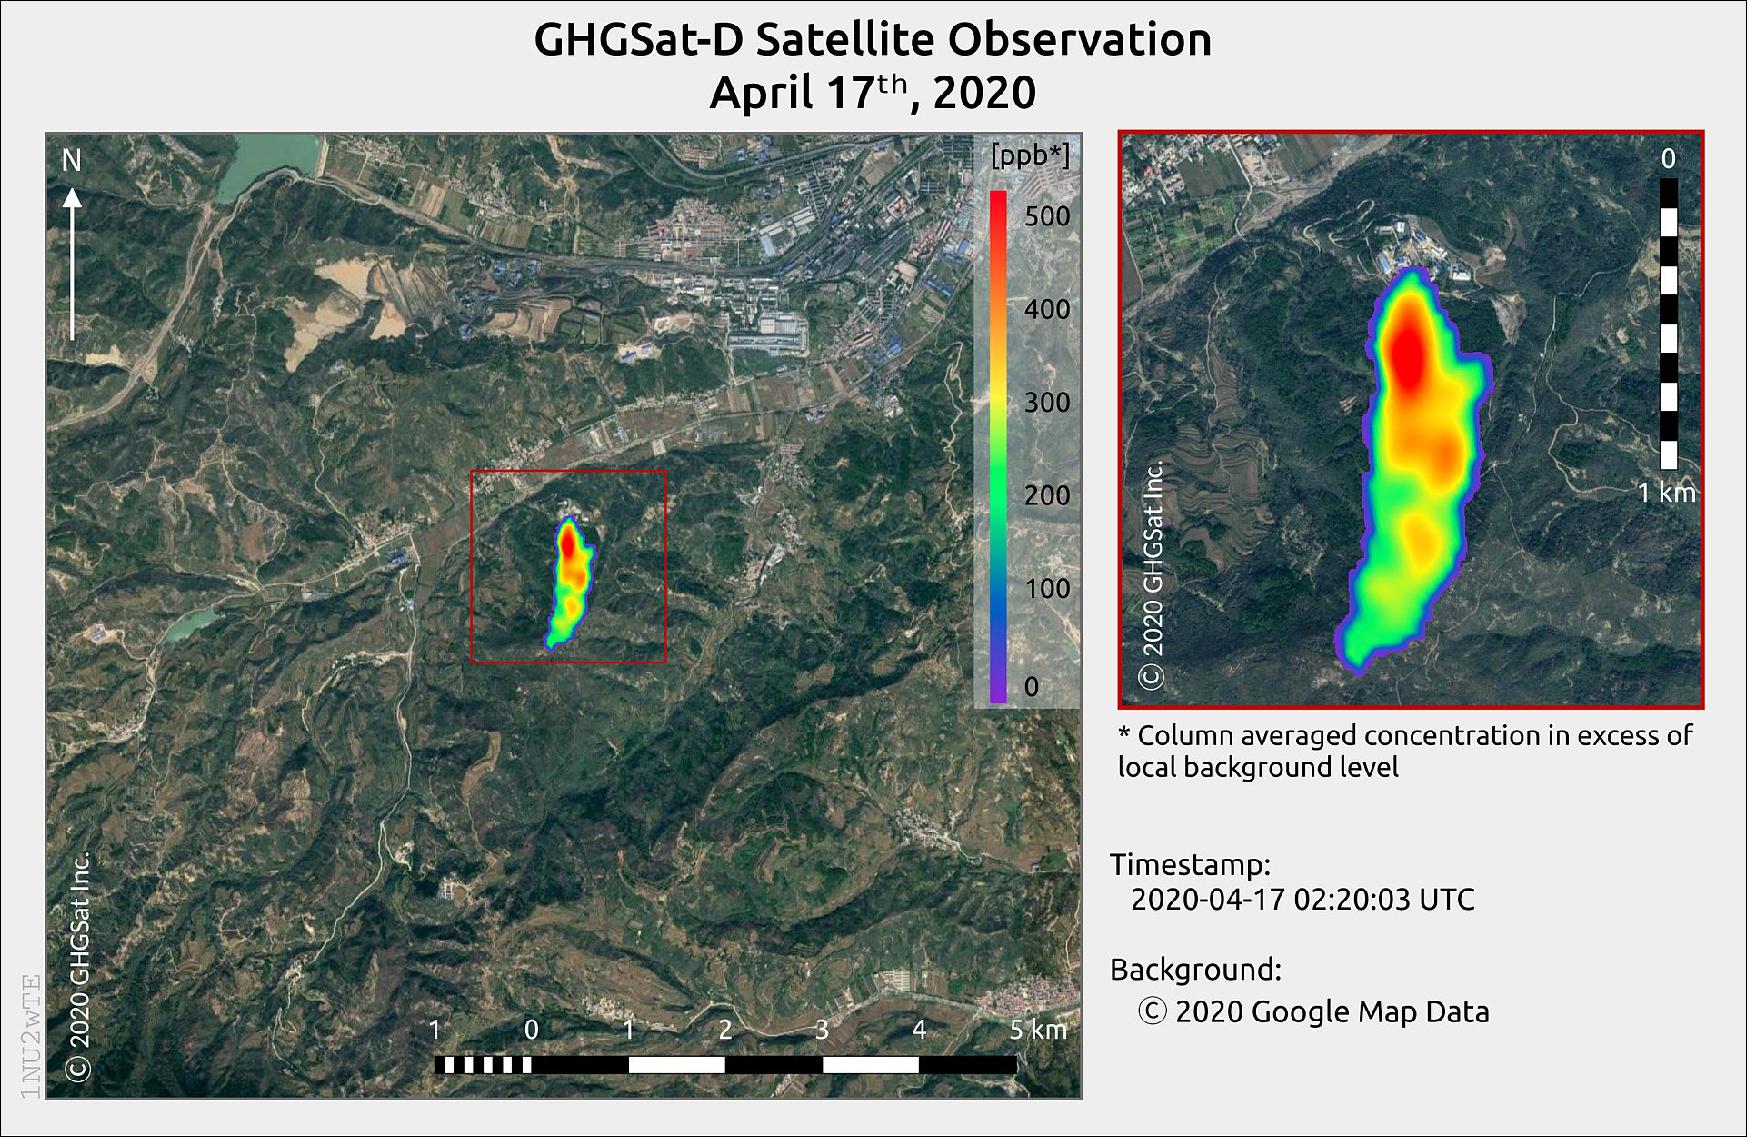
- Owing to the importance of monitoring methane, SRON’s and GHGSat’s research teams have been working since early-2019 to detect methane hotspots. The SRON team uses data from the Copernicus Sentinel-5P satellite to detect emissions on a global scale. The GHGSat team then utilizes data from GHGSat satellites to quantify and attribute the emissions to specific facilities around the world.
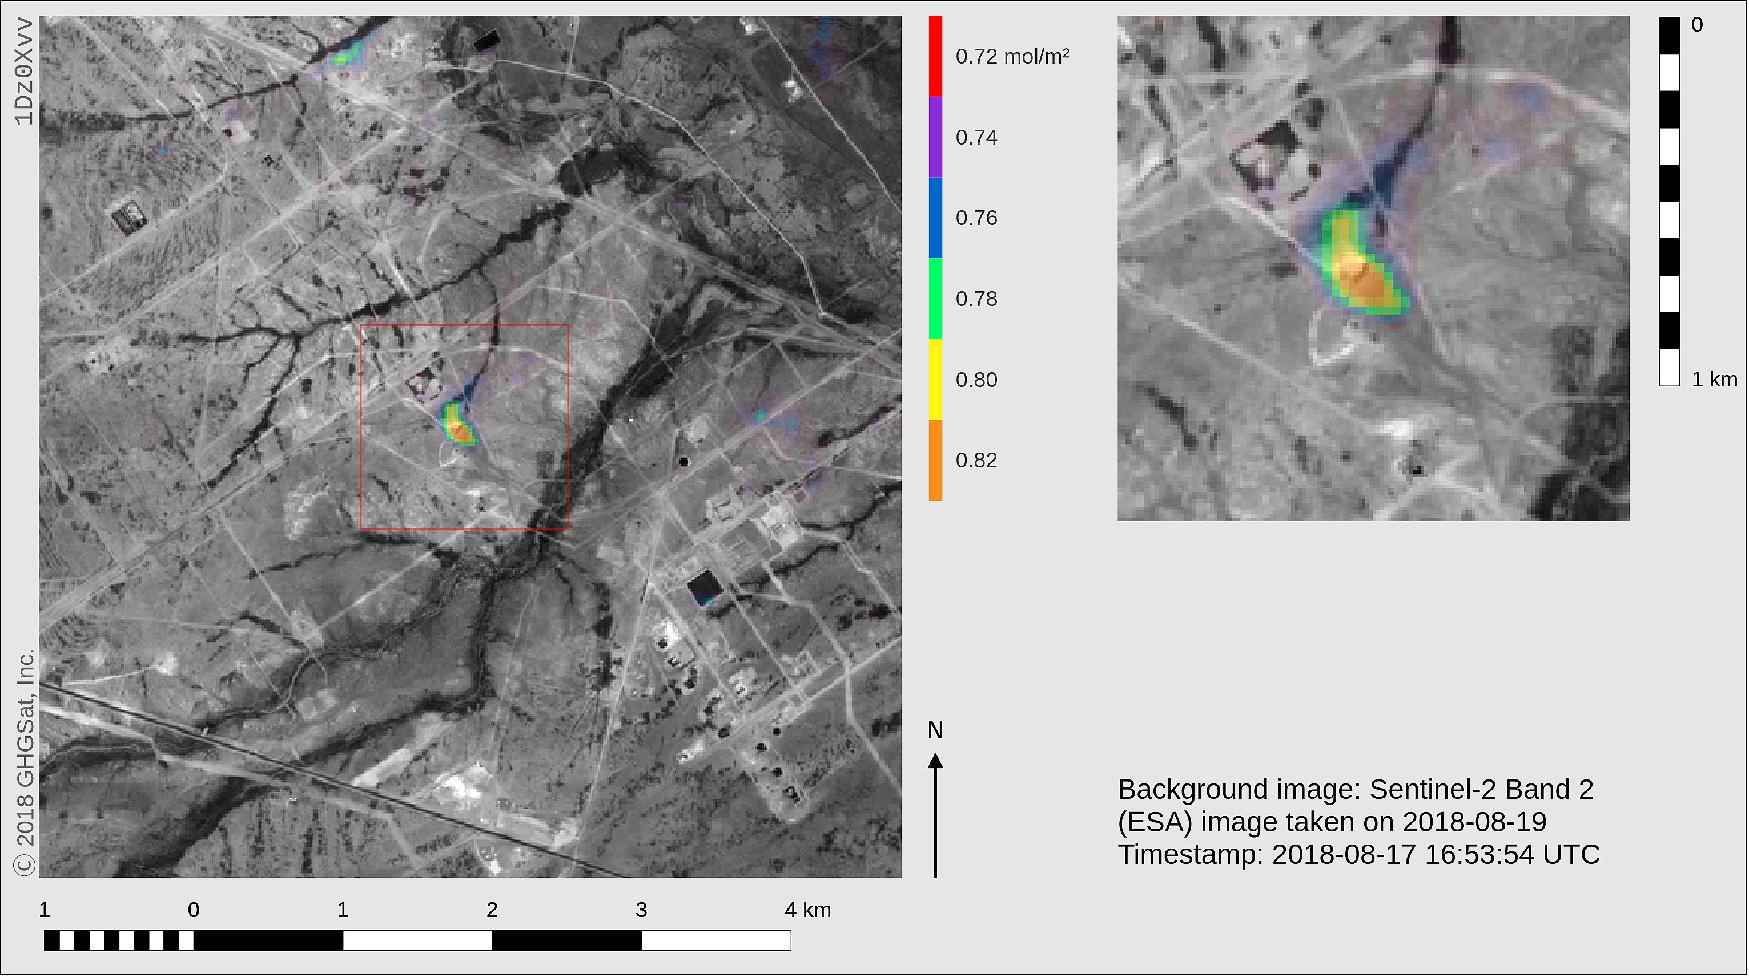
- Their work has led to several new hotspots being discovered in 2020, for instance over a coal mine in China. The team have also detected methane emissions over the Permian Basin – the largest oil-producing region in the United States. The team observed concentrations from March-April 2020, compared to the same period as last year in an effort to evaluate the impact of COVID-19 activities on methane emissions.
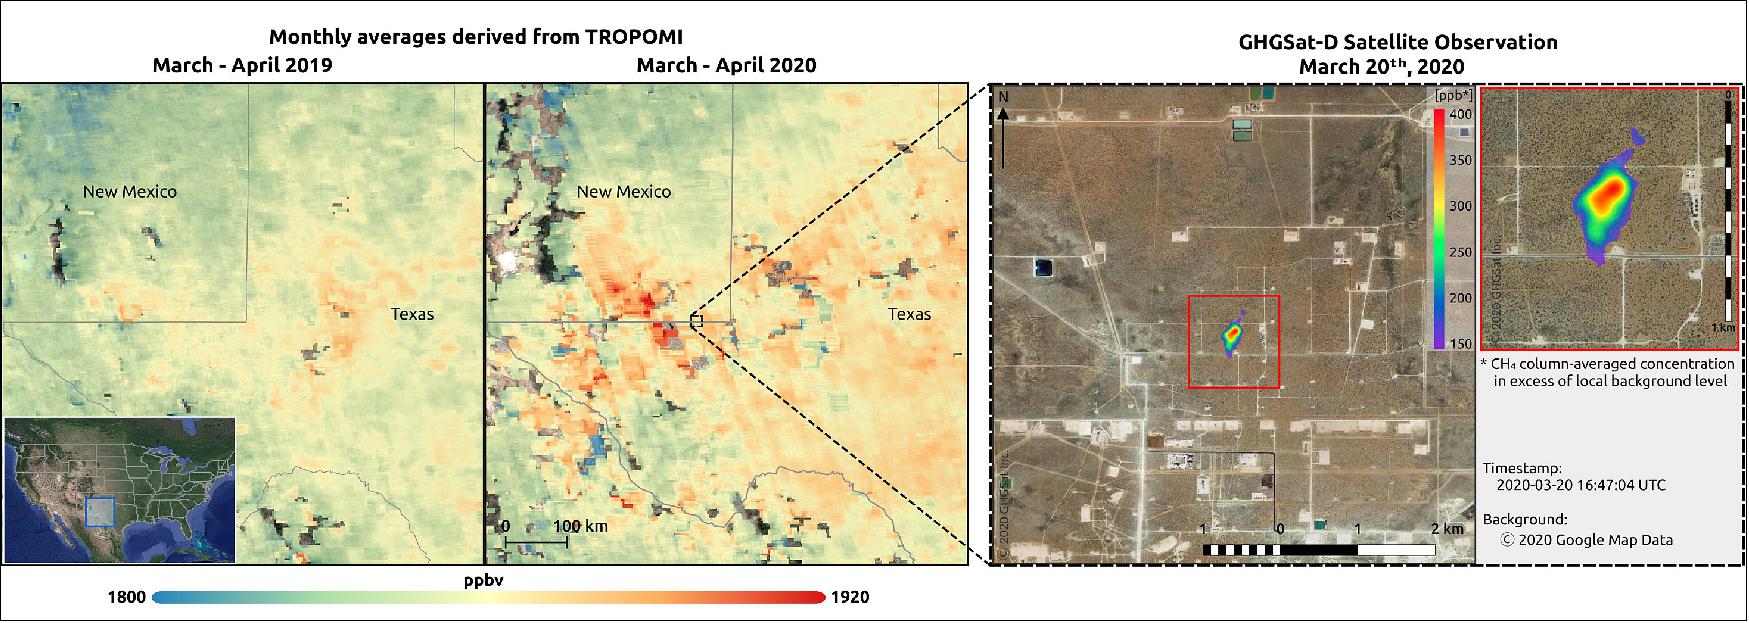
- An initial look at these data suggest a substantial increase in methane concentrations in 2020, compared to 2019. Claus Zehner, ESA’s Copernicus Sentinel-5P mission manager, says, “An explanation for this could be that as a result of less demand for gas because of COVID-19, it is burned and vented – leading to higher methane emissions over this area.”
- Ilse Aben, from SRON, comments, “However, these results are inconclusive when using only Sentinel-5P data in the Permian Basin as the number of observations are limited.”
- The spatial distribution of Sentinel-5P concentrations in 2020 and in 2019 both indicate local enhancements of methane concentrations in the Delaware and Midland portions of the basin. But higher-resolution measurements, such as those provided by GHGSat, are needed to attribute these enhancements to specific facilities.
- The joint analysis of GHGSat and Sentinel-5P regional methane data will continue to explore and quantify how COVID-19 is affecting emissions from the natural gas industry on a regional scale – all the way down to the level of industrial facilities.
- Stephane Germain, CEO of GHGSat, comments, “GHGSat continues to work closely with ESA and SRON’s Sentinel-5P science team. We are advancing the science of satellite measurements of atmospheric trace gases while simultaneously providing practical information to industrial operators to reduce facility-level emissions. GHGSat’s next satellites, scheduled to launch in June and December of this year, will help improve our collective understanding of industrial emissions around the world."
- Eric Laliberté, Director General Utilization from the Canadian Space Agency, says, “The Canadian Space Agency is committed to developing space technologies and supporting innovative missions to better understand and mitigate climate change. The results achieved by GHGSat are already having an impact and we are excited to continue working with GHGSat and ESA to better understand greenhouse gas emissions worldwide."
- Claus adds, “In order to further support the scientific uptake of GHGSat measurements, ESA has organized, together with the Canadian Space Agency and GHGSat, a dedicated Announcement of Opportunity Call that will provide around 5% of the measurement capacity of the upcoming commercial GHGSat-C1, also known as the Iris satellite, to the scientific community.”
- The Copernicus Sentinel-5P satellite, with its state-of-the-art instrument TROPOMI, can also map other pollutants such as nitrogen dioxide, carbon monoxide, sulphur dioxide and aerosols – all of which affect the air we breathe.
• March 26, 2020: GHGSat yesterday announced a deal it had signed with Bloomberg that has weekly methane emissions risk predictions data being used in Bloomberg’s Enterprise Access Point platform. 11)
Permian Basin Data
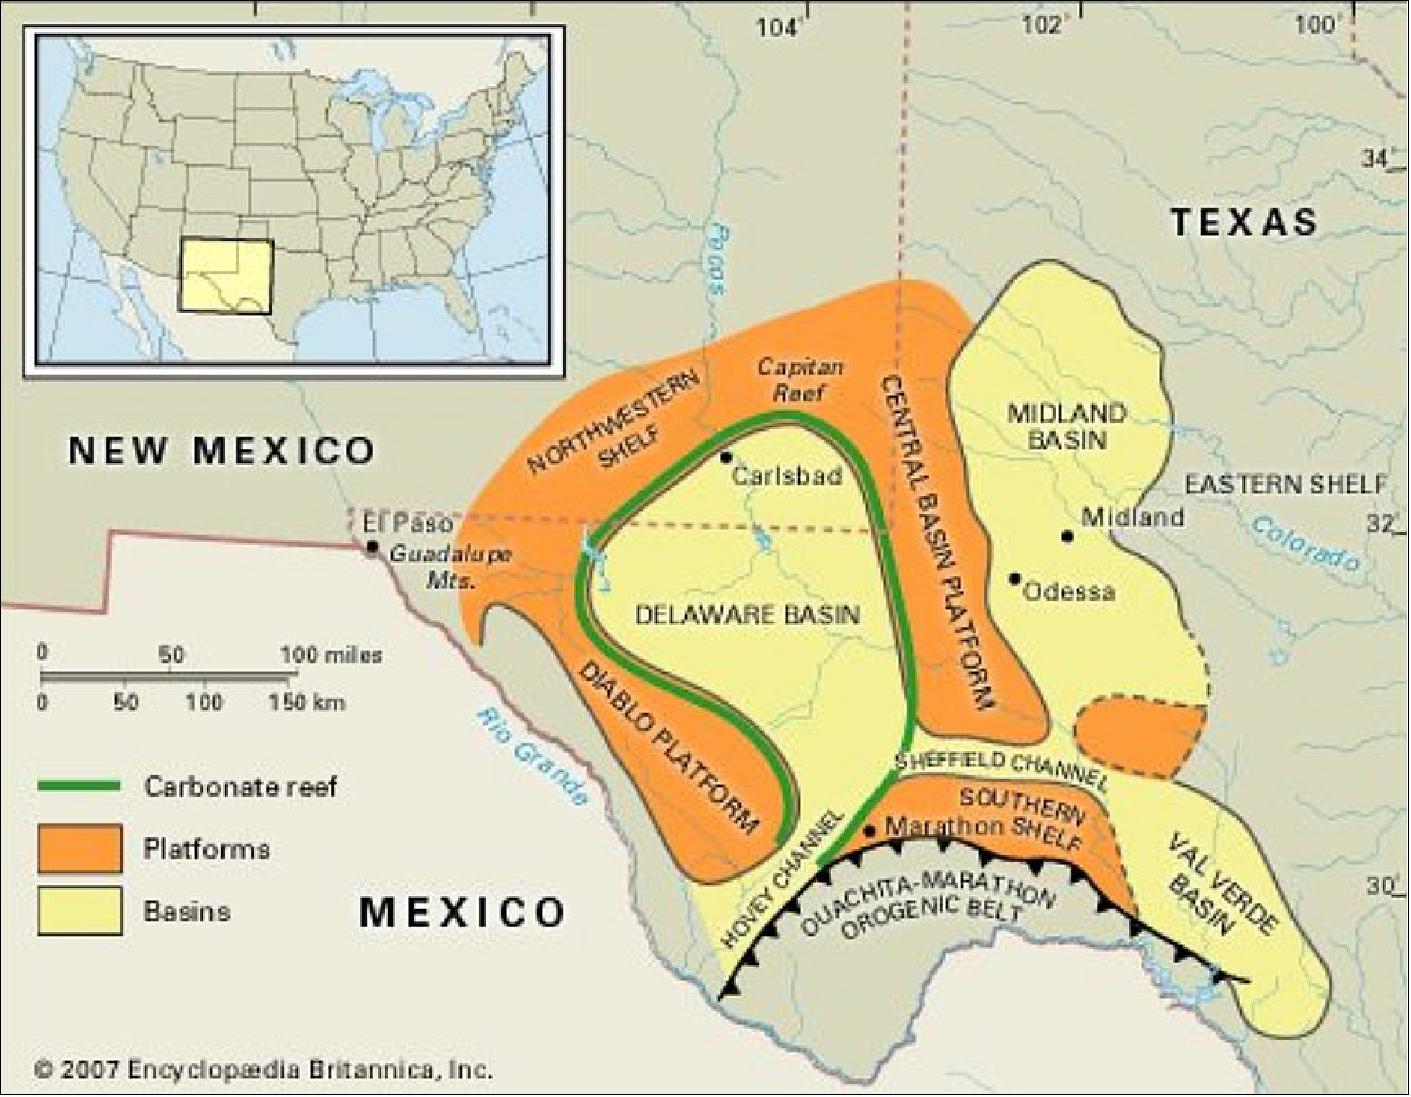
- GHGSat began supplying the data to Bloomberg in February for the Permian Basin. The Permian Basin is a sedimentary basin in the southwestern part of the United States, primarily in western Texas and southeastern New Mexico and is home to the extensive oil and gas fields.
What the deal means to GHGSat
- According to Stephane Germain, CEO of GHGSat: “GHGSat is accelerating the development of analytics based on facility-level greenhouse gas emissions measurements to provide unique insights in each of our target markets. This contract provides direct distribution of GHGSat analytics to one such market segment; Bloomberg’s Enterprise Access Point platform is widely used by the financial community.”
- The deal came together when Bloomberg approached GHGSat in 2019. Germain said the collaboration effort was designed to provide “long-term effort together to provide unique insights to the financial community.”
- What’s striking about this deal and other deals GHGSat has signed, is the level of interest they’ve generated from the data they’re receiving from the one small they’ve launched. That satellite, Claire, is meant as a technology demonstration mission. It was launched in February 2018 and it would not be an understatement to say that the mission, which has had some issues, has been an incredible success nonetheless.
- The company currently has two more satellites waiting to be launched this year. Both take into account lessons learned from the first mission.
• Summer 2019: GHGSat’s demonstration satellite GHGSat-D, nicknamed “Claire”, has reached over three years of operations. As of April 2019, Claire has performed over 4000 observations of: 12)
- Oil & gas facilities (wells, compressor stations, refineries, LNG, etc)
- Power stations (thermal and hydroelectric)
- Coal mines (open-pit and underground)
- Landfills
- Animal feedlots
- Natural sources (e.g. mud volcanos, localized seeps, etc).
A Small Satellite with Big Ambitions: GHGSat’s demonstration satellite GHGSat-D, nicknamed “Claire”, was successfully launched at 23:56 EDT on 21 June 2016, and reached its planned orbit less than 30 minutes later. GHGSat commissioned Claire within one month of launch, and initial images were released in the Fall of 2016. Claire orbits the Earth approximately 15 times per day, performing several different types of measurements:
- Infrared image of customer site
- One-time concentration map of customer site (provided with abundance dataset)
- Full-year monitoring, including emissions rate estimates.
The satellite orbits the Earth non-stop, every day, taking measurements from industrial sites anywhere in the world. For example, it measures oil wells in Texas, oil sands in Canada, power plants in Europe, coal mines in China, and even rice paddies in Vietnam. The output of those measurements includes imagery and data products, as simulated for a hydroelectric power plant in South America (Figure 8).

Industrial site operators can use CLAIRE’s measurements to better understand their greenhouse gas emissions, enabling them to control and ultimately reduce them. For example, CLAIRE can help coal mine and landfill operators find significant leaks of methane, then measure those leaks to justify a business case for gas-fired electricity generation.
• September 24, 2018: GHGSat announced today a US $10M Series A2 financing led by OGCI Climate Investments. Building on GHGSat's pioneering achievements in detecting and quantifying greenhouse gas emissions from industrial facilities around the world, the company will use the new capital to accelerate commercialization efforts, expand its custom analytics services for its growing customer base, as well as fund the launch of an additional GHGSat satellite. 13)
- GHGSat's Series A2 funding round includes financial backing from OGCI Climate Investments, Schlumberger, Space Angels, and the Business Development Bank of Canada. To date, GHGSat has raised over US $20M, including financing from the governments of Canada and Alberta.
- "This funding accelerates the commercial deployment of our service by growing our team and adding both capability and capacity," said Stéphane Germain, CEO of GHGSat. "It also secures access to some of the largest customers in the world for our services. We're very excited for this next stage of our growth."
- In 2016, GHGSat launched the world's first satellite designed to measure greenhouse gas emissions from industrial facilities around the world. This demonstration satellite will be followed starting in 2019 by two new satellites, as well as an aircraft sensor. GHGSat uses its technology to offer emissions monitoring and measurement services to several sectors, including oil & gas, power generation, mining, waste management and agriculture.
- In 2017, GHGSat Inc. ordered two more microsatellites from UTIAS/SFL, GHGSat-C1 and -C2. The two 15 kg microsatellites are commercial follow-ons to the GHGSat-D demonstration satellite. The launch of GHGSat-C1 is expected in H1 2019, while the launch of GHGSat-C2 is planned for H1 2020 (Ref. 15).
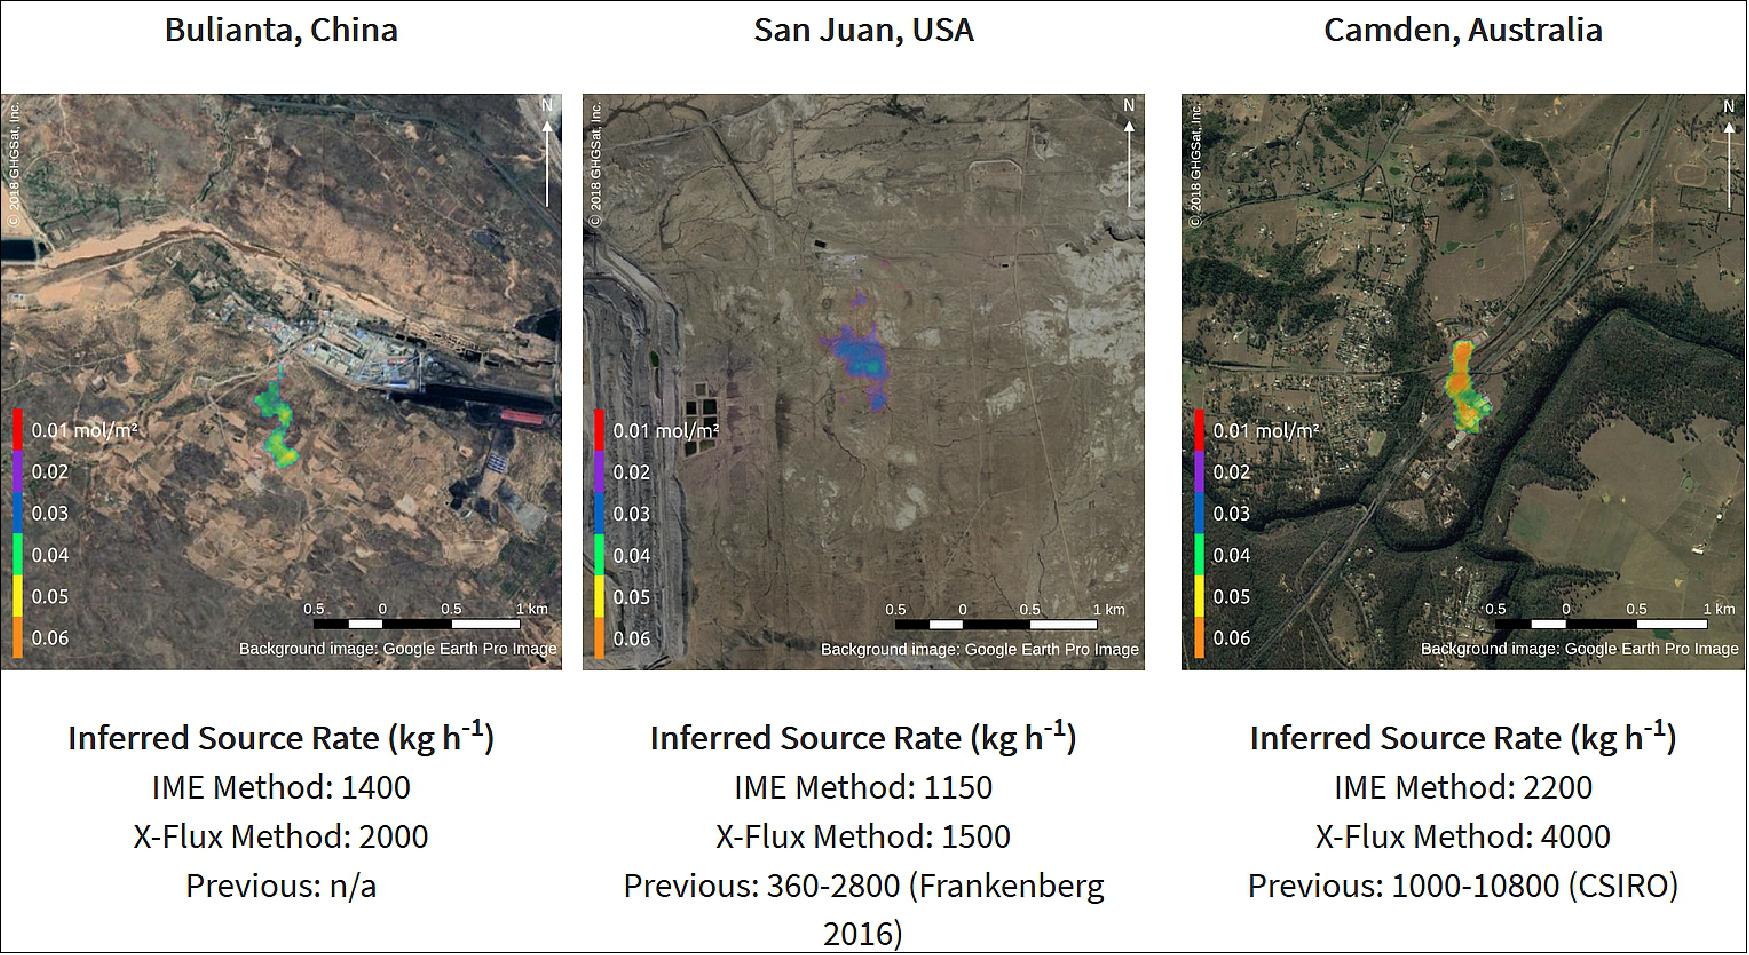
Legend to Figure 10: Measurement noise can make it difficult to detect methane point sources from a single observation, but temporal averaging of multiple observations reduces the noise. We find that aggregating data from ten to twenty GHGSat-D overpasses reveals strong time-averaged plume signals from three coal mines. Once these plumes are detected, we use two methods to estimate the corresponding source rates: one based on the observed integrated mass enhancement (IME) and another based on the average cross-sectional flux.
• On May 7 2018, I received information, that the nanosatellite GHGSat-D is healthy and continues to provide measurements for their customers. 15)
- GHGSat’s demonstration satellite GHGSat-D, nicknamed “Claire”, is approaching two years of operations. As of April 2018, Claire has performed over 2,500 observations of: 16)
a) Oil & gas facilities (wells, compressor stations, refineries, LNG, etc)
b) Power stations (thermal and hydroelectric)
c) Coal mines (open-pit and underground)
d) Landfills
e) Animal feedlots
f) Natural sources (e.g. mud volcanos, localized seeps, etc).
• June 22, 2017: GHGSat’s first satellite, Claire, is celebrating her first anniversary! A year ago today, Claire was launched from India to her orbit high above our beautiful planet. 17)
- She has since delivered almost 1300 measurements of hundreds of sites. The images of Figure 11 include an early calibration measurement from the sands of the Sahara, a visible plume from a power station in the steppes of Russia, and a methane measurement from the jungles of Africa.
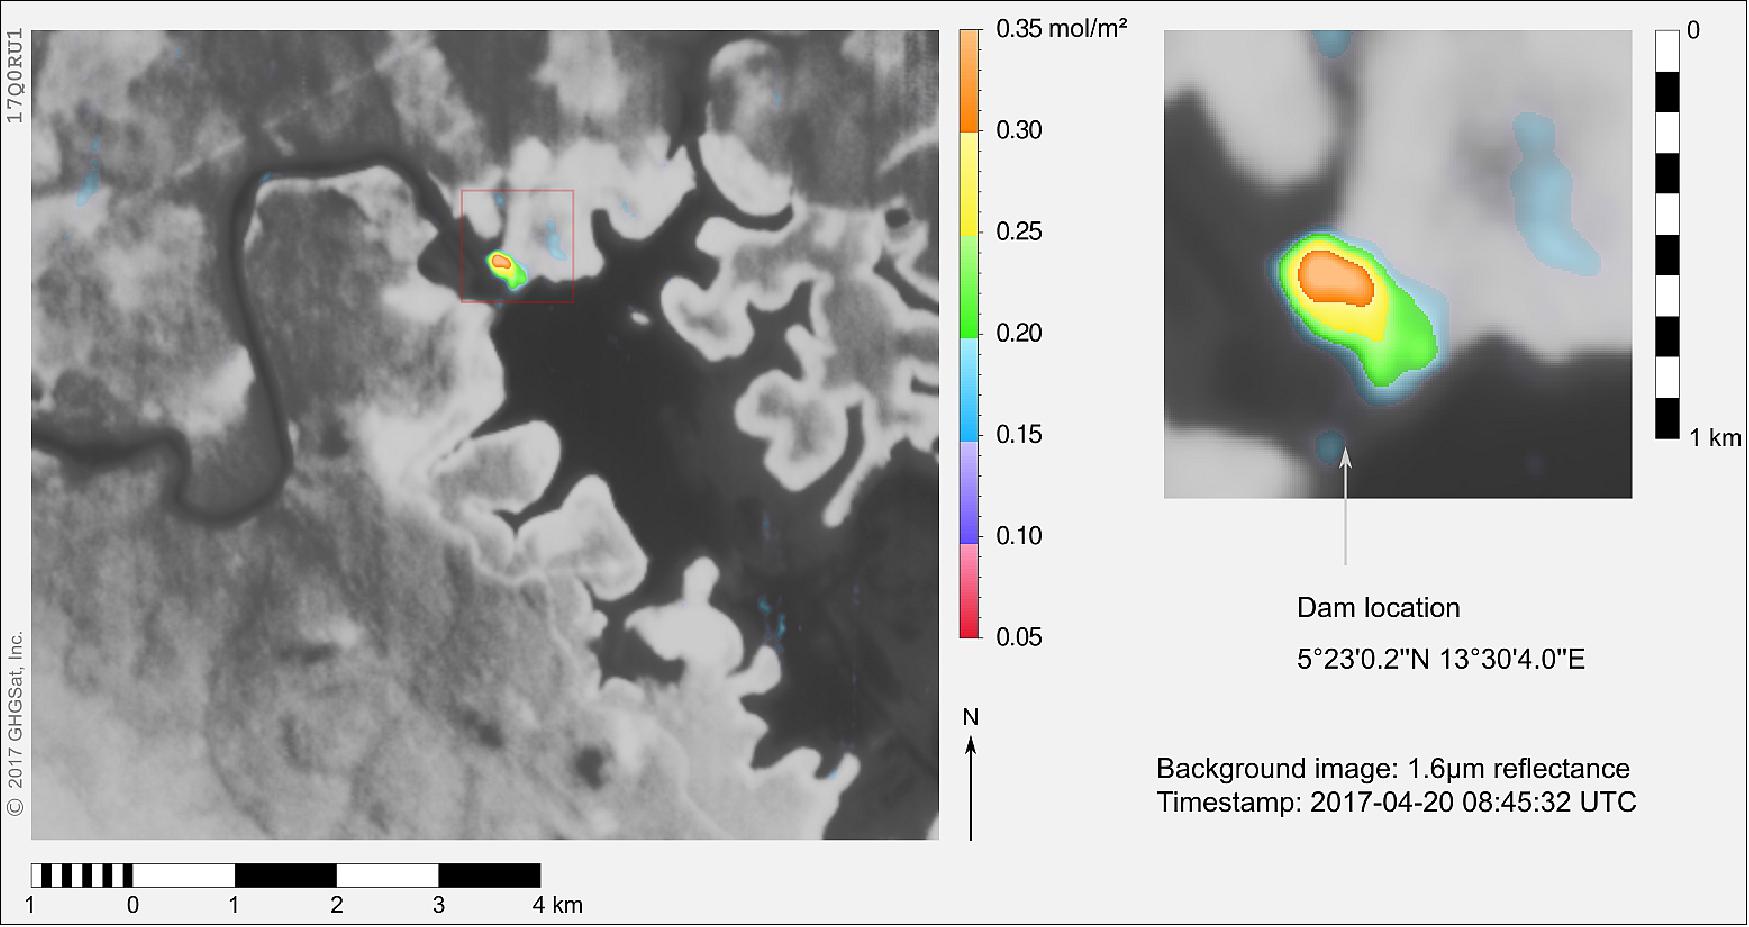
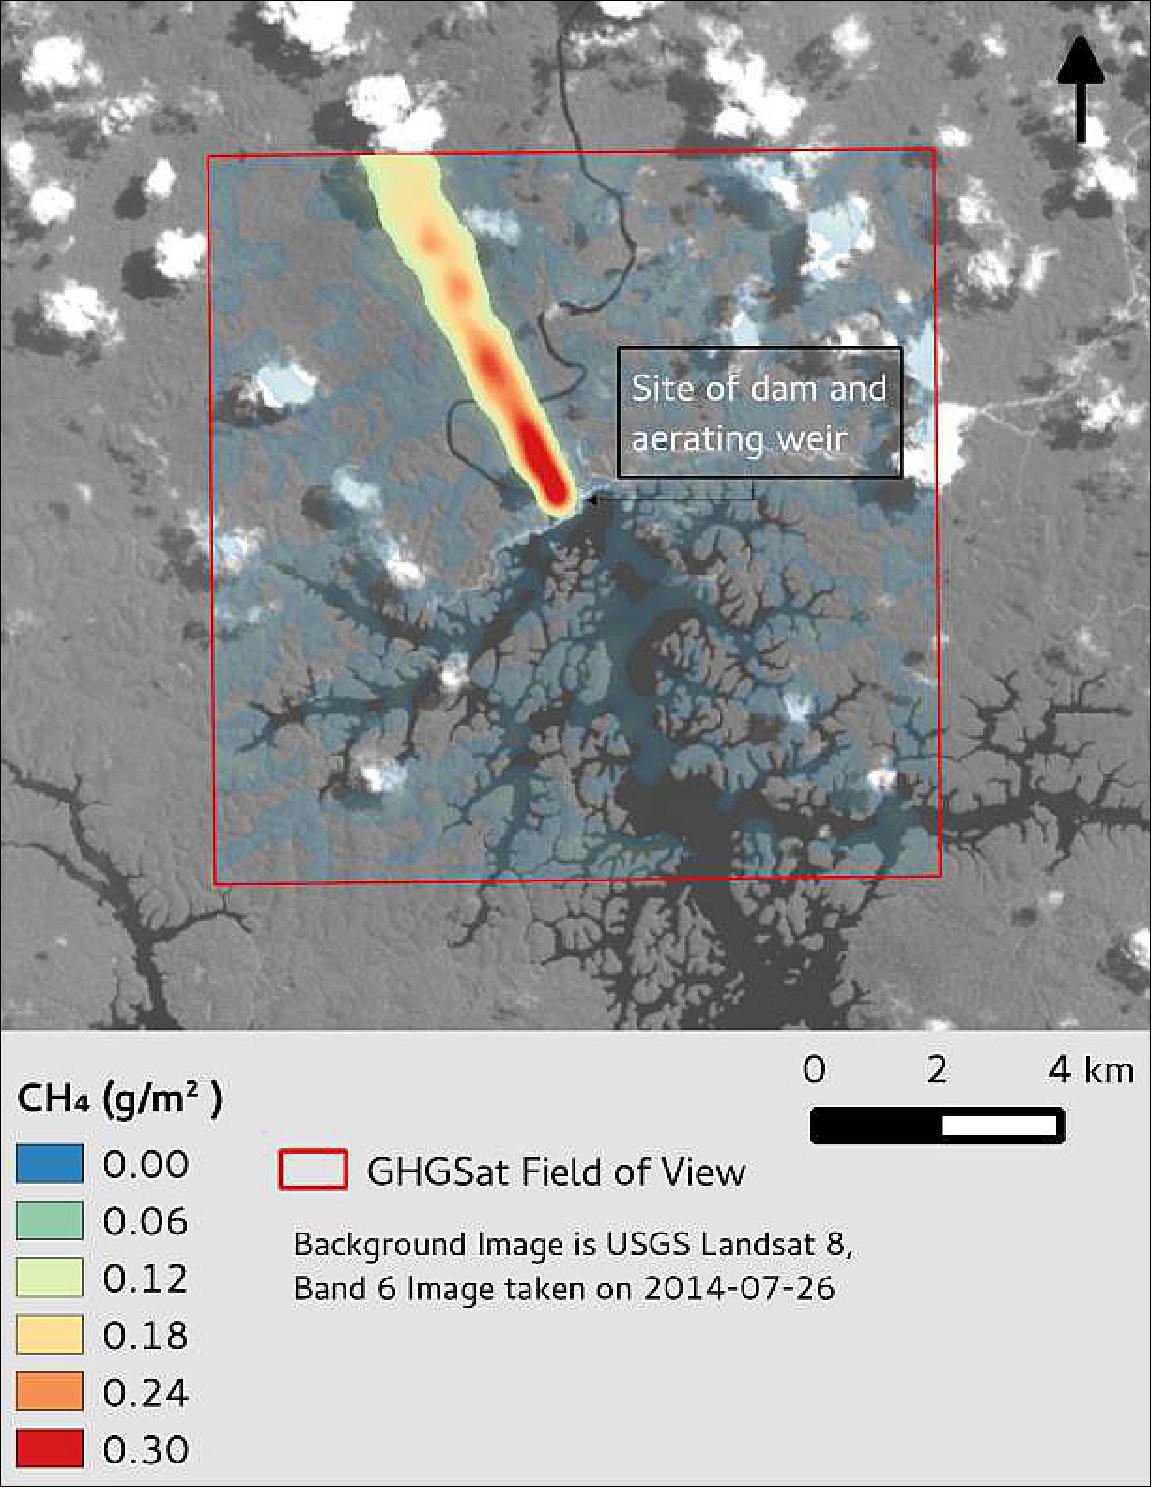
• May 23, 2017: Today, GHGSat unveiled sample imagery from its demonstration satellite, Claire (Figure 12). GHGSat has detected emissions of methane, an important greenhouse gas, from a hydroelectric facility under construction in Africa. GHGSat is making sample imagery and data for this facility available for evaluation by qualified parties. 18) 19)
- Claire captures an array of over 200,000 atmospheric measurements around an industrial facility in a few seconds. These measurements are processed to produce imagery showing a “heat map” of greenhouse gas concentrations from the facility.
- Using weather data and the retrieved array of greenhouse gas concentrations, GHGSat can estimate the rate at which an industrial facility releases greenhouse gases into the air. Flooding of hydroelectric reservoirs in tropical regions causes organic matter to decompose, often producing methane, which is then emitted into the air as water is released from the reservoir. The amount of methane emitted typically decreases over time, and varies with the amount of water released from the reservoir. GHGSat will collect local data in the coming weeks to further validate its measurements, and perform additional satellite measurements of the facility to monitor emissions rates over time.
- “GHGSat has been reviewing measurements of various facilities with customers for several months. Today’s unveiling is intended to facilitate collaboration with and evaluation by qualified parties such as academic and government institutions,” said Stéphane Germain, President and CEO of GHGSat. “We are excited by the unique insights Claire’s data can provide, and want to raise awareness of GHGSat’s services around the world.”

• April 6, 2017: GHGSat announced this week during the “Space in Canada” panel at the 33rd Space Symposium that it has performed its 1000th measurement with its demonstration satellite, “Claire”. This particular measurement is of a landfill in Japan. 21)
- This milestone was reached more than two months ahead of schedule, and validates an important element of GHGSat’s business case. GHGSat announced earlier this year that it has ordered two more satellites, based in part on successful performance demonstrations like this one. - GHGSat continues to measure carbon dioxide and methane emissions from sites around the world, including oil & gas facilities, power stations, coal mines, landfills, animal feedlots, and other sources. GHGSat has been delivering data products and services to customers for several months.
• In February 2017, GHGSat awarded contracts to its project partners for two new satellites, called GHGSat-C1 and GHGSat-C2. The satellites will share the same design but will stagger manufacturing for planned launches in H2 2018 and H1 2019. These satellites are indicative of the strong market response to GHGSat products and services in just 8 months after launch of GHGSat’s demonstration satellite, Claire. 22)
- GHGSat’s new satellites will provide significant performance improvements with only incremental design changes from GHGSat’s demonstration satellite, benefiting directly from lessons learned from on-orbit experience. Both new satellites with feature a spatial resolution of < 25 m, measurement precision targeting 1% of background for methane, and improvements in detection thresholds for both methane and carbon dioxide. The additional capacity and improved performance provided by these new satellites will enable GHGSat to expand services and reinforce GHGSat’s position as the only proven source of facility-level GHG emission data available from satellites for years to come.
• On 09 December 2016, Claire performed her 500th measurement – this time of a cement plant in South Africa. All satellite systems continue to operate normally, and GHGSat plans to double Claire’s measurement rate as of early 2017. Near the end of 2016, GHGSat celebrates an exciting year by offering some samples of images collected by Claire in orbit and analyzed by the team on the ground. 23)
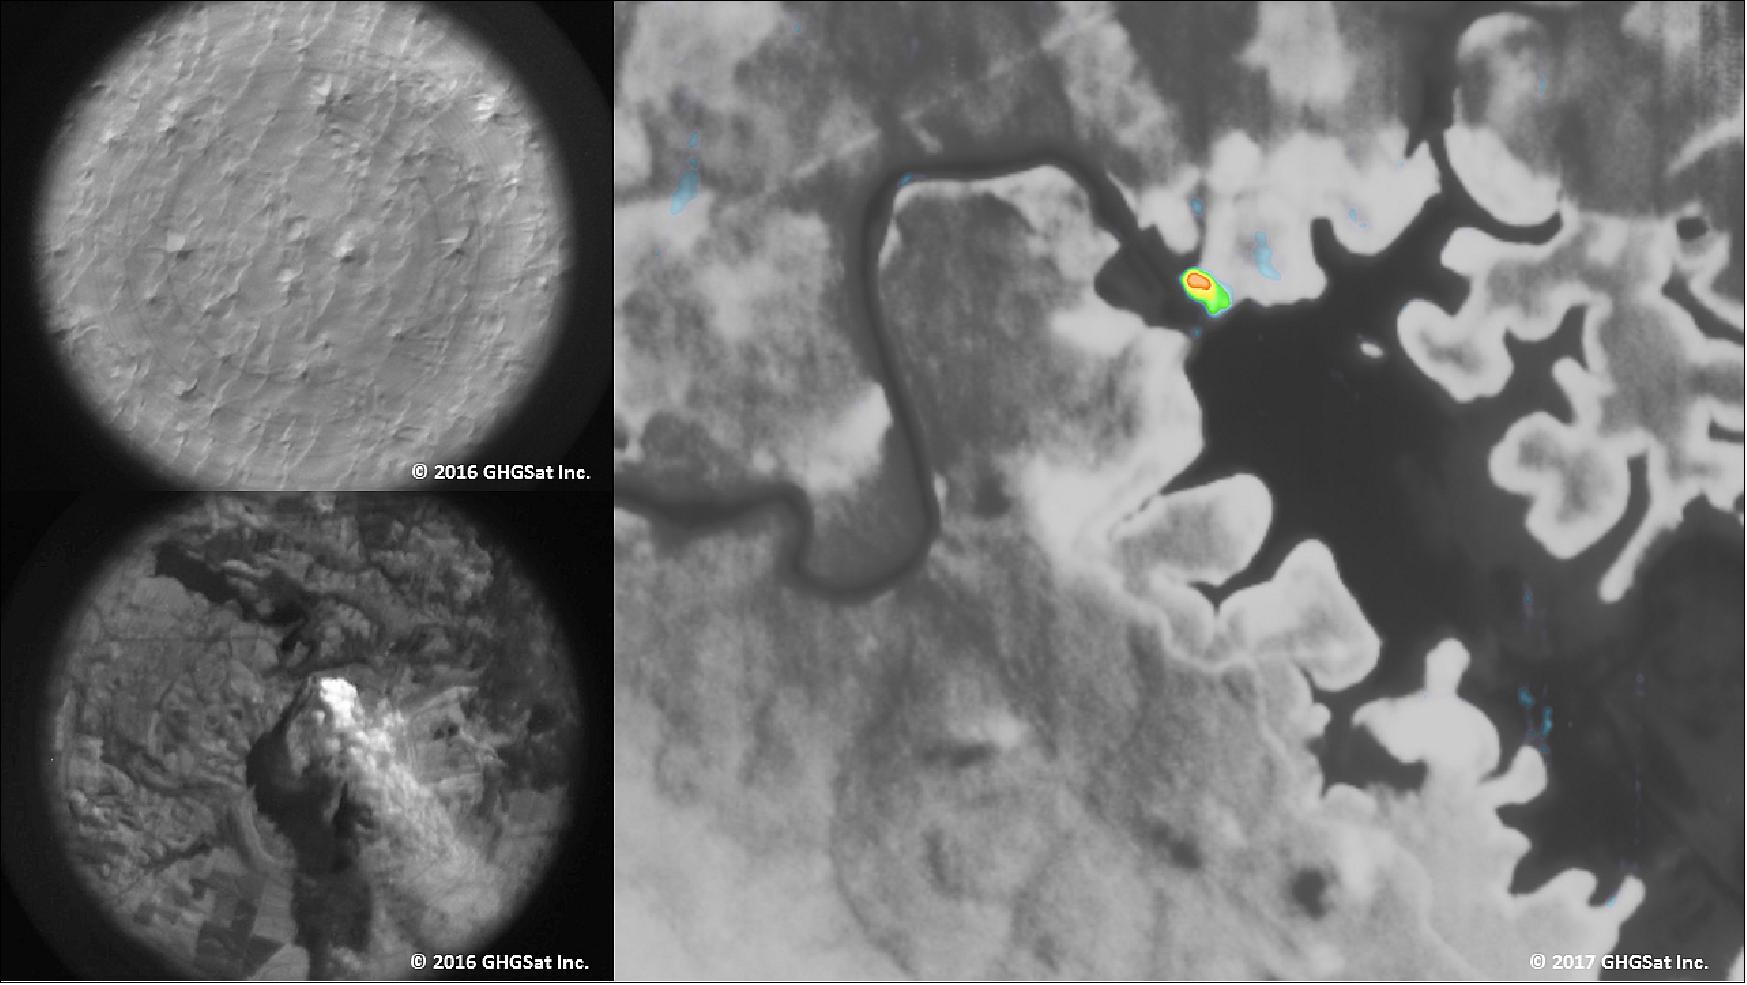
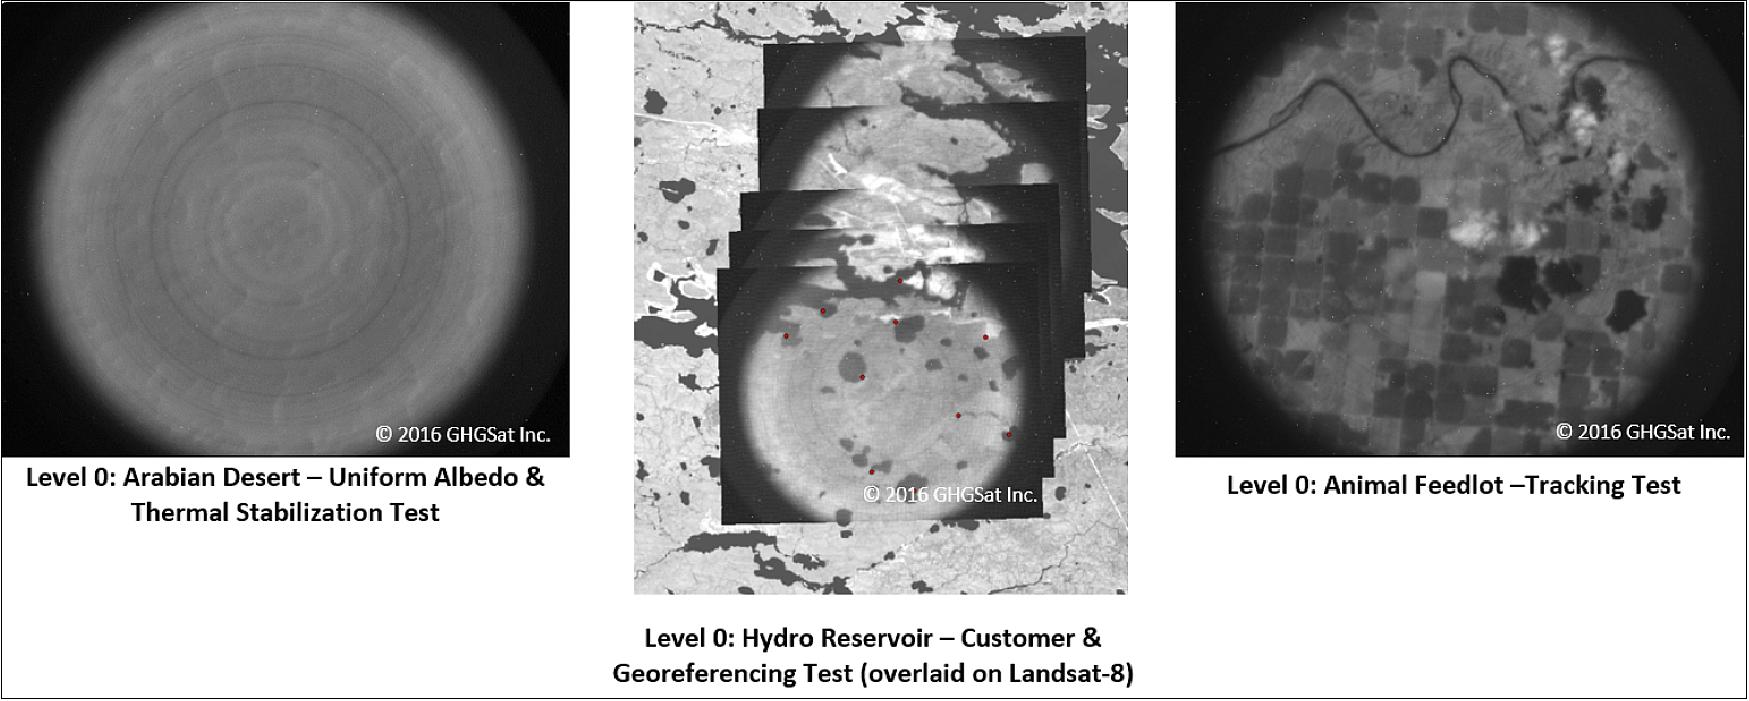
The first set of images of Figures 13 and 14 is from summer 2016, during Claire’s commissioning.
- “Raw” images from Claire are two-dimensional surface images overlaid with circular absorption lines corresponding to carbon dioxide and methane in the atmosphere in the field of view of the image. One of the first such images was taken over the Arabian desert (left panel), and clearly confirmed that Claire’s primary instrument had survived launch and was performing as expected.
- GHGSat must be able to geo-reference measurements with sufficient precision to identify facilities of interest. One of GHGSat’s first efforts is shown below for a hydroelectric reservoir in Canada (middle panel). Again, this test confirmed GHGSat’s ability to meet specifications.
- A successful measurement of emissions from any site requires tracking of the site for an extended period of time. An early tracking test over an animal feedlot (right panel) verified that Claire’s attitude determination and control system exceeded specifications.
• October 25, 2016: In a just a few weeks since the successful launch of its first satellite, GHGSat has already performed over 100 measurements of greenhouse gas emissions from industrial sites around the world. GHGSat-D (Claire) has measured oil & gas facilities, power plants, coal mines, landfills, and even animal feedlots – and measurements have been performed on every continent. 24)
- Satellite commissioning was completed within one month of launch. Commissioning procedures confirmed that all systems and instruments were operating normally. Initial imagery is currently being shared with customers, and samples will be made public in the coming weeks.
• On October 25, 2016, Boeing, GHGSat and C-Core unveiled partnering efforts to advance remote sensing technologies in Canada. Some of the specific efforts unveiled include: 25)
- Offering of GHGSat products and services to Boeing customers
- Deploying two new ground stations with C-Core in support of small satellite constellations, including GHGSat satellites.
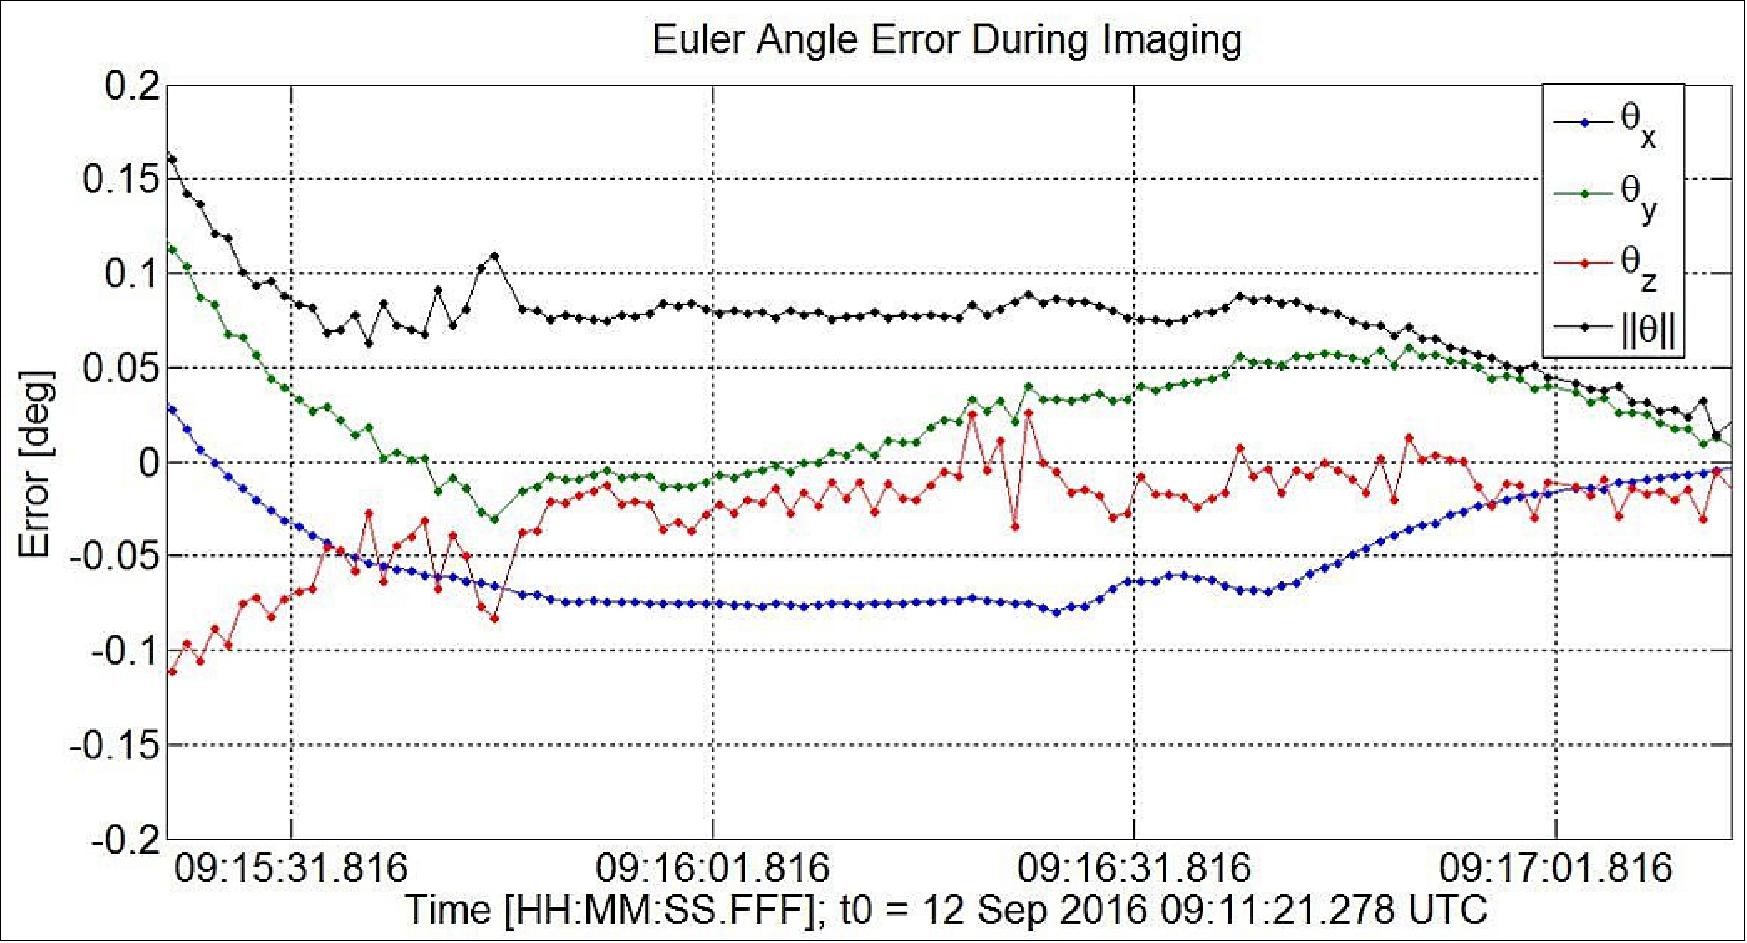
• September 2016: Once GHGSat-D was fine-tuned, the satellite was able to execute daily observations and downlinks of its images. By tracking the ground stations themselves, the satellite reached downlink speeds of up to 2048 kbit/s at high elevation angles and up to 60 MB of transmitted data to the ground stations per pass. Observations were found to be accurate up to 0.3º when fine target tracking. An example of the Euler angle errors for such a fine target tracking maneuver is shown in Figure 15.
- Commissioning: The bus subsystems on GHGSat-D boasted significant heritage and consequently the entirety of satellite commissioning was completed within 1 month of launch. This included checkouts of the power system, thermal regulation, housekeeping computer, communications hardware, the ADCS (Attitude Determination and Control Subsystem), payloads and overall general health. These initial checkouts were completed in a matter of days, while calibrating and fine-tuning the new Earth observation technologies, such as the guidance and navigation components of the ADCS and ground support software, were completed thereafter.
- Once the satellite was detumbled and stabilized, the GPS subsystem was assessed and star tracker calibration parameters were fine-tuned to improve solution availability. The GPS receiver was found to be working well, having acquired its first fix in 7 minutes from a cold start while still tumbling. The pseudorange residuals were found to be zero-mean with a standard deviation of 0.6 m. After tuning the region of interest on the star tracker imager, a solution availability of almost 100% was observed during nominal nadir control and fine target tracking. The star tracker boresight to Sun exclusion angle was found to be right at the theoretical limit of 34º. The exclusion angle to illuminated Earth limb was found to be between 20º to 21º, and was the same over both snow/ice and land (Ref. 30).
• August 29, 2016: In just a few weeks since the successful launch of its first satellite, GHGSat has already performed over 100 measurements of greenhouse gas emissions from industrial sites around the world. GHGSat-D/ Claire has measured oil & gas facilities, power plants, coal mines, landfills, and even animal feedlots – and measurements have been performed on every continent.
- Satellite commissioning was completed within one month of launch. Commissioning procedures confirmed that all systems and instruments were operating normally. 26)
• June 27, 2016: Only five days after launch, GHGSat-D (also known as “CLAIRE” – see Figure 1) is ahead of schedule in relation to on-orbit commissioning of the microsatellite bus. “We are very pleased that the microsatellite bus is fully functional, and that all subsystems are performing extremely well relative to their requirements,” says Cordell Grant, the SFL project manager for the mission, “This success has enabled GHGSat to start payload commissioning for its capability demonstration, which is an essential ingredient to commercialization of the results by GHGSat Inc.” 27)
- One of the key capabilities of the bus is to track targets on the ground which will enable direct observation of greenhouse gas emitters. GHGSat-D is now target tracking – a critical step to completing the commissioning of the payload, an advanced miniature hyperspectral SWIR imaging spectrometer. The microsatellite bus carries a star tracker that enables fine target tracking as required by the mission. The satellite uses SFL’s Modular Power System (MPS), a power distribution, regulation and control system that is scalable and can service 1W to 1kW missions. Several additional SFL satellites of various sizes that are scheduled for launch later this year are based upon the MPS as well.
- At present, the satellite bus is fully commissioned and all that remains is the completion of payload commissioning and optimization of attitude control performance. SFL’s customer for the mission, GHGSat Inc. is well positioned to begin the demonstration mission. “SFL continues to exceed our expectations,” says Stephane Germain, President of GHGSat Inc. “The entire team at GHGSat is pleased with the performance of the bus so soon after launch, and we look forward to a long and successful demonstration mission.”
• June 22, 2016: Separation from its XPOD Duo dispenser occurred in sequence after other satellites, roughly 19 minutes after liftoff as confirmed by on-board telemetry. The first pass over SFL’s ground station in Toronto was approximately 10.5 hours later and the satellite was found to be generating lots of power and at a comfortable temperature. “We are pleased and excited over the successful launch and first contact with GHGSat-D,” says Robert Zee, Director, SFL, “This is the beginning of what will be an important mission of demonstrating targeted greenhouse gas monitoring so that organizations around the world will have accurate feedback on compliance to environmental requirements. GHGSat Inc. will be providing an important service that contributes to the global fight against climate change.”
Sensor Complement
The sensor complement includes two spectroscopic instruments used for remote sensing of greenhouse gases. The primary instrument is a spectrometer operating in the SWIR (Short-Wave Infrared) region based on a Fabry-Pérot interferometer. This instrument provides imagery of the ground target and spectroscopic information on target gas abundances (greenhouse gas for this mission). GHGSat-D also contains a secondary instrument for cloud and aerosol detection.
Imaging Spectrometer
The miniature high-resolution imaging spectrometer, designed and developed by MPB Communications Inc., Pointe Claire, Québec, Canada, was delivered to UTIAS/SFL on July 3, 2015. The compact imaging spectrometer has a size of about 360 x 260 x 180 mm (including baffle), a mass of 5.4 kg and is designed to work from -40°C to +80°C with a spectral resolution on the order of 0.1 nm and a spatial resolution of under 50 m, covering a 15 km ground swath. 28)
The primary instrument restricts the incident spectral passband to a narrow wavelength region between 1600-1700 nm selected for the presence of spectral features for methane and carbon dioxide, as well as relatively little interference from other atmospheric species, H2O in particular.
The optical design of the primary instrument includes three lens groups (in addition to the Fabry-Pérot interferometer), as well as beam-folding mirrors required to fit the telescope into the NEMO bus. The first lens assembly is a large telescope doublet at the input, and the second is a collimating assembly which together provide the magnification required by the system. The third lens group is an imaging assembly which forms an image of the target scene on the focal plane array.
The focal plane array selected for GHGSat-D is a high sensitivity InGaAs SWIR camera with advanced dynamic range enhancements. The focal plane array is in a 640 x 512 array format, of which GHGSat-D masks the area outside the central 512 x 512 array. The selected InGaAs array has heritage on a NASA mission.
The instrument is comprised of an optical resonator consisting of a single plate with two parallel reflecting surfaces. Light passing into the instrument can only pass through the system when its wavelength corresponds to the resonances of the etalon that creates a narrow-band spectrum on the focal plane that is precisely tuned to the CATS wavelengths in order to create a high-resolution spectrum of the Doppler shift inherent in the backscattered signal.
Data from the microsatellite will enable industries to monitor and quantify their own carbon dioxide and methane emissions in order to adjust and better manage and reduce their impact on air quality.
C&A (Cloud and Aerosol) Instrument
The design of the C&A instrument is much simpler, consisting of an ultraviolet (UV) filter, a commercial lens assembly and a micro-hyperspectral sensor of Headwall Photonics Inc., Bolton, MA, USA. Due to volume constraints, the commercial lens assembly was cut in half and a beam folding mirror implemented, bending the light at a right angle. The two halves of the commercial lens assembly are referred to as C&A lens 1 and 2 going forward. The Headwall sensor measures light intensities at wavelengths between 400 and 1000 nm with a spectral resolution of 1.9 nm. It accomplishes this by dispersing the beam using a diffraction grating and then reflecting it onto a detector. The detector consists of a number of rows of pixels that each correspond to one of the beams constituent bands. The optical assembly and sensor are shown in Figure 16.
Headwall calls its hyperspectral imagers Hyperspec®, they are customized for high performance imaging in critical space applications while offering proven, light-weight designs. 29)

Payload requirements: In addition to the structural requirements there are a number of requirements specific to the payload itself. These are necessary in order to ensure that the payload will meet its performance metrics while enabling integration, alignment and testing. The driving requirements are presented in Table 2.
No | Description | Rationale |
PAY1 | The structure of the payload shall secure the optical components within tolerances of their nominal position | Ensure optics perform as desired |
PAY2 | The payload shall include adjustment mechanisms with the specified range and resolution for the components indicated by the prime contractor | Ensure alignment necessary to meet performance requirements can be met |
PAY3 | The payload shall implement the recommendations presented in the stray light analysis | Mitigate risk of stray light affecting performance |
PAY4 | The optical paths in the payload shall be light-tight with respect to the satellite bus | Mitigate risk of stray light affecting performance. Corroborate assumption for stray light analysis. |
PAY5 | The payload shall respect the requirements specified in the payload ICD | Ensure compatibility with the satellite |
PAY6 | The optical filters shall be removable after the SWIR instrument has been fully integrated | Facilitate testing of the primary instrument in air |
PAY7 | The lenses shall not experience a compressive stress due to the thermal expansion mismatch between them and their holding structure | Ensure the lenses will not distort or crack due to temperature swings |
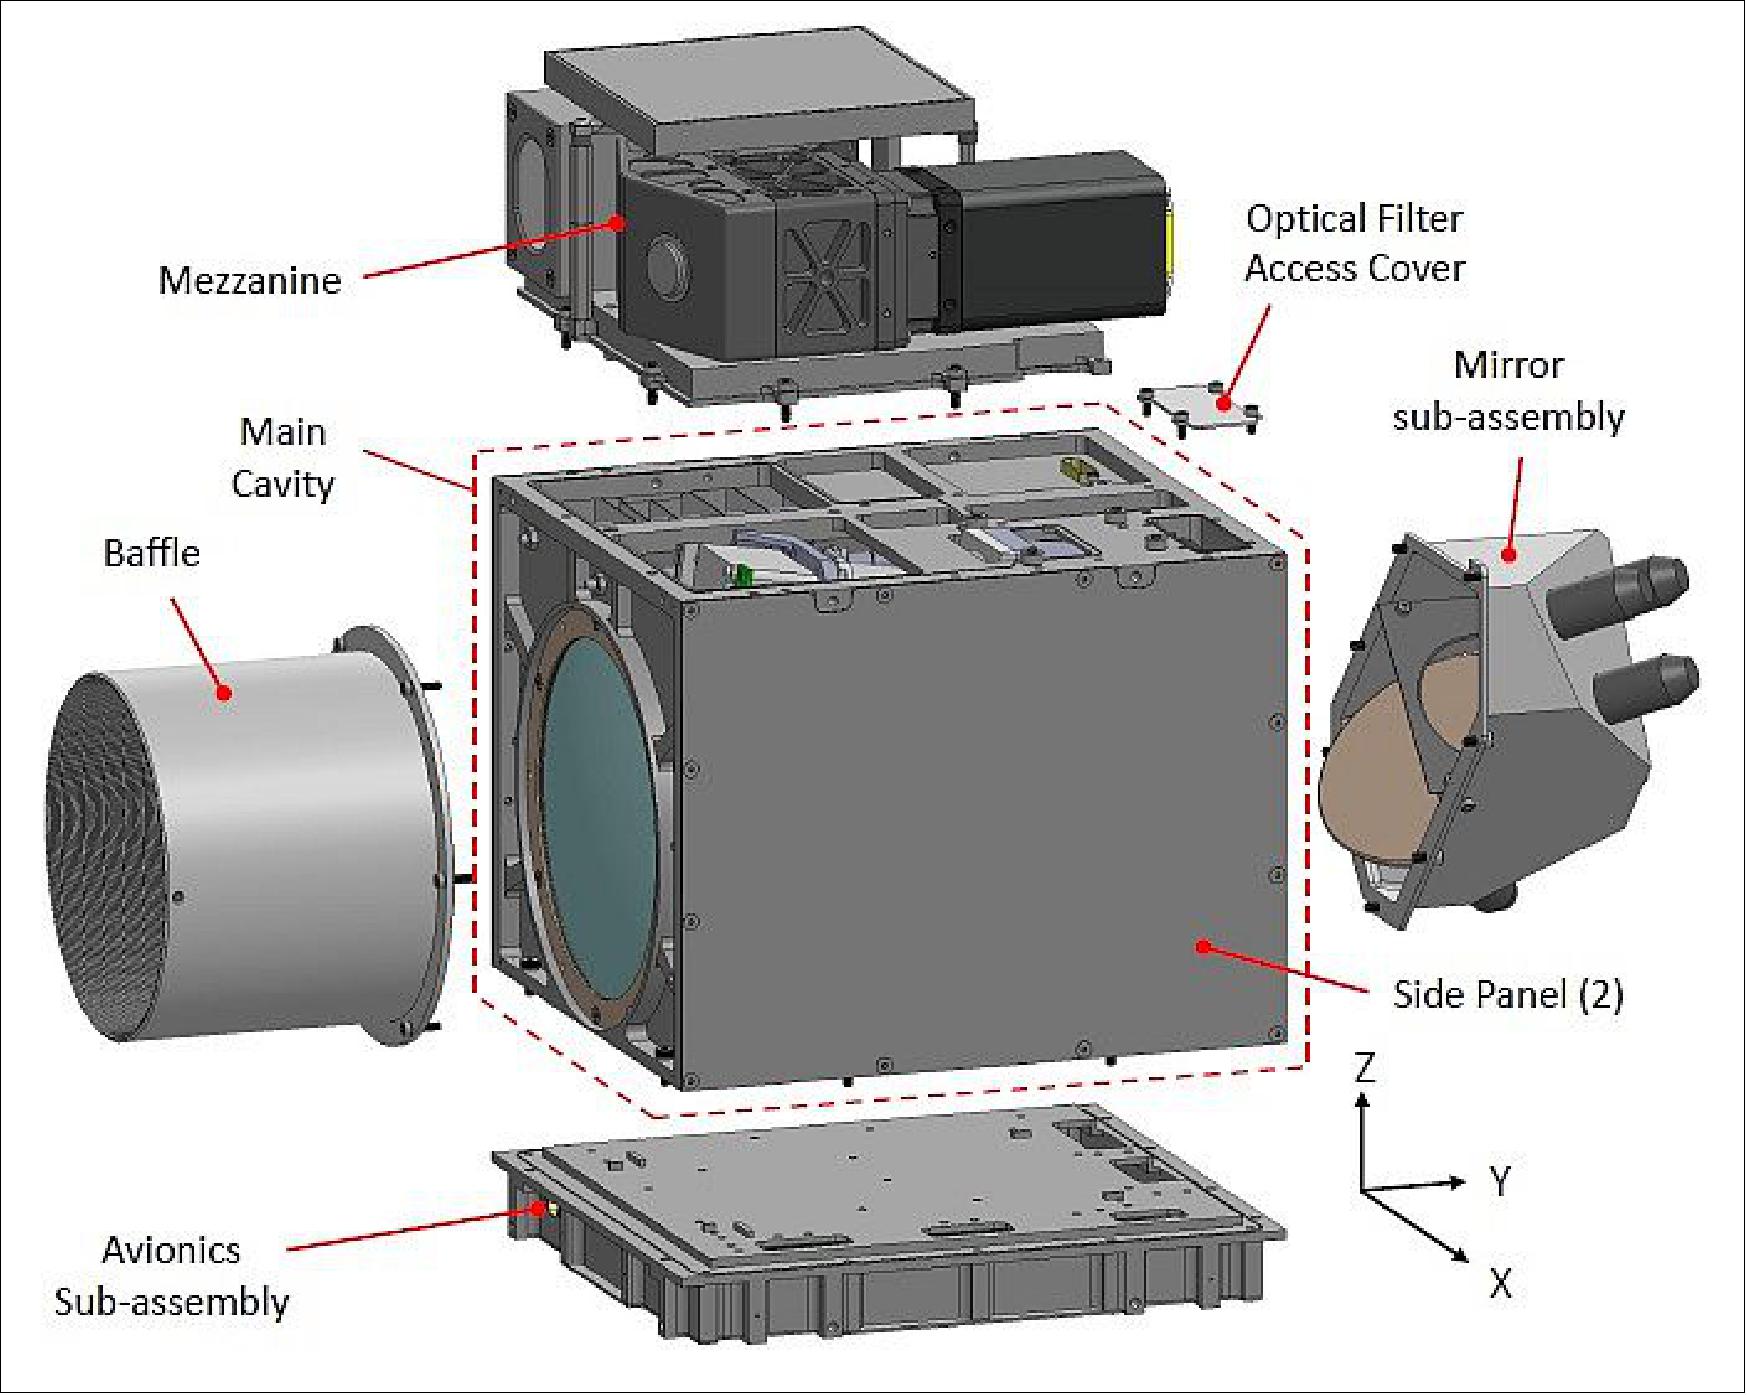
Payload structural design: The solid model for the payload, an overview of which is shown in Figure 17, was developed using the SolidWorks CAD package. Similar to the bus structure, the payload was designed with a number of different sub-assemblies and sections. The two sections, referred to as mezzanine and main cavity, have several sub-assemblies within them. The mezzanine contains both the radiator and C&A sub-assemblies and the main cavity contains the SWIR and vane subassemblies. The remaining subassemblies and components are fastened to the mounting bench. These are the avionics and mirror subassemblies, the baffle, primary lenses, optical filter access cover and two side panels. For confidentiality reasons no images or further detail of the SWIR or mirror subassemblies is presented. Note that the color of the models throughout this section has been selected to allow for the parts to be easily distinguished from one another, it has no relation to the material or surface finish of the part.
As with the satellite structure, aluminum 6061 has been used for all of the structural components and Delrin has been used where thermal isolation is required. To ensure assembly of the payload is repeatable, all of the subassemblies containing optical components are secured to one another with the use of pins and fasteners. If a subassembly needs to be removed from the payload at any point after the optics are aligned, the pins should maintain the alignment upon it being re-integrated. Also located at all of the external interfaces of the mounting bench is a channel for a gasket to be placed during assembly. This gasket serves two purposes, the first is to create a light-tight seal (PAY4) and the second is to reduce the potential for electromagnetic interference between the payload and satellite avionics. It is also required that the optical filters contained in the SWIR instrument be removable after it has been integrated into the main cavity (PAY6). This is because the wavelength transmission cutoff for the optical filters shifts slightly when they are in air rather than vacuum due to the different index of refraction of the mediums. To allow for representative testing to be completed in air, different filters are used during testing in ambient conditions which have the same transmission cutoffs as the flight filters do in vacuum.

Operations concept: 30)
GHGSat-D observations are scheduled by first forecasting future observations for the satellite based on desired targets, results from past observations, the quality of the orbit determination and other factors that control the viability of imaging a specific target location. The orbit estimate is propagated in time on the ground support software, in order to determine the point of closest approach to targets of interest and select a number of suitable targets. After observation targets are selected, their corresponding ODF (Observation Definition Files) are generated shortly before the actual observation. An ODF contains target coordinates and payload commands which are processed by the mission scheduling ground segment software to generate a list of the time tagged spacecraft commands (TimeTag commands). These TimeTag commands are uploaded to the spacecraft, which subsequently executes them to carry out the observation.
Nominally, the spacecraft is controlled to point to nadir using a combination of sun sensors, rate sensors and magnetometer. During observation a fine target tracking mode (star tracker only) is entered to allow the instruments to point at a desired target. Whereas many Earth observa tion satellites have the ground target stay fixed within the payload FOV (Field of View), imaging on GHGSat-D is required to have the target pan across the FOV from one side to the other as the satellite flies over the target. Panning is done autonomously by the satellite once the target coordinates are uploaded through the TimeTag commands. The satellite intelligently handles sensor/actuator telemetry, uses this telemetry to predict the satellite’s states, constructs panning trajectories on-the-fly and commands the actuators to regulate the trajectories in realtime.
Earth observations on small satellite platforms are typically constrained because the communications bandwidth does not allow downlinking observations quickly enough to make onboard storage available for subsequent observations. GHGSat-D mitigates this constraint by employing a number of techniques, including flight software equipped to treat ground stations as surface targets to be pointed to and tracked by the S-band antennas during contacts. Thus, downlinking is scheduled similarly to how observation targets are scheduled. ODFs in this case also contain information on which observations should be prioritized in the data downlink.
Ground Segment
GHGSat-D has begun operation with a single Earth station in Toronto at UTIAS/SFL. In the event that demand exceeds the capacity of this single station, GHGSat will deploy additional ground stations at appropriate locations (Ref. 4).
Each GHGSat target observation produces approximately 200,000 measurements of the atmospheric radiance in the SWIR region, one for each ground pixel. Each measurement provides a representation of the top-of-the-atmosphere spectral radiance emerging from a given ground pixel. However, the execution of atmospheric radiative transfer models is too computationally expensive to be performed for each ground pixel. As GHGSat's field of view is small compared to previous or existing GHG-measuring missions, we assume that the atmospheric state in the field of view, as relevant to GHGSat, can be represented in the instrument's field of view as an average state plus small, near-surface enhancements due to localized emitters. The column density retrievals are then performed in two distinct steps.
• In the first step, the full forward model, including the instrument model and a radiative transfer model is used to perform an iterative retrieval over a portion of the whole scene. Heuristics will be used to select upwind portions of the field of view that are not likely to be affected by known local emitters. This yields average values of the background columns, as well as per-observation instrument correction parameters similar to spectral shifting or squeezing parameters in classical grating instruments. The full forward model is then linearized around this point, yielding a scene-wide linear model.
• The second step derives a linear model and error parameters for each ground pixel from the scene-wide linear model. This derivation takes into account the sampling path specific to each ground pixel. The model is then inverted, giving per-ground pixel excess column density estimates for CO2, CH4 and H2O and fit residuals. Large excess column densities or residuals would affect a smaller number of ground pixels where further iterations of the forward model can then be afforded. Finally, iterative retrievals using the full forward model are performed on a small random selection of the overall column density map to validate the results.
The extraction of the emissions rate of CO2 and/or CH4 from a target measurement is referred to as emissions retrievals. Emissions retrievals take as input the abundance maps produced by the column density retrievals described above. These maps are then iteratively compared with a dispersion model that takes in meteorological conditions, terrain data and knowledge of source positions and simulates the dispersion and propagation of the plume for a given emissions rate. The dispersion model output is then converted to column densities for comparison with the satellite data. The estimated emissions rate and its uncertainty given the satellite observations and auxiliary data are obtained via convergence.
Products and Services
Column density retrievals and emission retrievals are offered to customers as (i) commercial satellite imagery products, and (ii) value-added services based on GHGSat’s own imagery products.
Commercial Satellite Imagery: GHGSat imagery is a measurement of greenhouse gas (specifically carbon dioxide and methane) concentrations in the atmosphere immediately above targeted industrial facilities. A simulated example is shown in Figure 19.
Value-added services: In addition to commercial satellite imagery, GHGSat offers technical services based on its own satellite imagery products, including but not limited to:
• Estimates of site-specific emissions rates from targeted industrial facilities, using microscale inverse dispersion modelling techniques
• Source identification, using image processing techniques
• Leak detection, by using change detection techniques
• Regulatory enforcement, by monitoring emissions from targeted sites over sustained periods.
Detailed product and service information is available separately form GHGSat.
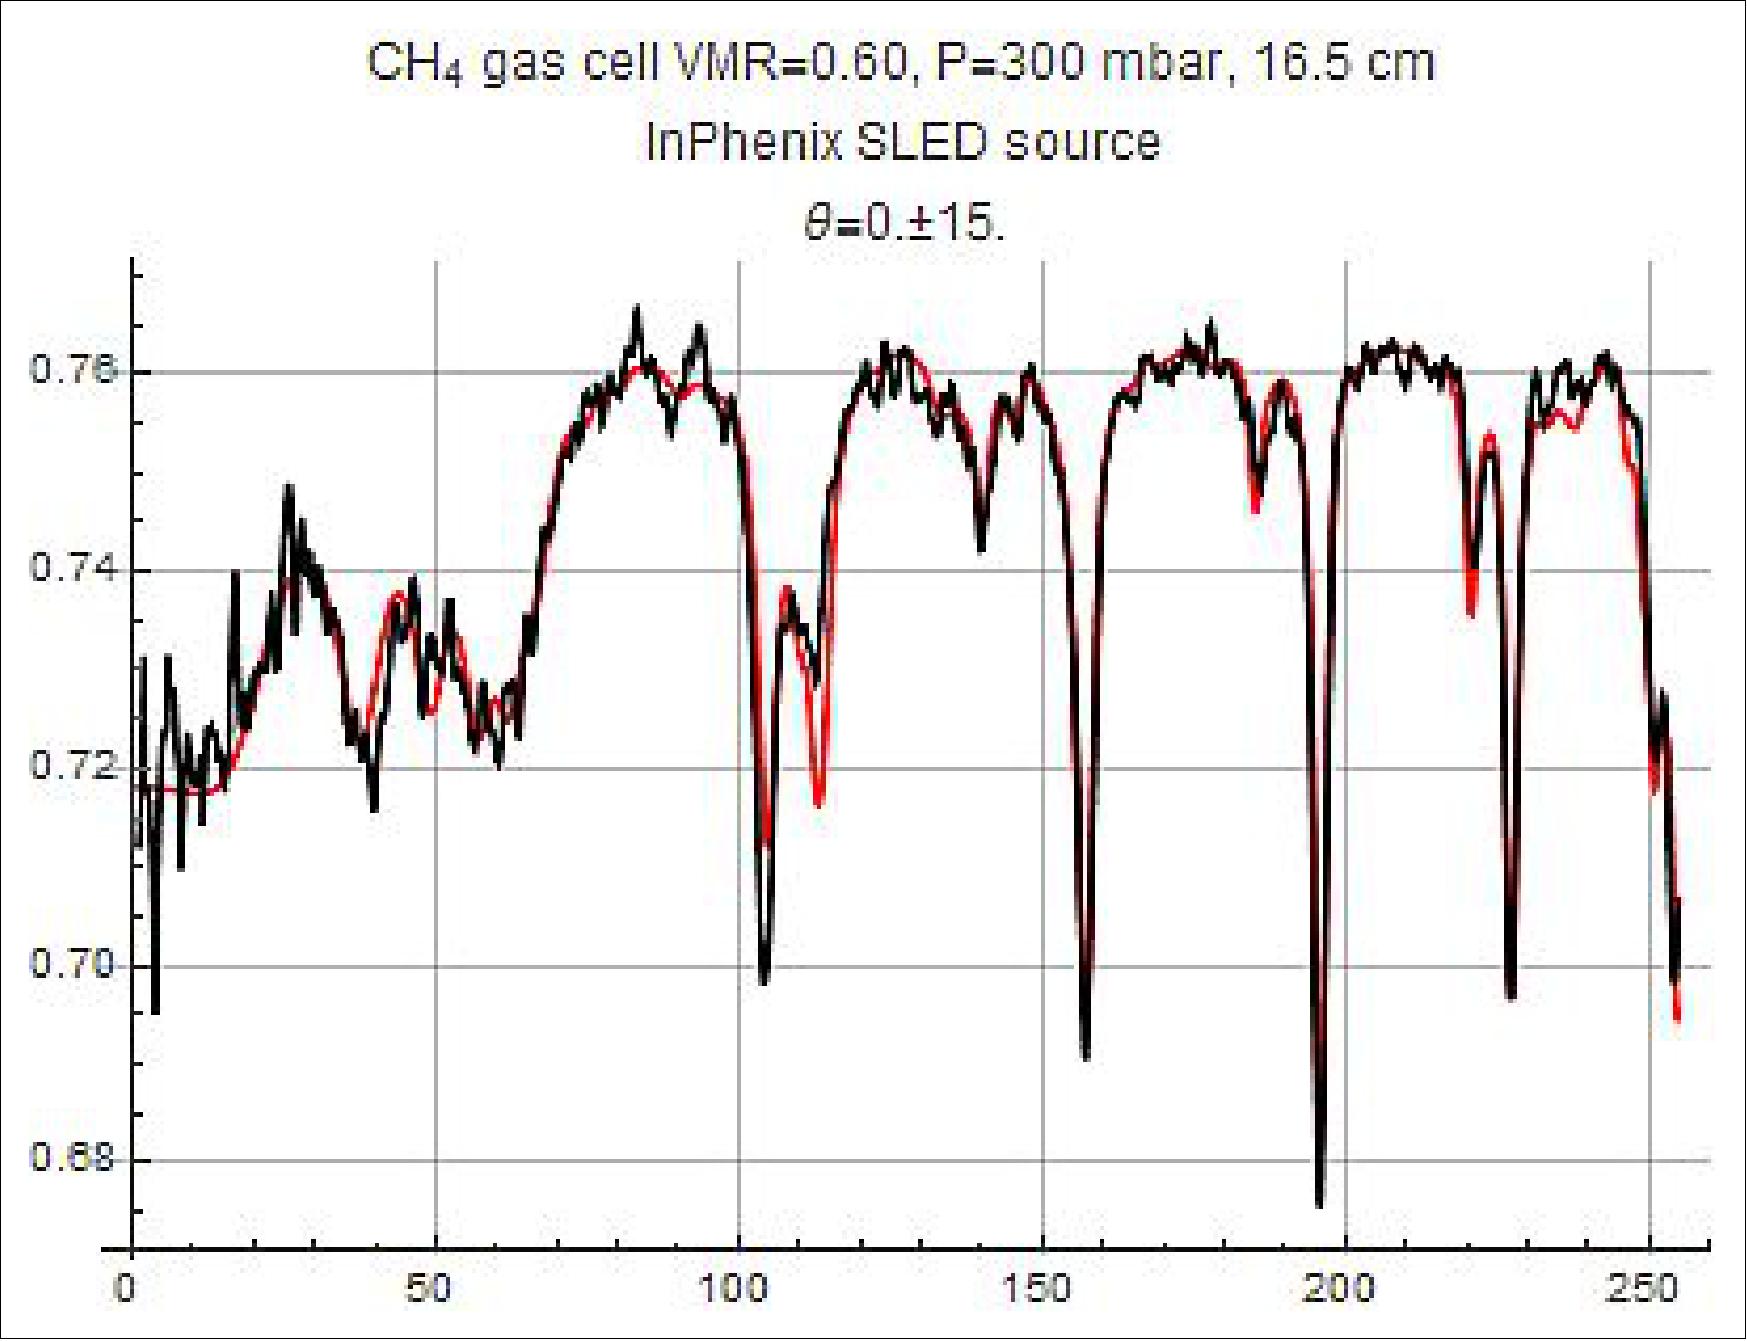
Validation: A ground test campaign was performed prior to launch. For example, a series of measurements were conducted to test the forward model that includes the instrument and the radiative transfer through the atmosphere. For the laboratory measurements, gas cells with fixed total pressure P and mixing ratio X of each GHG (in a buffer of dry nitrogen) were used as a surrogate for the atmosphere. The values of P and X were chosen by comparison with the predicted contrast and feature width seen in top of atmosphere solar radiance spectra (which can be calculated using radiative transfer software).
The setup for this test involves shining a light source whose spectrum covers our spectral bandpass through a gas cell, and illuminating the instrument with the transmitted light. In order to remove the effects of variations in the spectrum and angular distribution of the source, the image was divided by another one taken with the gas cell removed. In Figure 20, the image has been integrated over an angular range of 30 degrees and the recorded signal is plotted vs pixel position. The very good agreement shows the fidelity of the model for the instrument and for the transmission through the gas cell.
On-Orbit Testing: On-orbit commissioning of the GHGSat-D satellite and payload has recently completed. GHGSat’s focus is now turning to a series of on-orbit validation efforts involving a variety of different scenarios, including:
• Controlled releases of methane from known sources, such as a gas plant.
• Emissions from known sources with well-characterized emission rates, such as a thermal generation facility.
• Emissions from areas with complex sources, such as (a) tailings ponds in Canada’s oil sands region, and (b) a hydraulic fracturing basin with dozens of wells, and where the field of view also contains a vent for coal mine methane and an animal feedlot.
GHGSat expects to publish results from initial measurement and validation efforts in the coming months.
References
1) ”Microsatellites: GHGSat-D (aka Claire),” UTIAS/SFL, URL: http://utias-sfl.net/?page_id=1254
2) ”All Systems Go – Ready for Launch!,” GHGSat Inc., Nov. 25, 2015, URL: http://www.ghgsat.com/
3) Brent Nicholas Anders Brakeboer, ”Development of the Structural and Thermal Control Subsystems for an Earth Observation Microsatellite and its Payload,” Thesis for Master of Applied Science, Graduate Department of Aerospace Science and Engineering, University of Toronto, 2015, URL: https://tspace.library.utoronto.ca/bitstream/1807/70226/1/Brakeboer_Brent_201511_MAS_thesis.pdf
4) Stephane Germain, Berke Durak, Jason McKeever, Vincent Latendresse, Cordell Grant, James J. Sloan, ”Global monitoring of greenhouse gas emissions,” Proceedings of the 30th Annual AIAA/USU SmallSat Conference, Logan UT, USA, August 6-11, 2016, paper: SSC16-II-11, URL: http://digitalcommons.usu.edu/cgi/viewcontent.cgi?article=3355&context=smallsat
5) Stephane Germain, ”GHGSat — Global Emissions Monitoring,” GHGSat Inc., January 2016, URL: https://3c.gmx.net/mail/client/attachment/download
/tatt0_1---tmai14429e73031cba9f/;jsessionid=F156C9863C2317CE6D8886D39CA98B96-n4.bs51b
6) Robert E. Zee, ”Space Flight Laboratory: Disruptively Capable Smaller Satellites,” Canadian SmallSat Symposium, Toronto, Canada, Feb. 2-3, 2016, URL: http://schd.ws/hosted_files/canadiansmallsatsymposium2016/25
/Robert%20Zee%20Presentation%202016%20Canadian%20SmallSat%20Symposium.pdf
7) ”All Systems Go – Ready for Launch!,” GHGSat, November 25, 2015, URL: http://www.ghgsat.com
/?p=146
8) ”PSLV-C34 Successfully Launches 20 Satellites in a Single Flight,” ISRO, June 22, 2016, URL: http://www.isro.gov.in/update/22-jun-2016/pslv-c34-successfully-launches-20-satellites-single-flight
9) ”GHGSat launching in 2015,” GHGSat Inc. Jan. 2015, URL: http://www.ghgsat.com
/?m=201501
10) ”Detecting methane emissions during COVID-19,” ESA Applications, 01 June 2020, URL: http://www.esa.int/Applications/Observing_the_Earth/Copernicus
/Sentinel-5P/Detecting_methane_emissions_during_COVID-19
11) Marc Boucher, ”GHGSat’s deal with Bloomberg points to a growing desire for commercial satellite emissions data,” SpaceQ Media Inc., 26 March 2020, URL: https://spaceq.ca
/ghgsats-deal-with-bloomberg-points-to-a-growing-desire-for-commercial-satellite-emissions-data/
12) ”Claire is Three Years Old!,” GHGSat, 2019, URL: https://www.ghgsat.com
/who-we-are/our-satellites/claire/
13) ”GHGSat Raises US$10M in Financing Led by OGCI Climate Investments,” CISION, 24 September 2018, URL: https://www.newswire.ca/news-releases
/ghgsat-raises-us10m-in-financing-led-by-ogci-climate-investments-694120541.html?tc=eml_mycnw
14) ”GHGSat Analytics,” URL: http://www.ghgsat.com/data-products-analytics/analytics/
15) Information provided by Stephane Germain, president of GHGSat Inc., Montreal, Quebec, Canada.
16) Claire is almost Two Years Old!,” GHGSat-D, April 2018, URL: http://www.ghgsat.com
/who-we-are/our-satellites/claire/
17) ”First Full Year in Orbit!,” GHGSat, June 22, 2017, URL: http://www.ghgsat.com/?cat=3
18) ”GHGSat Unveils Satellite Imagery,” UTIAS/SFL, May 23, 2017, URL: https://web.archive.org/web/20221002220426/https://www.utias-sfl.net/?p=2655
19) http://www.ghgsat.com/?page_id=316
20) ”GHGSat Press Release Image,” 23 May 2017, URL: http://www.ghgsat.com/?attachment_id=317
21) ”GHGSat Announces 1000th Measurement – Two Months Ahead of Schedule,” GHGSat, April 6, 2017, URL: http://www.ghgsat.com/?p=297
22) ”GHGSat Orders New Satellites,” GHGSat, Feb. 17, 2017, URL: http://www.ghgsat.com/?p=288
23) ”Claire Makes 500th Measurement!,” GHGSat, December 12, 2016, URL: http://www.ghgsat.com/?p=279
24) ”GHGSat Passes Operational Milestone,” GHGSat, Oct. 25, 2016, URL: http://www.ghgsat.com/?p=242
25) ”GHGSat Partners with Boeing and C-Core,” GHGSat, Oct. 25, 2016, URL: http://www.ghgsat.com
/?p=249
26) ”GHGSat Passes Operational Milestone,” GHGSat, August 29,2016, URL: http://www.ghgsat.com/
27) ”GHGSat-D (CLAIRE) Bus Commissioning Ahead of Schedule,” UTIAS/SFL, June 27, 2016, URL: http://utias-sfl.net/?p=2512
28) ”GHGSat Imaging Spectrometer Payload Delivered,” MPB Communications Inc.; Aug. 3, 2015, URL: http://www.mpbcommunications.com/en/site/news/news_releases/stories/GHGSat.html
29) http://www.headwallphotonics.com/applications/remote-sensing/earth-observation
30) N. S. Ibrahim, P. Choi, C. Grant, D. Kekez, P. Mehradnia, N. Roth, K. Sarda, L. Bradbury, R. E. Zee, ”On-Orbit Earth Observation Performance of GHGSat-D,” Proceedings of the 11th IAA Symposium on Small Satellites for Earth Observation, Berlin, Germany, April 24-28, 2017, paper: IAA-B11-0801
The information compiled and edited in this article was provided by Herbert J. Kramer from his documentation of: ”Observation of the Earth and Its Environment: Survey of Missions and Sensors” (Springer Verlag) as well as many other sources after the publication of the 4th edition in 2002. - Comments and corrections to this article are always welcome for further updates (eoportal@symbios.space).
Spacecraft Launch Mission Status Sensor Complement Ground Segment References Back to top