GF-3 (Gaofen-3)
EO
Land
Multi-purpose imagery (land)
Land surface imagery
Launched in August 2016, Gaofen-3 is the third satellite in the China High-Resolution Earth Observation System (CHEOS) series. Developed by the China National Space Administration (CNSA), it is a civilian satellite with primary users being the State Oceanic Administration (SOA), the China Meteorological Administration (CMA), the Ministry of Civil Affairs and the Ministry of Water Resources.
Quick facts
Overview
| Mission type | EO |
| Agency | CRESDA |
| Mission status | Operational (nominal) |
| Launch date | 10 Aug 2016 |
| Measurement domain | Land |
| Measurement category | Multi-purpose imagery (land), Landscape topography |
| Measurement detailed | Land surface imagery, Land surface topography |
| Instruments | C-SAR |
| Instrument type | Imaging microwave radars |
| CEOS EO Handbook | See GF-3 (Gaofen-3) summary |
Summary
Mission Capabilities
Gaofen-3’s primary objective is to present a preliminary quantitative result for wetland classification, but has broader applications in disaster monitoring, water conservancy, maritime and meteorology. The collective goal of the CHEOS series is to provide NRT (Near-Real-Time) observations for disaster prevention and relief, climate change monitoring, geographical mapping, environment and resource surveying, as well as for agricultural support.
Wetlands have become a key goal of ecosystem monitoring for the evaluation of resource development and the maintenance of regional ecological environments. The C-band Synthetic Aperture Radar (C-SAR) onboard Gaofen-3 has significant capability in wetland monitoring and observation in high spatial resolution under all-weather conditions. The instrument is quad-polarised to provide more scattering details to meet the demand of fine wetland monitoring. It observes in 12 modes, each with varying spatial resolution and swath widths, to meet the multi-user technical requirements.
Performance Specifications
The C-band Synthetic Aperture Radar (C-SAR) has 12 imaging modes in the C-band frequency which can be classified into six groups. The singular P mode employs sliding spotlight technology using single polarisation to achieve a nominal spatial resolution of 1 m and a swath of 10 x 10 km. The ultra-fine (UF) stripmap mode also uses single polarisation, and has a spatial resolution of 3 m with a swath width of 30 km. There are five modes that obtain dual-polarisation measurements using the stripmap method: Fine Stripmap, Wide Fine Stripmap, Standard Stripmap and two Expanded incidence angle (E) modes. Fine Stripmap has the finest spatial resolution of these at 5 m, with a swath width of 50 m. The Wide Fine Stripmap mode has a spatial resolution of 10 m with a swath width of 100 km, whilst Standard Stripmap has a 25 m resolution and 130 km swath width. The E modes have an incidence angle out of scale of other modes in order to expand observing capability and reduce revisit interval time. Each of these have a spatial resolution of 25 m with differing swath widths of 80 km and 130 km.
The quad-polarisation Stripmap modes include a Quad-pol stripmap mode (Q) with 8 m spatial resolution and 30 km swath width, and a Wide quad-pol stripmap mode (WQ) with 25 m spatial resolution and 40 km swath width. The Wave mode also uses quad-polarisation in discontinuous operation for precise (10 m) resolution over a 5 x 5 km area. There are two ScanSAR modes which are used to cover a larger swath width with dual polarisation. The Narrow ScanSAR mode has a spatial resolution of 50 m and a swath width of 300 km, whilst the Wide ScanSAR has a spatial resolution of 100 m and a swath width of 500 km.
The spacecraft operates in a sun-synchronous orbit at an altitude of 755 km and inclination of 98.41°.
Space and Hardware Components
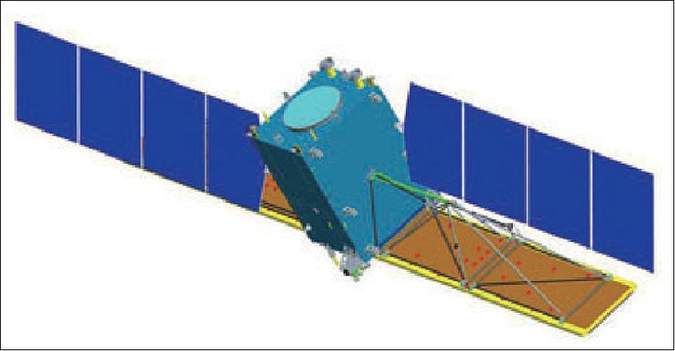
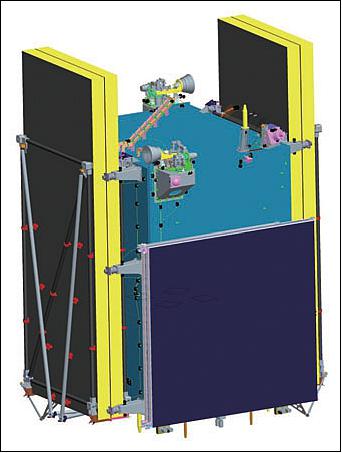
Gaofen-3, developed by the Chinese Academy of Space Technology (CAST), is based on the ZY1000B satellite bus and consists of two parts: payload and service system. The payload consists of the SAR instrument, data transmission system and the data transmission antenna system, while the service system provides power supply, installation, maintenance and test temperature. The SAR antenna is divided into four panels which can be powered separately in order to meet the required antenna aperture size for each of the observing modes.
The spacecraft is three-axis stabilised with a launch mass of 2279 kg. To meet the demand of imaging requirements, the satellite uses a dual independent bus power configuration, a three-junction solar cell array and two batteries. It also employs control moment gyroscopes (CMGs) and momentum wheels to enhance the high-stability and high-agility control systems. Gaofen-3 has an autonomous health management system which allows continuous monitoring of critical events, evaluation of product status, and taking advanced measures to ensure satellite safety in orbit.
Spacecraft Launch Mission Status Sensor Complement References
Gaofen-3 (GF-3) SAR Satellite / CHEOS series of China
Gaofen-3 is the first civilian C-band polarimetric SAR (Synthetic Aperture Radar) imaging satellite of CNSA (China National Space Administration), Beijing, China. GF-3 is part of the CHEOS (China High Resolution Earth Observation System) family with the objective to provide high-resolution observations and disaster monitoring. The multi-user requirements call for land and ocean monitoring, disaster reduction, water conservancy, and meteorology. Its primary users are the State Oceanic Administration (SOA), the China Meteorological Administration (CMA), the Ministry of Civil Affairs, and the Ministry of Water Resources.
Main user community | Observation target and application |
Maritime | Sea wave, sea surface wind field, internal wave, frontal surface, shallow sea topography, sea surface oil spill, |
Disaster monitoring | Flood submerged area, debris flow, landslide, ice or snow, extent of sea ice, drought scope, buildings, temporary |
Water conservancy | Characteristics of river basin systems, surface water distribution, flood range, soil moisture content, land use and |
Meteorology | High resolution regional surface soil moisture monitoring, rainstorm triggered landslides and debris flow and other |
Spacecraft
The GF-3 satellite is based on the ZY1000B platform, developed by the Chinese Academy of Space Technology (CAST), and consists of two parts: payload and service system. The payload consists of the SAR load, data transmission system, data transmission antenna system. The service system provides power supply, installation, maintenance and test temperature, including a power supply, attitude control, propulsion, monitoring and control, data management, structure and thermal control system.
The GF-3 satellite is a three-axis stabilized with a launch mass of about 2779 kg, and a design life of 8 years. The spacecraft features high-stability and high-agility attitude control systems employing a combination of CMGs (Control Moment Gyros) and momentum wheels. The satellite works in an orbit altitude of about 755 km in a sun synchronous orbit in a side looking attitude.
The satellite adopts a three-axis stabilized ground directional control mode, the pointing accuracy is better than 0.03º, the stability is better than 5 x 10⁻⁴ º/s, and has a roll maneuver capability of ±31.5º. The satellite is using a dual independent bus power configuration, a three-junction GaAs solar cell array, a 100 Ah NiCd battery and a 225 Ah lithium-ion battery, can meet the demand of the satellite imaging requirements. When the output power of the platform bus is not enough or the bus output is abnormal, the payload high voltage power supply can be converted into a low voltage power supply through a grid controller and be used for the platform equipment. The satellite has an autonomous health management system, which can continuous monitor critical events, evaluate the product status and take a variety of effective measures in advance to ensure satellite safety in orbit.
Item | GF-3 | Sentinel-1 | RADARSAT-2 |
Orbit | Sun-synchronous orbit | Sun-synchronous orbit | Sun-synchronous orbit |
Orbit altitude | 755 km | 693 km | 798 km |
Frequency band | C-band | C-band | C-band |
Spacecraft mass | 2779 kg | 2300 kg | 2300 kg |
Peak power | 1.5 kW | 4.7 kW | 1.27 kW |
Incidence angle | 10º - 60º | 20º - 45º | 20º - 60º |
Antenna size | 15 m x 1.5 m | 12.3 m x 0.84 m | 15 m x 1.37 m |
Signal bandwidth | 0 - 240 MHz | 0 - 100 MHz | 0 - 100 MHz |
Polarization | Single/Dual/Full | Single/Dual | Single/Dual/Full |
Antenna system | Waveguide slot | Waveguide crack | Microstrip |
Angle of elevation | ±20º | ±11º | ±20º |
Imaging modes | 12 | 4 | 10 |
Spatial resolution | 1-500 m | 5-20 m | 1-100 m |
Swath width | 10-650 km | 20-400 km | 20-500 km |
Design life of S/C | 8 years | 7.25 years | 7.25 years |

Satellite Technology Features
Multi-Polarization and Multi-Imaging Mode Design:The GF-3 satellite has 12 imaging modes, including spotlight, stripmap and scan, with four polarization capability. In order to realize multi-polarization and multi-imaging modes, the following design ideas were adopted:
1) Multi-polarization data is obtained by using polarization time division and a positive and negative frequency modulation slope, so as to improve the ambiguity of point targets.
2) Active phased array antenna is used to realize flexible control of imaging modes and flexible switching of wave positions. Using a waveguide slot antenna, H polarization waveguide and V polarization waveguide are designed respectively, which can effectively reduce the mutual coupling between the two antennas, improve the port isolation of the antenna, and then improve the polarization isolation of the antenna.
3) The system has a variety of LFM (Linear Frequency Modulated) signal bandwidth and time width combinations. The 12 kinds of imaging modes correspond to 18 kinds of LFM signals, with different filters used in the signal path to ensure that different bandwidth signals are suppressed.
4) To achieve multi-beam and multi-polarization, the SAR has dual receiving channels. In order to ensure the consistency of amplitude and phase in dual channels, a digital receiver scheme using intermediate frequency sampling is proposed.
5) In order to achieve dual-aperture and multi-polarization modes, a receive switching matrix is used to switch the received echo signals of different apertures of the antenna to form two receiving channels.
Multi-Polarization Phased Array SAR Antenna
GF-3 SAR satellite antenna with multi-polarization and multi-imaging modes is using the two-dimensional scanning active phased array antenna system, can realize spotlight, stripmap, scan and other imaging modes. The antenna works in C-band, has multi-polarization and provides multi-operation modes, adopting an expanded plane two-dimensional scanning active phased array antenna system. In transmit mode, the transmit link amplifies the power of the input chirp signal and radiates electromagnetic energy to the specified space. In the receiving mode, the antenna array receives horizontal or vertical polarization echo signals, and simultaneously receives dual polarized echo signals also, which are sent to the SAR central electronic equipment via a low-noise amplification link[5]. In order to realize the antenna performance detection, fault detection and isolation, the antenna can be calibrated under the control of the central electronic device. Antenna with multi-polarization, high polarization isolation, and the massive shaped beam function has a peak output power of 15360 W, using a mechanical lightweight T/R module and thin wall waveguide design technology.
The antenna deployment mechanism satisfies the functions of folding, unfolding and supporting the antenna array. The array thermal control realizes the temperature control function for the SAR antenna array surface, meeting the requirement of the use of each single electric single equipment, and guarantees the service life of the electric equipment.
The antenna is optimized on the basis of a traditional SAR satellite antenna design, and has main features as follows:
• High polarization isolation. Through the isolation of the antenna unit, the T/R module channel and the electromagnetic shielding of the cable, the antenna can simultaneously receive dual polarization (H/V) signals with a higher polarization isolation (>35 dB).
• High energy utilization efficiency and thermal control accuracy. By ensuring the higher power efficiency, improving the radiation efficiency of microwave devices, and considering the thermal control of the antenna array simultaneously, the antenna works within a reasonable temperature range to ensure the stability of the beam pointing.
• High precision control of the two dimensional beam. The amplitude and phase stability of the transceiver channel, the speed of the beam switching response, and the reliability of the dual-polarization beam control are designed to meet the requirements of the 12 modes and achieve flexible beam scanning and shaping.
• Low mass. The antenna is low mass design mainly through two approaches: one is the overall reasonable scheme during the antenna selection, reducing the amount of hardware and interconnect complexity; the other is to improve the design and technology level, increasing the intensity of integrated design.
Internal Calibration of SAR System
To realize the high-precision and quantitative application requirements for imaging data, an on-board calibration function was fully considered. A number of calibration loops were designed to cover the whole receiving and transmitting link and have the capability of polarization calibration.
The SAR system has the capability of single polarization and multi polarization calibration. Through calibration, real linear FM signal, system gain calibration, antenna pattern and gain can be obtained.
The array calibration can be divided into full array calibration and single T/R module calibration. For full range calibration, the T/R modules work simultaneously to scale full array transmit power and full array receive gain scaling; single component calibration is to monitor the RF characteristics of each T/R module. In addition, the thermal noise of the whole system can be recorded when the whole array T/R module is in its high impedance state.
The calibration circuit includes: non-delay calibration, delay reference calibration, drive amplification calibration, full array/single T/R emission calibration, full array/single T/R receiving calibration, full array transmitting receiving calibration, and noise calibration. Through the six calibration loop and the noise recording mode, the SAR system can calibrate the real chirp signal, the system gain, the antenna pattern and gain, the phase shifter, the attenuator and the network delay line component.
Thermal Control Design of the SAR Antenna
SAR antenna thermal control system, in addition to the embedded heat pipe network, opening the radiating surface and coating multilayer insulation materials and other conventional means, has also taken the advantage to control the temperature and heat during the temperature control design, by enabling a good thermal environment on orbit during the period of SAR antenna operation. SAR antenna temperature is maintained at -10ºC to +25ºC, with a single module within 2.5ºC, and a full array of the temperature gradient of <5.9ºC.
The purpose of active temperature control is to ensure that the temperature of the antenna and its equipment is not too low while maintaining the temperature consistency when the antenna is not operating for a long time. The thermal tracking temperature control technology realizes the tracking temperature control by using the heating power of active temperature control, and ensures the temperature gradient of each array of the SAR antenna to meet the requirements. The temperature control equipment acquisition installation plate full array temperature reference point temperature value, through the mounting plate used for reference temperature comparison, measures the highest temperature value and the temperature value compared with the target temperature and other temperature control loops, enabling closed loop control.
High Precision Two-dimensional Attitude Steering
The satellite has the requirement for attitude steering in both left and right flight conditions. The attitude of steering is designed to eliminate the Doppler center frequency changes caused by ellipticity over the Earth orbit, the Earth rotation and oblateness.
Grid Connected Control Technology
The satellite power system adopts a two-bus power supply system, one for platform and the other for SAR payload. The two buses are independent of each other and do not interfere with each other. The two buses are in a single spot at the whole star. The platform bus system adopts the S4R two domain control, the full adjustment bus, and the T/R bus adopts the non regulating bus.
To improve the safety of satellite power supply, when the platform bus battery fails, the payload bus can switch from the 45 V - 67.5 V into the platform required 28 V through a DC / DC converter, and supply the platform service system with power.
Autonomous Health Management
At present, the Chinese remote sensing satellite orbit management is inseparable from the support of the ground TM&TC stations. However, it is impossible for the Earth stations to track satellites in real time and not be able to take corrective actions in time. This requires the satellite to have an independent fault diagnosis and recovery function, to ensure a non-proliferation failure, hence obtain the best opportunity to deal with, and improve the satellite's viability in orbit.
The GF-3 satellite features a self health management strategy, health index, satellite real-time intelligent servo control, satellite autonomous grid control and dual frequency GPS receiver autonomous monitoring and recovery, abnormal SAR independent management and 18 further innovative measures. On-orbit testing showed that the sensitivity and the health of the satellite fault recovery time has been significantly improved, and the system can master in real-time the satellite health status, initiate the safety management strategy, enabling a reduction of the fault processing time from 190 minutes to less than 10 seconds.
Precise Orbit Determination
To satisfy the SAR imaging accuracy requirements, the real-time orbit determination accuracy of the satellite must be better than 10 m (1σ ), and the precision of post event processing is better than 20 cm (1σ). Therefore, the GF-3 satellite adopted a dual frequency GPS system to realize precise orbit determination. The dual frequency GPS system consists of one dual frequency GPS antenna, one dual frequency GPS receiver and one pre-amplifier. Based on the GPS antenna optimization design, this reduces the impact on the antenna performance of the satellite cabin, and improves the stability of antenna phase center. In the post event precise orbit determination, an orbit determination accuracy of 4 cm is realized by using a high-precision dynamic model combined with the original observations.
Launch
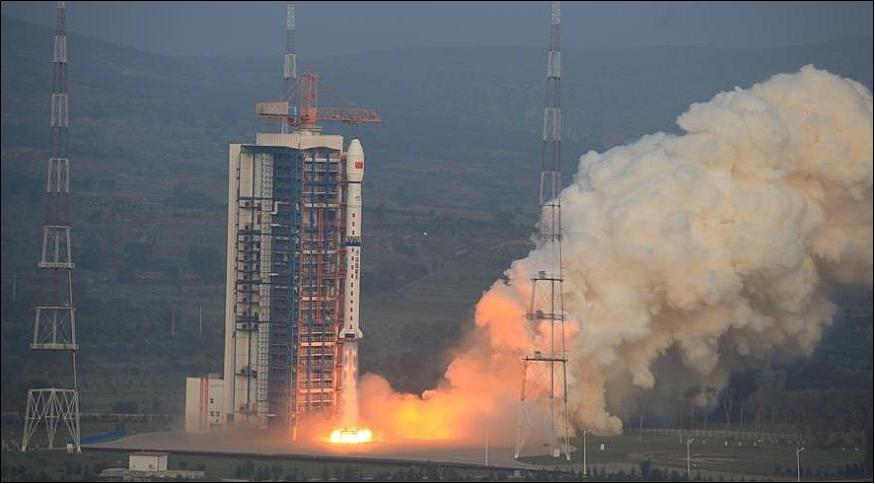
The GF-3 spacecraft of CAST was launched on 9 August 2016 (22.55 UTC, in China launch on 10 August) on a Long March-4C launch vehicle from the Taiyuan Satellite Launch Center in China. 2)
Orbit: Sun-synchronous orbit, altitude of 755 km, inclination of 98.41º.
Mission Status
• August 2019: The Gaofen-3 SAR satellite launched by the China Academy of Space Technology (CAST) is under continuous operating mode at C-band since September 2016. The main objective of this study is to present a preliminary evaluation of GF-3 quad-polarized SAR imagery for protected wetland classification. 3)
- Wetland, a multifunction ecosystem on the earth, plays a key role in the human survival and environmental sustainable development. Wetland has gradually become a headline goal of ecosystem monitoring not only for evaluation of resource development, but also for maintenance of regional ecological environment. For precise monitoring of wetland, remote sensing technology has been widely accepted by researchers with advantages of it being large-scale and cost effective. In the past decades, a significant capability of spaceborne SAR (Synthetic Aperture Radar) sensors toward wetland monitoring and observation in high spatial resolution under all-weather conditions has been revealed. Compared to single- or dual-polarized SAR, such as Canada's satellite RADARSAT-2 and Japan satellite ALOS-2, quad-polarized SAR is occupied by more polarization status which can provide more scattering details to meet the demand of fine wetland monitoring.
- Although GF-3 SAR has been operational for a period of time, only a few studies revealed its polarization capability. The application performance of GF-3 polarimetric SAR data still needs to be fully assessed. Besides, considering the significant status of GF-3 SAR in Chinese development of spaceborne SAR, it is urgent to perform capability evaluation of GF-3 SAR for different observation scenes. The main objective of this study was to demonstrate the potential of GF-3 quad-polarized SAR and present a preliminary quantitative result for wetland classification. To make an interpretation of GF-3 SAR for wetland monitoring, besides the normalized radar cross-section (NRCS) processing, the known polarization decomposition algorithms of Freeman and H/A/Alpha decomposition were further applied to four scenes of GF-3 quad-polarized SAR imagery collected over the Longbao protected plateau wetland.
- Study Area: Longbao protected plateau wetland (33.11–33.27ºN, 96.39–96.69ºE), located in Longbao town of Yushu country, Qinghai province, is a typical protected plateau wetland that is approximately 14 km long with a maximum width of about 3.5 km (Figure 5).The maximum depth of the wetland has been reported to be about 4 m; however,most part of the wetland is generally much shallow. The entire nature reserve is flanked by steep ridges that typically rise up to 750 m above the valley floor. The wetland is fed by groundwater, streams, precipitation, snowmelt, and it drains into the Yi Chu River to the northwest, a short tributary of the nearby Tongtian River.
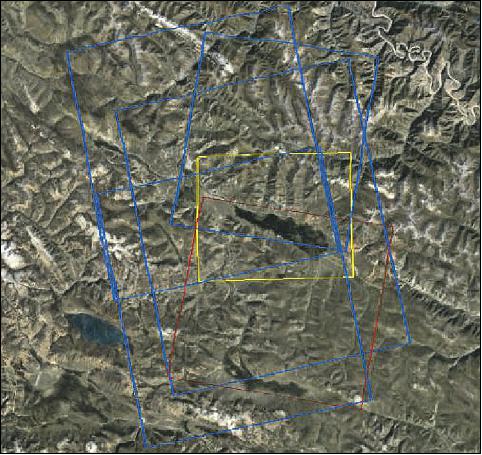
- GF-3 Quad-Polarized SAR Data: Four scenes of GF-3 quad-polarized SAR imagery were collected in this study. The main specifications of GF-3 quad-polarized SAR used are listed in Table 3.The imagery coverage of collected GF-3 SAR is shown in Figure 5, together with Longbao protected plateau wetland scope.
Scene ID | Acquisition Time (UTC) | Polarization | Resolution (m) | Swath Width (km) |
3377378 | 2017-2-27 | QPSI | 8 | 30 |
3741512 | 2017-6-6 | QPSI | 8 | 30 |
3842536 | 2017-7-5 | QPSI | 8 | 30 |
5714664 | 2017-11-3 | QPSI | 8 | 30 |
For further information, the reader is referred to Ref. 3).
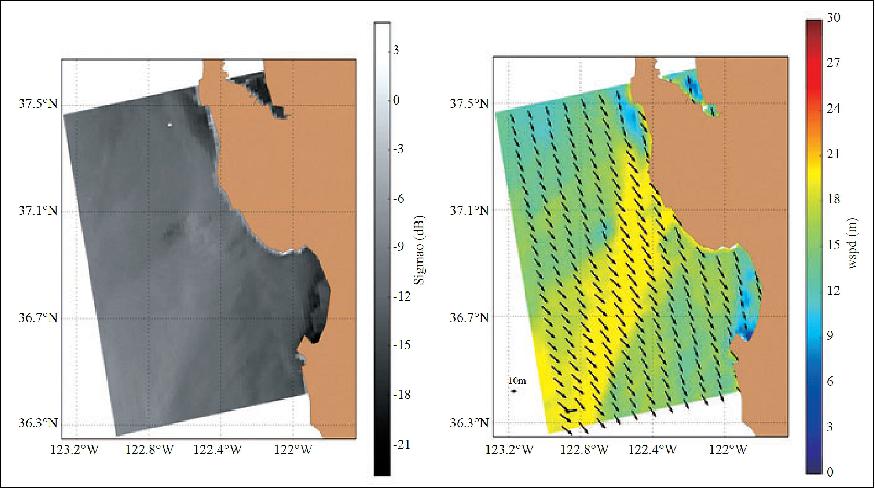
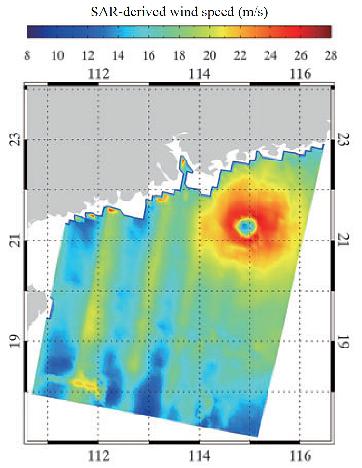
• April 4, 2019: Ocean wind is the major force of global ocean circulation and is typically measured by anemometers onboard buoys, platforms, and ships very close to the sea surface. The most common reference height of ocean wind measurements is 10 m above the sea surface, and this wind is customarily called SSW (Sea Surface Wind). The ocean is vast and dynamic, and SSW exhibits considerable spatial and temporal variations. Consequently, advanced techniques for observing SSW from space, involving both active and passive remote sensors, present different unique advantages. 4)
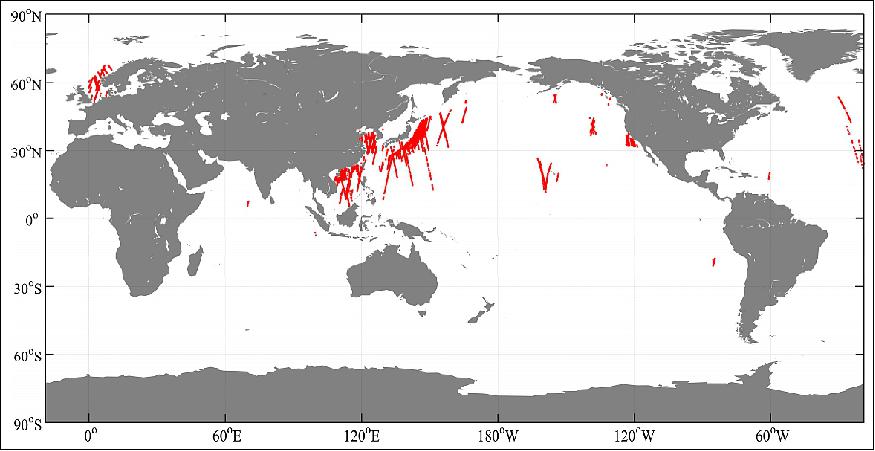
- GF-3 QPS (Quad Polarization Stripmap) Mode Data: The GF-3 QPS mode has two subclasses, i.e., the quad-polarization strip I (QPSI) and the quad-polarization strip II (QPSII). Their specifications are listed in Table 4. The project collected 3,170 QPS mode scenes that were acquired from October 2016 to May 2018, including 2948 Level-1A (single-look-complex) scenes, 17 Level-1B (intensity), and 205 Level-2 (geometric correction) scenes. Most of the collected QPS mode data are located in the China Seas and the seas off Japan, as shown in Figure 6.
Mode | Incidence Angle (º) | Nominal Resolution (m) | Swath Width (km) |
QPSI | 20-41 | 8 | 25 |
QPSII | 20-38 | 25 | 40 |
Based on this study and the recent study of Li et al., 5) we can conclude that SSWS retrieval from different polarizations of the current GF-3 QPS data has accuracy of a bias of less than 0.3 m/s and an RMSE of 2.0 ± 0.2 m/s depending on various comparison datasets.
For further information, the reader is referred to Ref. 5).
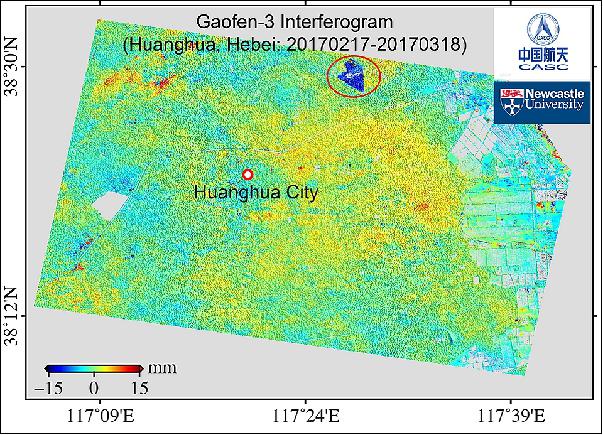
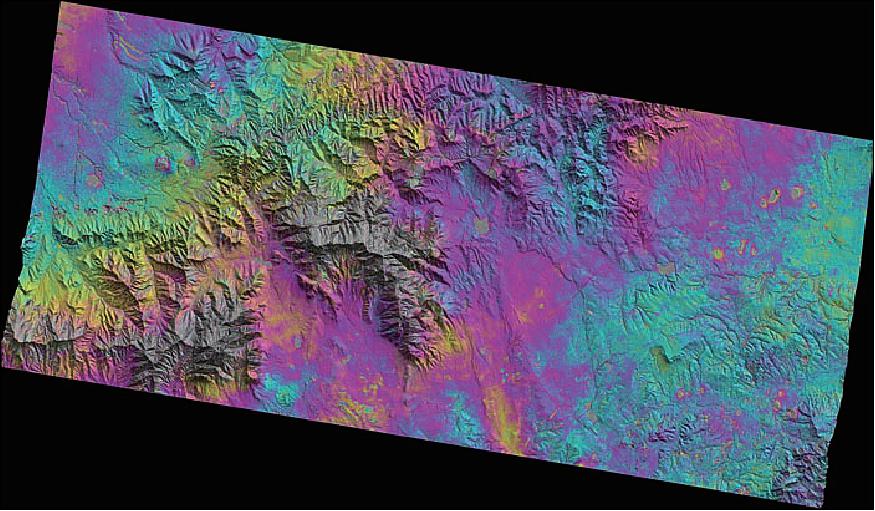
• 2017: An international collaboration between Professor Zhenhong Li's team at Newcastle University and the China Academy of Space Technology (CAST) has generated interferograms using Chinese Gaofen-3 (GF-3) imagery for the first time. These are also the first interferograms from Chinese SAR missions. 6)
- The GF-3 satellite mission was officially put into operation at the end of January 2017. Initial imaging was provided after successful on-orbit testing following its launch on 10 August 2016.
![Figure 7: GF-3 interferogram around Shanghai, China (20161114-20170310): (i) Time span: 116 days; Spatial baseline (orbital separation): 598 m; (ii) the long-wavelength parallel fringes are caused by the uncertainties in satellite orbital positions; (iii) About two fringes are observed in the area indicated by a red rectangle, implying c. 5.6 cm of subsidence (likely caused by groundwater extraction) during the 116-day period [image credit: Newcastle University, CASC (Chinese Aerospace Corp. of Beijing)]](/api/cms/documents/163813/5300271/Gaofen3_AutoC.jpeg)
- Figure 8 shows one GF-3 interferogram over the city of Huanghua, Hebei Province in China. It is clear that Nandagang Wetland Conservation Area exhibited uplift signals even during such a short period (only 29 days).
- "GF-3 is China's first high resolution SAR satellite. In the satellite development phase, we managed to develop and/or implement nine key technologies including multi-mode combined ocean and land imaging and multi-polarized phased array antenna." said Professor Qingjun Zhang, CAST's GF-3 Mission Manager.
- "In the operational phase, we generated the first GF-3 interferogram; this was also the first time that an interferogram was produced from Chinese SAR satellites, which really is a milestone in China radar community."
- Professor Li, the European Lead PI of ESA-MOST Dragon-4, added "Our experiments have demonstrated that the GF-3 phase quality is in a high standard with a high spatial resolution (3.5 m in azimuth and 5.5 m in range), leading to high coherence even for interferograms with a spatial baseline of about 600 m and a temporal baseline (time span) of nearly 4 months."
• After its launch in August 2016, the GF-3 satellite has acquired thousands of scenes, provided a large number of image data for the State Oceanic Administration, the Ministry of Civil Affairs, Ministry of Water Resources, Meteorological Bureau, State Administration of Science, Technology and Industry for National Defence, and the national security departments and other users. The GF-3 satellite has obtained major global ocean wind field and wave field information, especially after the implementation monitoring and forecasting on typhoon "Tiange". Combining the GF-3 satellite, HY-2 satellite and GF-4 satellite, China has greatly improved its capability of marine surveillance, monitoring and typhoon warning (Ref. 1).
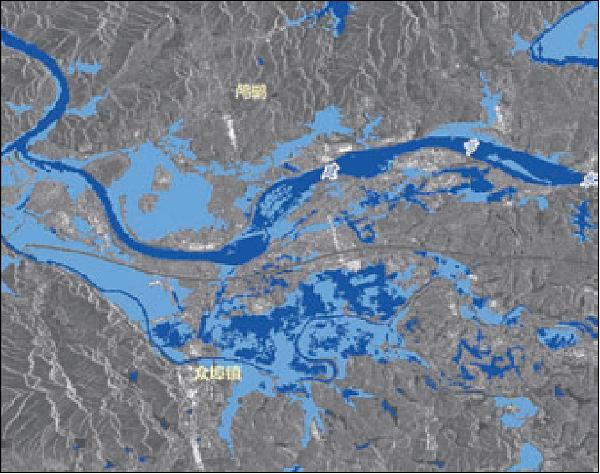
- In 2017, the GF-3 satellite obtained high precision images of the Sichuan landslide, the Jiuzhaigou earthquake and southern China heavy rainfall for the first time, providing important information supporting the implementation of disaster rescue and disaster assessment.
- The GF-3 satellite has also carried out the verification work in orbit of various new systems and new technology which are 0.5 m resolution images (range direction), through differential interferometry for deformation monitoring of ground centimeter, ground moving target detection.
In summary, the GF-3 satellite has successfully obtained high resolution multi-polarization microwave images, greatly changing the situation in the past when Chinese civilian high resolution SAR images all relied on imports, providing high quality and precision Earth observation data for domestic users in various industries. The development of the GF-3 satellite project will play an important exemplary role in guiding the application of civil high resolution microwave satellite remote sensing in China.
Its development and application are of great significance. According to the "Chinese national spatial infrastructures program", there will be three satellites, the GF-3 satellite and two follow-on satellites in orbit in 2020, which will further support and promote the construction and development of the civil military integration of space-based information systems, while becoming an important technical support tool for the implementation of marine development, China land resources and environment monitoring and disaster prevention and mitigation.
Sensor Complement
C-SAR (C-band Synthetic Aperture Radar)
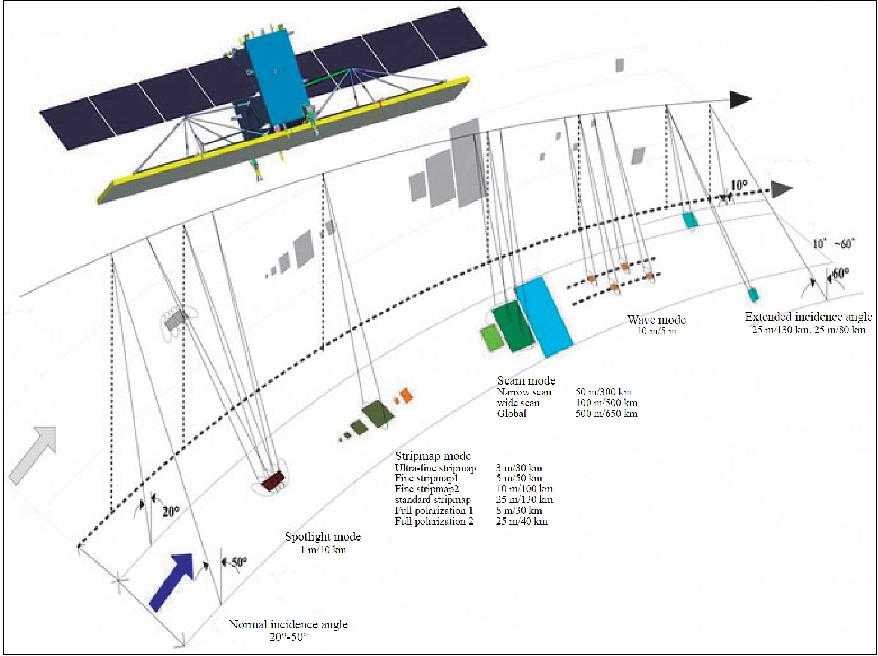
Requirements: In order to meet the multi-user technical requirements, twelve observing modes were proposed, as listed in Table 5. 7)
Observing mode | Incidence angle (º) | Nominal resolution (m) * | Nominal swath width (km) | Polarization |
Spotlight (p) | 20~50 | 1 | 10 x 10 | single |
Ultra-fine stripmap (UF) | 20~50 | 3 | 30 | single |
Fine stripmap (F) | 19~50 | 5 | 50 | dual |
Wide fine stripmap (WF) | 19~50 | 10 | 100 | dual |
Standard stripmap (S) | 17~50 | 25 | 130 | dual |
Narrow ScanSAR (NS) | 17~50 | 50 | 300 | dual |
Wide ScanSAT (WS) | 17~50 | 100 | 500 | dual |
Global observation (G) | 17~53 | 500 | 650 | dual |
Quad-pol stripmap (Q) | 20~41 | 8 | 30 | quad |
Wide quad-pol stripmap (WQ) | 20~38 | 25 | 40 | quad |
Wave (WV) | 20~41 | 10 | 5 x 5 ** | quad |
Expanded incidence angle(E) | 10~20 | 25 | 130 | dual |
50~60 | 25 | 80 | dual |
Note: * After multi-look processing. ** Image is discontinuous in azimuth, x 10 and x 5 refer to the azimuth length in one acquisition.
The resolution varies from 1 m to 500 m, and the swath varies from 10 km to 650 km. The SAR payload has to support operation in single-polarization (HH or VV), dual-polarization (HH+HV or VH+VV), and quad-polarization (HH+HV+VH+VV) with respect to the observing modes. These characteristics, which vary largely due to multi-user requirements, present great challenges to the SAR system design.
To obtain 1 m azimuth resolution in P mode, sliding spotlight technology is utilized, which means the SAR payload has to provide fast antenna beam steering in the azimuth. The large swath modes have to be implemented as ScanSAR modes which means a fast beam scanning capability in elevation. To obtain 3 m azimuth resolution and continuous measurements in the UF mode, the equivalent azimuth antenna size should be less than 6 m according to the SAR imaging principle. To meet the requirement of high Doppler bandwidth sampling and ambiguity in UF mode, the SAR payload has to transmit in one beam and receive in two beams with different phase centers. In the E mode, the incidence angle is out of the scale of other modes, i.e., larger beam scan angle in the case of fixed embedded antenna. In this case, the sidelobes of the antenna beams have to be low enough to satisfy the ambiguity requirement.
Considering all items listed above, an active phased array antenna is employed, with a 15 m (azimuth) x 1.232 m (elevation). This allows the fast scanning of the antenna beam both in elevation and azimuth, and it can obtain low sidelobes in the case of large scan angle by amplitude and phase optimization. Two Rx channels are necessary for the dual-polarization modes and time-division quad-polarization modes, as well as the single-polarization dual-beam receiving mode, i.e., the UF mode. A microwave switch unit is needed for switching the input signal from the antenna to the two Rx channels.
Observation Modes
From the perspective of SAR imaging technology, the 12 observing modes can be classified into six groups.
• P Mode: The P mode employs sliding spotlight technology to raise the azimuth resolution (1 m) at the cost of observing discontinuity. In this mode, only half of the whole antenna aperture in the azimuth, i.e., 7.5 m, is used, which can be any two adjacent panels (A + B or B + C or C + D), and in the meanwhile, the other two panels are powered off to reduce the power consumption. With the maximum beam scanning angle of ± 1.9º, a 1 m resolution in the 10 km azimuth imaging length is guaranteed. In elevation, chirp signal with 240 MHz bandwidth achieves 2.29 m~0.98 m ground resolution with respect to 20º~50º incidence angle.
• UF Mode: UF mode works in the single-transmit multiple-receive (SIMO) method to reduce the minimum PRF (Pulse Repeat Frequency) needed for Doppler bandwidth, consequently improving the ambiguity. Only half of the whole antenna aperture in the azimuth is used, the same as in P mode, but some differences exist in detail of usage. In UF mode, B + C antenna panels are used in transmitting power, and the azimuth width of the transmitting beam is broadened 1.7 times to fit the receiving beam. The B panel and C panel receive backscattering signals separately, which form a two-beam receiving mechanism in order to reduce PRF by means of increasing space sampling. Accordingly, the two Rx channels are supposed to be switched to the signals of two antenna panels in the same polarization.
• Quad-Polarization Stripmap Modes: The quad-polarization stripmap modes, i.e., Q and WQ modes, work in time-division operation architecture. The SAR system transmits Horizontal (H) or Vertical (V) polarization pulses in alternate Pulse Repeat Frequency (PRF), whereas it receives backscattering signals in both H and V polarizations. Furthermore, inverse modulation slopes are employed in chirp signal transmitting of H and V polarization. As shown in Figure 13, the H polarization transmitting signal is modulated in the positive slope, and, correspondingly, the V polarization is modulated in the negative slope. The inverse slopes in signal modulation can effectively suppress the cross-polarization ambiguity generated by strong back-scattering ground objects.
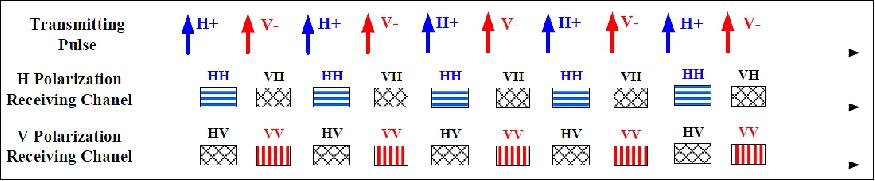
All antenna aperture is used in transmitting and receiving. The differences in realization between Q and WQ modes are the partial parameters used in measurement, such as beam pointing and width, signal bandwidth, and looks in image processing with respect to the resolution and swath requirements of the two modes.
• WV Mode: The WV mode also works in time-division quad-polarization operation architecture, but is different in measurement continuity from the other two quad-polarization modes (Q, WQ). It measures a series of small square areas which are dispersed along one or two incidence angles. WV mode is actually a discrete sample mode for a large-scale homogeneous earth surface, generally the sea surface. The SAR payload can work in WV mode for more than 50 min in one acquisition because its discontinuous operation reduces the average power and data column tremendously. WV mode uses the same antenna beams as Q mode. Measurement duration and acquisition time are precisely controlled according to the size of the single observing area (5 km x 5 km normally) and spacing between neighboring areas (50 km normally).
• Dual-Polarization Stripmap Modes: The F, WF, S, E modes obtain dual-polarization measurements in the stripmap method. The main differences among these modes are parameters used in measurement, including beam pointing and width, signal bandwidth, and looks in image processing with respect to the resolution and swath requirements. E mode is special because its incidence angle is out of the scale of other modes, which can expand the observing capability to some extent in order to reduce the revisiting interval time.
• ScanSAR Modes: The NS, WS, G modes work in the ScanSAR method to cover a larger swath. They use the same antenna beams as the S mode which covers an approximately 130 km swath in every beam. Considering the overlap between adjacent beams, NS, WS, and G modes employ three, five, and seven adjacent beams, respectively, to compose the required swath. It is worth mentioning that G mode can work for more than 30 min in one acquisition, since the power consumption is reduced considerably by cutting down the transmitting duty cycle (about 1.6%), and the data rate is very low by using 2 MHz signal bandwidth.
Inner Calibration Modes
Besides these observing modes, several inner calibration modes are designed to acquire the performance and operating states of the SAR payload. Unlike the external calibration, the inner calibration is supposed to be carried out before and after every observing operation, and even be interjected into the midst of the observing operation, which means monitoring the performance of the SAR payload more frequently.
C-SAR Payload Design
The SAR antenna was divided into four panels which can be powered up separately in order to meet the demand of antenna aperture size coming from the complicated observing modes. The four panels are mounted in a folded configuration at the two opposite sides of the spacecraft before launch, as shown in Figure 1.
Center frequency | 5.4 GHz |
Polarization | single, dual, quad |
Antenna size | 15 m (azimuth) x 1.232 m (elevation) |
Number of panels | 4 |
Array columns (azimuth) | 24 |
Array rows (elevation) | 64 (32 in H, 32 in V) |
Radio Frequency (RF) Peak Power | 15,360 W |
Average power consumption | 8 kW max |
Pulse width | 10–60 µs (programmable) |
Signal bandwidth | 2~240 MHz (programmable) |
Transmit duty cycle | 20% max |
Receiver Noise Figure (at Module Input) | 2.5 dB max |
Receiver channels | 2 |
PSF (Pulse Repetition Frequency) | 1000~6000 Hz (programmable) |
Sampling frequency | 533.33 MHz (IF sampling) |
Data quantization | 8 bits |
Data compression | Block Adaptive Quantization (BAQ) 3 bits; BAQ 4 bits, High-4 bits, 8 bit (selectable) |
Output data rate | 1280 Mbit/s max |
After the launch and orbit adjustment, a deployable mechanism deploys the panels from a stowed launch configuration into its deployed in-orbit configuration. Before SAR operation, the antenna has to point to -31.5° (right-looking) or +31.5° (left-looking) relying on the roll steering of the satellite platform; this dual-side looking capacity is valuable in reducing the revisit interval time. Zero Doppler steering, which employs yaw and pitch steering to eliminate Doppler center frequency shift, was introduced to GF-3.
SAR Antenna Subsystem
The SAR payload employs a deployable planar active phased array antenna which is 15 m (azimuth) x 1.232 m (elevation) in size. The antenna consists of 1536 transmit-receive channels, which are organized in 24 columns (azimuth) and 64 rows (elevation), and distributed over 4 panels.
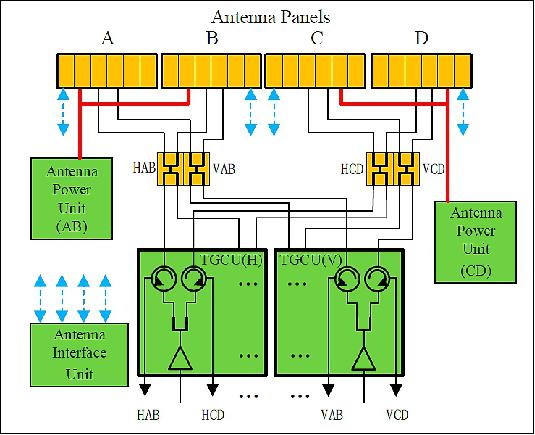
The power of the whole antenna is supplied by two APUs (Antenna Power Units), which distribute a power bus to four antenna panels and control the aperture configuration by enabling or disabling the direct current (DC) converter in each panel.
The Antenna Interface Unit (AIU) controls all antenna beam forming and steering functions by receiving commands from the electronics subsystem, interpreting the commands, and distributing the beam control commands to four panels in the form of data bus. The phase and gain settings of all elevation beams, including 205 right-looking and 205 left-looking beams, are stored in AIU. The AIU obtains the phase and gain settings of the azimuth steering beam by means of in-orbit calculation.
Transmitting Gain and Circulator Units (TGCU) amplify the transmitting signals received from electronics subsystem to drive the antenna, receive signals from the antenna, and send them to the electronics subsystem. Circulators are involved to separate the transmitting and receiving routes interfacing with the electronics subsystem. Two TGCUs are used to drive and receive from the antenna for H and V polarization respectively.
When transmitting, the signal waveform is amplified by the Radio Frequency (RF) power amplifier and split by a 1:2 divider in TGCU to drive the H or V polarization antenna. The selection of transmitting polarization can be easily applied by enabling the corresponding amplifier located in TGCU. The polarization selection of antenna panels by timing control is also necessary since it can raise the cross-polarization isolation. The H or V polarization signals received from the A and B panels are combined, named HAB or VAB, and then split into two signals, in order to form redundant RF routes to raise the system reliability, as well as signals from the C and D panels.
An electrical block diagram of one antenna panel is given in Figure 15. At the panel level, RF interconnection between the columns and the rest of the radar is provided by three identical 1:6 power dividers. The control bus and power bus are distributed from panel ports to six column modules.
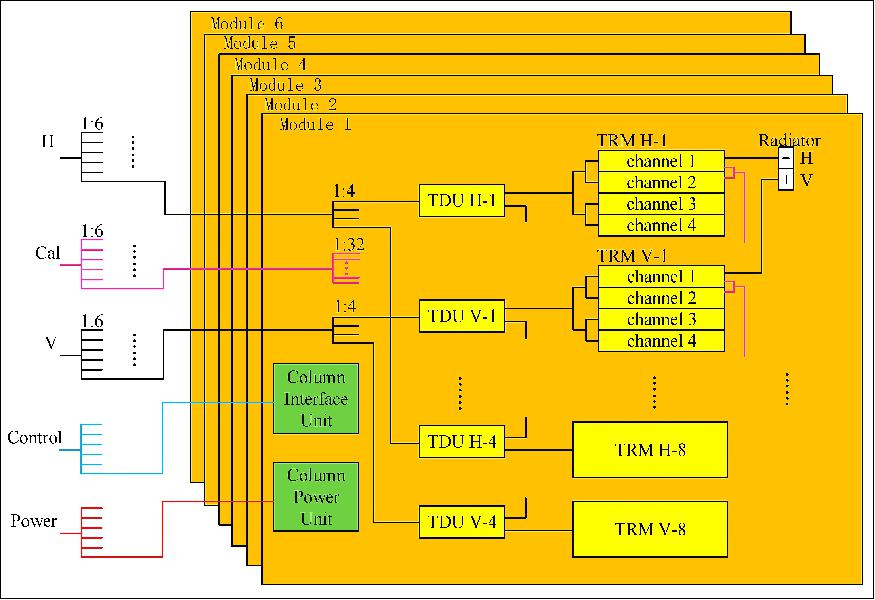
The antenna is a modulated design that defines a column as a standard module, which consists of one Column Interface Unit (CIU), one Column Power Unit (CPU), eight Time Delay Units (TDU), 16 Transmit-Receive Modules (TRM), 32 dual-polarization radiators, three power dividers, and the elevation plane distribution network.
At the column module level, two 1:4 and one 1:32 power dividers are used to interface with the rest of the antenna panel in the RF path. The 1:4 divider distributes H or V signals to the TDU for transmission, and combines the received signals from the TDU ports into H or V output column RF ports. The 1:32 divider is placed between the TRM calibration ports and the column calibration port to distribute or combine H and V inner calibration signals.
Four Transmit-Receive (TR) channels are embedded in one TRM with only one interface with the TDU. Each patch radiator has H and V feeds, which are completely separate on transmitting and signal reception, and connects with two TR channels in H and V polarization, respectively.
A waveguide slot radiator is used to reduce cross polarization and raise radiation efficiency. The selected row spacing of the radiator enables the antenna with a ±20° scanning angle in elevation without exciting grating lobes, which is sufficient and necessary for covering the look angle requirement by twelve observing modes, especially E mode. However, column spacing of the radiator is hard to fit the strict requirements of low grating lobes in the case of a ±1.9° scanning angle in the azimuth needed by the P mode. Fortunately, the grating lobe can be kept from deteriorating in azimuth ambiguity by selecting the proper PRF.
CIU receives commands and timing signals of H and V polarization from AIU. After being interpreted and converted, commands and timing signals are issued to 8 TDUs and 16 TRMs to control beam formation and the transmit-receive switch. CPU converts high-voltage DC power to low-voltage DC power, and distributes it to all active units in the column, including TDUs, TRMs, CIUs.
SAR Electronics Subsystem
The SAR electronics subsystem has the redundant design in most components, it provides the following functions:
- Redundancy control, scheduling, mode definition, timing control
- Transmitted signal generation
- Received signal conditioning
- Quantization, data compression, data formatting.
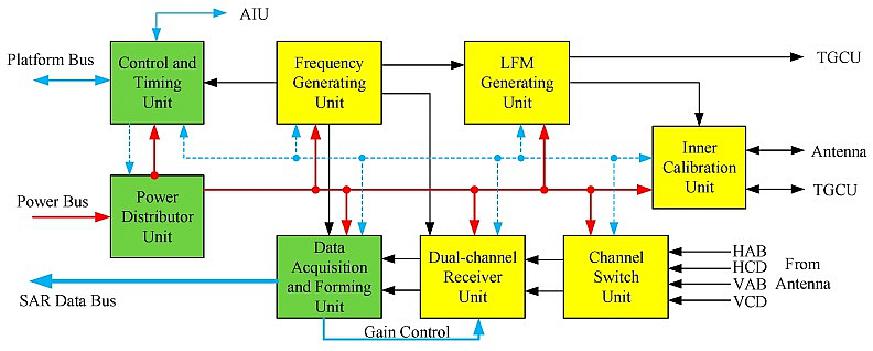
By means of the communication bus, the Control and Timing Unit (CTU) receives commands from the satellite platform and sends state monitoring data to it. CTU controls the powering up, timing sequence, observing process, and configuration of the SAR payload. In the meantime, the AIU monitors the operating state of the electronics subsystem and the operating state of the antenna subsystem through a specialized data bus.
The Power Distributor Unit (PDU) distributes the platform power bus to all units of the SAR electronics subsystem, as well as AIU and TGCUs of the antenna subsystem, and powers up these units under the control of the CTU and satellite platform. Considering the various demands of the secondary power supply, the DC-DC converters are scattered in the other units instead of being assembled in the PDU.
Based on a high stability oscillator, a Frequency Generating Unit (FGU) generates the synchronous reference frequency signals needed by other units. According to the pulse width, bandwidth, modulation slope, and timing control received from the CTU, the Linear frequency modulated signal Generating Unit (LGU) employs in-orbit real-time calculations to generate the chirp signal waveforms and sends it to the TGCU and Inner Calibration Unit (ICU) after modulation, up-conversion, filtering, and amplifying. On account of the multiple bandwidth demands, eight-bandwidth filtering is supported by the filter bank in LGU.
The four RF signals (HAB, HCD, VAB, and VCD) received from the antenna system are selected or combined in the Channel Switch Unit (CSU) according to the observing modes. In the UF mode, HAB and HCD are selected as the two output signals of the CSU when observing in H single polarization, as well as VAB and VCD in V polarization. In other modes, HAB and HCD are combined into one output of CSU, as well as VAB and VCD are combined to be another one.
Containing two parallel receiver channels, the Dual-channel Receiver Unit (DRU) down-converts the two RF signals into Intermediate Frequency (IF) with selected gain which is controlled by the Data Acquisition and Forming Unit (DAFU). The gain of the DRU can be manually controlled, which means the gain setting responds to the ground command, or can be automatically controlled, which means the settings are adjusted automatically according to the in-orbit calculation results of the DAFU. The same IF filter banks as used in LGU are employed in DRU to cope with different bandwidth signals.
The IF signals are brought into analog-to-digital conversion directly in the DAFU with a sampling frequency of 533.33 MHz. Signal demodulation and filtering are implemented in the digital domain. Down sampling is applied to cut down the SAR raw data rate in case of low signal bandwidth. The two data streams are compressed using 3-bit or 4-bit Block Adaptive Quantization (BAQ) algorithms or a high 4-bit interception algorithm. The selection of compression algorithms as well as the acquisition start time and duration is controlled by the CTU, which interprets the observation commands received from the satellite platform. The compressed data and auxiliary data are formatted according to the observing mode and compression method to form the SAR raw data package. In the inner calibration modes, the auxiliary data and the uncompressed data, which contain the replica of the transmitted waveform, are formatted to form the SAR raw data package.
Inner calibration is carried out in the SAR payload by forming transmit-receive closed RF loops which are achieved by the Inner Calibration Unit (ICU) and the calibration network. The ICU has RF switches, delayed and non-delayed RF paths, and interfaces with the LGU, antenna, and the TGCU. RF loops are formed and switched by controlling the state of the RF switches in the ICU.
SAR Performance
The predicted performance of the SAR sensor was determined by simulation in the system design stage. Based on the ground test results of the SAR payload, a more accurate performance was calculated before satellite launching, which was verified by in-orbit tests and evaluations, as shown in Table 7.
Parameter | Properties | Comments |
Polarization isolation | ≥35 dB |
|
Polarization amplitude unbalance | ≤0.26 dB | Fixed bias compensated |
Polarization phase unbalance | ≤4.15º | Fixed bias compensated |
Noise Equivalent Sigma Zero (NESZ) | ≤-19.5 dB | P, UF, F, WF, Q, WV modes |
Azimuth ambiguity | ≤-20.1 dB | P, UF, F, WF, Q, WV modes |
Range ambiguity | ≤-20.0 dB |
|
Peak Side Lobe Ratio (PSLR) | ≤-22.8 dB | P, UF, F, WF, Q, WV modes |
Integrated Side Lobe Ratio (ISLR) | ≤-16.7 dB | P, UF, F, WF, Q, WV modes |
Radiometric resolution | ≤3.50 dB | P, UF, F, WF, Q, WV modes |
Absolute radiometric error | ≤1.5 dB |
|
Relative radiometric error | ≤1.0 dB |
|
The azimuth and range ambiguity calculated in the 2D distributed target model is guaranteed by the selected antenna size and beam optimization. The thorough separation of RF routes in H and V polarization raises the polarization isolation performance. Low receiving noise figure, high-efficiency radiator, sufficient antenna gain, and high emission power all contribute to the NESZ. The properties listed in Table 7 are the worst case scenarios in the corresponding incidence scale of the observing modes.
References
1) Qingjun Zhang , Yadong Liu, "Overview of Chinese First C-Band Multi-Polarization SAR Satellite GF-3," Aerospace China,Volume 18,No.3,2017, URL: www.aerospacechina.org/CN/article/download
ArticleFile.do?attachType=PDF&id=170
2) "China's Long March 4C lifts off with Gaofen-3 Radar Satellite," Spaceflight 101, 9 August 2016, URL: http://spaceflight101.com/chinas-long-march-4c-lifts-off-with-gaofen-3-radar-satellite/
3) Qiufang Wei, Yun Shao , and Xiaochen Wang, "Preliminary Evaluation of Gaofen-3 Quad-Polarized SAR Imagery for Longbao Protected Plateau Wetland Reserve," Hindawi, Journal of Sensors, Volume 2019, Article ID 8789473, https://doi.org/10.1155/2019/8789473, Published: 20 August 2019, URL: http://downloads.hindawi.com/journals/js/2019/8789473.pdf
4) Tianyu Zhang, Xiao-Ming Li , Qian Feng, Yongzheng Ren, and Yingni Shi, "Retrieval of Sea Surface Wind Speeds from Gaofen-3 Full Polarimetric Data," Remote Sensing, Volume 11, No 7, Published: 4 April 2019, https://doi.org/10.3390/rs11070813, URL: https://www.mdpi.com/2072-4292/11/7/813/htm
5) Li Xiao-Ming, Tianyu Zhang, Bingqing Huang and Tong Jia, "Capabilities of Chinese Gaofen-3 Synthetic Aperture Radar in Selected Topics for Coastal and Ocean Observations," Remote Sensing, Volume 10, No 12, https://doi.org/10.3390/rs10121929, Published: 30 November 2018, URL:
https://www.mdpi.com/2072-4292/10/12/1929/htm
6) "Success in Chinese radar mission: First interferograms from Gaofen-3," COMET NERC News, 2017, URL: https://comet.nerc.ac.uk/success-chinese-radar-mission-first-interferograms-gaofen-3/
7) Jili Sun, Weidong Yu, and Yunkai Deng, "The SAR Payload Design and Performance for the GF-3 Mission," Sensors, Volume 17, Issue 10, https://doi.org/10.3390/s17102419 Published: 19 October 2017, URL: https://www.ncbi.nlm.nih.gov/pmc/articles/PMC5677308/
The information compiled and edited in this article was provided by Herbert J. Kramer from his documentation of: "Observation of the Earth and Its Environment: Survey of Missions and Sensors" (Springer Verlag) as well as many other sources after the publication of the 4th edition in 2002. - Comments and corrections to this article are always welcome for further updates (eoportal@symbios.space).
Spacecraft Launch Mission Status Sensor Complement References Back to top