ESA-CCI (European Space Agency-Climate Change Initiative)
Applications
ESA-CCI (European Space Agency-Climate Change Initiative)
Permafrost Thawing
• January 27, 2022: One of the many serious consequences of the climate crisis is that precious permafrost is thawing, and this is unleashing even more carbon to the atmosphere and further exacerbating climate change. However, it’s complicated. For example, sometimes permafrost can thaw rapidly and scientists are unsure why and what these abrupt thaws mean in terms of feedback loops. This makes it difficult to predict the future impact on the climate. Thanks to an ESA–NASA initiative, new research digs deep into understanding the complexities of permafrost thaw and how carbon is released over time. 1)
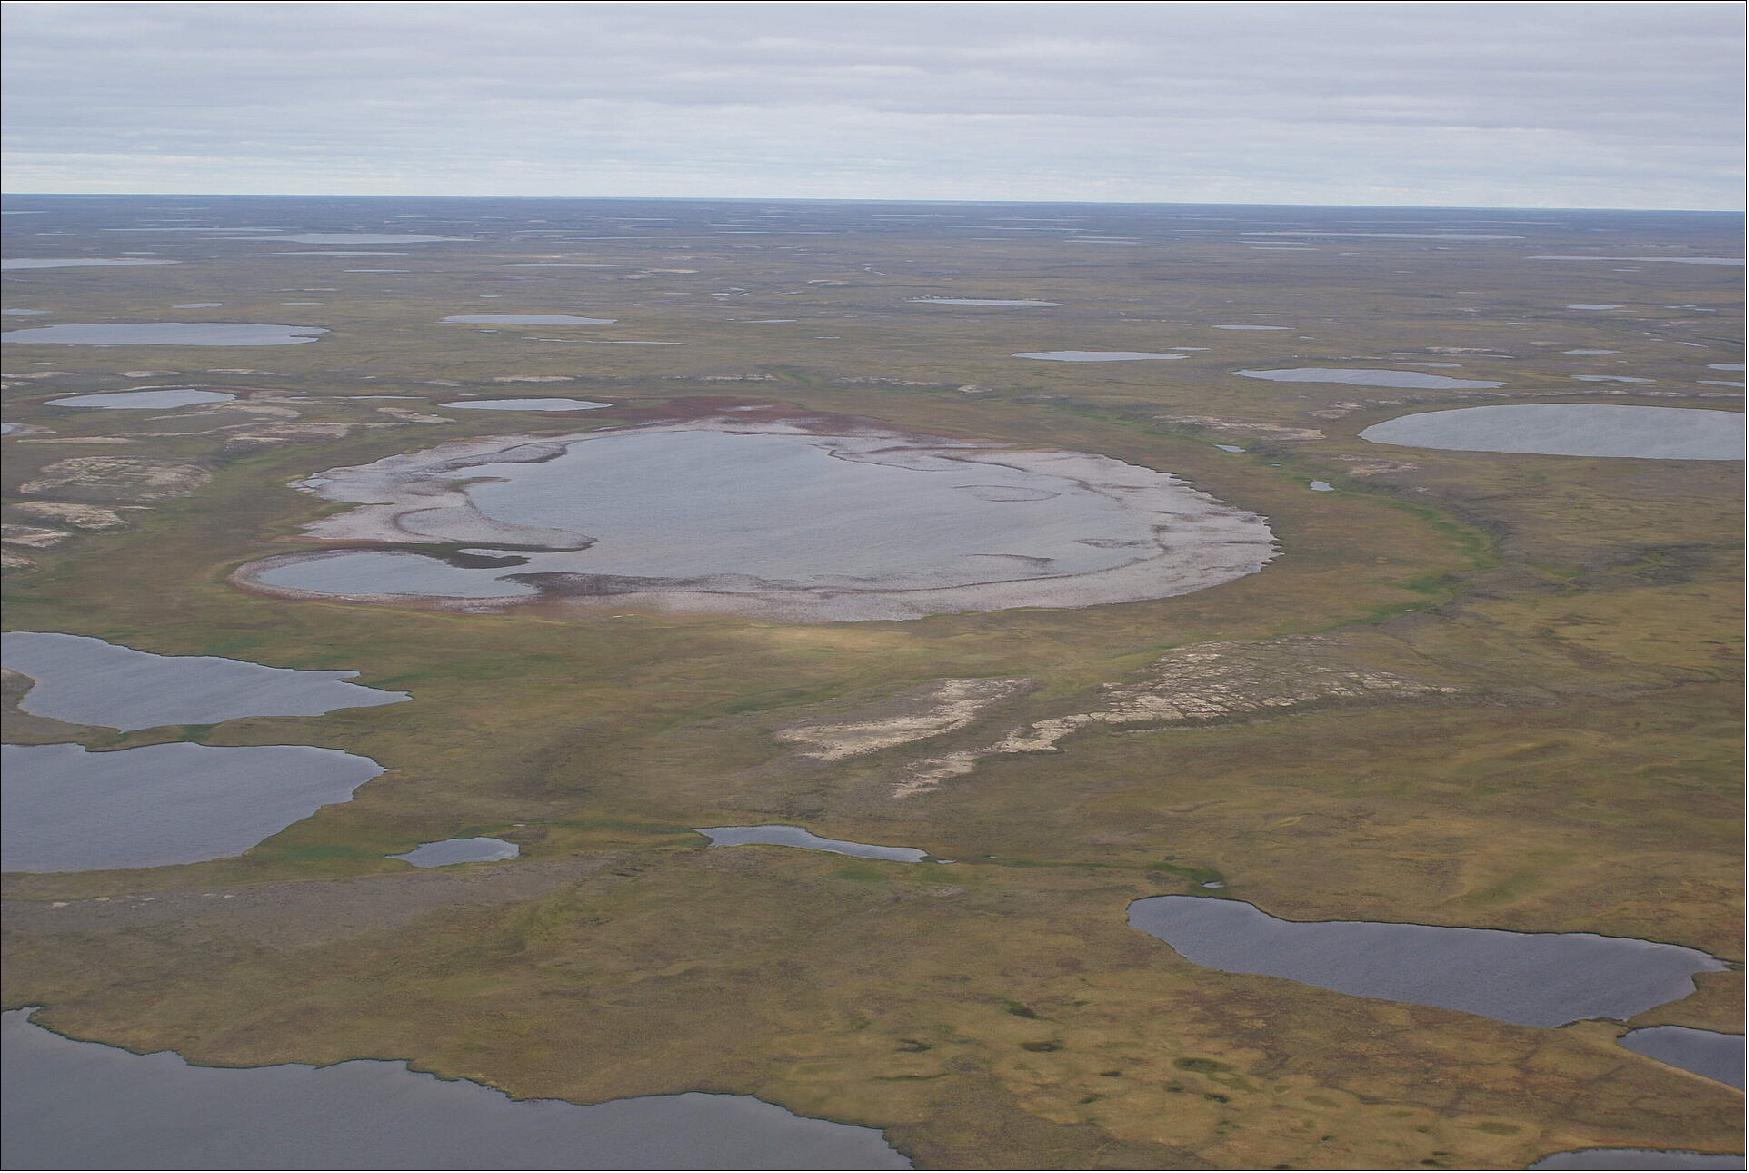
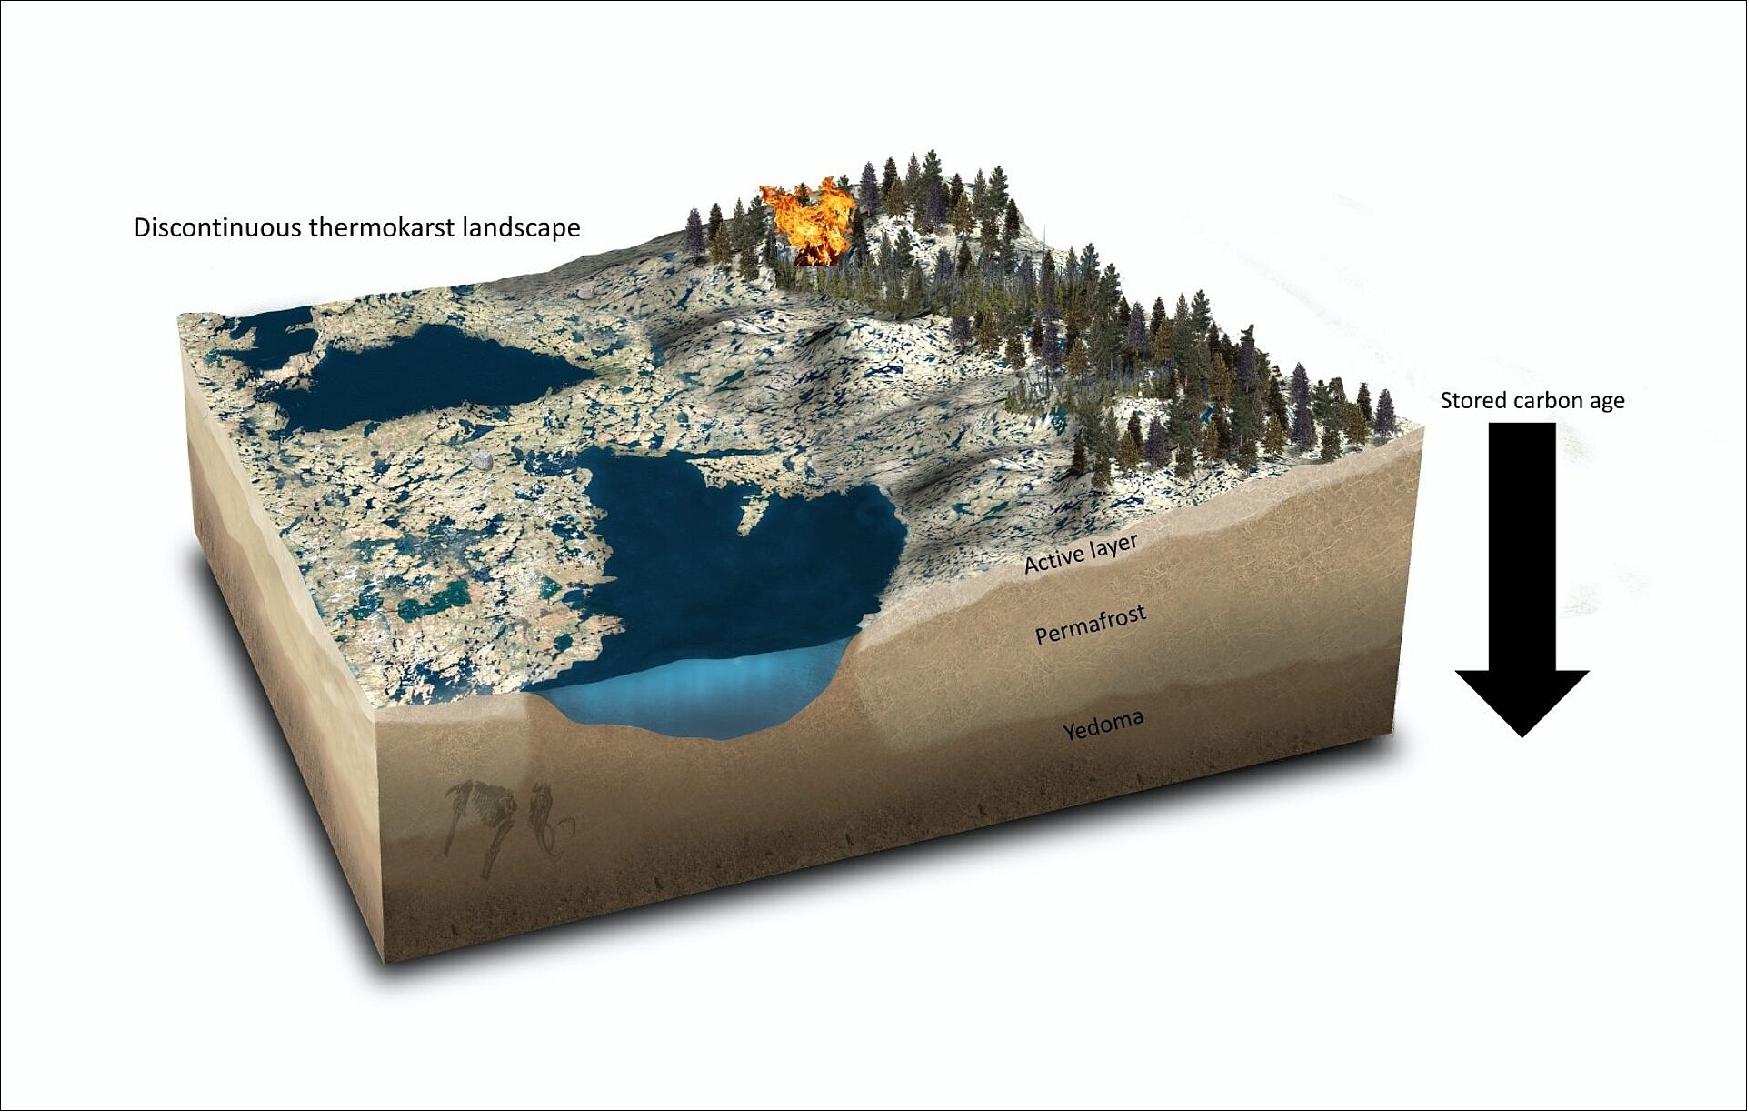
- Permafrost is frozen soil, rock or sediment – sometimes hundreds of metres thick. To be classified as permafrost, the ground has to have been frozen for at least two years, but much of the subsurface in the polar regions has remained frozen since the ice age. Permafrost holds carbon-based remains of vegetation and animals that froze before decomposition could set in.
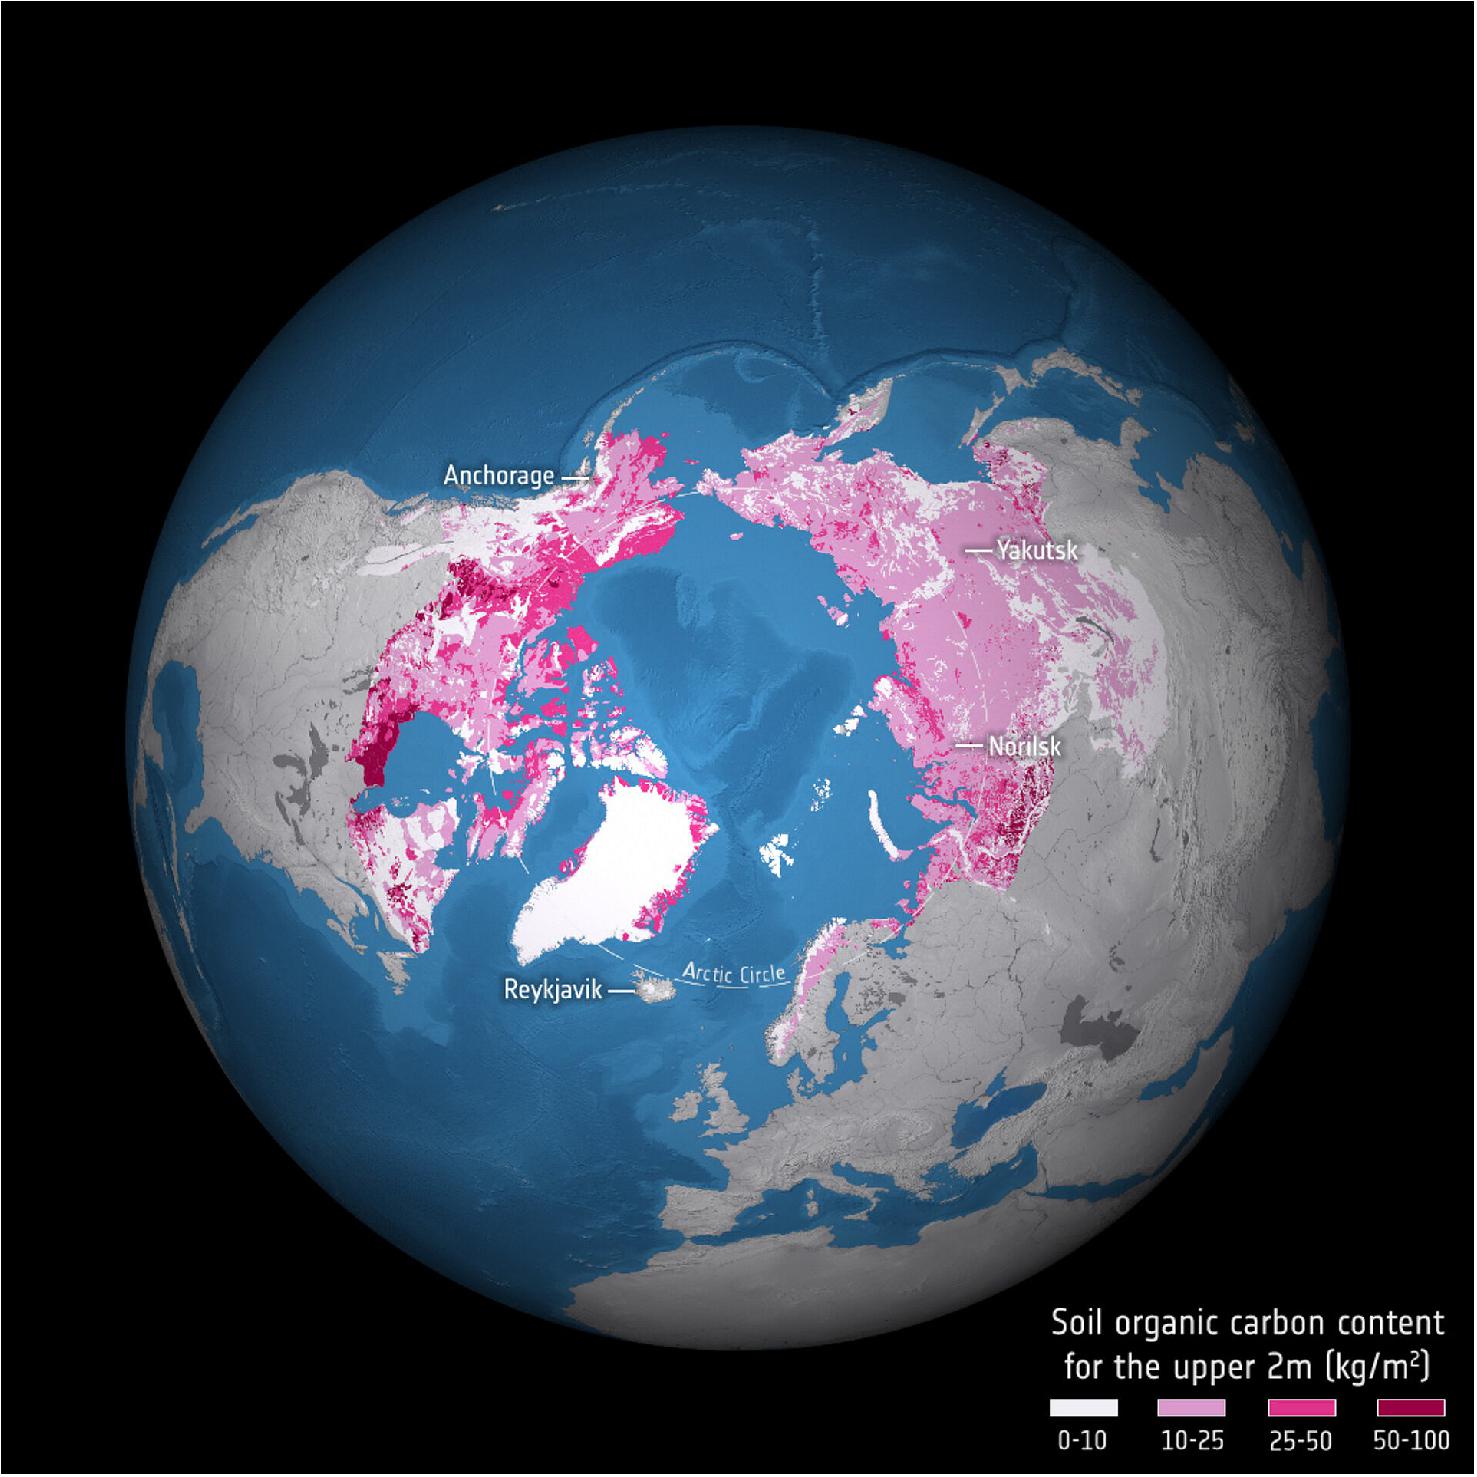
- Most of Earth’s permafrost is in the northern hemisphere – Arctic permafrost stores almost 1700 billion tons of carbon.
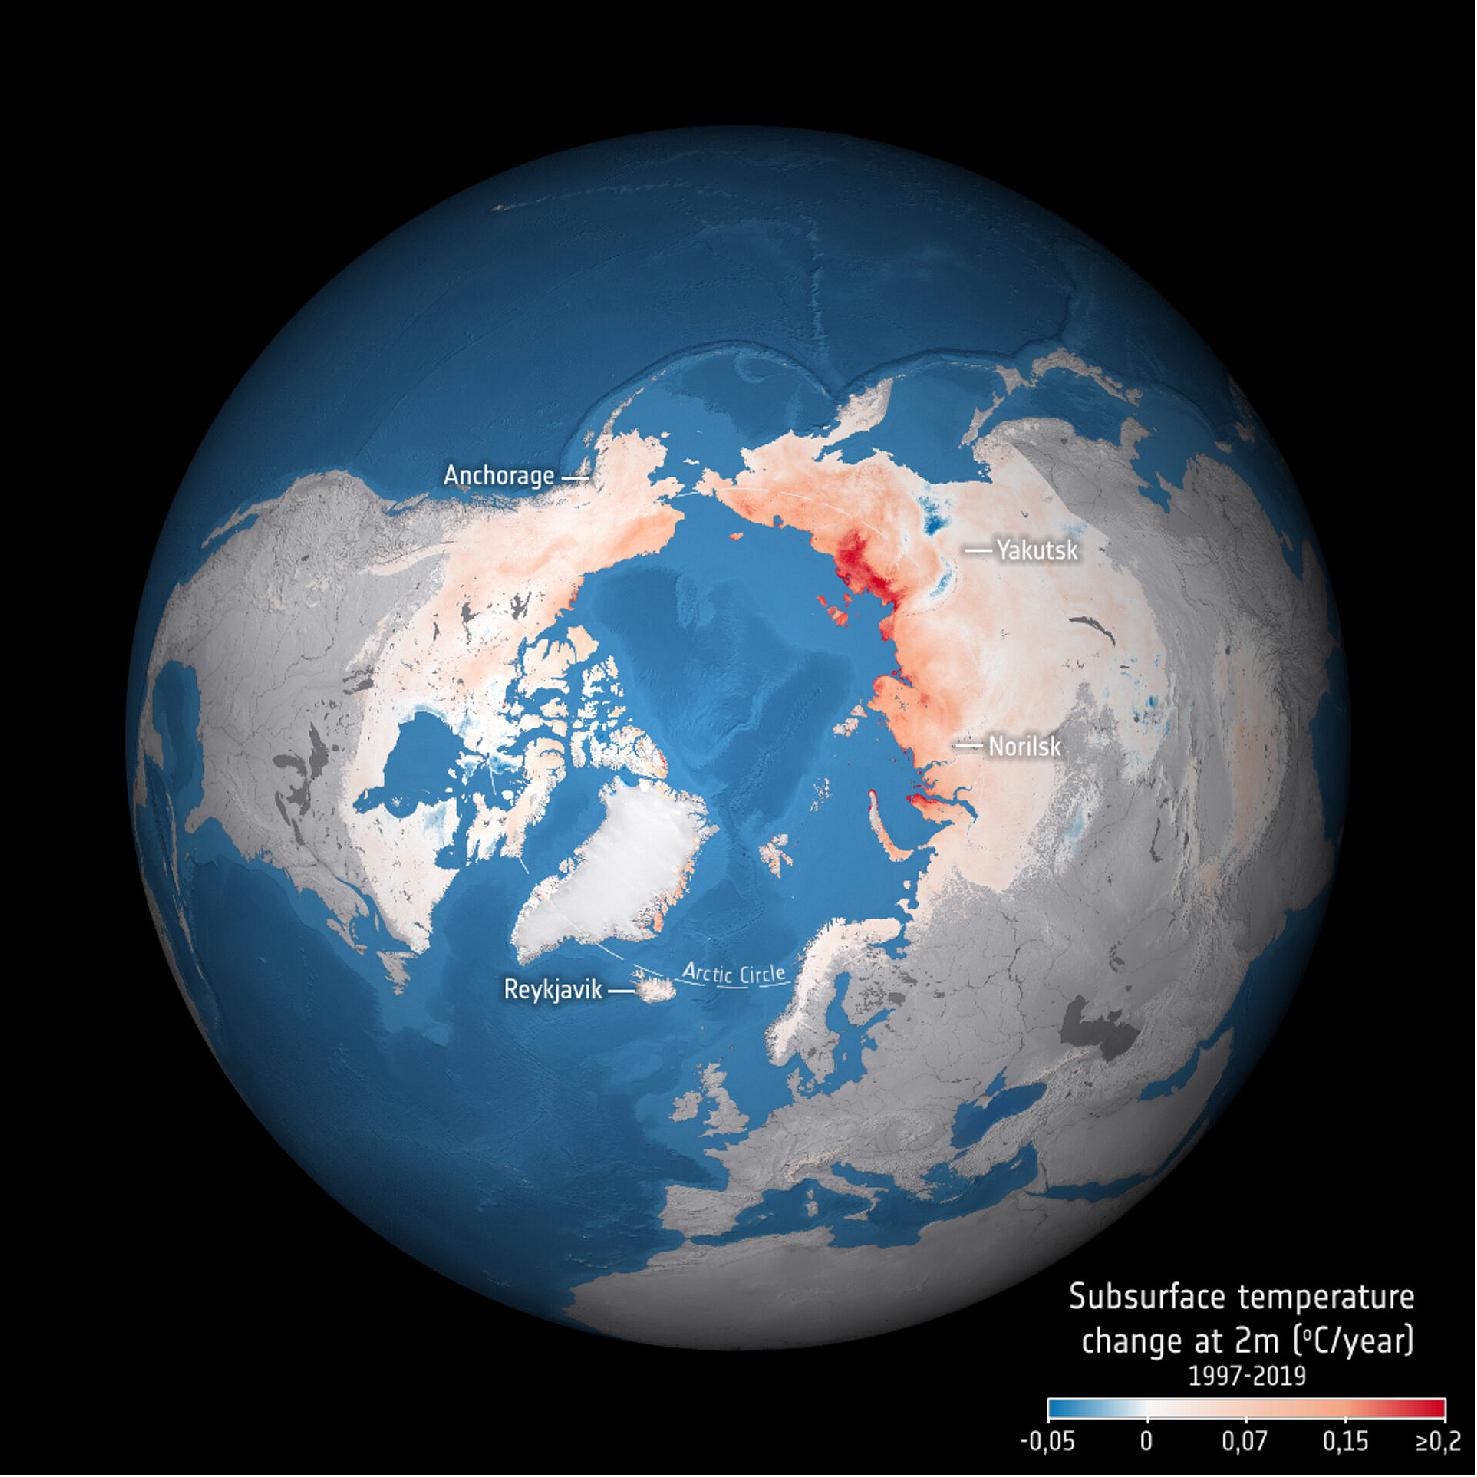
- Permafrost plays a critical role in keeping our planet from losing its cool, but the rise in global temperatures, particularly evident in the Arctic, is causing the subsurface ground to thaw and release long-held carbon to the atmosphere.
- Highlighting the importance of permafrost in the climate system, the journal Nature Reviews Earth & Environment recently featured a wealth of research papers in a special collection that examines the physical, biogeochemical and ecosystem changes related to permafrost thaw and the associated impacts. 2)
- One of the papers in the collection is based on research conducted through the ESA–NASA Arctic Methane and Permafrost Challenge.
- The paper describes how scientists from Europe and the US are working together to better track permafrost carbon dynamics. This includes gaining a better understanding of the mechanisms that lead to abrupt thaws through the use of key observations of carbon release and developing models to predict permafrost–carbon feedback. 3)
- Abrupt thawing and thermokarst, which is a fast process of permafrost degradation but varies significantly depending on local conditions, can emit substantial amounts of carbon to the atmosphere very quickly, even in a matter of days. These processes risk mobilising the deep, legacy carbon sequestered in yedoma. Yedoma is a type of permafrost that formed between 1.8 million and 10,000 years ago, and is particularly rich in organic material, so a significant source of atmospheric methane.
- Increasingly frequent wildfires in the Arctic will also lead to a notable and unpredictable carbon flux.
- The paper’s lead author, Kimberley Miner, from NASA Jet Propulsion Laboratory, said, “The traditional view of permafrost thaw is that it is a gradual process that exposes layers slowly. Abrupt thawing exposes old permafrost layers far more quickly.
- “Scaling is a real challenge but our research focuses on understanding emissions of carbon across different timescales – from the microbially mediated release at soil level, to wildfire dynamics across the tundra.
- “Similarly, we need to use observational methods across scales, from in-situ fieldwork to satellite observations to mirror thaw timescales. Only with data covering days to years to decades can we substantially reduce uncertainties in our understanding of what may trigger rapid thaws, predict emission rates and then have a better picture of the feedback cycles involved.”
- The paper not only highlights the dangers of rapid permafrost thaw but also calls for more detailed monitoring through in-situ, airborne and satellite observations to provide a deeper understanding of the Arctic’s future role as a carbon source or sink, and the subsequent impact on the Earth system.
- Charles Miller, also from JPL, said, “Our understanding of permafrost is of course advancing all the time. Permafrost cannot be directly observed from space, we have to combine different measurements such as land-surface temperature and soil moisture to give us a picture of change. And, thanks to satellites, we have a record going back over 20 years that details changes to the northern hemisphere’s permafrost soils – and this is key to improving climate models.
- “However, we look forward to future in-situ measurements and future satellite systems to give us more information.”
- ESA’s Diego Fernandez added, “Thanks to missions such as ESA’s SMOS and Copernicus Sentinel-5P, the research being conducted as part of the ESA–NASA Arctic Methane and Permafrost Challenge within ESA’s FutureEO programme and ESA’s Climate Change Initiative is once again proving essential to better understand the effects climate change is having on the delicate Arctic environment, and how these changes, in turn, add to the climate crisis.
- “As part of the Arctic Methane and Permafrost Challenge, ESA and NASA aim to support strong scientific collaboration from both sides of the Atlantic to tackle jointly the scientific and societal issues associated with permafrost thaw.”
- In the future, upcoming missions such as the German–French MERLIN, planned to launch in 2027, uses laser technology and shows promise to add valuable methane data to the Arctic observing system.
- Also, the Copernicus Carbon Monitoring mission, which is scheduled for launch in 2025, will provide high-frequency data to better monitor carbon emissions from thawing permafrost.
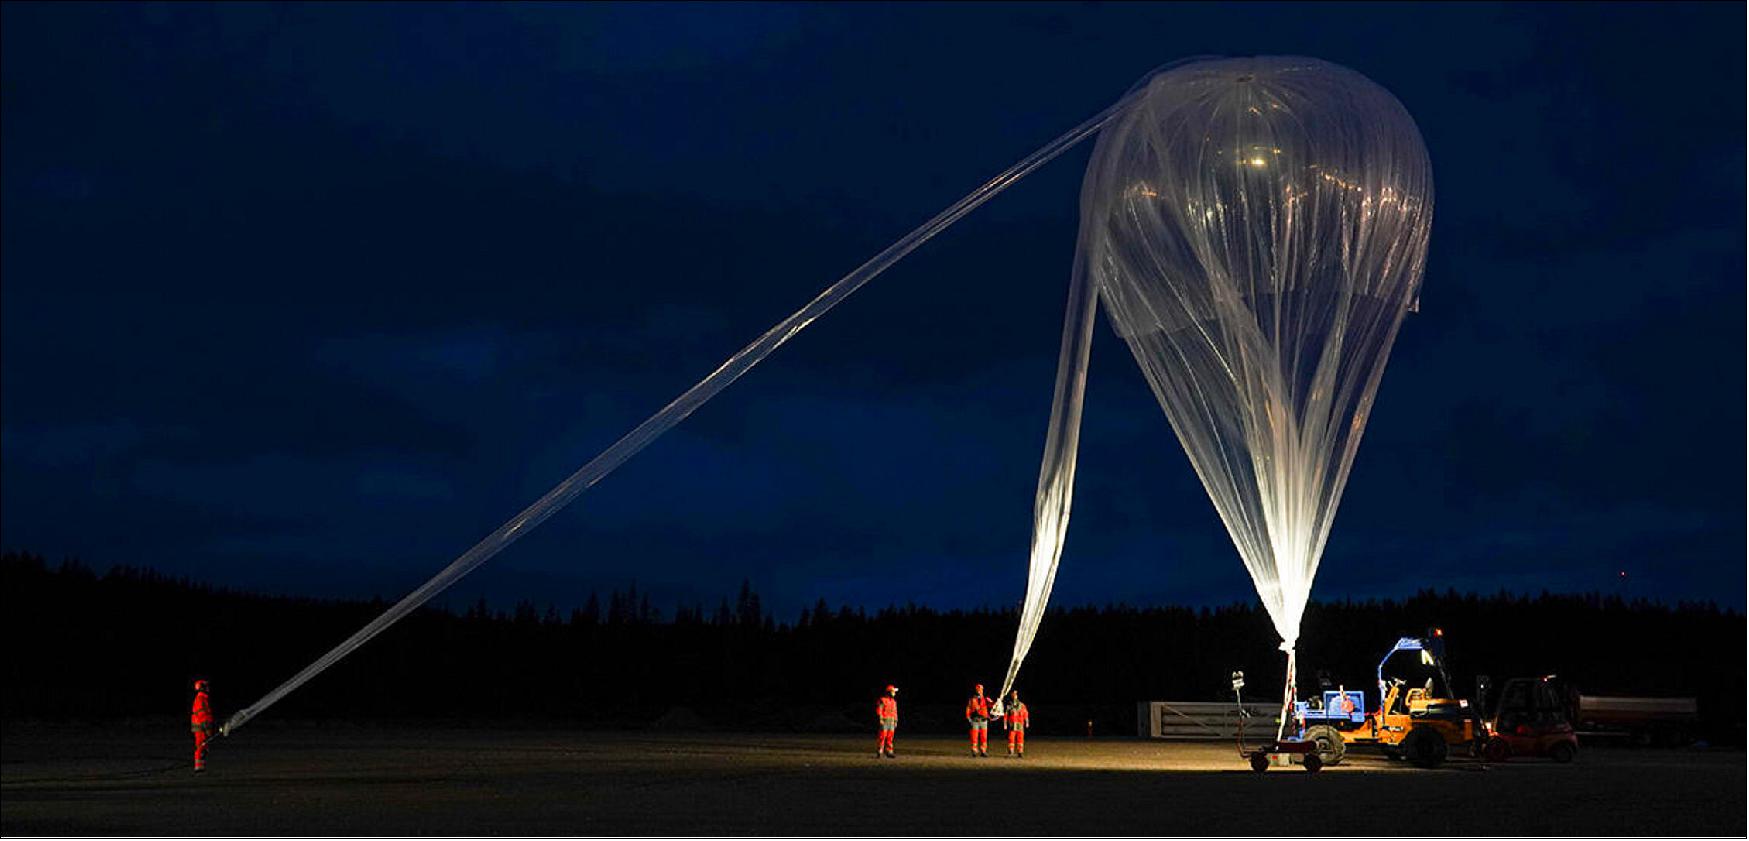
- Groundwork is also essential for understanding how greenhouse gases are being emitted from the Arctic. For example, last year, ESA was involved in an international research campaign based in Sweden. The Monitoring of Atmospheric Composition and Greenhouse Gases through Multi-Instrument campaign included launching balloons into the stratosphere, flying instrumentation on aircraft and taking measurements on the ground to record climate gas sources and sinks in Scandinavia.
- Similar activities will be continued in the North American Arctic in the summer of 2022 as part of Arctic Boreal Vulnerability Experiment and the Carbon Dioxide and Methane mission. Both of these airborne campaigns are led by NASA and German Aerospace Center, respectively.
Rising Lake Water Temperatures
• October 19, 2021: While the climate crisis is, unfortunately, a reality, it is all too easy to assume that every aspect of our changing world is a consequence of climate change. Assumptions play no role in key environmental assessments and mitigation strategies such as we will see in the upcoming UN climate change COP-26 conference – it’s the science and hard facts that are critical. New research published this week is a prime example of facts that matter. Using model projections combined with satellite data from ESA’s Climate Change Initiative, this latest research shows that the global rise in the temperature of lake water and dwindling lake-ice cover can only be explained by the increase in greenhouse gas emissions since the industrial revolution – in other words, humans are clearly to blame. 4)
- Luke Grant, from the Vrije Universiteit Brussel (VUB) and lead author, said, “These physical properties are fundamental to lake ecosystems. As impacts continue to increase in the future, we risk severely damaging lake ecosystems, including water quality and populations of native fish species. This would be disastrous for the many ways in which local communities depend on lakes, such as drinking water supply and fishing.” 5)
- The research team also predicted how things are likely to develop in the future under different warming scenarios.
- The graph of Figure 8 shows that in a low-emission scenario, the average warming of lakes is estimated to stabilize at 1.5°C above pre-industrial levels and the duration of ice cover to be 14 days shorter. In a high-emission world, these changes could lead lake temperature to increase by 4.0 °C and have 46 fewer days of ice per year.
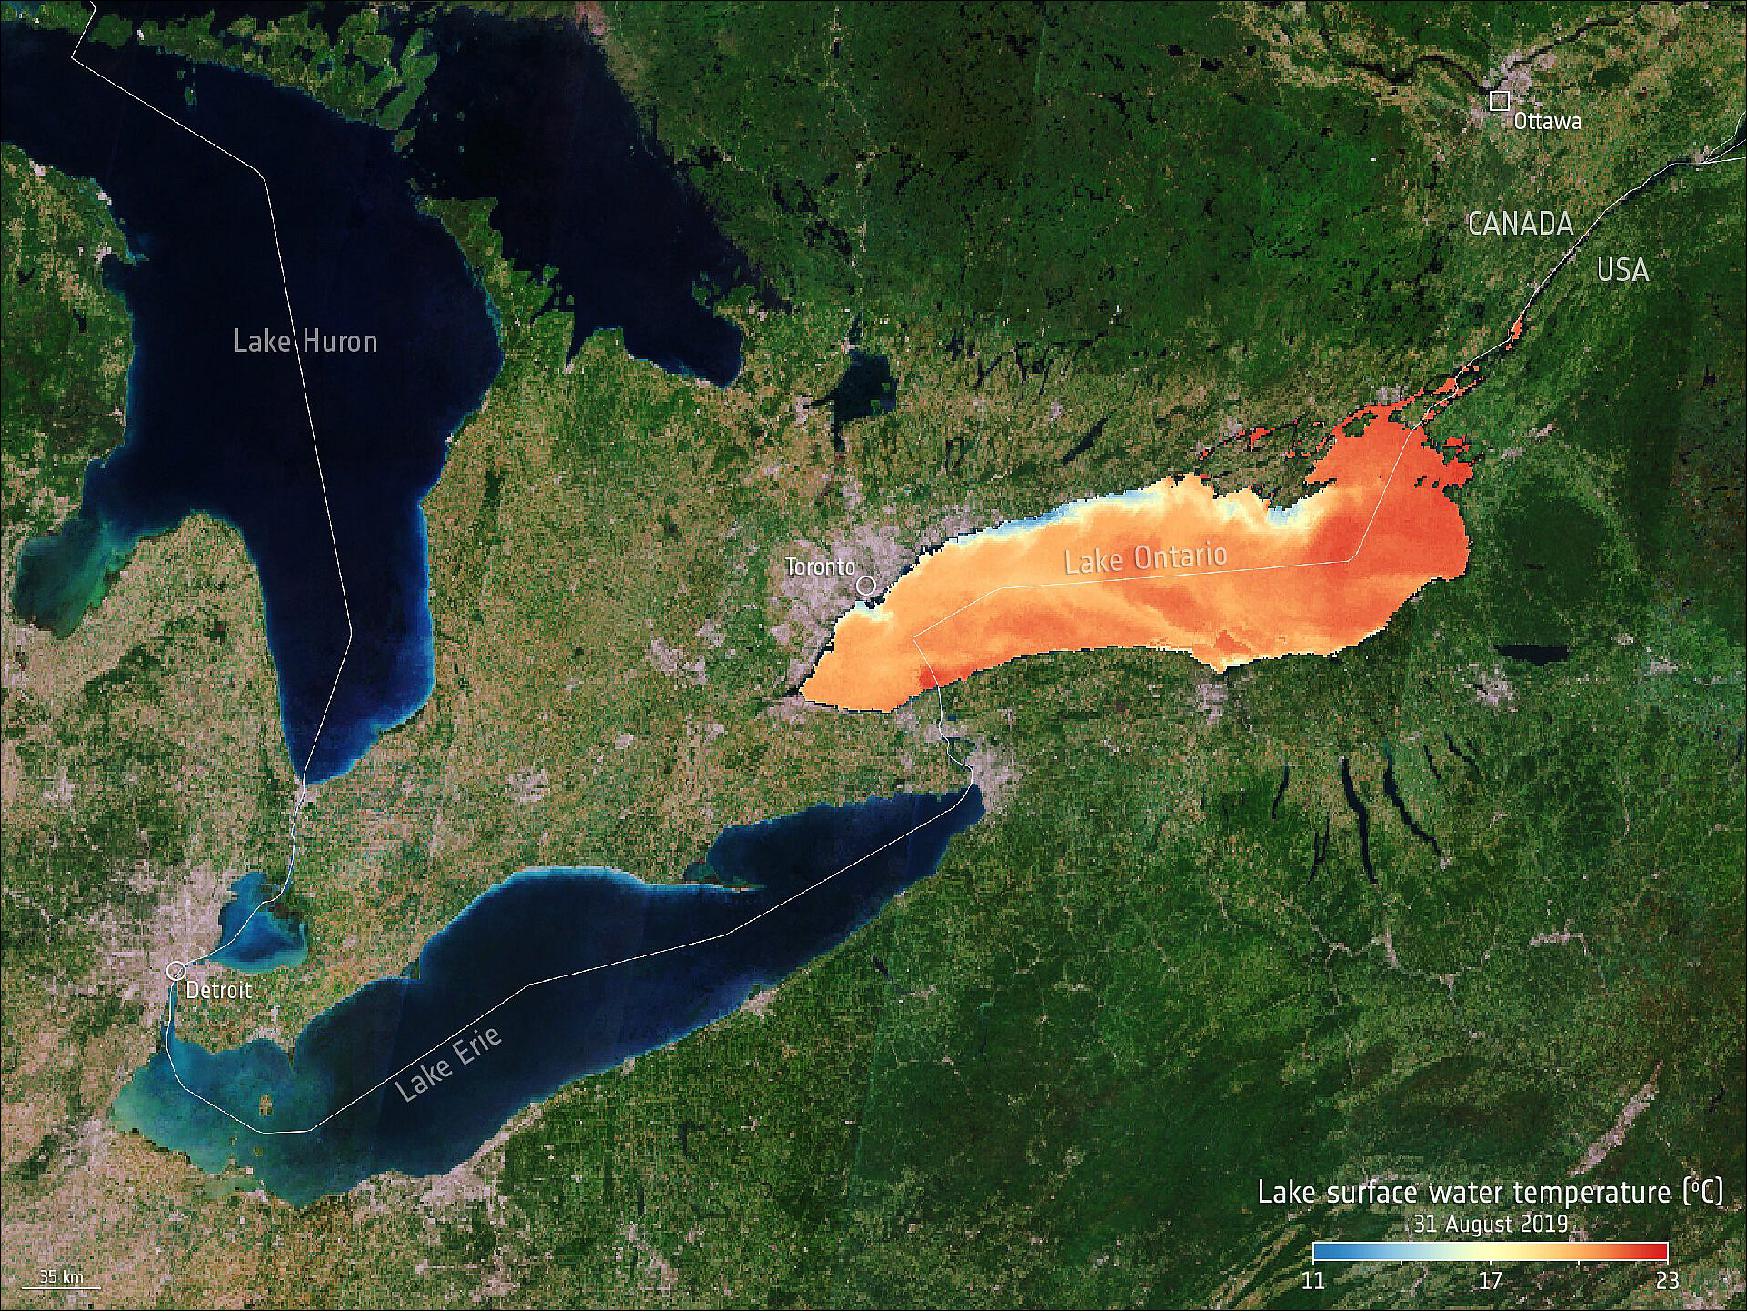
- At the beginning of the project, the authors observed changes in lakes around the world, as depicted in the image of Lake Ontario, based on satellite-derived observations from ESA’s Climate Change Initiative lakes project.
- However, the role of climate change in these trends had not yet been demonstrated.
- “In other words, we had to rule out the possibility that these changes were caused by the natural variability of the climate system,” says fellow VUB researcher and study co-author Inne Vanderkelen.
- The team therefore developed multiple computer simulations with models of lakes on a global scale, on which they then ran a series of climate models. Once the team had built up this database, they applied a methodology described by the Intergovernmental Panel on Climate Change. After determining the historical impact of climate change on lakes, they also analyzed various future climate scenarios.
- The results show that it is highly unlikely that the trends in lake temperatures and ice cover in recent decades can be explained solely by natural climate variability.
- Moreover, the researchers found clear similarities between the observed changes in lakes and model simulations of lakes in a climate influenced by greenhouse gas emissions.
- “This is clear evidence that human-induced climate change has an impact on lakes,” says Iestyn Woolway, former ESA Fellow and co-author of the study.
- Projections of lake temperatures and ice cover unanimously indicate increasing trends for the future.
- For every 1°C increase in global air temperature, lakes are estimated to warm by 0.9°C and lose 9.7 days of ice cover. In addition, the analysis revealed significant differences in the impact on lakes at the end of the century, depending on the measures we take to combat climate change.
- “Our results underline the great importance of the Paris Agreement to protect the health of lakes around the world,” said Wim Thiery, VUB climate expert and senior author of the study. “If we manage to drastically reduce our emissions in the coming decades, we can still avoid the worst consequences for lakes worldwide.”
![Figure 8: Projection of future lake surface-water temperature. Historic and future projections of globally averaged lake surface-water temperature anomalies (relative to the global temporal average of the pre-industrial control simulation). The temporal changes in lake-surface temperature anomalies are shown from 1900 to 2100 under historic (1900–2005) and future (2006 –2100) climate forcing (Representative Concentration Pathway [RCP] 2.6, 6.0, 8.5). For comparison the model projections are also shown from 1900 to 2100 for the pre-industrial climate, where the influence of anthropogenic greenhouse gases is omitted. For simplicity, the uncertainties for each dataset are not shown. [map credit: Re-drawn from Grant et al. (2021)]](https://eoportal.org/ftp/satellite-missions/e/ESA-CCI_280122/ESA-CCI_Auto2.jpeg)
Afforestation and Carbon Sequestration
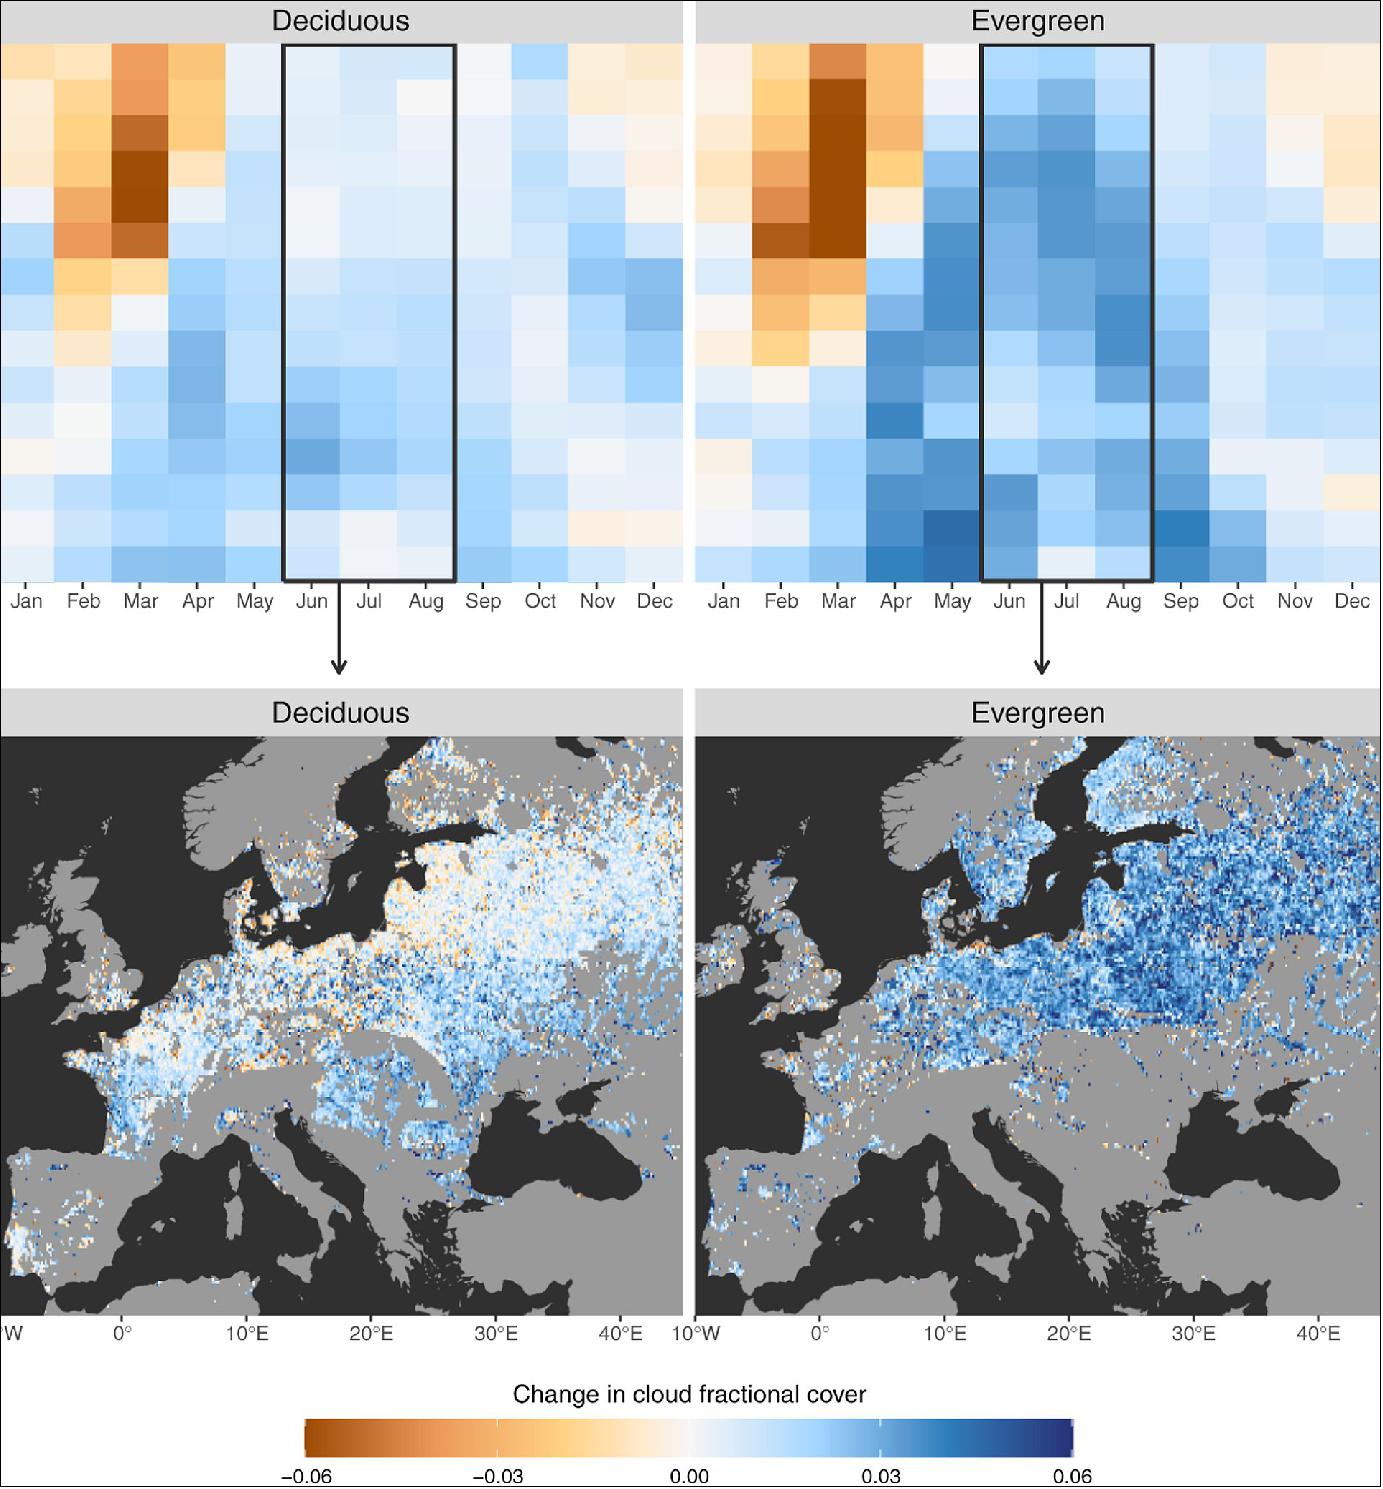
• August 5, 2021: Forests are not only key to moderating our climate by sequestering atmospheric carbon, but they also create a cooling effect by increasing low-level cloud. A first global assessment using satellite observations has shown that for two-thirds of the world, afforestation increases low-level cloud cover, with the effect being strongest over evergreen needleleaf forest. 6)
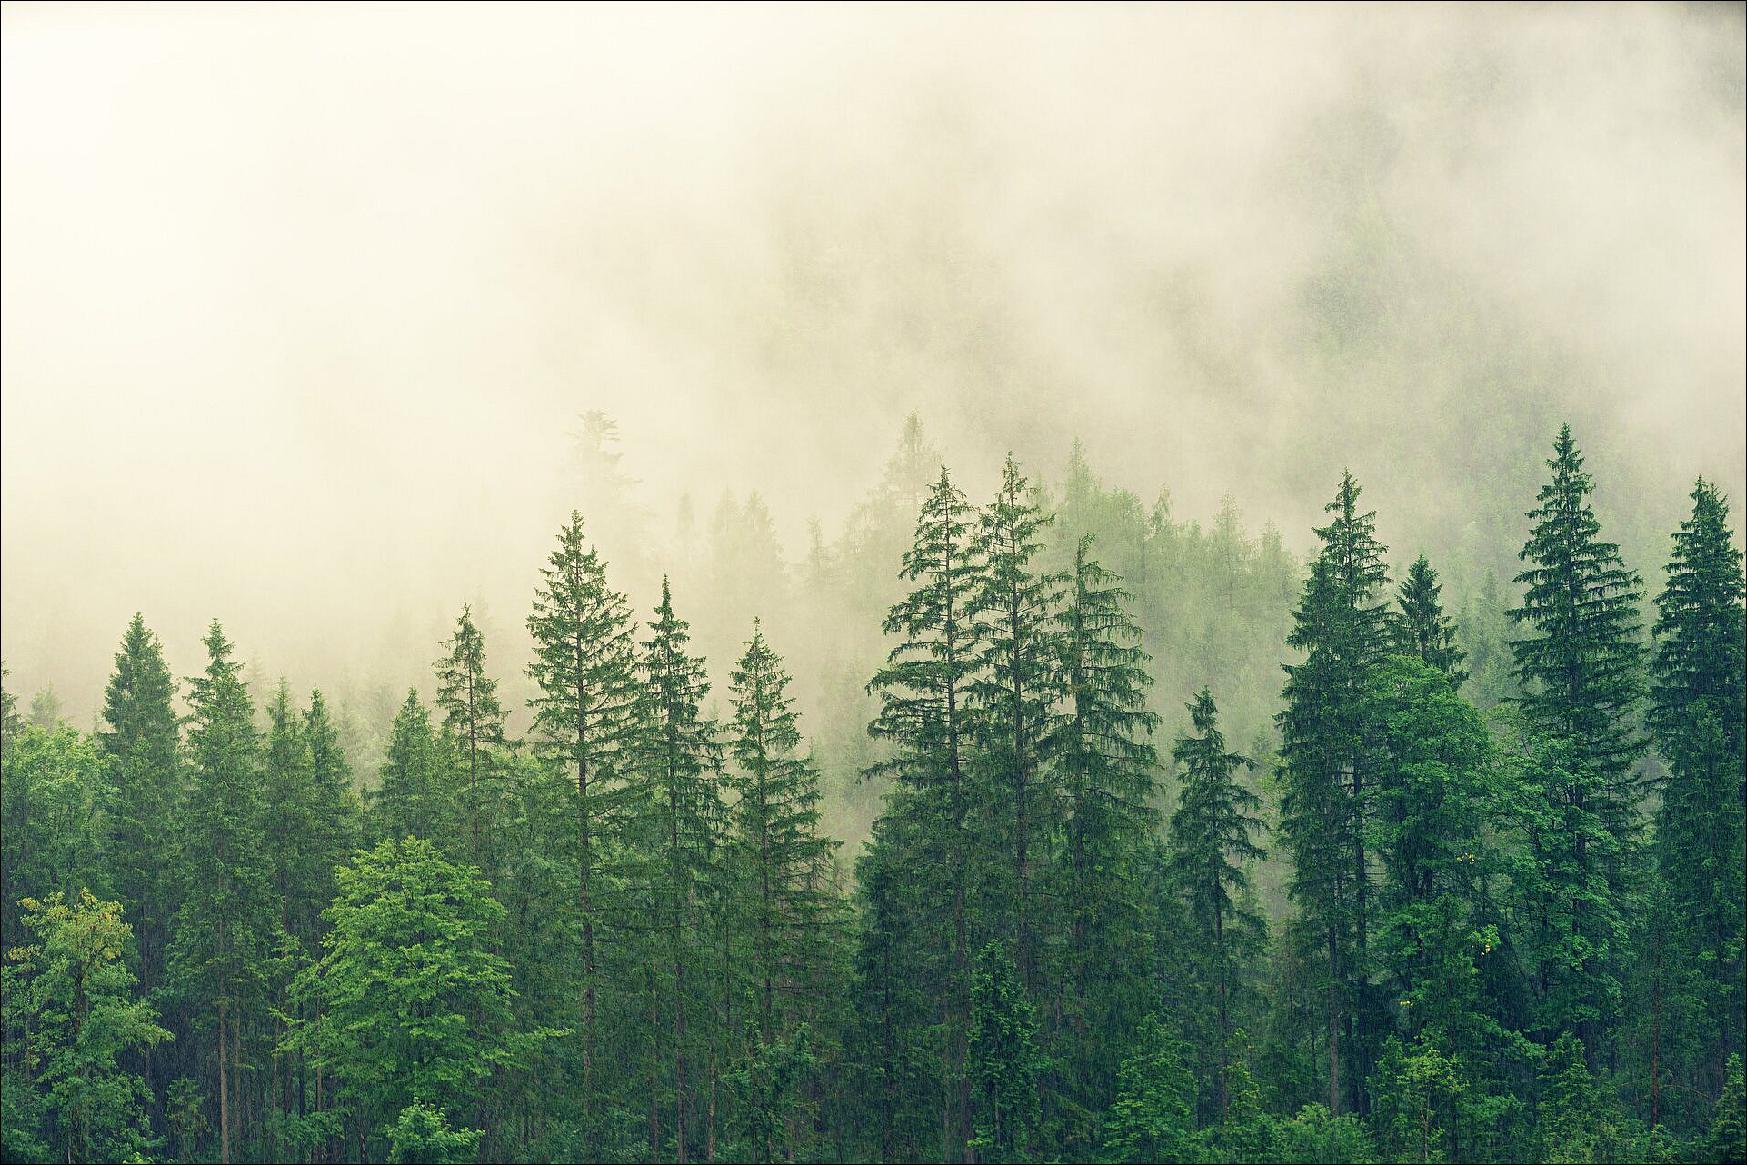
Because trees sequester carbon dioxide from the atmosphere and convert it into biomass, forests are widely championed for their role in mitigating climate change. What has been less clear, however, is how forests affect the climate in other ways such as their role in the water cycle and surface energy balance.
The paper, published recently in Nature Communications, uses global data records of cloud and land-fractional cover produced by ESA’s Climate Change Initiative to examine the effect of the transition of vegetation cover into deciduous and evergreen forest. 7)
“Earth observations are increasingly showing that trees and forests are impacting climate by affecting biophysical surface properties,” says one of the co-authors of the study, Alessandro Cescatti.
The paper describes how cloud generally increased over the whole year in afforested areas in temperate, tropical and arid regions, sometimes by as much as 15%.
However, during the boreal winter and spring across North America, Russia and Eastern Europe, when these regions have prolonged snow cover, the authors found a reduction in cloud cover over forests compared to open land. The boreal summer, on the other hand, has strong and consistent increases in cloud fraction by about 5%.
“Without global cloud and land-cover type observations from satellites this study would not have been possible on a global scale,” says Martin Stengel, who was not involved in the study but leads the Climate Change Initiative Cloud project. “The authors of this study appreciated the high-spatial resolution of the initiative’s products.”
Dr Cescatti added, “Studies like this one, based on robust satellite observations, are fundamental to characterize the complexity of the climate system and provide benchmarks for climate model developments.”
The team emphasizes that land-based climate mitigation through afforestation, forest restoration and avoided deforestation should not be reasoned purely in terms of carbon capture. Instead, policies should include the wider climate benefits that forests offer, including increasing cloud cover for localized cooling and generating rainfall, giving forests additional hydrological value.
ESA Remote Sensing of Climate Variables
• Earth observation satellites carry a wide variety of instruments using both passive and active sensing techniques. These sensors detect radiation in different parts of the electromagnetic spectrum, depending on the sensor type. 8)
The ESA Climate Change Initiative is unique in merging data from different sensors, on missions flown by different space agencies, to generate climate data records with the longest possible time spans. Here are some of the major ESA missions used to construct long-term records of Essential Climate Variables.
ERS | ENVISAT | CryoSat | SMOS | Sentinel-1 | Sentinel-2 | Sentinel-3 | Sentinel-5P | Future missions for climate (EarthCARE, Biomass, FLEX, FORUM).
• The United Nations Framework Convention on Climate Change leads international efforts to combat climate change and limit global temperature rise to less 2°C above what it was in pre-industrial times, as set out in the Paris Agreement. Robust scientific evidence of change is fundamental this challenging task. 9)
Through its Climate Change Initiative (CCI), ESA develops a suite of satellite data records of key components of the climate system, known as Essential Climate Variables (ECVs). Scientists use ECVs to study climate drivers, interactions and feedbacks, as well as reservoirs, tipping points and fluxes of energy, water, and carbon. These climate-quality datasets are a major contribution to the evidence base used to understand climate change and to predict the future, which drives international action.
References
1) ”Permafrost thaw: it’s complicated,” ESA Applications, 27 January 2022, URL: https://www.esa.int/Applications/Observing_the_Earth/FutureEO/Permafrost_thaw_it_s_complicated
2) ”Permafrost in a warming world,” Nature Portfolio Collection, 11 January 2022, URL:https://www.nature.com/collections/ababhihdce
3) Kimberley R. Miner, Merritt R. Turetsky, Edward Malina, Annett Bartsch, Johanna Tamminen, A. David McGuire, Andreas Fix, Colm Sweeney, Clayton D. Elder & Charles E. Miller, ”Permafrost carbon emissions in a changing Arctic,” Nature Reviews Earth & Environment, Volume 3, pages 55–67 (2022), Published: 11 January 2022, https://doi.org/10.1038/s43017-021-00230-3
4) ”Humans to blame for warming lakes,” ESA Applications, 19 October 2021, URL: https://www.esa.int/Applications/Observing_the_Earth/
Space_for_our_climate/Humans_to_blame_for_warming_lakes
5) Luke Grant, Inne Vanderkelen, Lukas Gudmundsson, Zeli Tan, Marjorie Perroud, Victor M. Stepanenko, Andrey V. Debolskiy, Bram Droppers, Annette B. G. Janssen, R. Iestyn Woolway, Margarita Choulga, Gianpaolo Balsamo, Georgiy Kirillin, Jacob Schewe, Fang Zhao, Iliusi Vega del Valle, Malgorzata Golub, Don Pierson, Rafael Marcé, Sonia I. Seneviratne & Wim Thiery, ”Attribution of global lake systems change to anthropogenic forcing,” Nature Geoscience, Published: 18 October 2021, https://doi.org
/10.1038/s41561-021-00833-x
6) ”Satellites reveal how forests increase cloud and cool climate,” ESA Applications, 5 August 2021, URL: https://www.esa.int/Applications/Observing_the_Earth/
Space_for_our_climate/Satellites_reveal_how_forests_increase_cloud_and_cool_climate
7) Gregory Duveiller, Federico Filipponi, Andrej Ceglar, Jędrzej Bojanowski, Ramdane Alkama & Alessandro Cescatti, ”Revealing the widespread potential of forests to increase low level cloud cover,” Nature Communications, Volume 12, Article Nr. 4337, Published: 15 July 2021, https://doi.org/
10.1038/s41467-021-24551-5, URL: https://www.nature.com/articles/s41467-021-24551-5.pdf
8) ”ESA Missions for Climate,” ESA, URL: https://climate.esa.int/en/evidence/esa-missions-relating-climate/
9) ”ESA’s Climate Change Initiative,” ESA Applications, URL: https://www.esa.int/Applications
/Observing_the_Earth/Space_for_our_climate/ESA_s_Climate_Change_Initiative ....
The information compiled and edited in this article was provided by Herbert J. Kramer from his documentation of: ”Observation of the Earth and Its Environment: Survey of Missions and Sensors” (Springer Verlag) as well as many other sources after the publication of the 4th edition in 2002. - Comments and corrections to this article are always welcome for further updates (eoportal@symbios.space).