Earth Day 2021
People and News
Earth Day - April 22 2021
Every year on April 22, Earth Day marks the anniversary of the birth of the modern environmental movement in 1970.
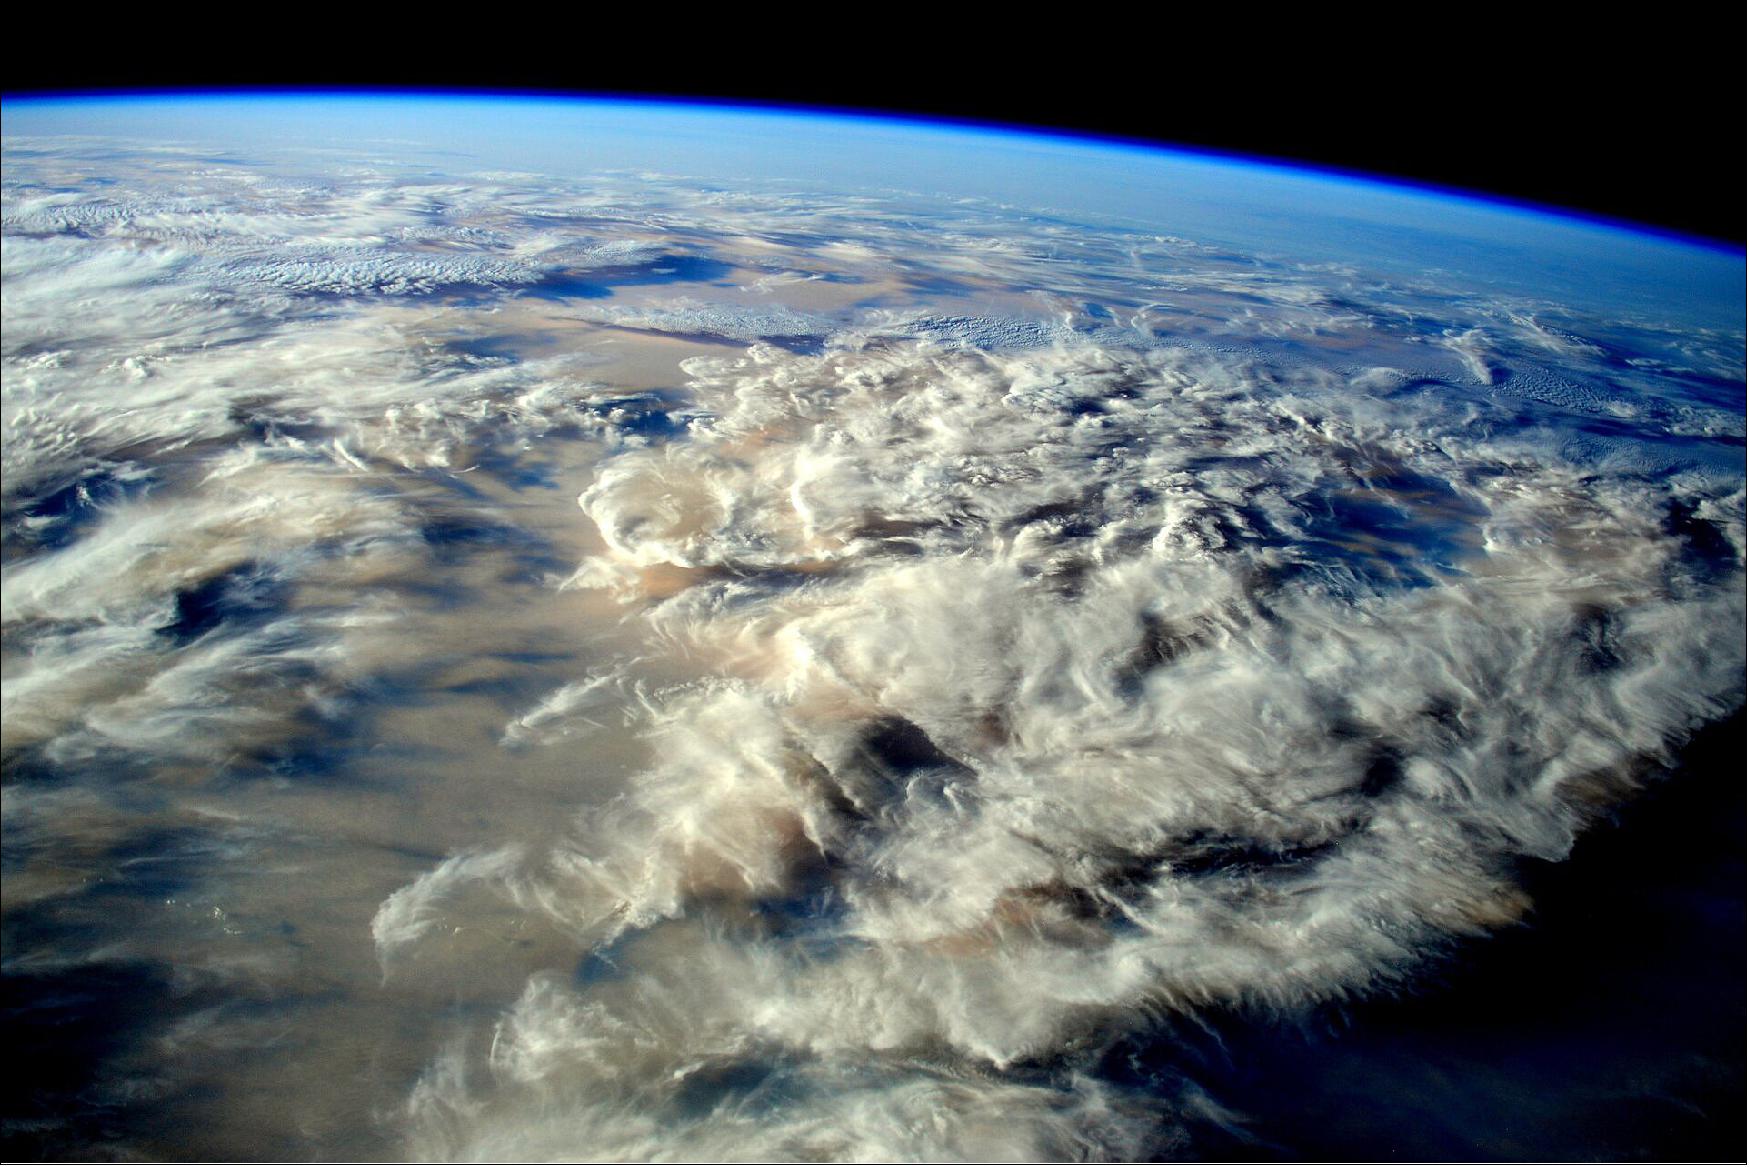
• April 19, 2021: During 2020, global average surface temperatures were the hottest on record, tying with 2016 as the warmest recorded year. Last year was also the most active hurricane season to date, with many storms quickly intensifying. Temperature and weather systems each interact with, and are influenced by, a multitude of Earth systems, each affected by the warming climate. One of those is the global transport of massive dust plumes from one continent to another. 1)
In June 2020, a “Godzilla” dust plume travelled from the Sahara, the planet’s largest, hottest desert, across the Atlantic ocean to North America. While this eye-catching plume made headlines, NASA scientists, using a combination of satellite data and computer models, predict that Africa’s annual dust plumes will actually shrink to a 20,000-year minimum over the next century as a result of climate change and ocean warming.
The Sahara Desert is 3,600,000 square miles (9,200,000 km2) of arid land stretched across the northern half of Africa, coming in just slightly smaller in size than the continental United States. Upwards of 60 million tons of its nutrient-laden mineral dust are lifted into the atmosphere each year, creating a massive layer of hot, dusty air that winds carry across the Atlantic to deliver those nutrients to the ocean and vegetation in South America and the Caribbean.
Recent NASA research outlines the domino-like connections between factors beyond the desert’s borders and the development of dust plumes. These start with temperature differences between the North and South Atlantic, which then impact the region’s consistent east to west winds as well as a tropical band of relatively high rainfall located near the Equator, both of which impact the annual dust plumes. Supported by NASA’s Modeling, Analysis, and Prediction (MAP) Program, and Radiation Sciences Program, the scientists used their new understanding of these relationships to forecast a more substantial reduction in dust activity than previous studies had predicted based on anticipated climate warming.
A Dusty Past
“From ground observations and satellite observations, we see African dust variability,” said Tianle Yuan, atmospheric scientist at NASA's Goddard Space Flight Center in Greenbelt, Maryland. “In fact, it can change quite a bit, from month to month, day to day, year to year, even decade to decade.”
Recent dust estimates are derived from data collected by NASA satellite missions, including Terra, Aqua, and Cloud-Aerosol Lidar and Infrared Pathfinder Satellite Observation (CALIPSO), a joint mission between NASA and the French space agency, CNES (Centre National d'Etudes Spatiales).
The researchers were also interested in seeing if the relationship between global average temperature and Saharan dust activity occurred in the past. Geological records going back thousands of years help reveal past precipitation and nutrient levels as the Sahara went through dramatic environmental shifts.
The peak of Saharan dust transport to the eastern side of the Americas took place roughly between 12,000 to 17,000 years ago, at the end of the last Ice Age. Then began the African Humid Period, during which the vast expanse of desert was speckled with lakes, vegetation and human habitation. The increased moisture and plant-life stabilized the ground and minimized dust plumes.
“The Sahara Desert was relatively wet back then,” said Yuan. North African sediment cores off the coast and pollen records show that there was more rainfall and vegetation present. “Dust was much rarer.”
Though dust transport has increased since then, the research team found that both natural processes and human activity are now likely driving Earth back toward a dust minimum as climate warms.
Sea surface temperatures directly impact wind speeds, so when the northern Atlantic warms relative to the south Atlantic, the trade winds that blow the dust from east to west become weaker. As a result, the slower winds pick up and transport less dust from the Sahara.
In addition to carrying less dust, the weakened winds also allow the band of steady rain that traverses the tropics to drift north over more of the desert, which dampens the dust and keeps it from getting swept away. Less dust in the air, which can reflect sunshine away from Earth’s surface like a sunshield, means more sunlight and heat reach the ocean, warming it further. All together this creates a feedback loop of warm sea surface temperatures leading to reduced dust, and reduced dust in turn contributing to additional warming, combining to impact climate, air quality, and storm and hurricane formation.
From Dust to Dust Impacts
“Dust plays a major role in the Earth system,” said Hongbin Yu, an atmospheric researcher at Goddard. “A decrease of dust as the climate warms may have profound influences on a variety of phenomena, but these potential impacts may be good or bad.”
On its journey across the Atlantic, Saharan dust sprinkles into the ocean, feeding the marine life, and similarly plant life once it makes landfall. Minerals like iron and phosphorus in the dust act as a fertilizer for the Amazon rainforest, Earth’s largest and most biodiverse tropical forest. Rains wash many of these valuable nutrients from the soil into the Amazon river basin, making the nutrient delivery from Africa important for maintaining healthy vegetation.
Though African dust transport plays an important role in the genesis of soils and sustaining vegetation, Yu says there are some negative effects because the increase in nutrients can lead to harmful algal blooms off the coast of Florida, and coral reef sicknesses and death linked to dust deposition.
Residents in the Caribbean could also see some benefits as less dust means better air quality. Breathing in dust is particularly hazardous for children, the elderly, and those with respiratory conditions such as asthma. That led a team from NASA Earth Applied Sciences Program to develop an early-warning system for Puerto Rico that now provide three days of lead time before a Saharan dust storm reaches the island, giving doctors and public health officials time to prepare and work with meteorologists on air quality alerts. They use data from the Moderate Resolution Imaging Spectroradiometers (MODIS) on NASA's Terra and Aqua satellites, the Advanced Baseline Imager (ABI) instrument aboard the National Oceanic and Atmospheric Administration (NOAA) Geostationary Operational Environmental Satellite (GOES-16 EAST), and the Visible Infrared Imaging Radiometer Suite (VIIRS) on the joint NASA/NOAA Suomi NPP satellite were employed to help detect the advancing Saharan dust plume before it reached islands like Puerto Rico this past year, so that at-risk communities could prepare for the potentially adverse health effects.
Will the Dust Settle?
“The final piece of the story is looking to the future,” said Yuan. “We want to know what the Sahara dust will be, given the climate change picture we are painting. But directly predicting dust activity is really hard because it involves a lot of processes.”
With projected global warming, the research team used model data from the Coupled Model Intercomparison Project 5 (CMIP5) that indicate at least a 30% reduction in Saharan dust activity from current levels over the next 20 to 50 years, and a continued decline beyond that.
“The minimum humans experienced during the African Humid Period will likely be surpassed because of climate change,” Yuan says of the dust levels during the African Humid Period. As the plumes of dust decline, so will their impacts on vegetation an ocean away.
Earth Day Connections: NASA Investigates Vegetation
• April 19, 2021: From the vantage point of space, NASA’s fleet of Earth-observing satellites joins with those of partner interagency and international agencies to investigate and illuminate connections between ecosystems that are continents apart, or right next door. With a global perspective, scientists can observe how factors like deforestation, climate change and disasters impact forests and other plant life – while also studying how changes in vegetation impact air quality, waterways and the climate. Vegetation is the primary energy source for nearly all life on Earth, so monitoring it and forecasting how it could be impacted by climate change is key. 2)
In the Amazon, NASA Earth scientists monitor forests and bring these data into the hands of local decision-makers. NASA data provides information about the clearing of trees for agriculture and ranching as well as the impacts of drought on tree mortality. People cut down forests and then ignite the piles of trees and other vegetation, leading to wildfires, which can be detected by instruments including the thermal imager on the Suomi NPP satellite. In 2020, these sensors detected where 1.4 million fires took place. The fires generate smoke that can drift over the continent and be seen from space.
Tracking Plant Health from Space
Satellites can detect how “green” an area is – showing the health of plants that are growing in a particular site. While fires, deforestation and drought lead to the tropical Amazon being less green, warming temperatures in the Arctic lead to tundra and boreal regions becoming greener. Using 87,000 Landsat images spanning nearly three decades, scientists found that a third of the land cover of Canada and Alaska looked different in 2012 as compared to 1985. With warmer temperatures, and longer growing seasons, shrubs become denser on grassy tundras, transforming what they looked like from space.
Since plants take up carbon dioxide from the air as they undergo photosynthesis to make food, it may seem that having a greener Arctic would a result in less of the greenhouse gas in the atmosphere. However, a recent study using satellite data and computer models found that any increased carbon uptake in the Arctic is offset by a decline in the tropics. There, warmer global temperatures have led to a drier atmosphere. That means less rainfall and more drought in places like the Amazon, which leads to a drop in tree growth and increases in tree mortality – and less carbon taken from the atmosphere. Soon, water availability could limit the amount of greening in the Arctic as well, the scientists found. As forests expand or are cut back, researchers use data from instruments including MODIS and satellites like Landsat to measure their extent and health.
A new suite of NASA instruments in space also measure the health of forests. The GEDI (Global Ecosystem Dynamics Investigation) instrument aboard the International Space Station uses lasers to measure the height of trees, allowing researchers to investigate how ecosystems are changing and how the carbon and water cycles are shifting in a warming climate. The Ice, Cloud and land Elevation Satellite 2, or ICESat-2, uses a similar technique to measure heights, and can reach higher latitudes to see changes in the Arctic biomes as well. And the ECOSTRESS (Ecosystem Spaceborne Thermal Radiometer Experiment on Space Station) measures the temperature of plants, to help determine their water consumption and health.
From Forests to Farms
While climate change impacts the growth and health of vegetation, naturally occurring weather patterns have an impact as well. Scientists with NASA Harvest are looking into the connections between El Niño/La Niña weather patterns, and the farming conditions and crop yields in eastern and southern Africa. During El Niño years, winds and currents in the equatorial Pacific Ocean cause water to pile up against South America, impacting weather patterns around the globe – even in Africa. Researchers found that southern Africa tends to have decreased crop yields during El Niño phases, while eastern Africa sees increased crop yields in those years – knowing these relationships can help farmers and policy makers prepare for a given season.
NASA satellites and science also help farmers in the United States monitor and track their crops. Having more information about rainfall, plant health and other data gives farmers information they use to deal with the extreme weather events that are increasing due to climate change, as well as shifting planting zones and other effects like early freezes and heavier spring rains. The U.S. Department of Agriculture estimates and tracks crop production using farmer surveys and ground observations, with a big-picture assist from Landsat data, NASA computer models and other Earth science resources. They also use MODIS instruments to monitor daily vegetation health – all to help determine what the crop yield will be, and which areas could be facing problems.
These same satellites can also help scientists track the unwanted products of some agricultural fields, including runoff that flows into waterways. Farms, forests, tundra – all these vegetated ecosystems connect to other spheres of our home planet.
Earth’s Cryosphere is Vital for Everyone. Here’s How NASA Keeps Track of Its Changes
• April 20, 2021: Everything on our planet — the land, the water, the air, people — is connected by the various chemical, physical and biological processes that make up what we call the Earth system. 3)
One of the key components of that huge system is the cryosphere, or all of Earth’s frozen water. This important “sphere” includes frozen soils in Alaska, the snow on top of the Himalayas, as well as all the ice in the polar regions.
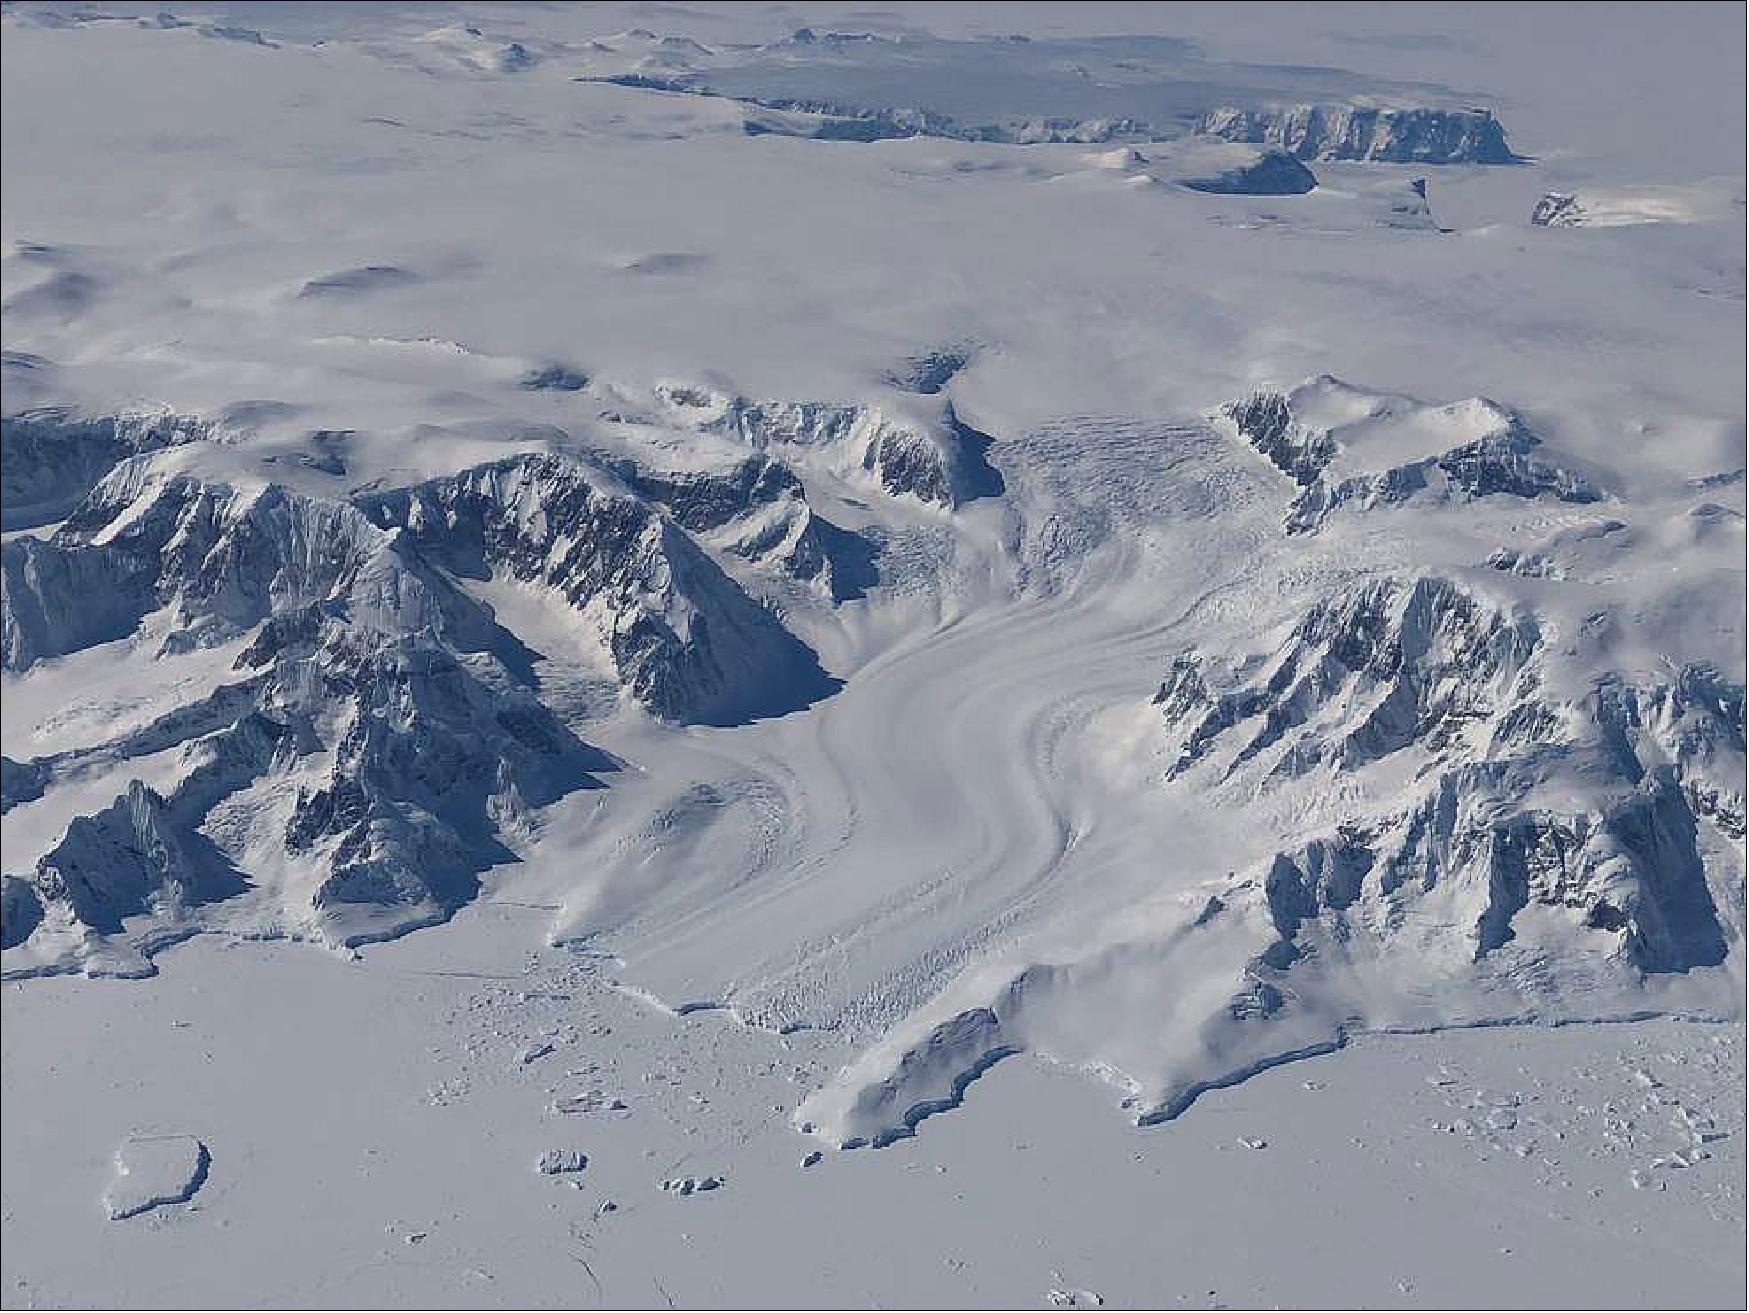
Nowhere is the role of the cryosphere as evident as it is at high latitudes, where the Greenland and Antarctic ice sheets cover most of the land, and where sea ice caps enormous sections of the polar waters. The vastness of that bright, white ice — in addition to the huge areas covered by winter snow beyond polar regions — helps control the global climate by reflecting some of the Sun’s radiation back into space.
Because of the importance of the cryosphere, NASA is committed to studying Earth’s ice extensively. With the recently decommissioned Gravity Recovery and Climate Experiment satellite mission, and its successor, GRACE Follow-On, scientists have studied changes in ice sheet mass balance. The missions have measured variations in Earth’s gravitational pull in response to surface mass and water changes.
For more than a decade, Operation IceBridge took to the skies to survey the Arctic, Antarctica and Alaska. With more than 1,000 flights completed, scientists and engineers gathered data on the height, depth, thickness, and flow of sea ice, glaciers and ice sheets.
IceBridge ended officially in 2021, but its legacy will live through the hundreds of terabytes of data on land and sea ice collected since 2009. The mission collected an array of data to bridge the data gap between NASA’s two spaceborne laser altimeters built for studying the cryosphere, the Ice, Cloud, and land Elevation Satellites, or ICESat and ICESat-2.
Last year, scientists using ICESat-2 reported dramatic ice sheet losses in Greenland and Antarctica. Equipped with the most advanced laser altimeters ever flown in space, the spacecraft enabled scientists to create elevation maps to measure the loss of ice with unprecedented detail.
Between 2003 and 2019, the Greenland Ice Sheet lost an average of 200 gigatons (200 x 109 tons) of ice per year, the researchers concluded. Antarctica’s ice sheet lost an average of 118 gigatons of ice per year. The combined ice losses caused sea levels to rise by 0.55 inches (14 mm) over those 16 years.
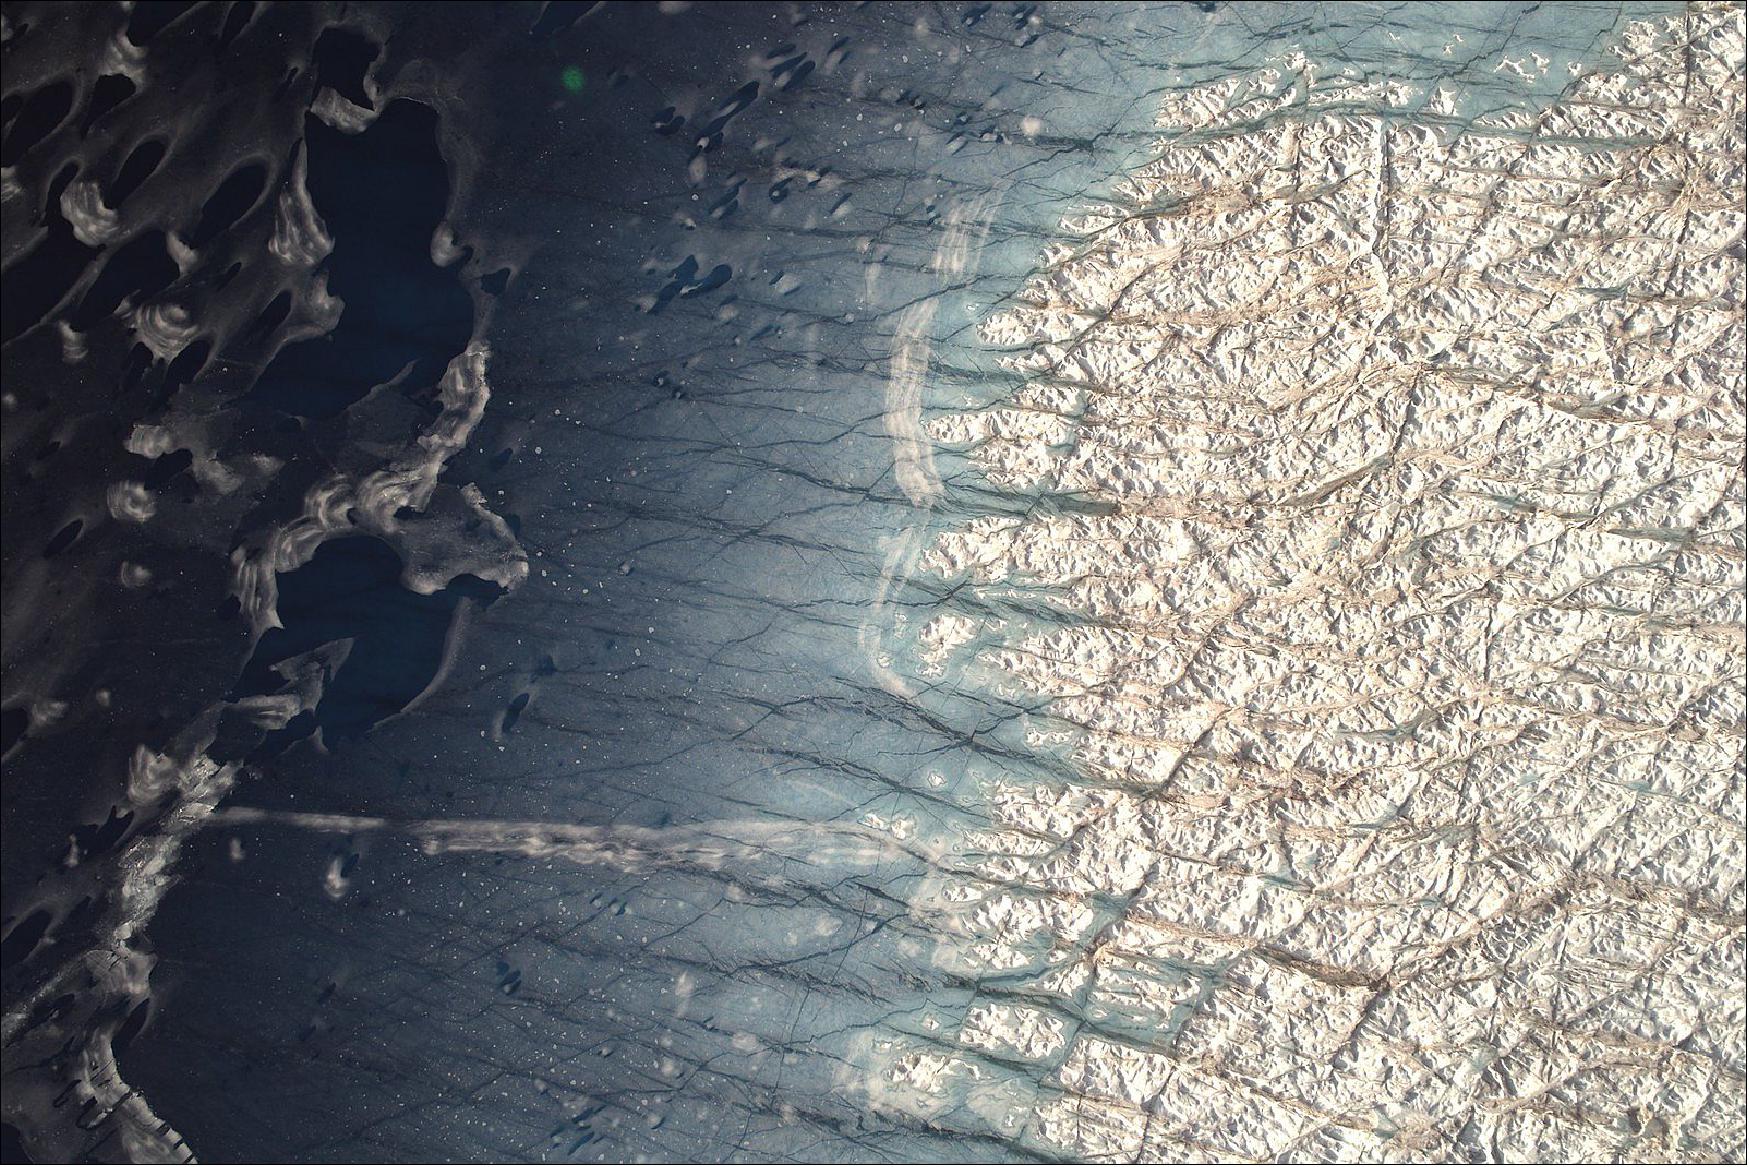
By studying changes observed between the ICESat and ICESat-2 missions, scientists also reported substantial thinning of Greenland’s coastal glaciers — another important aspect of the cryosphere that NASA scientists investigate.
As part of NASA’s Oceans Melting Greenland mission, which surveys glaciers with aircraft and ships, scientists want to gain a better understanding of how ocean warming affects coastal glaciers. Greenland’s melting glaciers are a significant contributor to the rising sea levels that already pose concerns for coastal communities worldwide.
In 2020, the mission's scientists completed an extensive survey of Greenland’s fjords and glaciers, shedding more light on the ways in which warming seas accelerate glacier retreat. Their research showed that warming ocean water in fjords erodes the base of glaciers, causing the ice above it to break away. Bigger glaciers melt faster because of that undercutting process, the scientists concluded.
Scientists expect climate change to amplify the ocean warming and the undercutting of those Greenlandic glaciers. But the interaction between the ocean and other types of polar ice extends beyond glaciers.
For example, last year NASA scientists found that rapid sea ice melt led to a more turbulent ocean current in the Arctic called the Beaufort Gyre. Like other currents in the world’s oceans, the Beaufort Gyre plays an important role in regulating massive exchanges of water around the globe with different temperatures and salinity. Through this process, known as the thermohaline circulation, ocean currents interact with the many other components of the Earth system to control temperatures across the globe.
The NASA study, which included 12 years of satellite data, showed the gyre has gained a massive amount of cold fresh water since the 1990s. Because some of that freshwater is slowly picked up by another system of currents known as the Atlantic Meridional Overturning Circulation, the far-reaching effects of the changing currents could also influence the climate of Western Europe and North America.
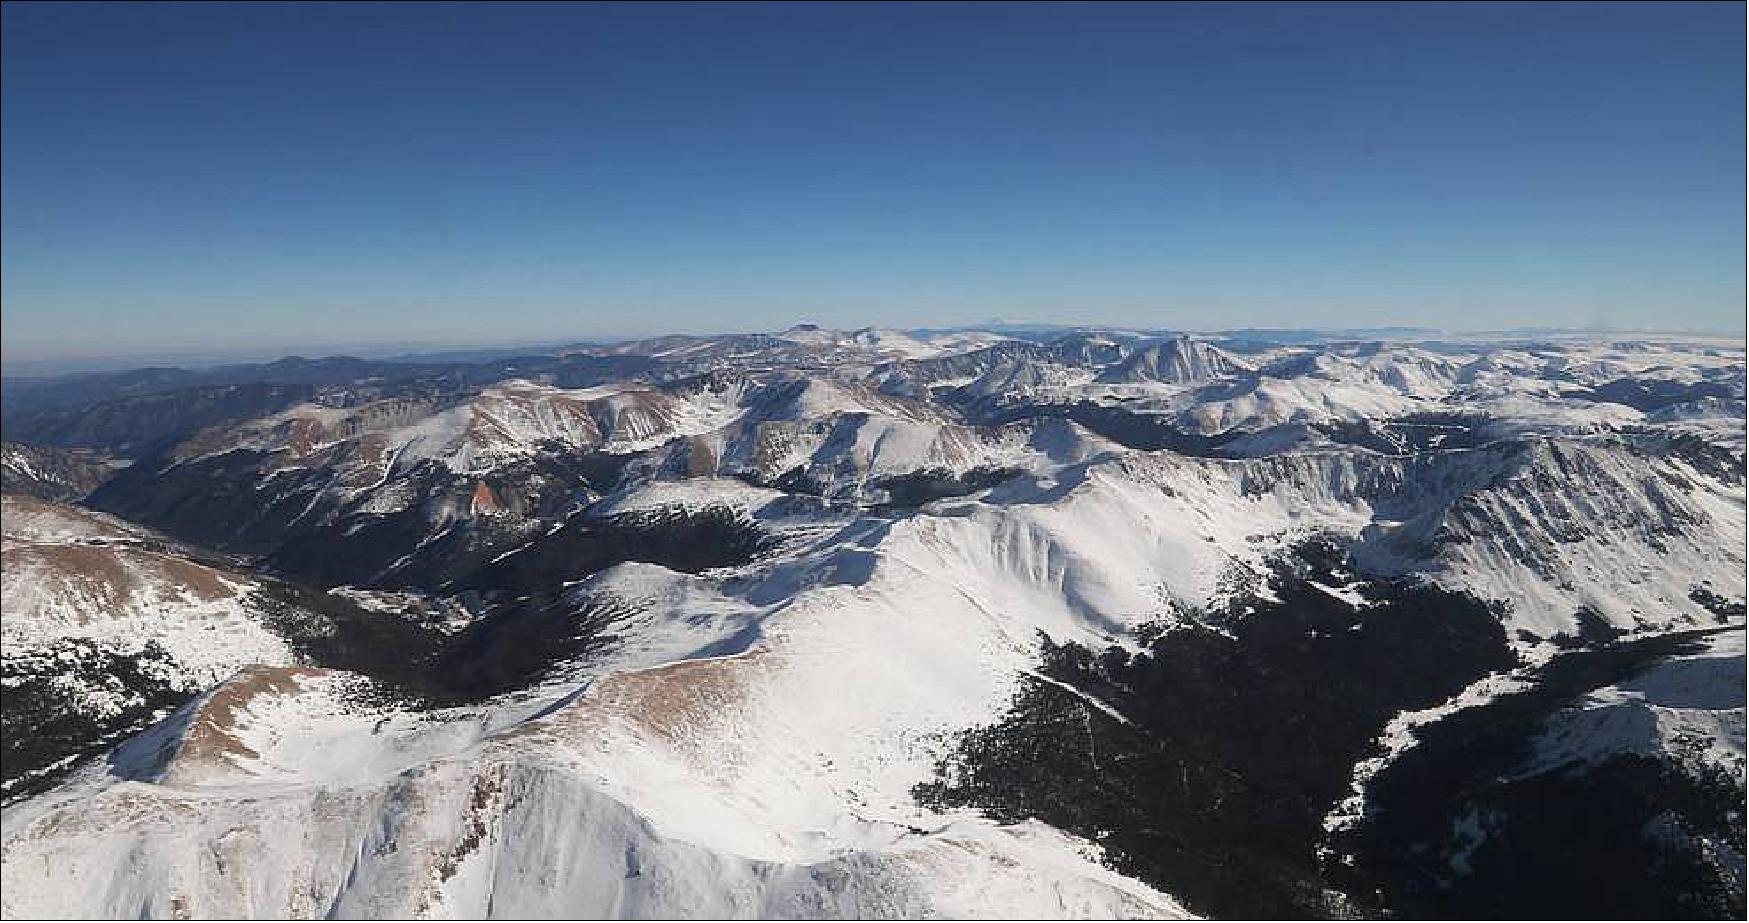
Even though the polar regions hold most of Earth’s ice, snowpacks and alpine glaciers at lower latitudes are important parts of ecosystems around the world. In mountain ranges such as the Sierra Nevada in California, snowpacks that release water gradually during warmer months serve as the primary source of drinking and irrigation water. This water also provides an important source of hydroelectric power.
Alpine snow can be difficult to study with satellites from space, as snow cover often hides under forest canopy and other types of complex terrains. To complement satellite observations of snow in Western U.S. states, NASA’s SnowEx campaign has been surveying snowpacks since 2017. The campaign is an effort to characterize snow depth, density and other detailed properties of snow that scientists need to accurately estimate how much water will melt and flow into mountain streams, rivers and reservoirs.
In order to expand these local measurements to global observations, scientists need to perform some complex calculations to combine airborne and ground observations of snow with satellite data. NASA funds efforts that help determine the best ways to combine observations from various satellites and study snow depending on ground conditions.
Climate change can also influence the amount of freshwater available from melting winter snow. Where climate change results in less snow fall, droughts can follow in the warmer months. Additionally, changes in alpine glaciers and snow can also lead to natural hazards. As warming causes more precipitation in the form of rain instead of snow, water can overwhelm rivers and cause floods.
To study vulnerability to flooding, landslides and other types of natural hazards, NASA’s High Mountain Asia Team is completing the most comprehensive ice and snow survey ever made of the region where mountain ranges such as the Himalayas, Karakoram and Hindu Kush provide fresh water for millions of people. There, glacial melt and changes in precipitation patterns have become more common. As meltwater lakes form on top of these glaciers, the surrounding glaciers can become unstable and eventually lead to lake bursting, flooding and debris flows downstream.
By combining expertise about the cryosphere with field campaigns and an extensive fleet of operational and upcoming satellites, NASA and its partners can help communities worldwide to predict the effects of climate change and to potentially mitigate natural hazards and disasters that are deeply connected to our planet’s cryosphere.
ESA Entry for Earth Day 2021
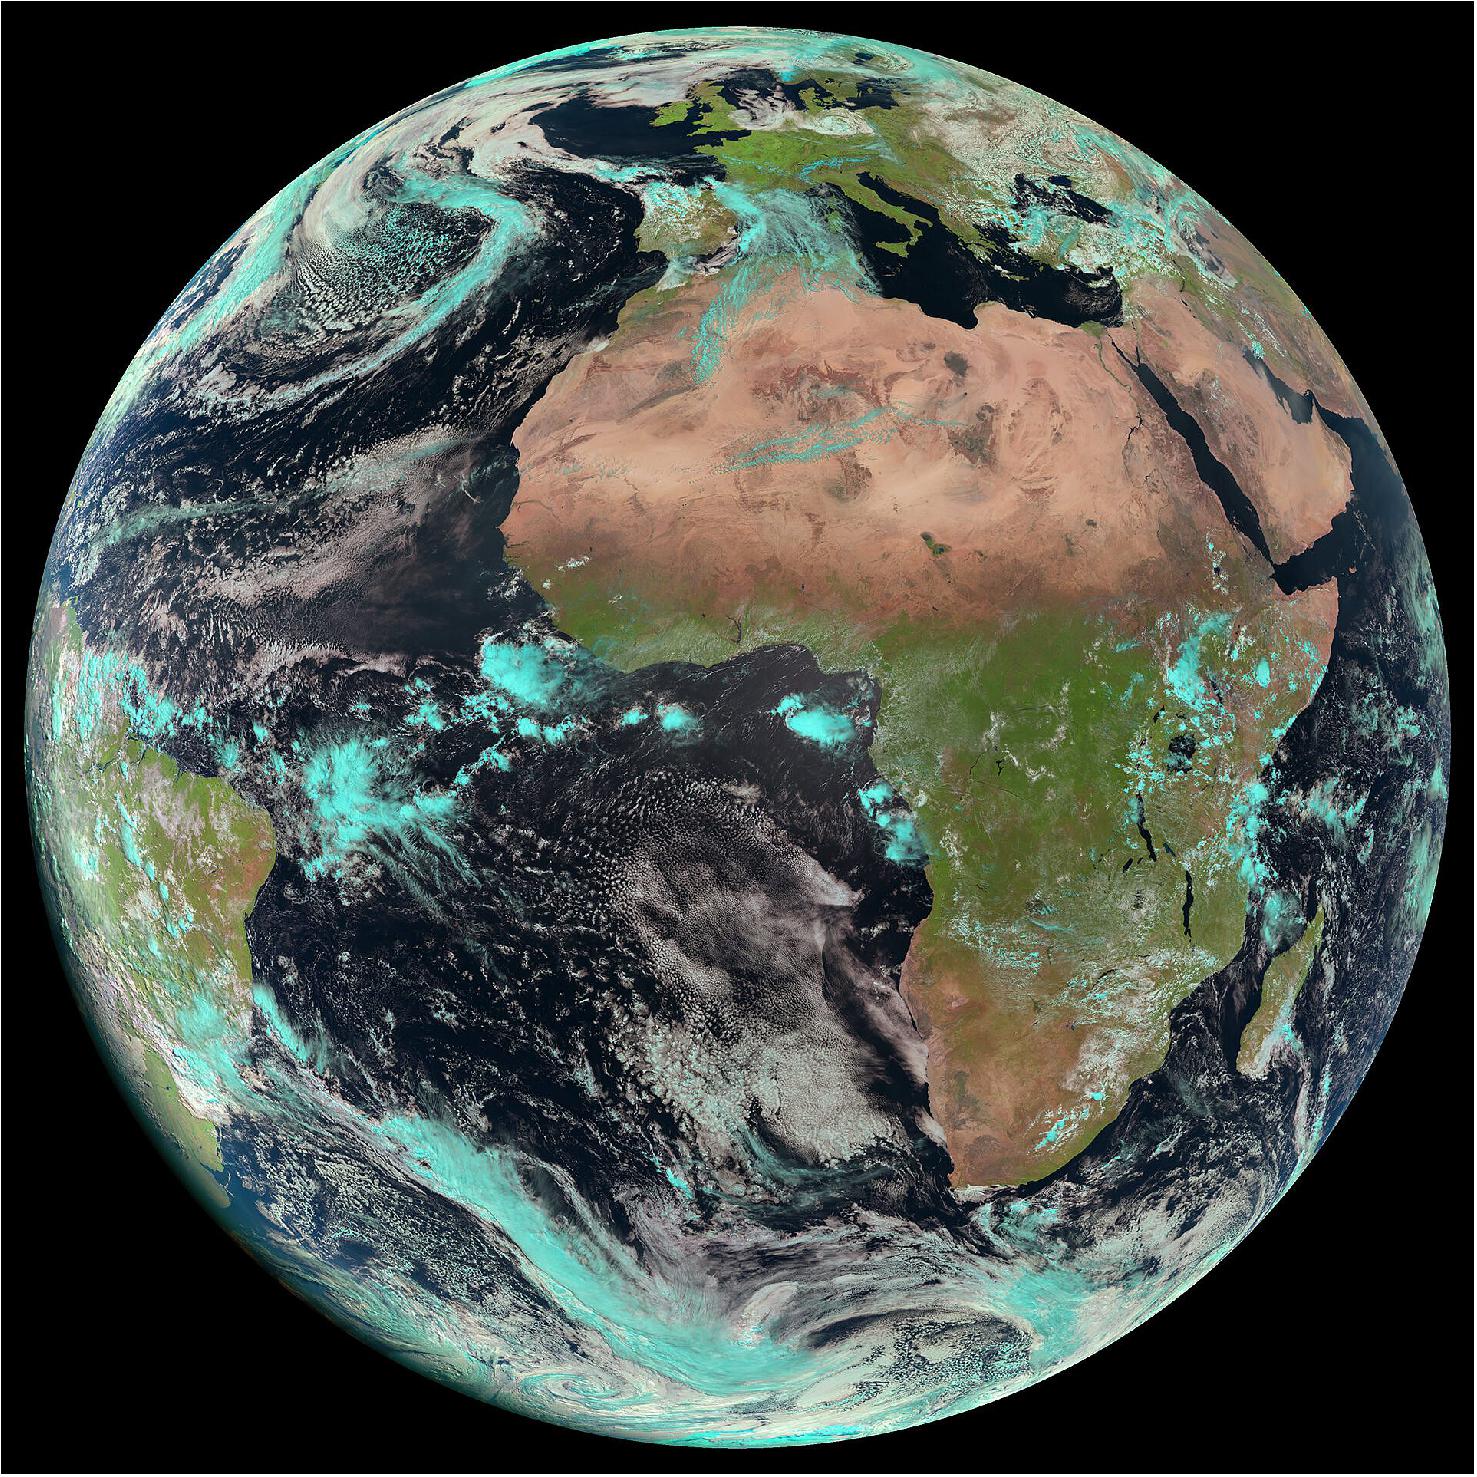
• April 19, 2021: At ESA, every day is Earth Day. As we humans continue to subject our home planet to increasing pressures, we are better placed than ever to understand and monitor the consequences of what we inflict. Astronauts onboard the International Space Station give us the human perspective of how beautiful Earth is, while satellites orbiting above return systematic measures to take the pulse of our planet 24 hours a day. 4)
These measurements allow us to understand how Earth works as a system and how human activity is changing natural processes, leading to
climate change. This information is fundamental to global climate policy-making through international bodies such as the Intergovernmental Panel on Climate Change and UN Climate Change Conferences, the next being COP26 later this year.
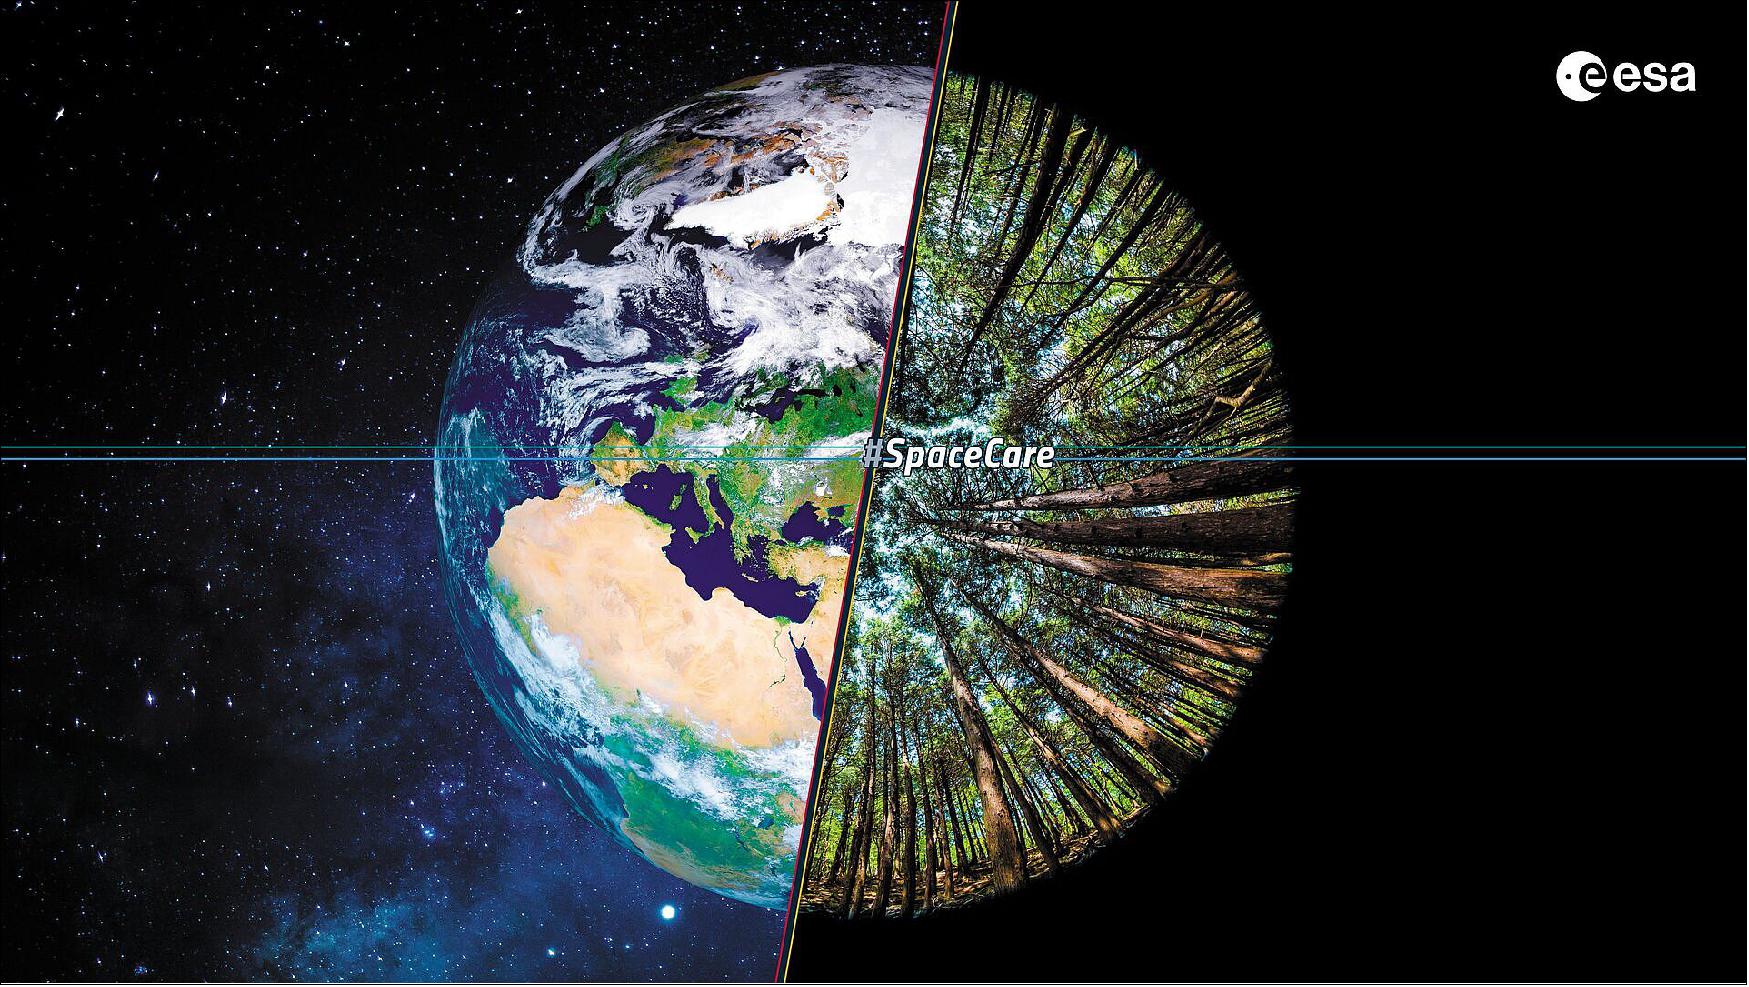
First held on 22 April, 1970, Earth Day is an annual celebration honoring our beloved Earth and raising awareness of the importance of protecting our planet for future generations. This year’s theme is ‘Restoring our Earth’, which focuses on the natural processes, emerging green technologies and innovative ways that can restore the world’s ecosystems.
ESA is a world-leader in Earth observation and remains dedicated to developing cutting-edge spaceborne technology to further understand the planet, improve daily lives, support effect policy-making for a more sustainable future, and benefit businesses and the economy.
While our Earth Explorers gather data to understand how our planet works and the impact that human activity and climate change are having on the planet. The European Union’s Copernicus Sentinels, developed and built by ESA, provide systematic data for environmental services that help adapt to and mitigate change and improve every day life.
Through ESA’s Climate Change Initiative, long-term data records provide a crucial line of evidence and deliver the hard facts, enabling scientists and decision-makers to curb emissions and develop resilience to the adverse effects of climate change.
Get to Know Your Planet with ESA
To celebrate Earth Day, we will be joined by Simonetta Cheli – Head of Strategy, Programme & Coordination Office at the ESA Directorate of Earth Observation Programmes.
• April 20, 2021: Launching this Earth Day 2021, the Teach with Earth educational webpage provides a variety of inspirational resources for educators to Teach with Earth and engage students in STEM subjects using our fascinating planet as the learning context. 5)
- Teaching with Earth promotes an interdisciplinary approach. Among many subjects, Earth and environmental science, Earth observation, and satellite technology requires a variety of science, technology, engineering, and math (STEM) skills and background knowledge.
- On Teach with Earth teachers will find a rich collection of ESA curricular classroom resources to engage primary and secondary students in STEM subjects which also help them learn about our planet, its complexities and the consequences of a rapidly changing world.
References
1) Lara Streiff, ”Earth Day Connections: NASA Study Predicts Less Saharan Dust in Future Winds,” NASA Feature, 19 April 2021, URL: https://www.nasa.gov/feature/esnt/
2021/nasa-study-predicts-less-saharan-dust-in-future-winds
2) Kate Ramsayer, ”Earth Day Connections: NASA Investigates Vegetation,” NASA Feature, 19 April 2021, URL: https://www.nasa.gov/feature/goddard/2021/earth-day-connections-nasa-investigates-vegetation
3) Roberto Molar Candanosa, Rob Garner, ”Earth’s cryosphere is vital for everyone. Here’s how NASA keeps track of its changes,” NASA Feature, 20 April 2021, URL: https://www.nasa.gov/feature/esnt/2021/
earth-s-cryosphere-is-vital-for-everyone-here-s-how-nasa-keeps-track-of-its-changes
4) ”Celebrate Earth Day with ESA,” ESA, 19 April 2021, URL: https://www.esa.int/About_Us/Corporate_news/Celebrate_Earth_Day_with_ESA
5) ”Teach with Earth educational webpage now online,” ESA Agency, 20 April 2021, URL: https://www.esa.int/Education/Teach_with_Earth
/Teach_with_Earth_educational_webpage_now_online
The information compiled and edited in this article was provided by Herbert J. Kramer from his documentation of: ”Observation of the Earth and Its Environment: Survey of Missions and Sensors” (Springer Verlag) as well as many other sources after the publication of the 4th edition in 2002. - Comments and corrections to this article are always welcome for further updates (eoportal@symbios.space).
ESA entry for Earth Day 2021 References Back to top