CYGNSS (Cyclone Global Navigation Satellite System)
EO
Ocean
NASA
Operational (extended)
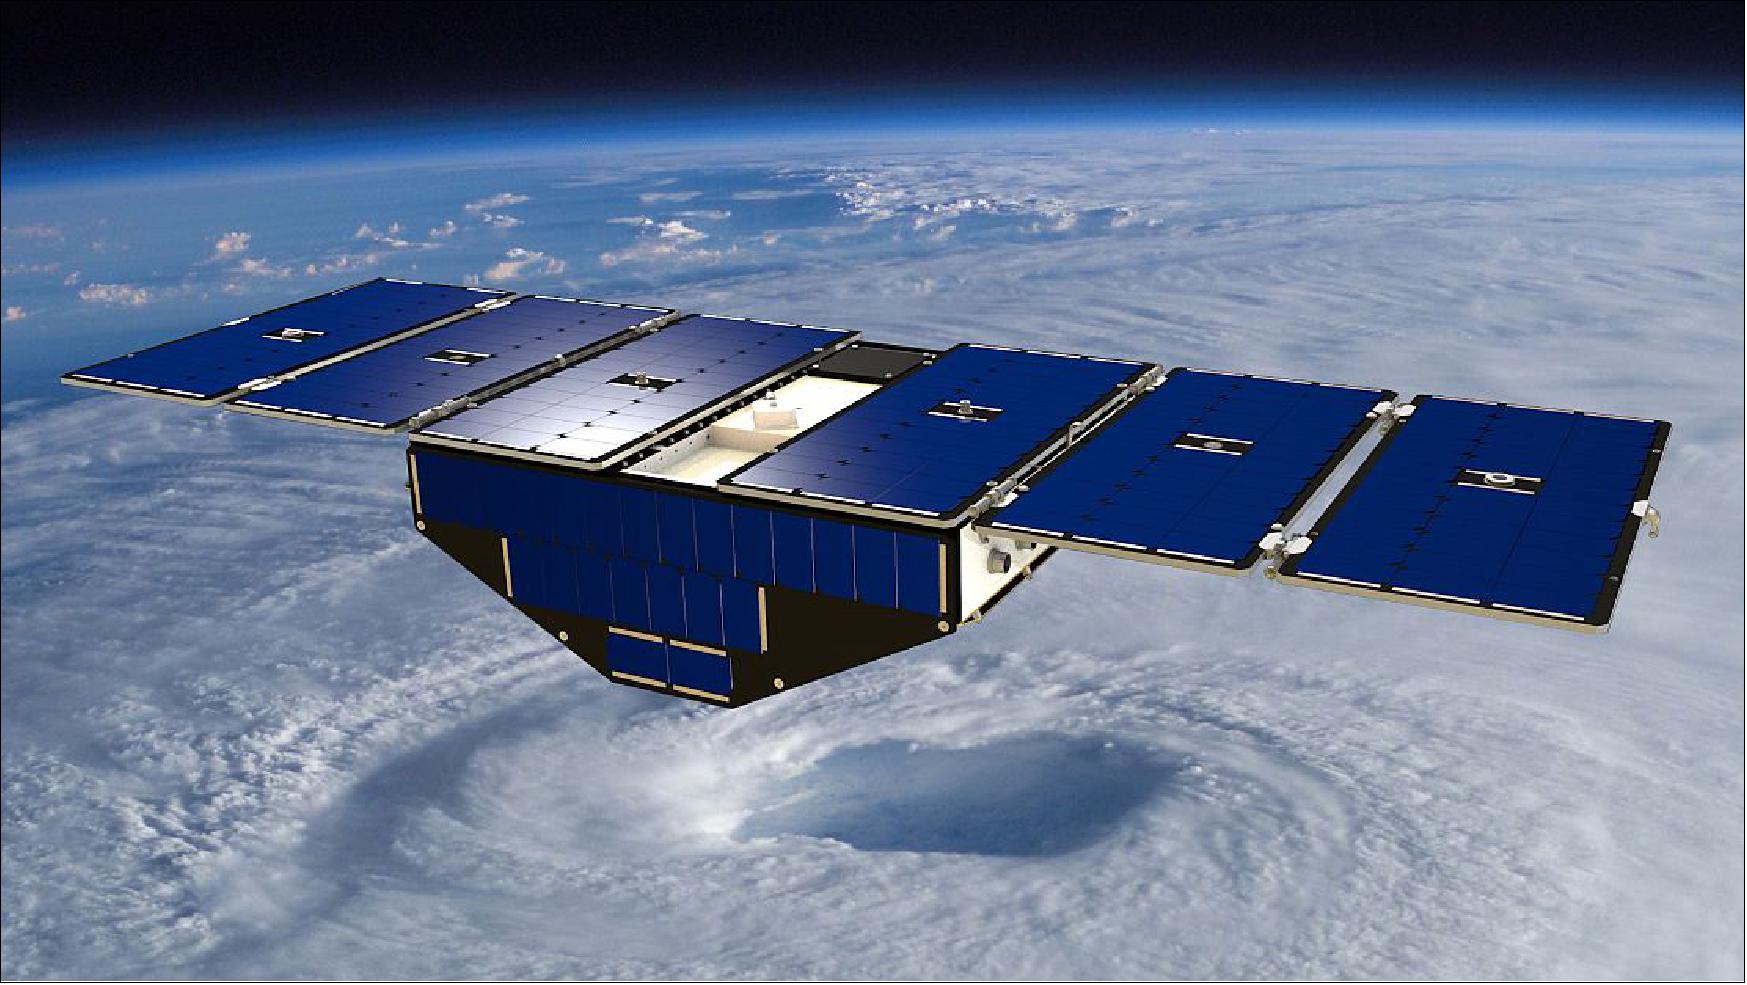
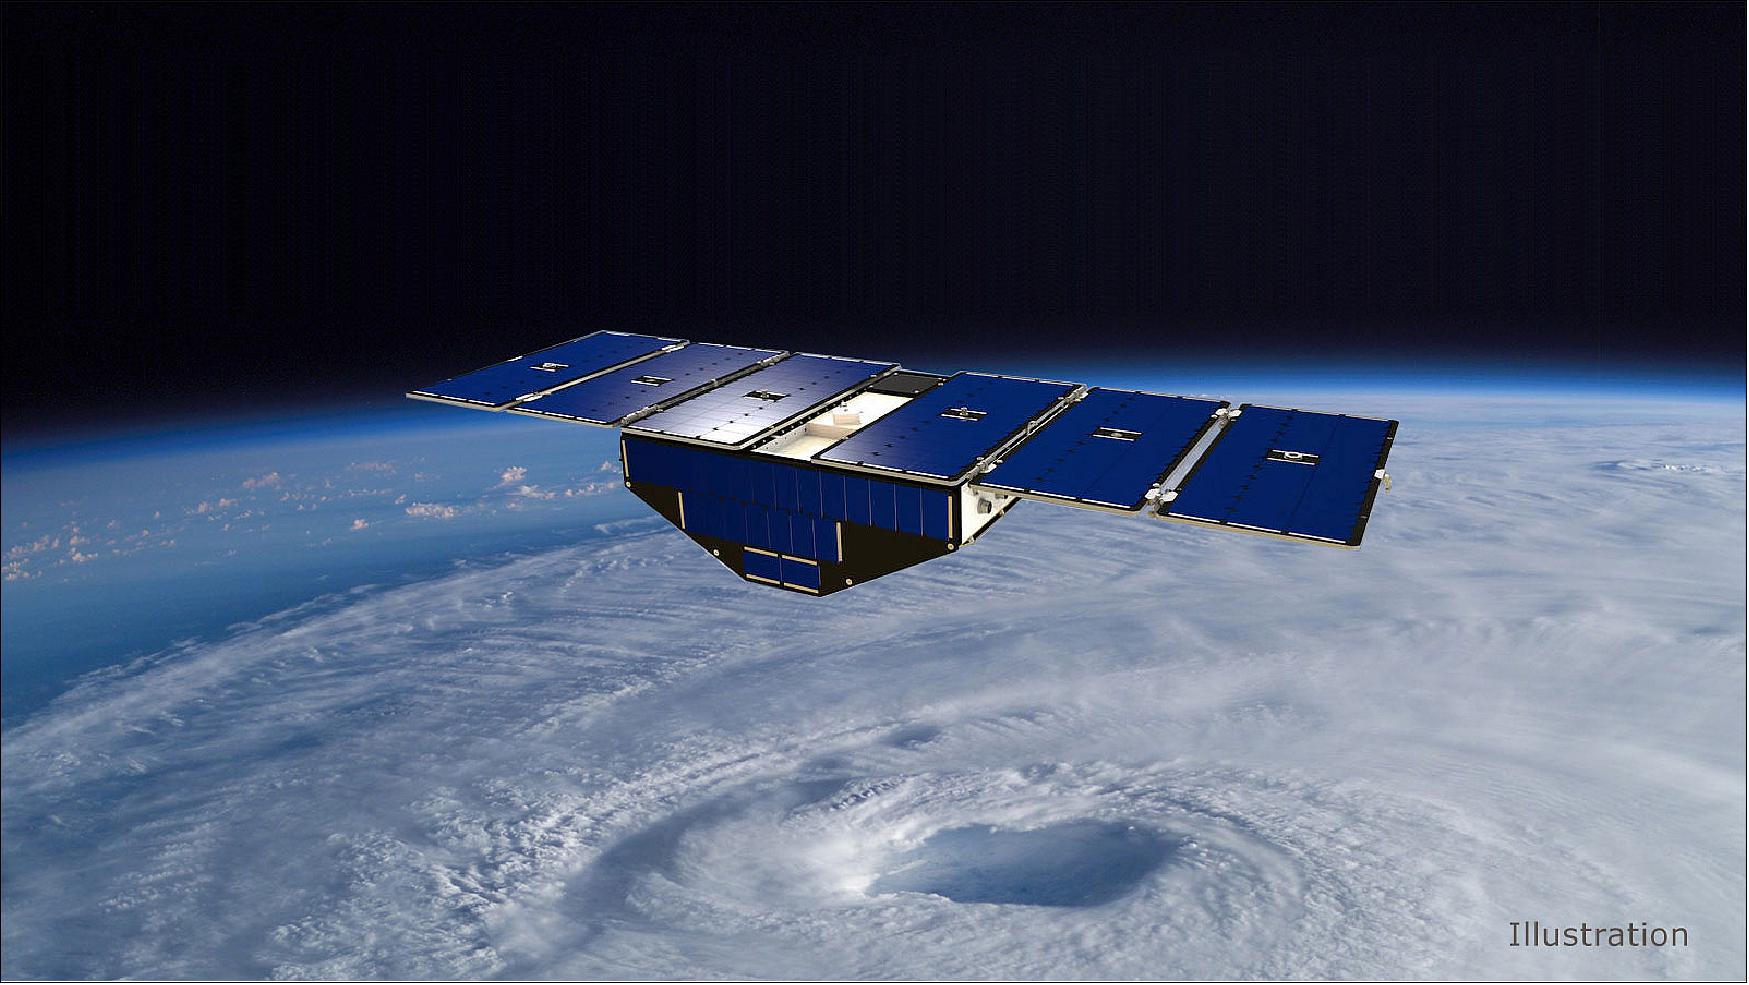
Launched in December 2016, Cyclone Global Navigation Satellite System (CYGNSS) is a constellation of eight mapping microsatellites operated collaboratively by the National Aeronautical and Space Administration (NASA) and the University of Michigan (UM). It aims to determine how tropical cyclones form and evolve.
Quick facts
Overview
| Mission type | EO |
| Agency | NASA, NOAA |
| Mission status | Operational (extended) |
| Launch date | 15 Dec 2016 |
| Measurement domain | Ocean |
| Measurement category | Ocean surface winds |
| Measurement detailed | Wind speed over sea surface (horizontal) |
| Instruments | DDMI (CYGNSS) |
| Instrument type | Other |
| CEOS EO Handbook | See CYGNSS (Cyclone Global Navigation Satellite System) summary |
Summary
Mission Capabilities
Onboard each CYGNSS satellite is a single instrument, the Delay Doppler Mapping Instrument (DDMI). Radio signals are sent from a higher altitude GPS satellite and reflected off the ocean to DDMI. The strength of this signal is indicative of the ocean surface wind speed which is calculated using the CYGNSS wind speed retrieval algorithm.
This data will help determine how tropical cyclones form and evolve, and hence cast more accurate predictions regarding these extreme weather events.
Performance Specifications
DDMI observes over a swath of 1480 km with a spatial resolution of 25 km. Ocean surface wind speeds can be determined with an uncertainty of 2 m/s or 10%, whichever is larger.
Each CYGNSS satellite undergoes a non-sun-synchronous orbit with an altitude of 520 km, a period of 95 minutes, and an inclination of 35°. This inclination restricts CYGNSS to measure ocean surface wind speeds between 38°N and 38°S. The satellites orbit in pairs with an orbital separation of 12 minutes between each of them.
Space and Hardware Components
Communication to the satellites is provided by S-band radio frequencies with a downlink rate of 4 Mbit/s and an uplink rate of 2 kbit/s.
The eight CYGNSS satellites were built by the Southwest Research Institute with each weighing 25 kg.
CYGNSS (Cyclone Global Navigation Satellite System)
Space Segment Launch Mission Status Sensor Complement Ground Segment References
CYGNSS is part of the NASA ESSP (Earth System Science Pathfinder) program referred to as an EVM (Earth Venture Mission). The overall objective of CYGNSS is to improve extreme weather predictions. The mission is focused on tropical cyclone (TC) inner core process studies. CYGNSS attempts to resolve the principle deficiencies with current TC intensity forecasts, which lie in inadequate observations and modeling of the inner core. The inadequacy in observations results from two causes: 1) 2)
1) Much of the inner core ocean surface is obscured from conventional remote sensing instruments by intense precipitation in the eye wall and inner rain bands.
2) The rapidly evolving (genesis and intensification) stages of the TC life cycle are poorly sampled in time by conventional polar-orbiting, wide-swath surface wind imagers.
CYGNSS is specifically designed to address these two limitations by combining the all-weather performance of GNSS bistatic ocean surface scatterometry with the sampling properties of a constellation of eight satellites. The use of a dense constellation of microsatellites results in spatial and temporal sampling properties that are markedly different from conventional imagers.
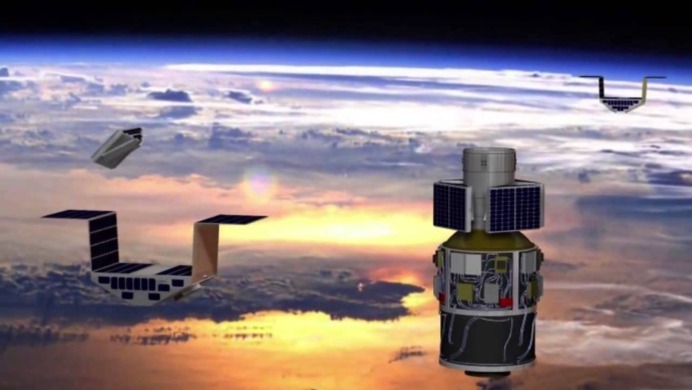
CYGNSS will use a constellation of eight small satellites in LEO (Low Earth Orbit) carried to orbit on a single launch vehicle. In orbit, CYGNSS’s eight microsatellite observatories will receive both direct and reflected signals from GPS (Global Positioning System) satellites. The direct signals pinpoint CYGNSS observatory positions, while the reflected signals respond to ocean surface roughness, from which wind speed is retrieved. 3) 4) 5)
The mission will study the relationship between ocean surface properties, moist atmospheric thermodynamics, radiation and convective dynamics to determine how a tropical cyclone forms and whether or not it will strengthen, and if so by how much. This will advance forecasting and tracking methods.
NASA selected and funded the CYGNSS mission proposal in June 2012. The eight CYGNSS satellites will be built by SwRI ( Southwest Research Institute). SSTL of Colorado, the U.S. subsidiary of the British spacecraft-builder, will provide the GPS receivers for the mission, and SNC (Sierra Nevada Corporation) will provide the DM (Deployment Module). 6) 7) 8) 9) 10) 11) 12) 13)
The University of Michigan (UM) is leading the NASA hurricane prediction project. The CYGNSS science team consists of the following institutions: UM, Ann Arbor, MI (Christopher S. Ruf, PI); SwRI, Boulder, CO; NOAA/AOML (Atlantic Oceanographic and Meteorological Laboratory), Miami, FL; University of Miami, Coral Gables, FL; NOAA/NESDIS, Silver Spring, MD; Ohio State University, Columbus, OH; Purdue University, Lafayette,IN; and the NOAA/ESRL (Earth System Research Laboratory), Boulder, CO.
CYGNSS science goals and objectives
CYGNSS science goal: Understand the coupling between ocean surface properties, moist atmospheric thermodynamics, radiation, and convective dynamics in the inner core of a TC (Tropical Cyclone).
CYGNSS objectives:
• Measure ocean surface wind speed in all precipitating conditions, including those experienced in the TC eyewall
• Measure ocean surface wind speed in the TC inner core with sufficient frequency to resolve genesis and rapid intensification.
Questions answered by CYGNSS:
• How do the dynamics within TCs determine their intensity at landfall?
- CYGNSS measures surface winds in the TC inner core with a 4 hr average revisit time, enabling the dynamics of the TC to be investigated
• How do moist atmospheric thermodynamics, radiation and convection interact to control the development of TCs?
- CYGNSS measures wind speed through intense rain fall, enabling researchers to better understand the complex feedback between mass and energy interchange processes.
Secondary science: Support the operational hurricane forecast community by producing and providing ocean surface wind speed data products, and helping to assess the value of these products for use their retrospective studies of potential new data sources.
Historical Perspective
Why We Need to Measure Ocean Surface Winds from Space
According to the World Meteorological Organization, over 10,000 weather stations on land provide (at least) three-hourly observations of meteorological conditions at or near Earth’s surface, including: cloud cover, atmospheric pressure, temperature, precipitation, and wind direction and speed. Despite the extensive characterization of meteorological conditions over land, relatively limited observations are available to describe meteorological conditions over the ocean—which covers approximately 70% of Earth’s surface! While ship- and buoy-based measurement platforms provide some information over the ocean surface, satellite-based measurements play a critical role filling in the gaps and providing a truly global characterization of meteorological conditions, including ocean surface wind direction and speed. 14)
Technical Underpinnings: Around the time of World War II, several nations began to experiment with radar technology as part of their defense systems. The noise observed in the received signals during these early surface-based radar measurements over ocean surfaces was found to be the result of winds over the ocean. This finding opened new avenues of technology and research, and resulted in the development of a number of radar remote sensing systems designed specifically to measure ocean surface winds.
Since the 1970s, NASA has carried out a series of missions that have focused on monitoring winds over the ocean surface from space (Figure 1) based on scatterometry, whereby the instrument sends a pulse of microwave energy towards the Earth’s surface and measures the intensity of the return pulse that reflects back from the surface, and microwave radiometry, whereby the instrument measures natural thermal emission by the wind-driven ocean foam. The first attempt to measure winds from space occurred when NASA built a “technology demonstration” instrument that flew onboard NASA’s Skylab—the United States’ first space station—from 1973 to 1979. This successful demonstration showed that remotely sensed measurements of ocean surface winds were indeed possible using space-based scatterometers. NASA launched its second scatterometer, the SeaSat-A Scatterometry System (SASS), onboard the SeaSat-A satellite in 1978. SeaSat-A also carried the first ocean wind radiometer, the Scanning Multichannel Microwave Radiometer (SMMR). While the mission lifetime was limited (it only operated from June to October of that year, due to a power system failure), SASS and SMMR were able to confirm that space-based scatterometry and radiometry were effective tools for making accurate ocean surface wind measurements.
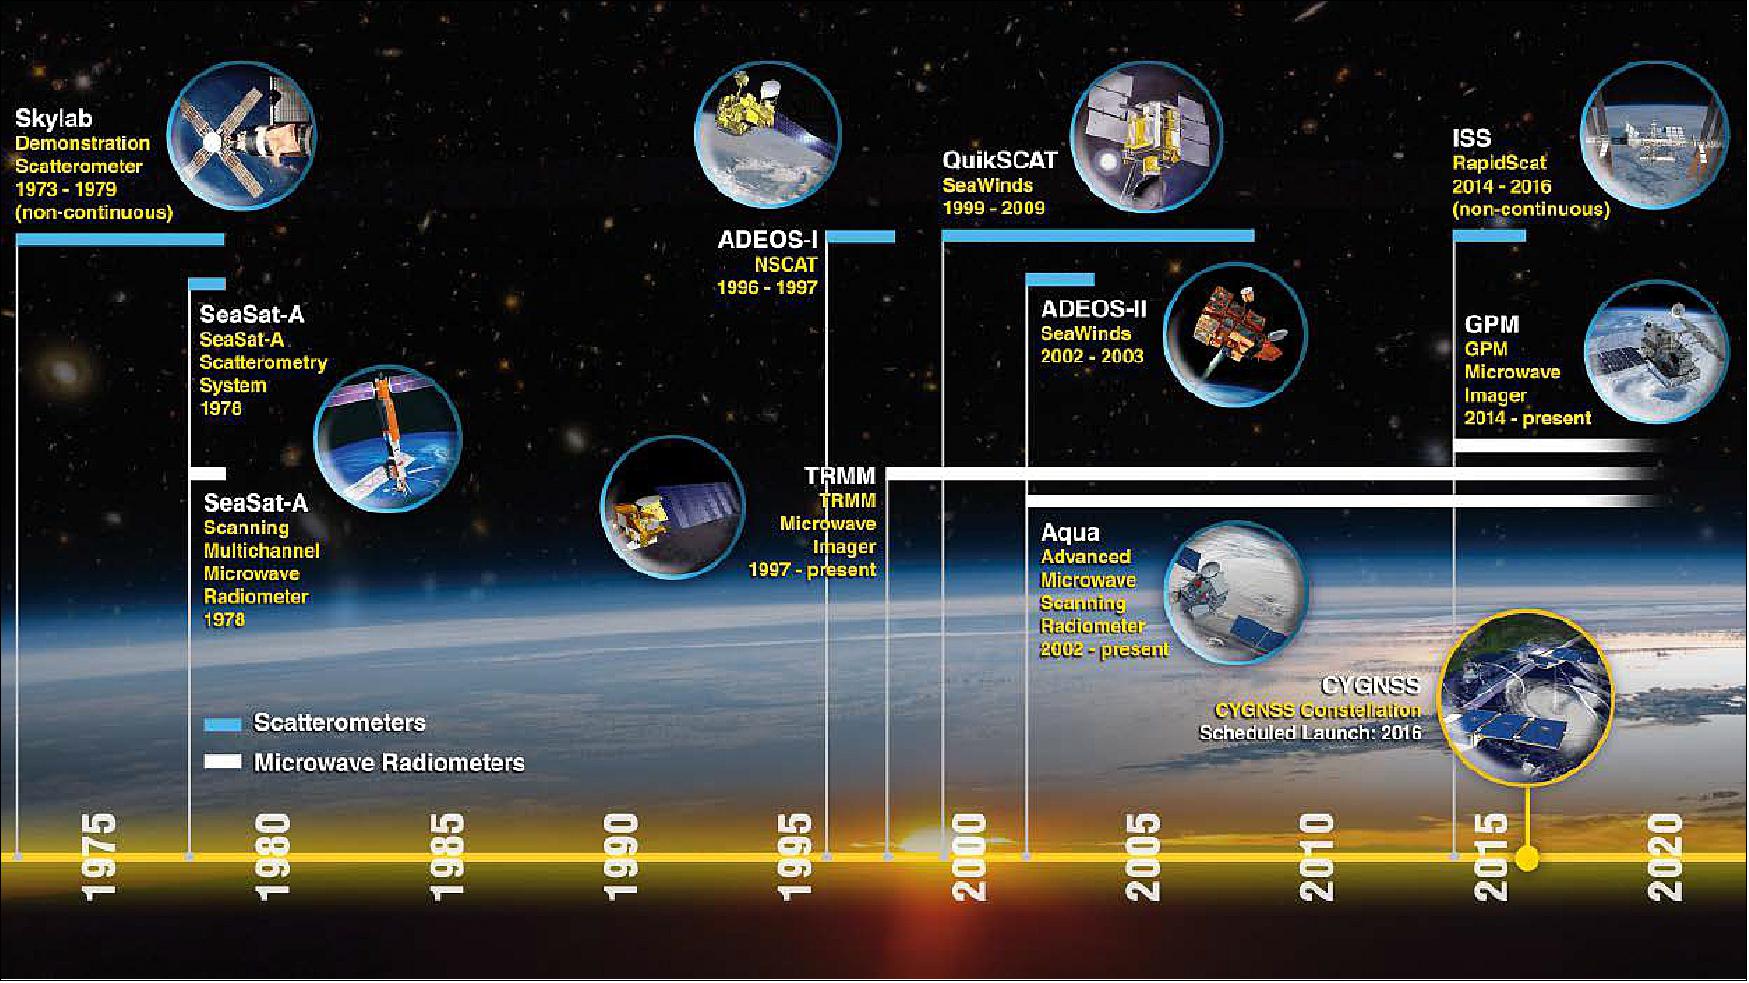
Increasing Technological Sophistication: It was not until nearly twenty years later, in August 1996, that NASA would launch its next scatterometry mission, called the NASA Scatterometer (NSCAT), onboard the JAXA (Japan Aerospace Exploration Agency) ADEOS-1 (Advanced Earth Observing Satellite-1). NSCAT operated continuously at a microwave frequency of 13.995 GHz, using backscatter data from the instrument’s radar to generate 268,000 globally distributed wind vectors (i.e., both wind speed and direction) each day. Every two days, NSCAT measured wind speeds and directions over at least 90% of ice-free ocean surfaces at a resolution of 50 km. Like some of its predecessors, the mission was short-lived; the solar panels on the ADEOS-I satellite ceased to function properly in July 1997, ending the mission less than a year following its launch.
Following the end of the ADEOS-I mission, NASA’s Jet Propulsion Laboratory built two identical SeaWinds scatterometry instruments. The first launched in 1999 on NASA’s Quick Scatterometer (QuikSCAT) satellite. SeaWinds used a rotating dish antenna to send microwave pulses at a frequency of 13.4 GHz down to Earth’s surface. The characteristics of the returned signal were used to estimate surface wind speed and direction with an accuracy of ±2 m/s and ± 20° respectively, at a resolution of 25 km. The second SeaWinds instrument launched on JAXA’s ADEOS-II satellite in 2002; however, it suffered an eerily similar fate to its predecessor: the spacecraft failed less than a year after launch in October 2003. Meanwhile, the SeaWinds instrument on the earlier QuikSCAT remained fully operational until 2009, when a bearing in the radar antenna’s spin mechanism failed. While the instrument performance was not affected by the spin mechanism failure, the scatterometer’s coverage area was—and remains—significantly reduced. Data from SeaWinds, however, remain important for calibrating other scatterometers currently in orbit.
To help overcome the loss of functionality of both SeaWinds instruments, NASA refurbished a QuikSCAT engineering model—a copy of the instrument built specifically for testing—to fly on the ISS (International Space Station). The ISS Rapid Scatterometer (ISS-RapidScat), which was installed on the station in 2014. Like QuikSCAT, ISS-RapidScat measured both wind speed and direction over the ocean surface at a resolution of approximately 25 km. On November 28, 2016, NASA announced the end of the ISS-RapidScat mission. — Note: On August 19, 2016, a power distribution unit for the space station’s Columbus module failed, resulting in a power loss to ISS-RapidScat. Later that day, as the mission operations team from NASA/JPL (Jet Propulsion Laboratory) attempted to reactivate the instrument, one of the outlets on the power distribution unit experienced an electrical overload. In the following weeks, multiple attempts to restore ISS-RapidScat to normal operations were not successful, including a final attempt on October 17.
While radar scatterometers have been used to provide high-resolution measurements of ocean-surface wind speed and direction, they cannot observe the inner core of a hurricane because it is obscured by intense precipitation in the eyewall and inner rainbands. In addition, the rapidly evolving stages of the tropical cyclone life cycle occur on relatively short timescales (i.e., on the order of hours or days), and are poorly sampled by conventional polar-orbiting, wide-swath satellite imagers such as QuikSCAT and ADEOS-II that generally pass over a particular spot on Earth, at most every other day. It is in response to the lack of such data and the need for consequent understanding of the phenomena being measured, that CYGNSS came into being.
CYGNSS is a NASA Earth System Science Pathfinder Mission. CYGNSS will collect the first frequent, space-based measurements of surface wind speeds in the inner core of tropical cyclones using a constellation of eight microsatellites. The microsatellite observatories will provide nearly gap-free Earth coverage owing to an orbital inclination of approximately 35° from the equator, with a mean (i.e., average) revisit time of seven hours and a median revisit time of three hours. These orbital parameters will allow CYGNSS to measure ocean surface winds between 38° N and 38° S latitude, which—notably—includes the critical latitude band for tropical cyclone formation and movement (see Figure 19).
A Tightly Knit Partnership
Funded by NASA’s Science Mission Directorate and managed by NASA/LaRC (Langley Research Center), the University of Michigan (UM) has been selected to serve as the lead institution for CYGNSS, while the SwRI (Southwest Research Institute) has primary responsibility for production of the CYGNSS microsatellite observatories. The UM Space Physics Research Laboratory collaborated with SwRI on the design, fabrication, and development of the microsatellite observatories. NASA’s Launch Services Program at the agency’s Kennedy Space Center is responsible for management and oversight of the Pegasus XL launch services.
The UM Climate and Space Department will house the CYGNSS SOC (Science Operations Center), which is responsible for constellation calibration/validation activities, routine science data acquisition and special requests, and data processing and storage. The CYGNSS MOC (Mission Operations Center) will be located within SwRI’s Planetary Science Directorate in Boulder, CO. The MOC will be responsible for mission planning, flight dynamics, and command and control tasks for each of the microsatellite observatories in the constellation. The data from CYGNSS will be made freely available via the NASA/JPL (Jet Propulsion Laboratory) PODAAC ( Physical Oceanography Distributed Active Archive Center).
Other primary partners include: Sierra Nevada Corporation, which will provide the deployment module for the microsatellite observatories; Surrey Satellite Technology, U.K., which will be responsible for the DDMI (Delay Doppler Mapping Instrument); and Orbital ATK, which will provide the launch vehicle for the mission (Pegasus XL rocket).
Space Segment
The eight CYGNSS microsatellite constellation can pass over the ocean more frequently than one large satellite could. This allows the satellites to capture a detailed view of the ocean’s surface. The observatory satellites are able to capture data from the inner core of tropical cyclones because the satellite signals can travel through extreme rainfall. 15) 16)
The number of satellites, their orbit altitudes and inclinations, and the alignment of the antennas are all optimized to provide unprecedented high temporal-resolution wind field imagery of TC (Tropical Cyclone) genesis, intensification and decay.
The satellites are designed and developed at SwRI. Each CYGNSS observatory consists of a microsatellite platform hosting a GPS receiver modified to measure surface reflected signals. Each observatory simultaneously tracks scattered signals from up to four independent transmitters in the operational GPS network. The number of observatories and orbit inclination are chosen to optimize the TC sampling properties. The result is a dense cross-hatch of sample points on the ground that cover the critical latitude band between ±35° with an average revisit time of 4.0 hrs.
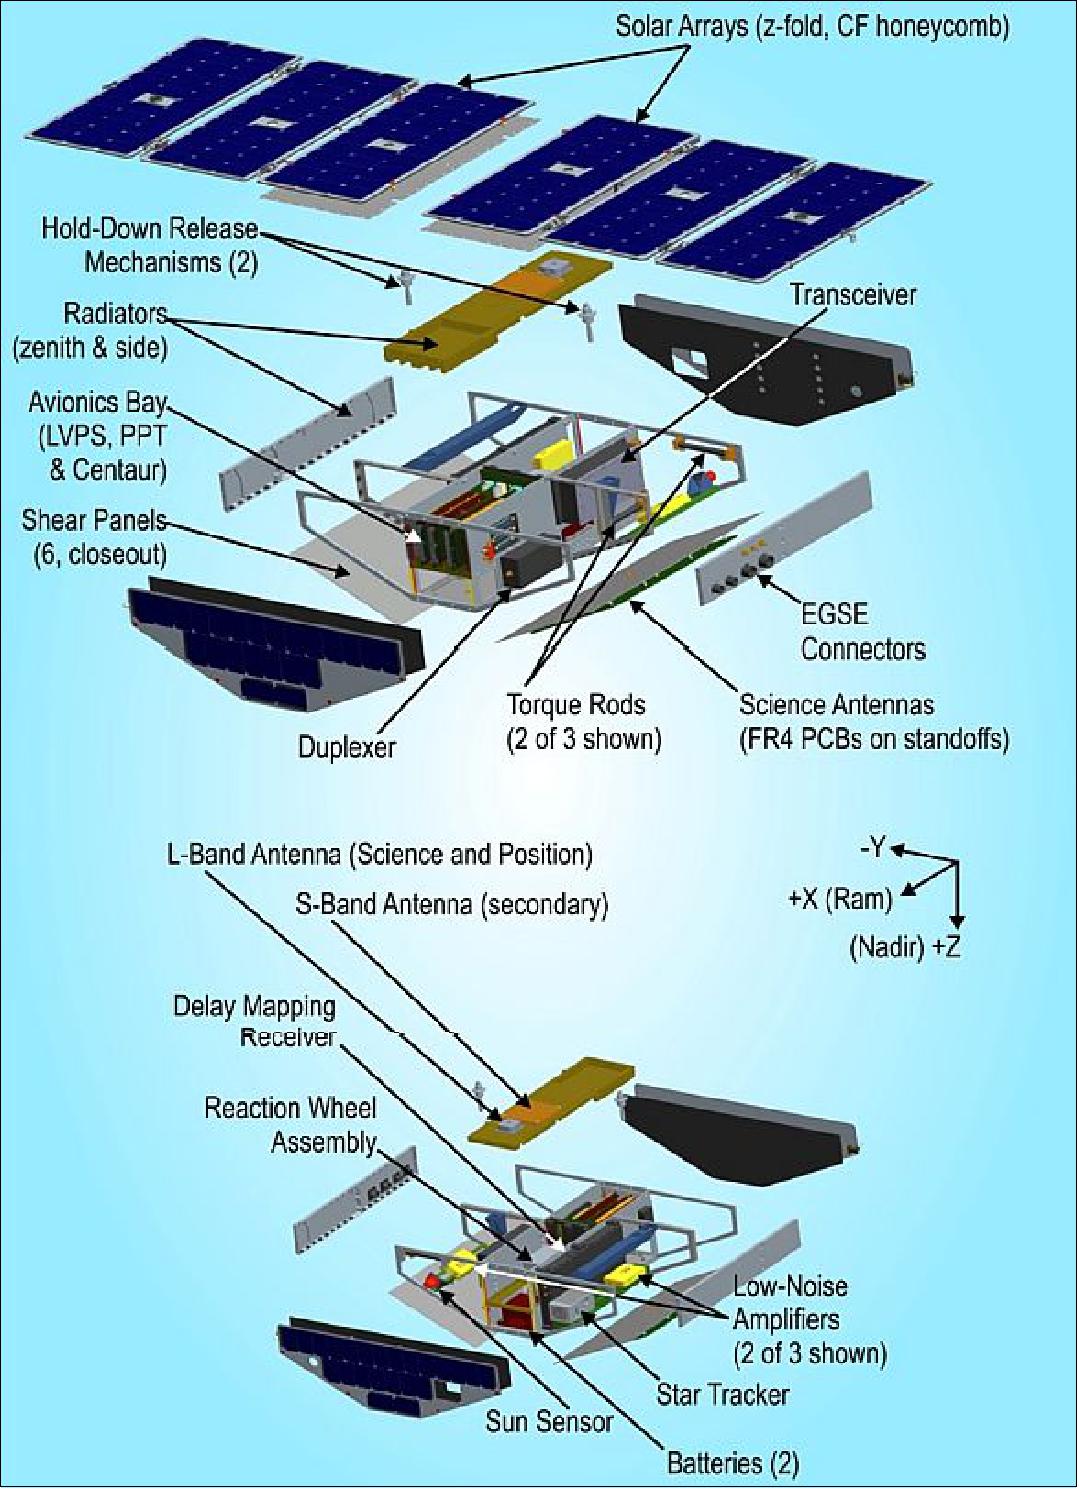
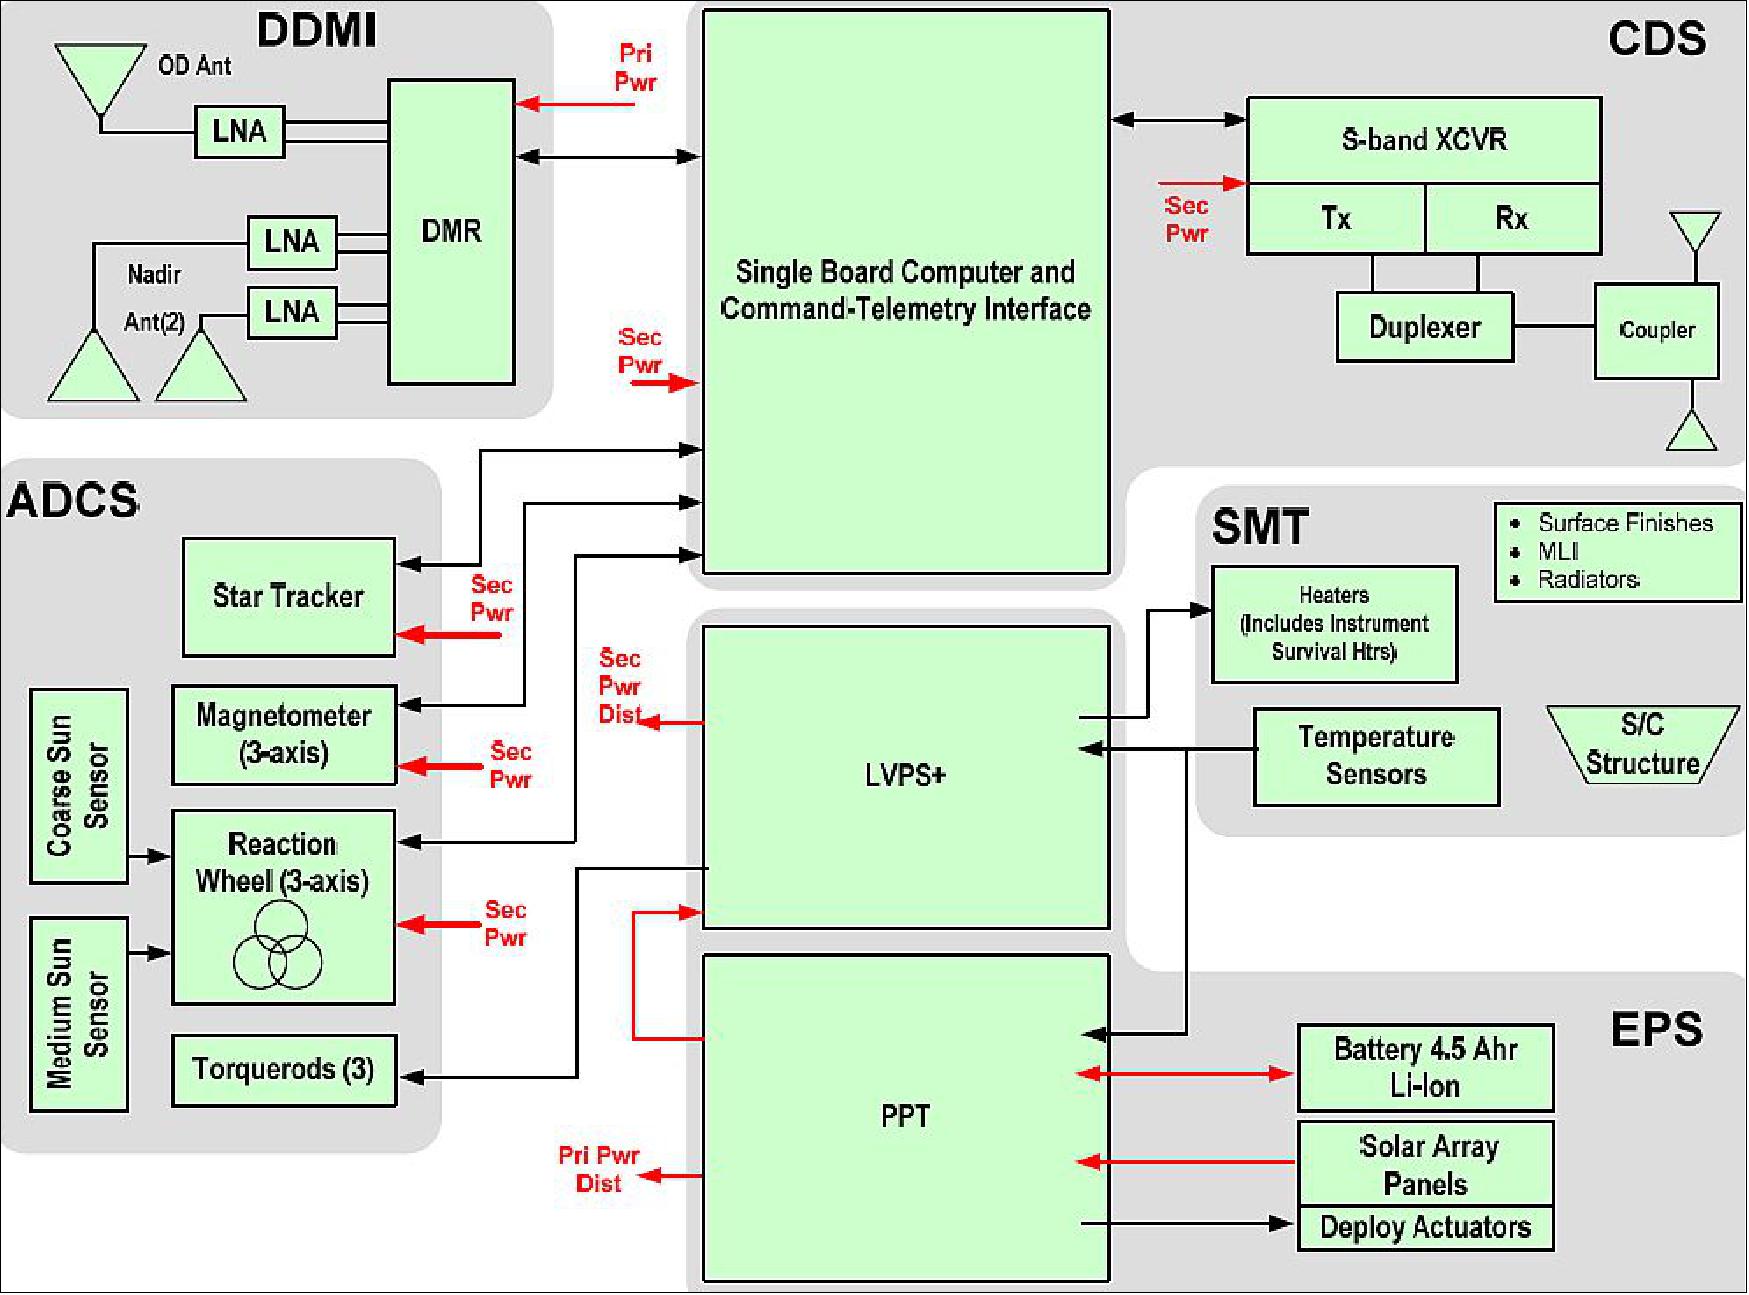
The CYGNSS observatory is based on a single-string hardware architecture (Figure 5) with functional and selective redundancy included for critical areas. The microsatellite has been designed from the beginning for ease of manufacture, integration, and test to provide a low-risk, cost-effective solution across the constellation.
SMT (Structure, Mechanisms, and Thermal): The SMT subsystem design leverages SwRI's instrument and avionics SMT heritage and capabilities to meet SMT requirements.
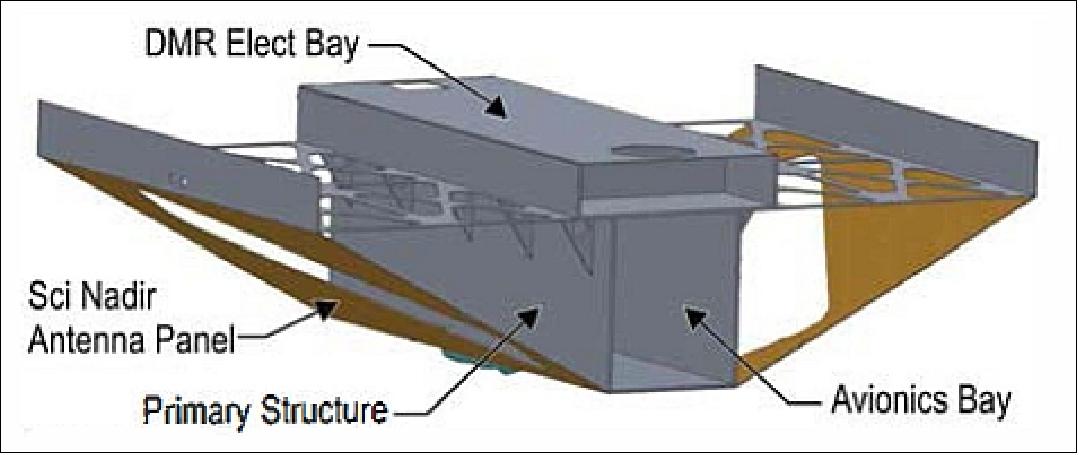
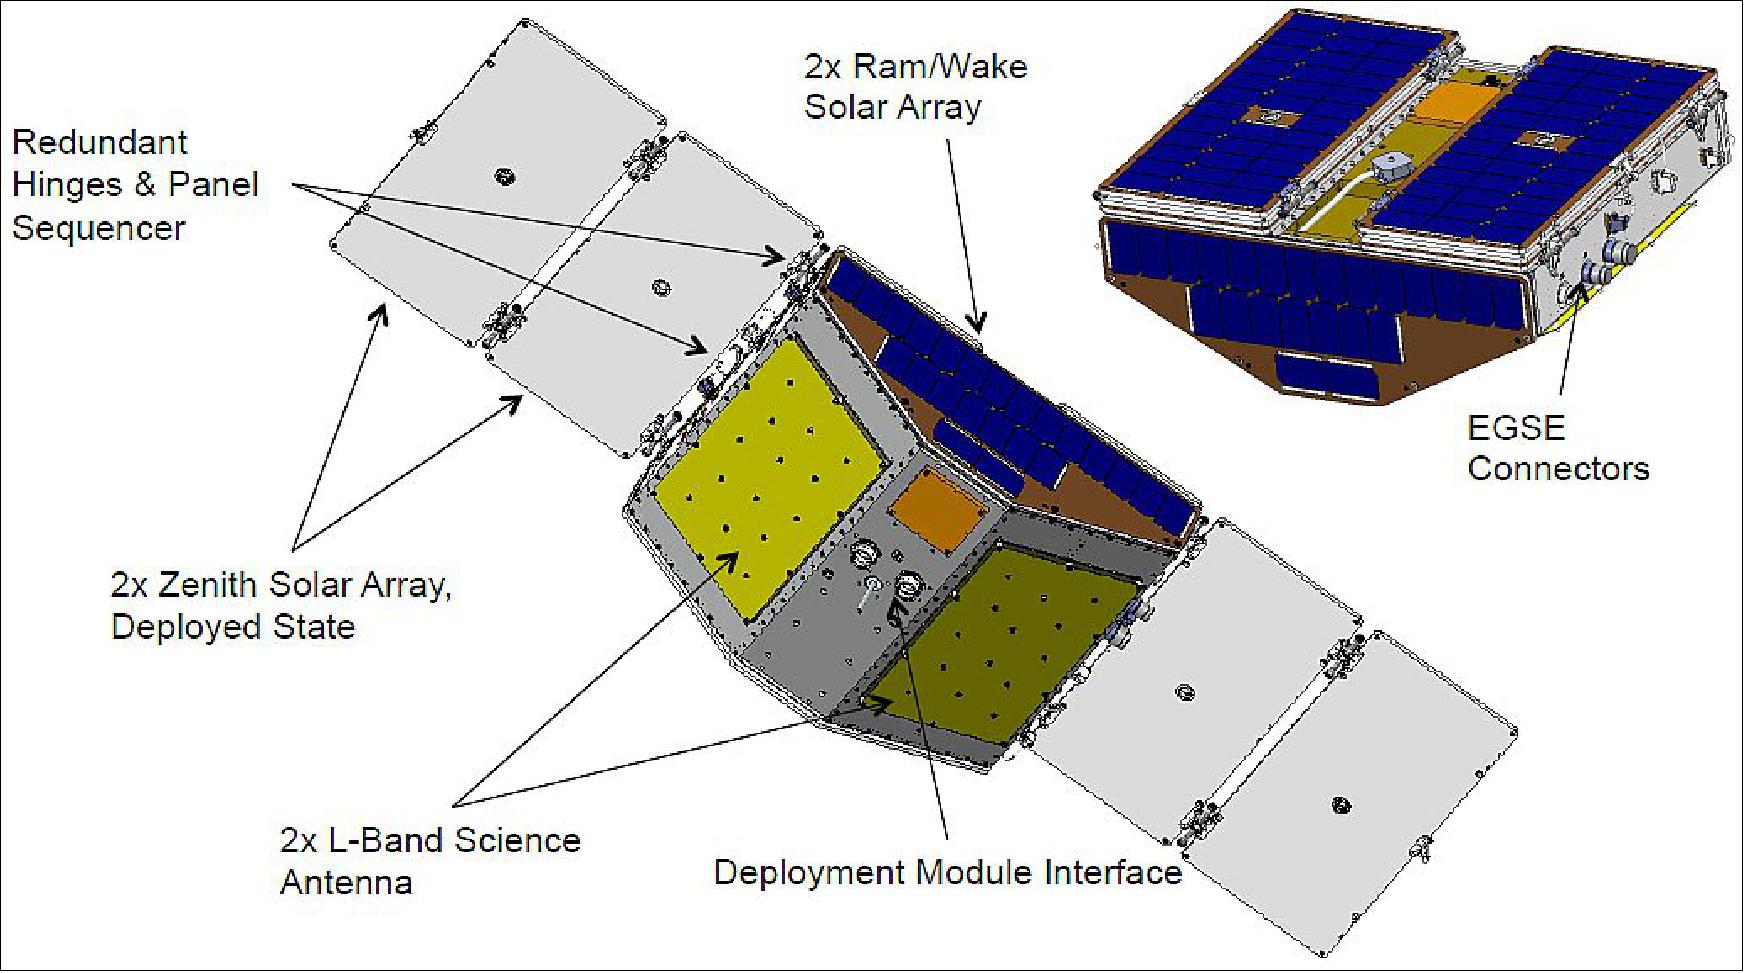
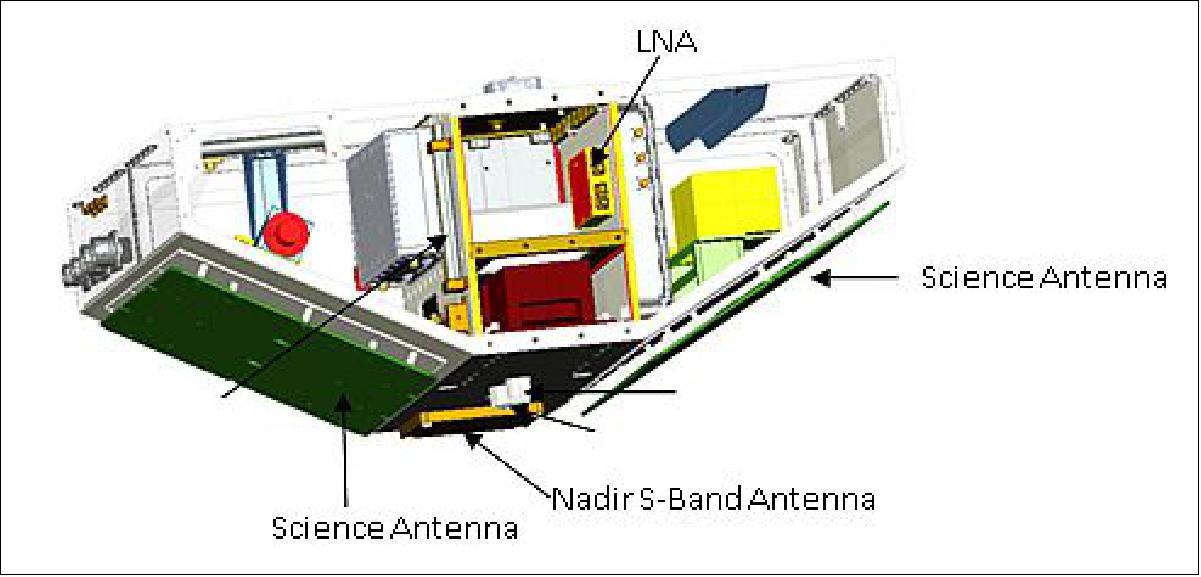
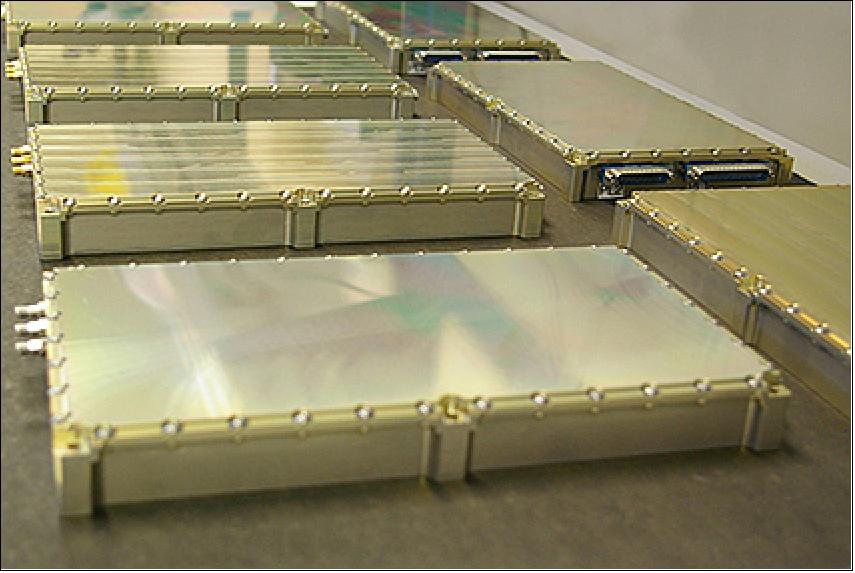
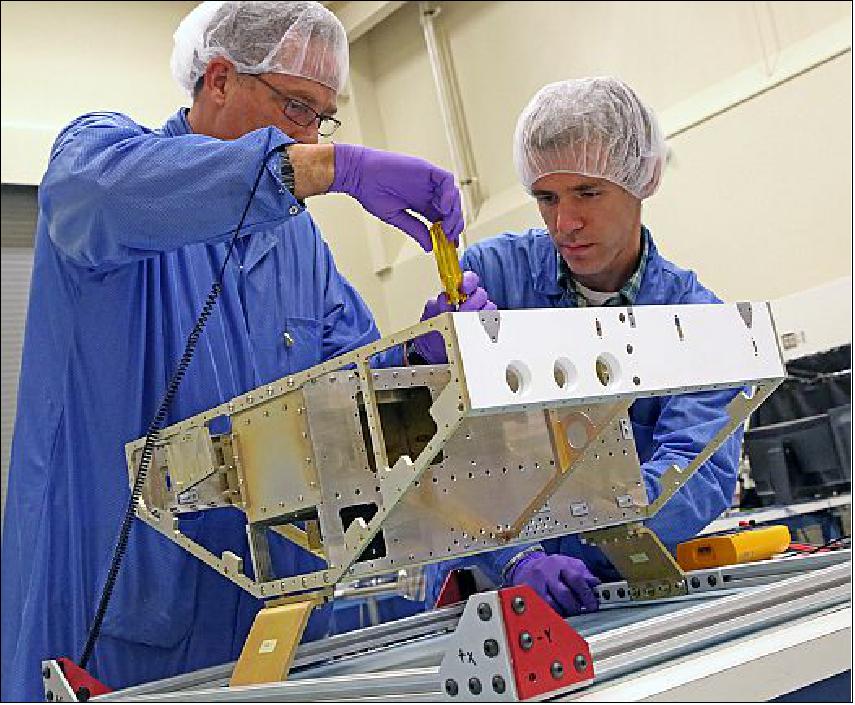
Structure: The microsatellite structure requirements are driven by physical accommodation of the DDMI antennas, the S/As(Safe/ Arms), and launch configuration constraints. The design uses milled AI piece parts bolted together to provide an integrated, mass efficient solution for CYGNSS. The spacecraft shape is specifically configured to allow clear nadir and zenith FOV for the DDMI antennas, while its structure integrates the microsatellite and instrument electronic boards directly by creating avionics and DMR (Delay Mapping Receiver) "bays" (Figure 2).
The avionics and DMR bays form the core of the microsatellite; all other components are mounted to this backbone with structural extensions included to accommodate the Aluminum honeycomb-based S/As and DDMI nadir antenna assemblies. The structural configuration allows easy access to all observatory components when the nadir DDMI antenna panel assemblies and the microsatellite endplates are removed for observatory AI&T (Assembly, Integration and Test).
TCS (Thermal Control Subsystem): Thermal control is provided by heaters and MLI. The primary radiator is located on zenith surface in the S/A gap along the observatory centerline, with a second radiator on the nadir baseplate. These locations are chosen to provide a direct, cohesive thermal conductive path to the primary observatory dissipative loads. The radiators are coated with 5 mil ITO/Tef/Ag, while MLI is used on nonradiating external surfaces. All materials used in the thermal design are flight qualified and compatible with the minimal CYGNSS contamination control requirements.
ADCS (Attitude Determination and Control Subsystem): The spacecraft are 3-axis stabilized (momentum biased). Attitude sensing is provided with a Star Tracker (6 arsec accuracy), MAI horizon sensors (0.5º accuracy, ±5º range) and a Honeywell magnetometer (model: 230212, 10 nT sensitivity, ±50,000 nT range). Actuation is provided by a Sinclair momentum wheel (30 mNms @ 5600 rpm, 2 mNm torque) and by SatServ torque rods (1 Am2, residual moment < 0.1 Am2).
The ADCS has three primary states of operation: rate damping, nadir acquisition, and normal pointing. The rate damping state is used initially after separation from the LV (Launch Vehicle) and for anomaly recovery if rates exceed normal state capabilities. Rate damping uses a "B-dot" algorithm to command magnetic dipole moments opposed to the rate of change of the magnetic vector, both measured in body coordinates. It only uses the sensed magnetic field, and does not rely on a correct orbital ephemeris or magnetic field model. The wheel speed is off for launch and initial tip-off recovery, or set to its nominal value during anomaly recovery.
After the body rates are damped, the system transitions into nadir acquisition, which monitors the pitch/roll horizon sensors to determine a rough Earth vector. The sensors are not assumed to be in their linear range; simple "on-Earth" and "off-Earth" measurements are used to establish slow roll and pitch rates to bring the sensors into their linear range (±5°). The momentum wheel is also maintained relatively close to its commanded nominal speed, with a desaturation gain much lower than normal.
EPS (Electrical Power Subsystem): The EPS is designed to perform battery charging without interrupting science data acquisition. It is based on a 28±4 V dc primary power bus with electrical power generated by a 8-panel rigid S/A (Safe/Arm). The 0.71m2 total area S/A provides a 30.3% margin during max eclipse periods (35.8 minutes). The design provides 43.4% margin during these periods. When stowed, the z-fold design of the S/A allows the solar cells to face outward, combining with the two supplemental ram/wake S/As to power the microsatellite indefinitely in standby mode before the S/A deployment (22% margin). Electrical power storage for eclipse operations is provided by 2 ABSL 1.5 Ah Li-ion 8s1p batteries connected directly to the primary power bus. The batteries are "build-to-print" and configured for 3 Ah (EOL) at 28.8 V nominal. Battery charge regulation for the CYGNSS EPS is a PTT (Peak Power Tracking). The EPS battery charging and power distribution hardware operates independent of FSW (Flight Software) except for configuration commanding and status reporting. Over-current protected switched power services are provided for the DDMI and initial microsatellite power application. A power of 70 W (30% margin)is generated with triple junction solar cells. The Sierra Nevada Corporation provided the deployable solar array assemblies for each of the eight microsatellites.
RF communications: The S-band transceiver is a single card communication solution developed by SwRI to provide a low-cost, radiation-tolerant, communication system. The core of the transceiver is a SDR (Software Defined Radio) architecture configured to provide S-band (2 GHz) communications. The transceiver provides OQPSK (Offset Quadrature Phase Shift Keying) encoded transmit data at 1.25 Mbit/s with a FSK (Frequency Shift Keying), the uplink receiver is supporting data rates up to 64 kbit/s.
Configuration | Accommodate DDMI antennas and 100% DDMI duty cycle |
Power | 38.3 W (available: 70 W EOL, margin: 30%) |
ADCS | 3-axis stabilized, pitch momentum-biased nadir-pointed, 2.2º (3σ) knowledge and 1.3º (3σ) control (horizon sensors, magnetometer, pitch momentum wheel, torque rods) |
RF communication | 4 Mbit/s downlink data rate, S-band with 3.2 dB margin provides 31% science data downlink margin |
Spacecraft mass | 25 kg (each); total mass of 8 spacecraft = 200 kg |
Spacecraft developer | SwRI (bus and avionics) |
Instrument (sensor complement) | Surrey Satellite Technology, US |
Deployment module | NASA/ARC (Ames Research Center) |
Design life | 2 years of operations (+mission extension) |
Development Status
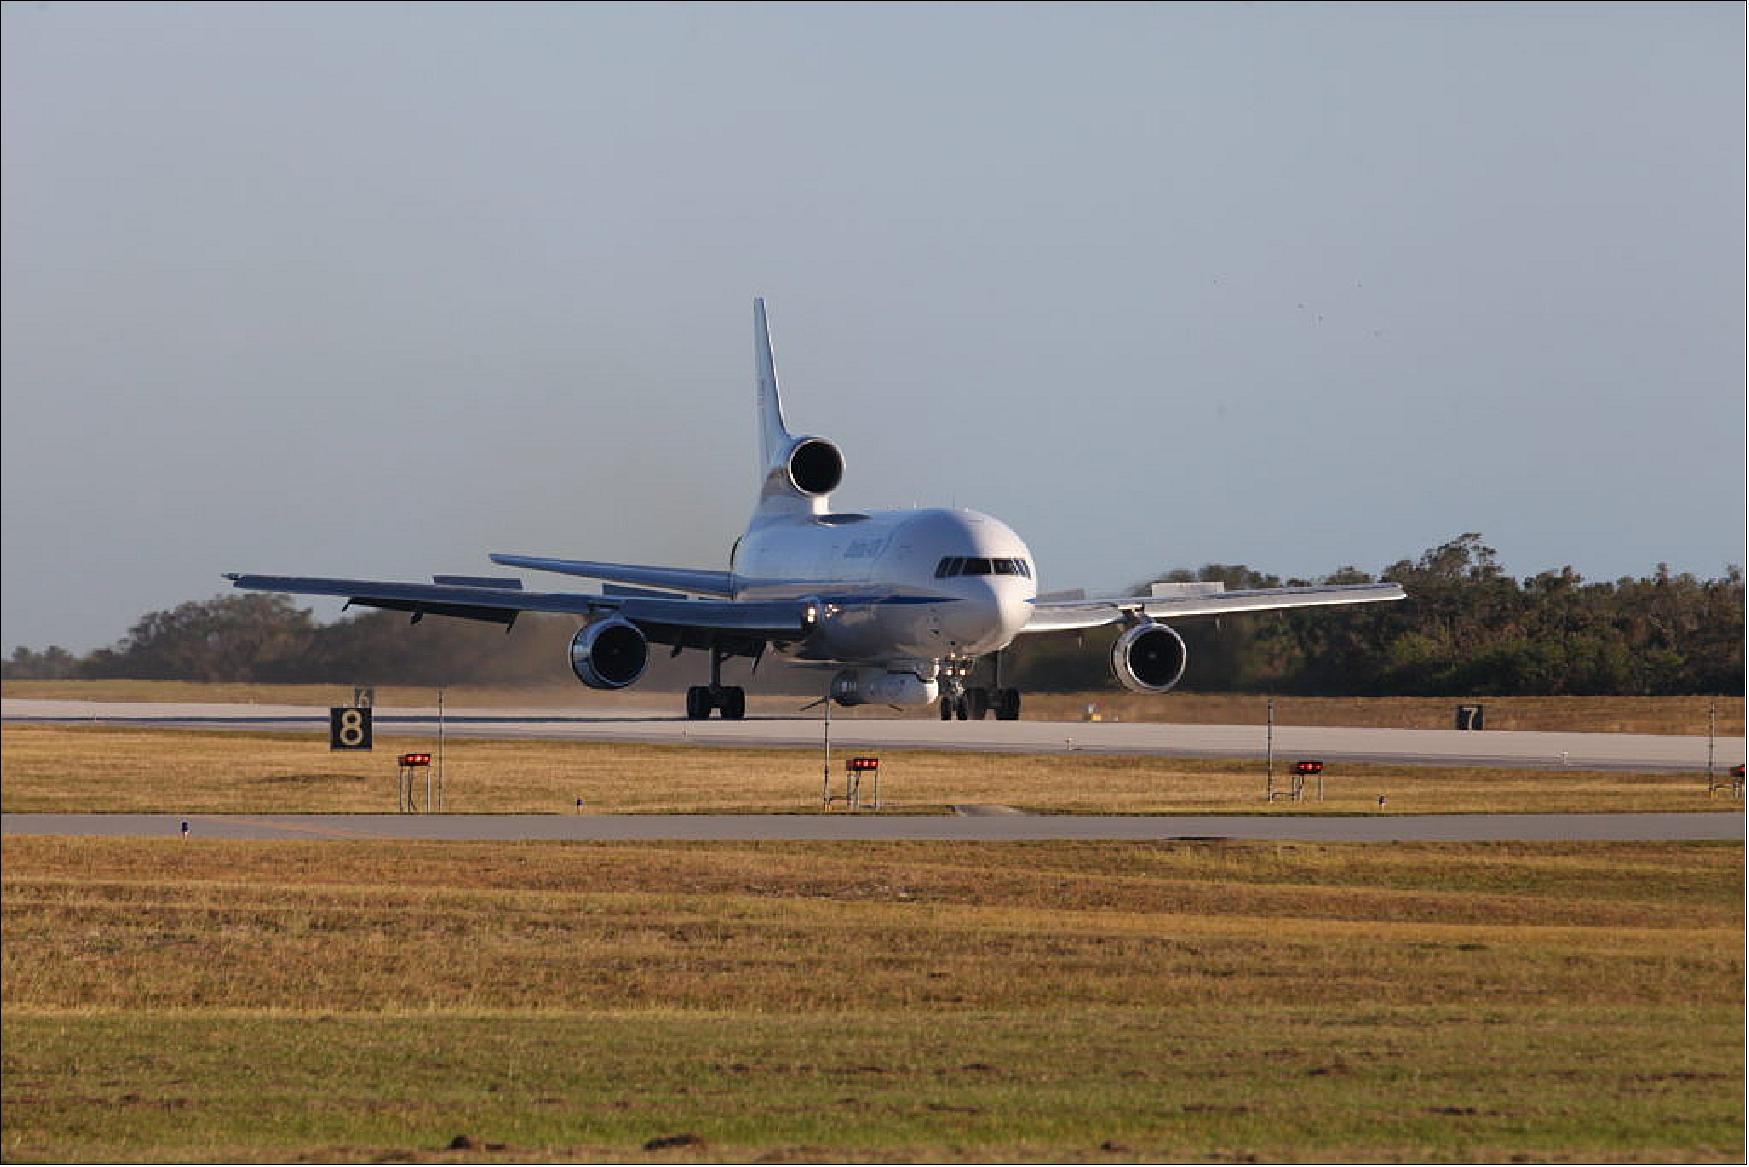
• December 2, 2016: The Orbital ATK L-1011 Stargazer aircraft touched down at the Skid Strip at Cape Canaveral Air Force Station in Florida. Attached beneath the Stargazer is the Orbital ATK Pegasus XL with NASA’s CYGNSS (Cyclone Global Navigation Satellite System ) on board (Figure 9). CYGNSS was processed and prepared for its mission at Vandenberg Air Force Base in California. 19)
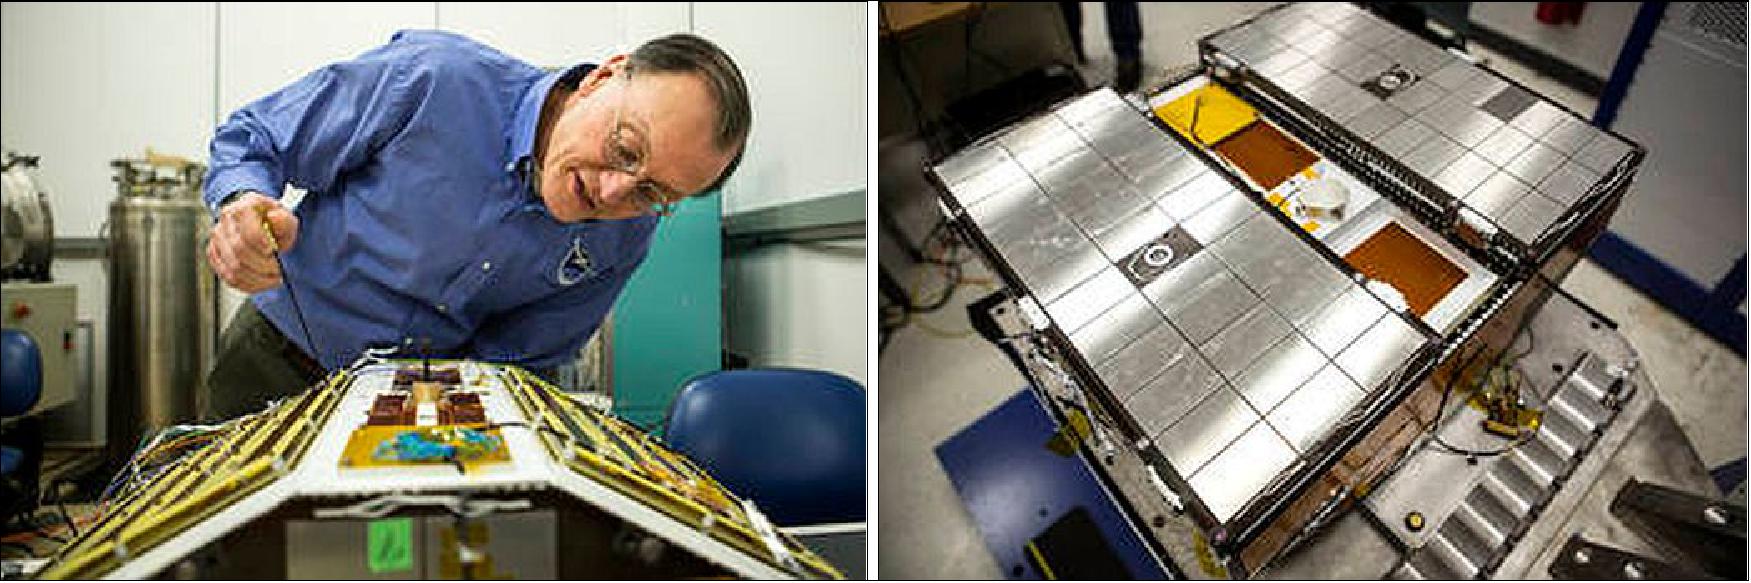
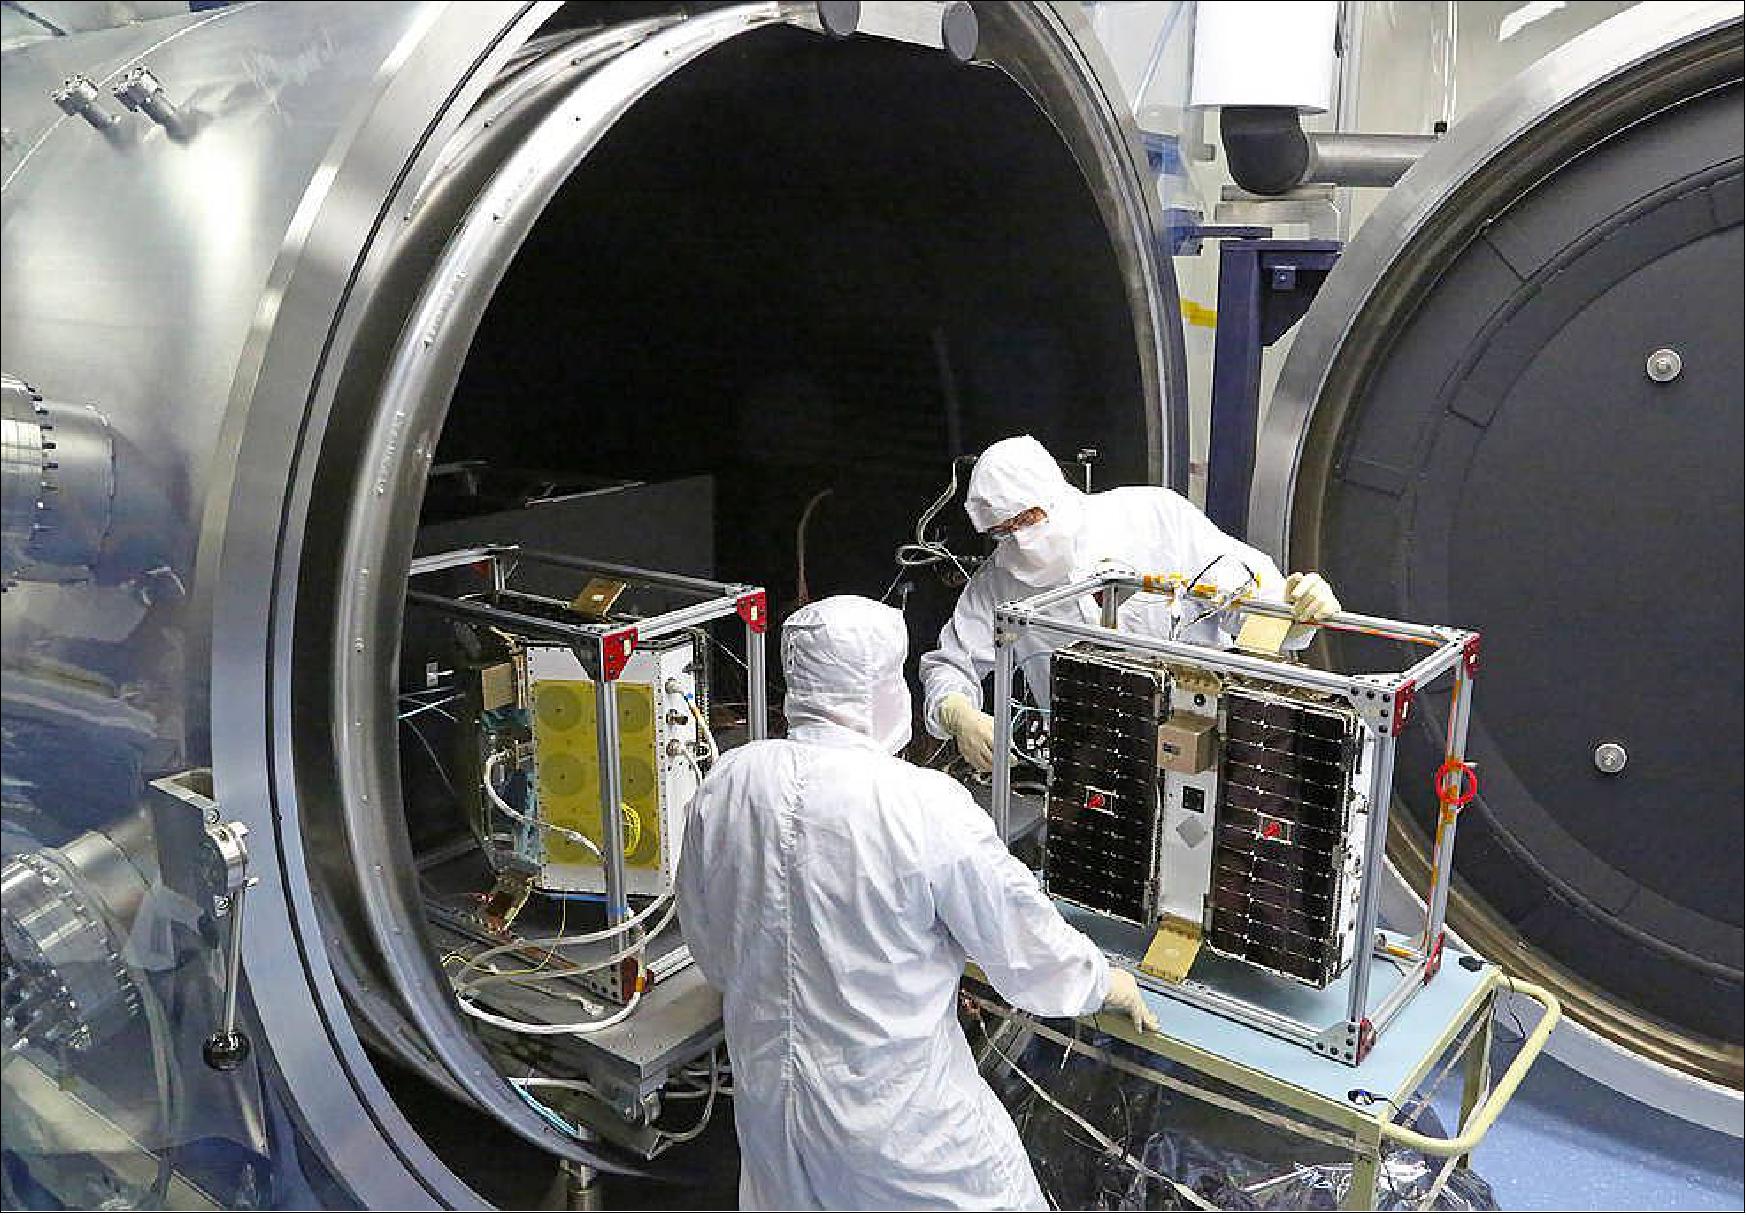
• June 15, 2016: The NASA CYGNSS mission took another major step last month as the eight CYGNSS microsatellites successfully completed functional and environmental testing of their systems and software. These tests simulated the harsh environments of space and launch, including separation and deployment, vibration, and electromagnetic interference. Additionally, all of the spacecraft were placed in a vacuum chamber and cycled through the extreme hot and cold temperatures they will face in orbit. The mission is on track for launch in late 2016. 20)
• August 10, 2016: NASA's CYGNSS mission is currently undergoing vibration testing at the Southwest Research Institute (SwRI) in San Antonio, Texas. Vibration testing simulates the conditions that the eight micro satellites will undergo during launch. 21)
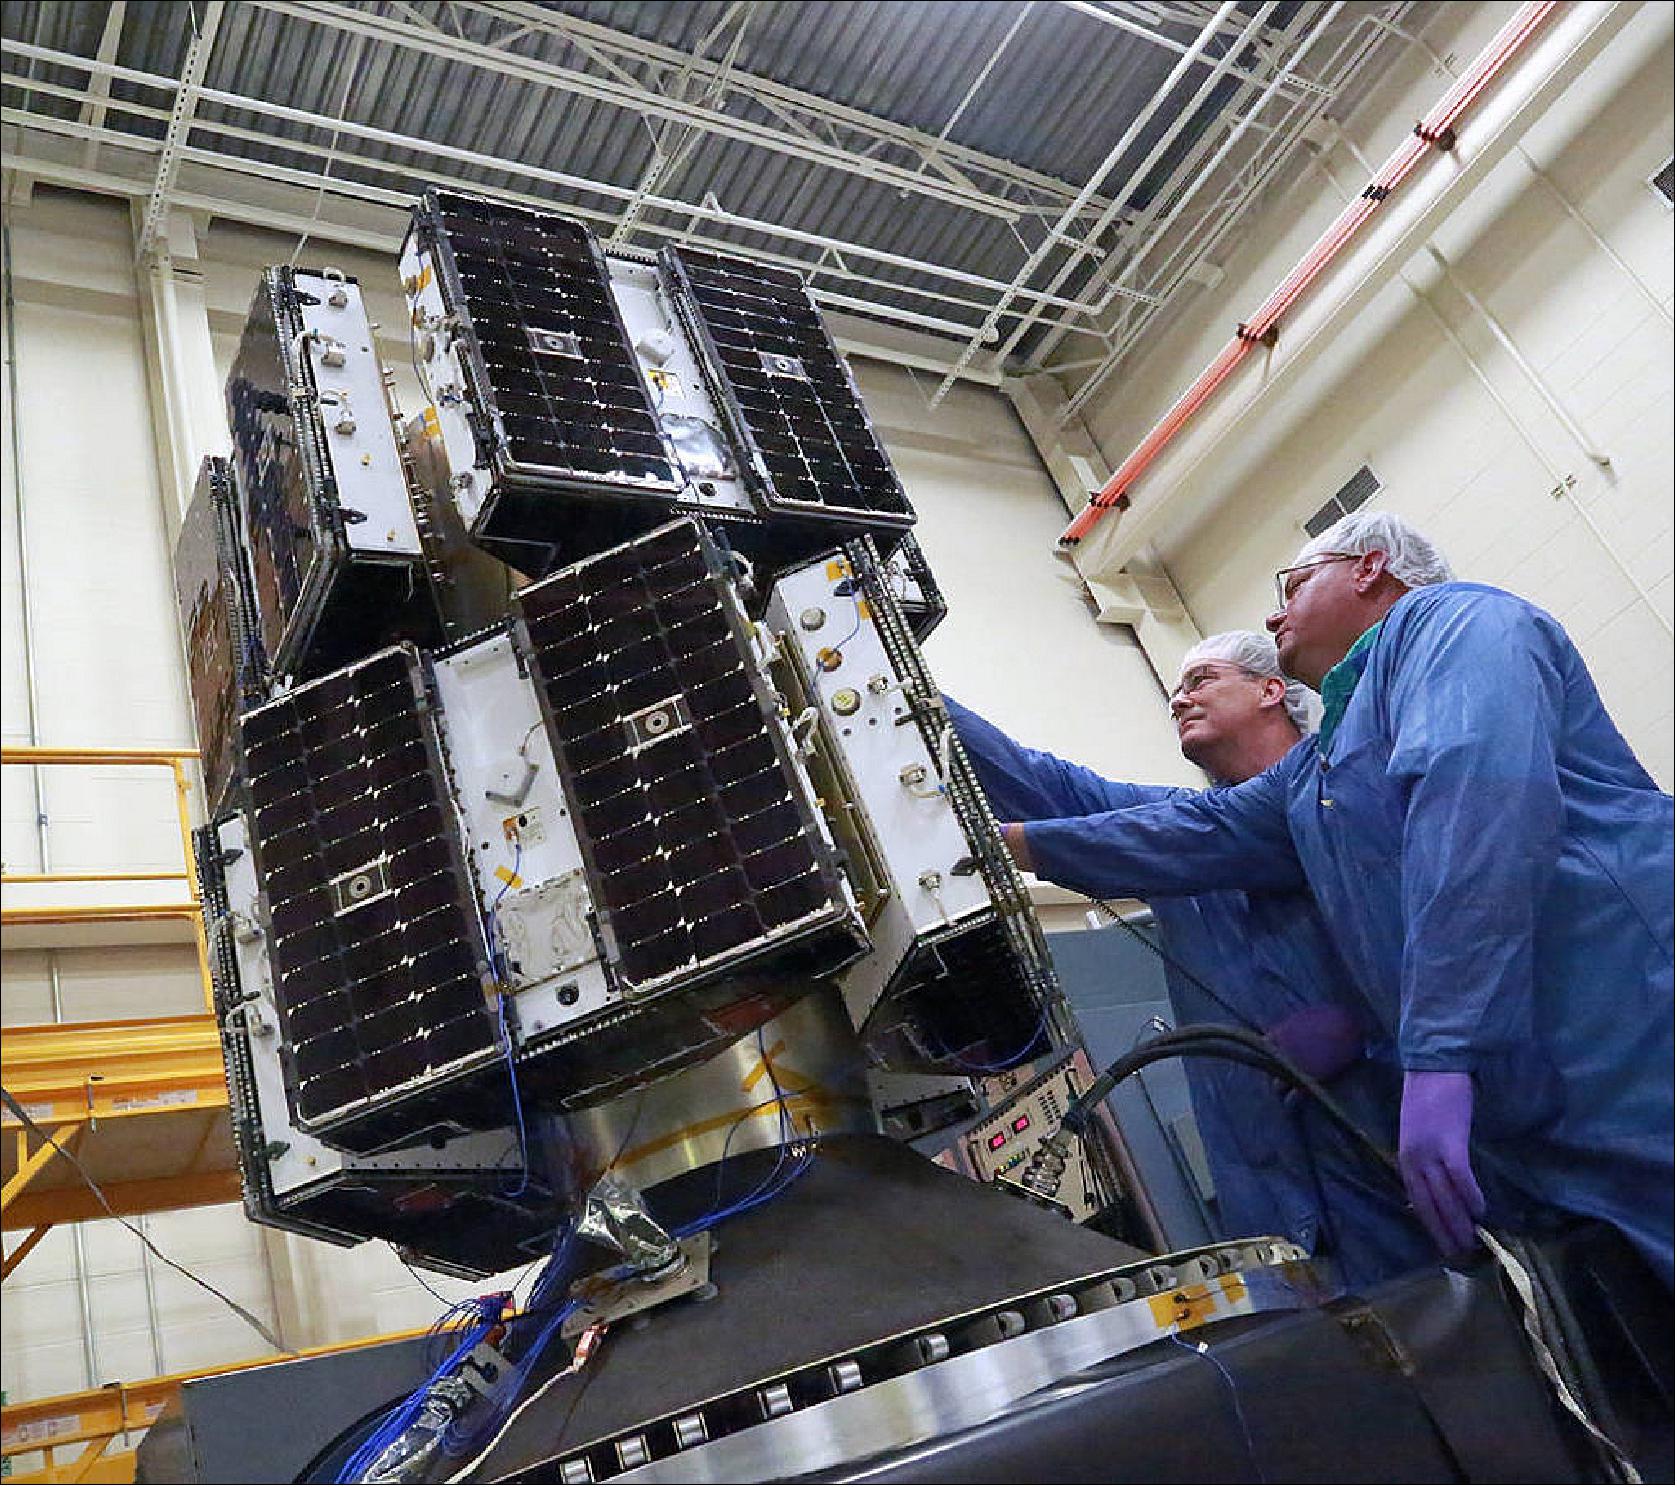
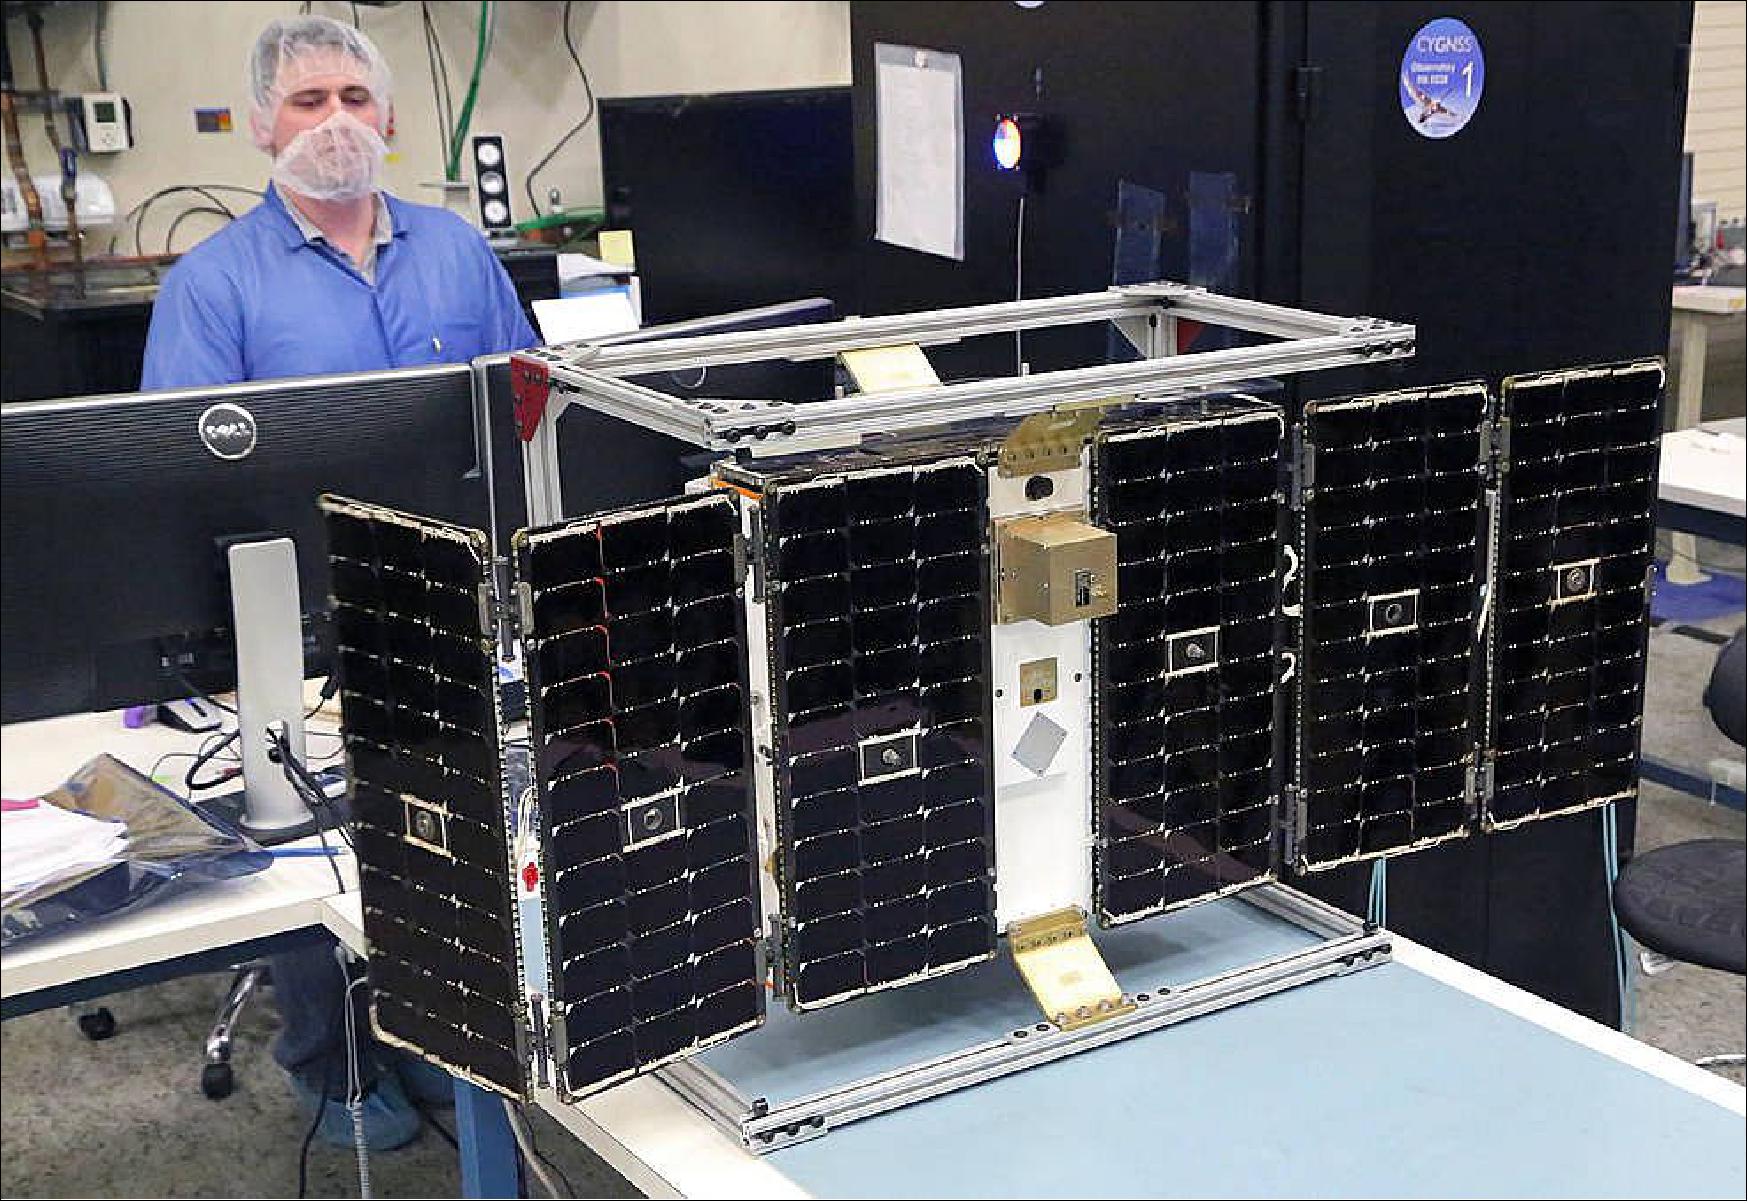
• Feb. 12, 2016: NASA's CYGNSS mission has reached a new milestone in its goal of improving hurricane forecasts. Southwest Research Institute has finished assembling one of the eight microsatellites for the constellation at its facility in San Antonio, Texas. Once all eight microsatellites are assembled, the CYGNSS mission is scheduled to launch in October 2016 and will be the first mission to probe the inner core of hurricanes in greater detail to better understand their rapid intensification. 22)
- Assembly of the microsatellites began in August 2015. The body of each satellite measures roughly 51 x 64 x 28 cm, slightly larger than a standard carry-on suitcase. When fully assembled, the satellites will each weigh about 29 kg. With its solar panels deployed, each microsatellite will have a wingspan of 1.67 m.
- The eight microsatellites will be completed this spring, and from there they will undergo environmental testing and calibration and validation.
• At the end of 2015, SST-US (Surrey Satellite Technology US LLC) delivered 9 SGR-ReSI flight models and 27 low-noise amplifiers (LNAs) and antennas (including flight spares), to SwRI (Southwest Research Institute) for final integration into the CYGNSS observatories. This delivery marks a significant hardware shipment out of the Surrey Englewood, Colorado, manufacturing facility (Ref. 66).
• In early summer 2015, the CYGNSS mission successfully passed two major NASA reviews, clearing the way for integration, testing and preparation of the microsatellites for flight. - Assembly of the first microsatellite began August 14, with the other seven to follow in the next few weeks. 23) 24)
• March 2015: Start of Phase D.
• January 2015: Detailed design completed.
• January 2014: Overall system design completed with PDR (Preliminary Design Review) 25)
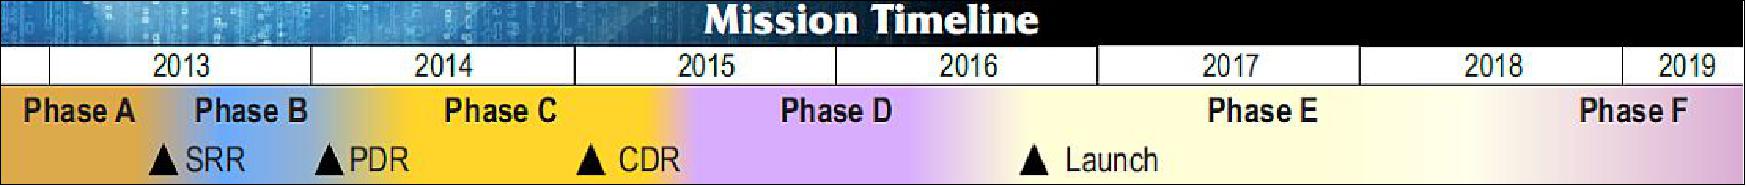
• Sept. 2013: The CYGNSS project recently passed NASA’s Systems Requirements Review and Key Decision Point-B and can now move into the next phase of development. 26)
• June 2013: System requirements defined.
• June 2012: NASA selected an ocean wind study proposal led by the University of Michigan from among 19 submitted to the agency's Announcement of Opportunity for small spaceflight investigations of the Earth system. The competitively-selected proposal, CYGNSS (Cyclone Global Navigation Satellite System) is led by PI (Principal Investigator) Dr. Chris Ruf of the University of Michigan, and includes partnerships with the SwRI (Southwest Research Institute) of Texas, Surrey Satellite Technology of Colorado and NASA Ames Research Center (Ref. 6).
Launch
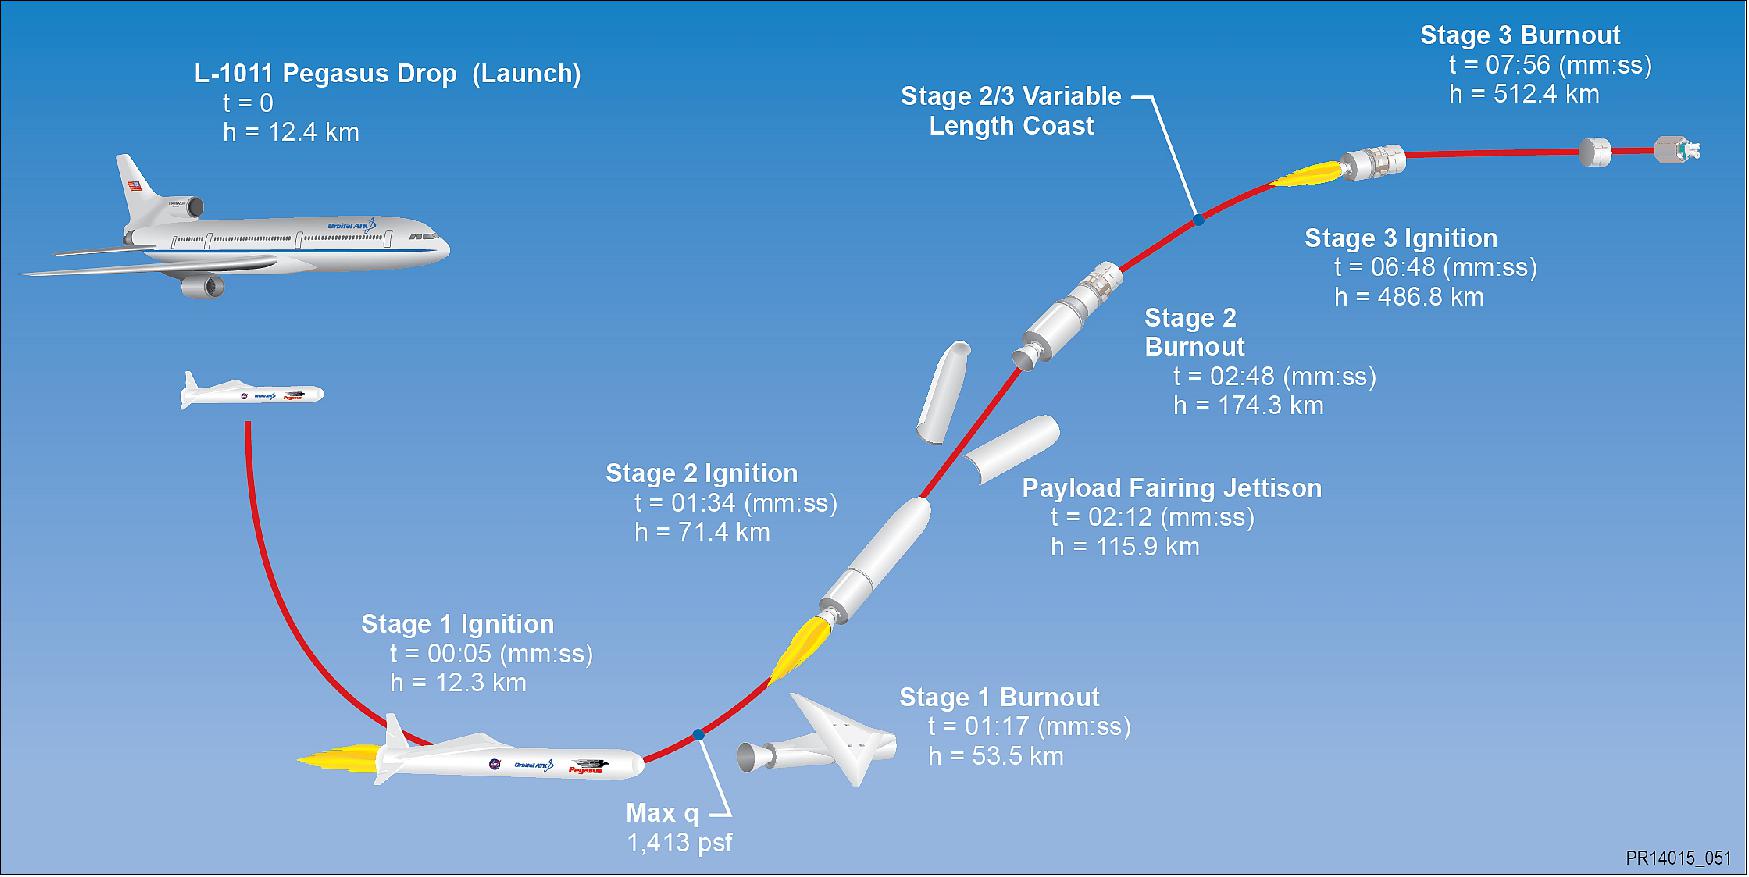
Launch: The CYGNSS mission of 8 microsatellites was launched on December 15, 2016 (13:37 UTC) on the Orbital ATK Pegasus X vehicle from Cape Canaveral, FL. 27) 28) 29)
The air-launched vehicle was carried aloft by Orbital’s modified L-1011 aircraft, “Stargazer,” which took off from the Skid Strip runway at Cape Canaveral Air Force Station in Florida and deployed the three-stage Pegasus XL rocket at a predetermined drop point of about 12 km km above the Atlantic Ocean and about 110 nautical miles east-northeast of Daytona Beach. 30)
In March 2014, NASA awarded a launch contract to Orbital ATK, Dulles, VA. CYGNSS will be launched from Cape Canaveral, FL, aboard a Pegasus XL rocket from Orbital's "Stargazer" L-1011 aircraft. 31)
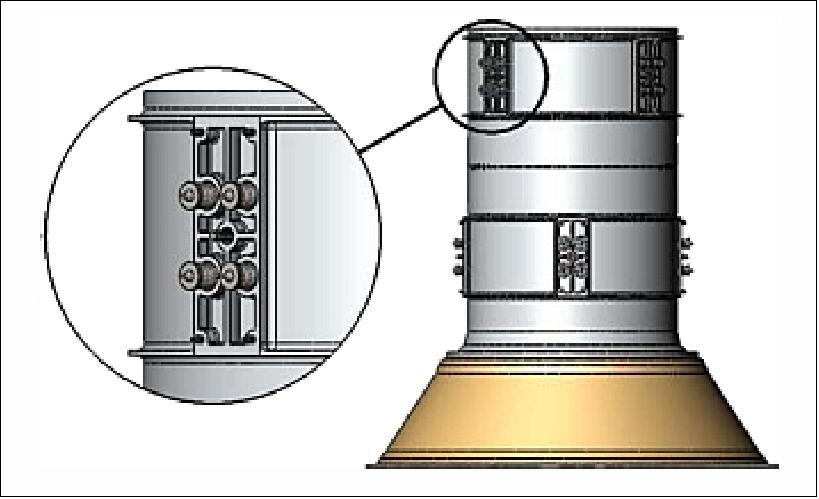
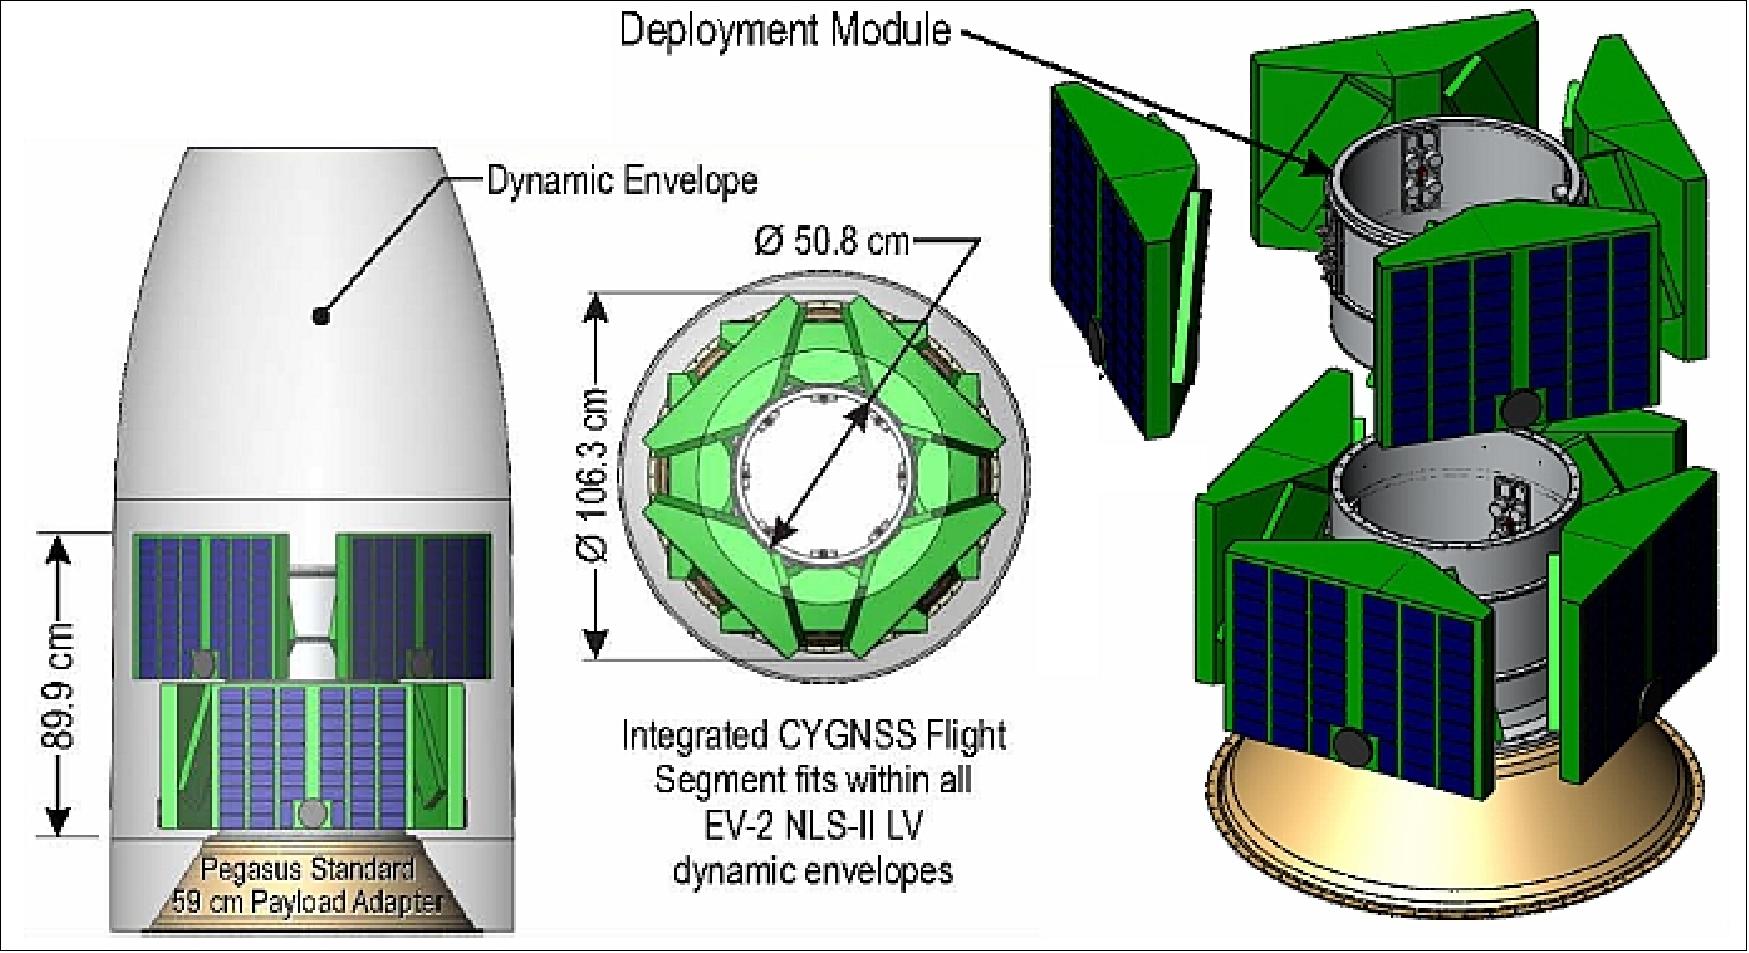
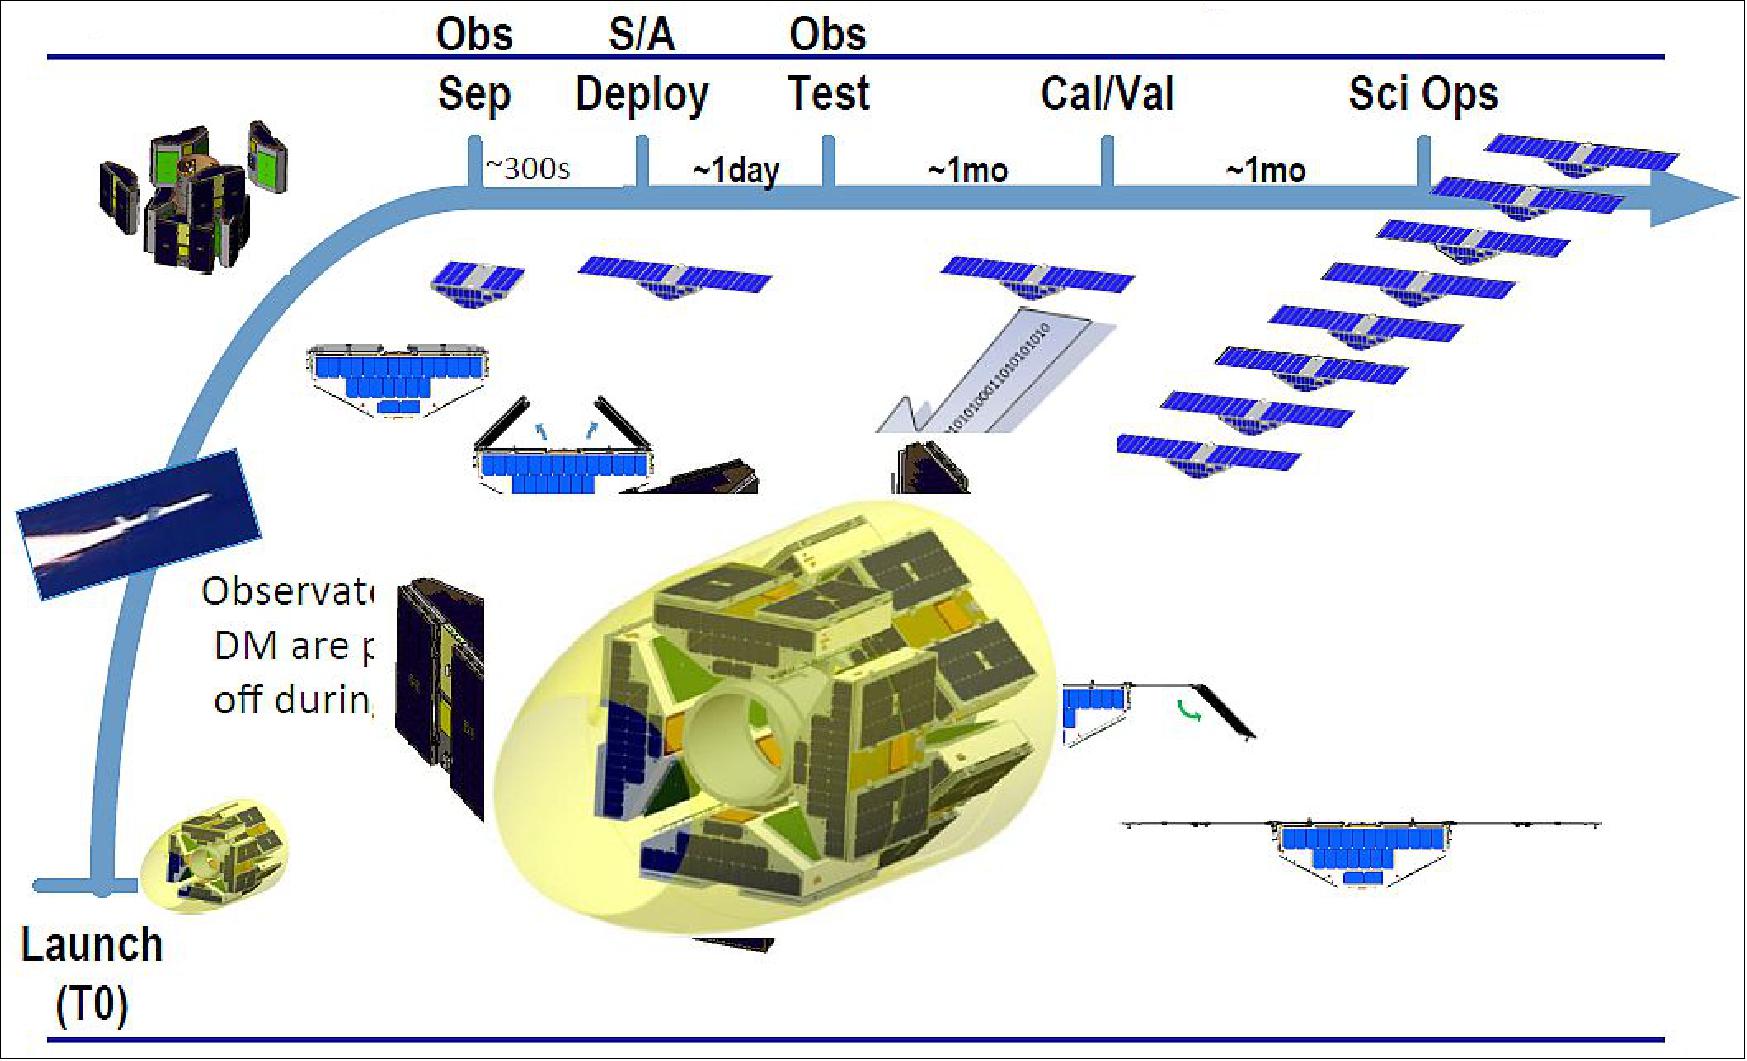
DM (Deployment Module): The DM serves as the constellation carrier during launch and then deploys the observatories into their proper orbital configuration once on orbit. The DM is provided by SNC (Sierra Nevada Corporation).
The DM consists of 2 AL cylindrical sections or tiers, each with 4 mounting/separation assemblies (Figure 17). The tier design approach simplifies observatory-DM integration by enabling easy access of GSE while minimizing potential for damage inherent in a single core structure. The mounting/separation assemblies are positioned 90º apart to release the observatories in pairs opposite each other, balancing deployment forces and keeping disturbance torques well within LV capabilities. Tier 2 is clocked 4º from Tier I to provide proper orbital dispersal vectoring.
Deployment is initiated using flight-proven, high-reliability Frangibolts. Observatory separation tip-off errors are minimized by averaging 4 push springs (Figure 17) to reduce the microsatellite CG (Center of Gravity) location criticality and to minimize the effects of spring tolerances. The tip off errors are further reduced by screening the springs during DM assembly. Each observatory is secured to the DM by torquing the Frangibolt actuator into the microsatellite nadir baseplate, compressing the separation springs to achieve the desired spring load for observatory ejection. The tapered alignment pins, combined with the Frangibolt actuator, rigidly constrain each observatory to the DM for launch.
DM avionics: The DM uses a heritage electronic sequencer to release the observatories in a pre-determined sequence stored within the sequencer memory. The sequence is initiated via a standard LV discrete signal when the LV arrives at the required orbit. The sequencer then performs the deployment sequence by actuating the Frangibolt actuators. The sequence timing incorporates the constellation separation requirements and deployment actuation tolerances. Hardware safety is ensured through the use of a 2-stage command, single-fault tolerant actuator driver design that includes a pre-flight S/A (Safe/ Arm) connector to fully disarm the system.
A 28 VDC DC 140 Wh Li-ion battery is used to power the DM avionics and activates the deployment Frangibolt actuators. The battery is fully charged at launch with <5% of capacity required to complete the orbit insertion and deployment sequence.
Orbit: Non-synchronous near-circular orbit (all spacecraft in a single plane), altitude = 510 km, inclination = 35º. Period = 90 minutes.
Owing to the asynchronous nature of the orbits of the GPS transmitters and CYGNSS receivers in the bisatic radar link, The temporal sampling is best described by a probability distribution of the revisit time at each location within the ± 35º latitude coverage area. The median value of the revisit time is ~2 hours and the mean revisit time is ~6 hours.
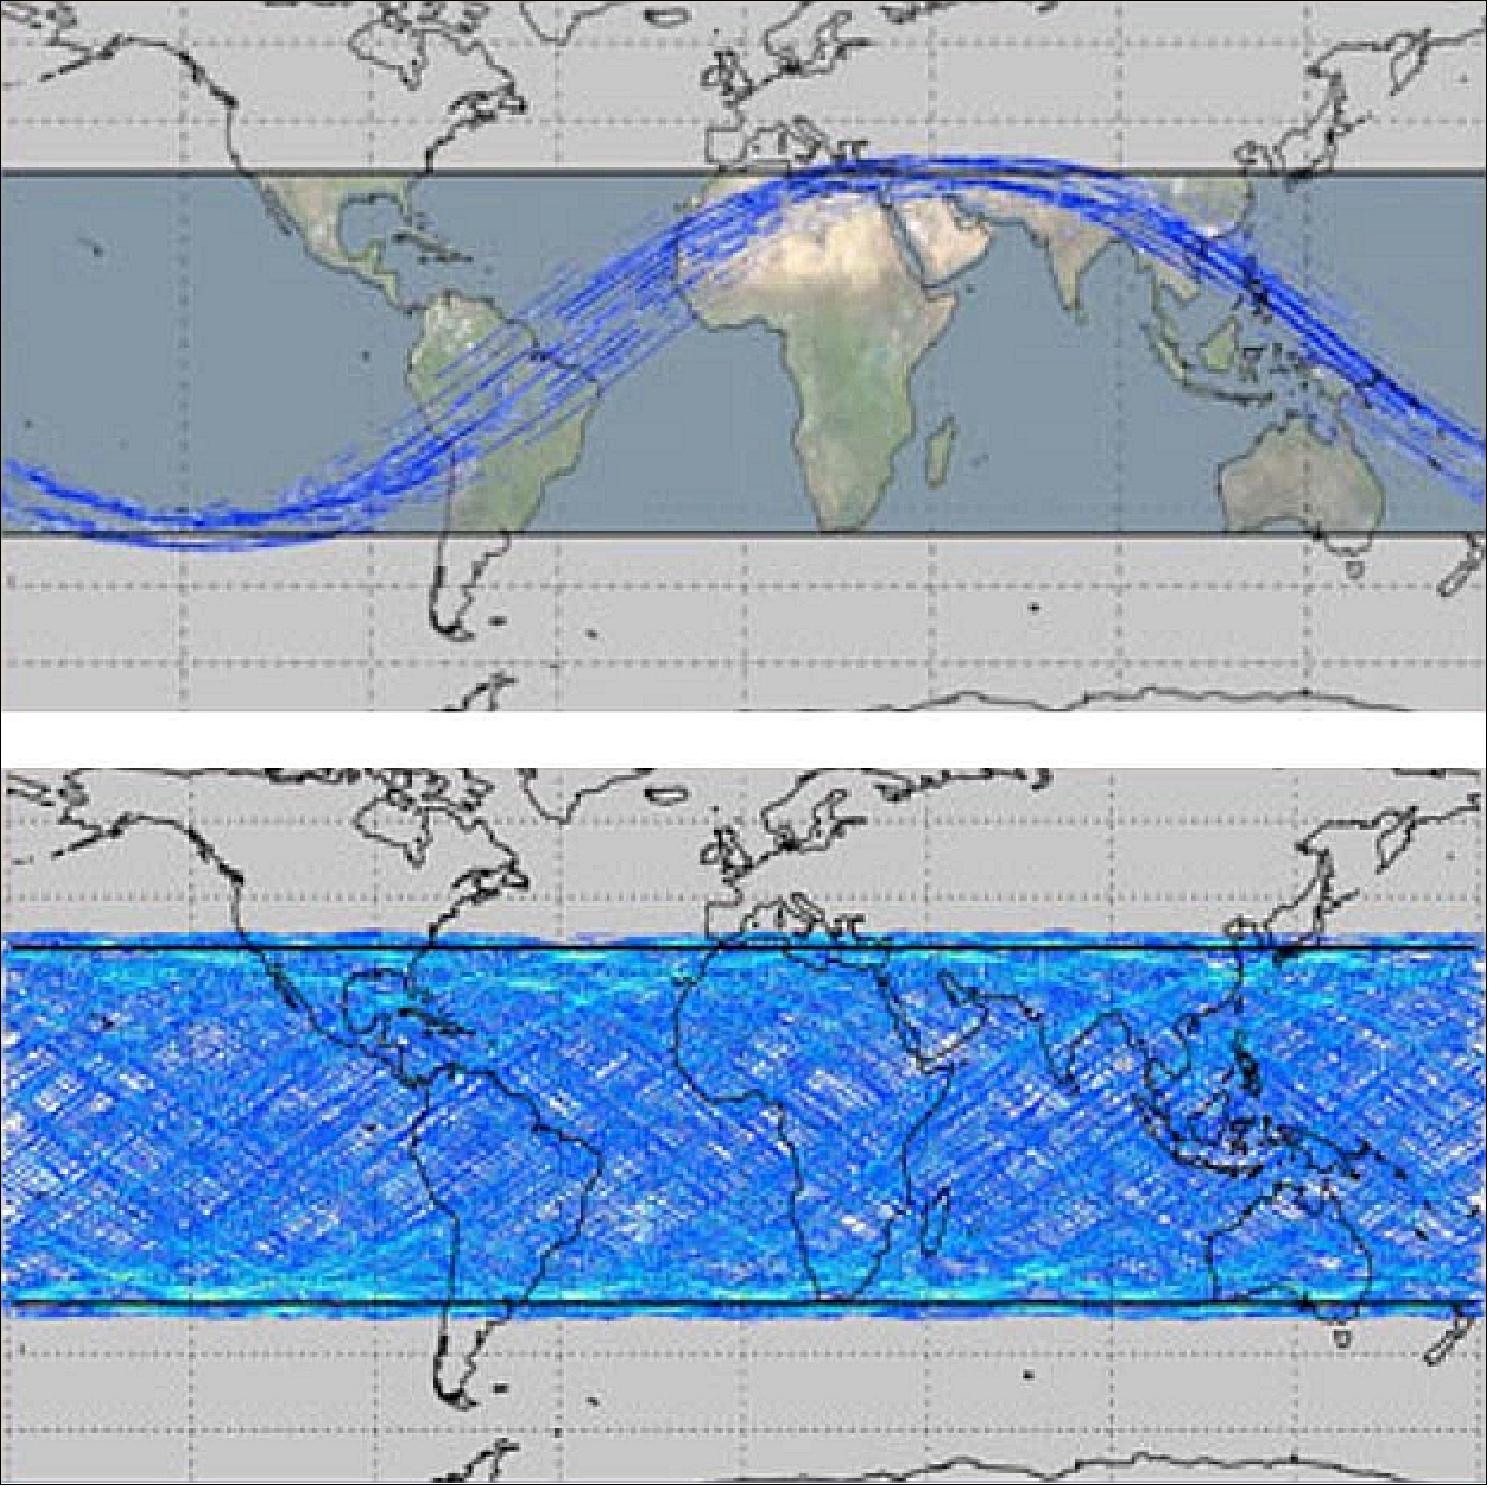
Legend to Figure 19: The orbit inclination was selected to maximize the dwell time over latitudes at which hurricanes are most likely to occur. The result will be high-temporal-resolution wind-field imagery of tropical cyclone genesis, intensification, and decay. Shown here are planned CYGNSS ground tracks for 90 minutes (top) and a full 24-hour period (bottom). 32)
Constellation Orbital Configuration
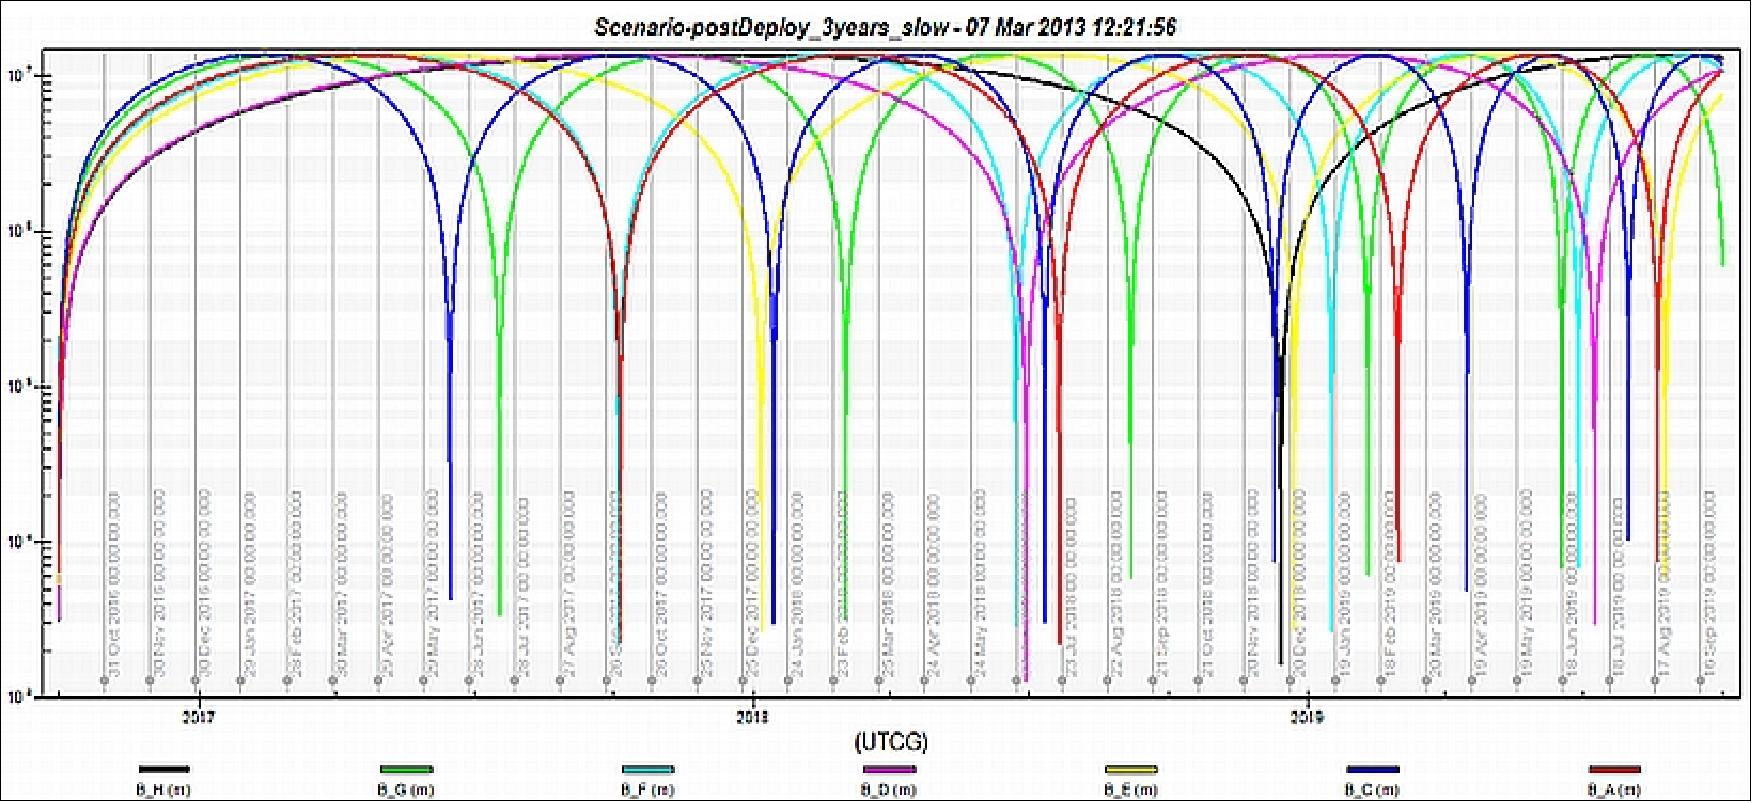
After deployment, there are a number of different options for how the constellation of eight observatories can orbit Earth relative to each other. One option is not to control the configuration and allow the different velocities imparted by deployment determine their orbit state. This would result in all satellites having slightly different orbit periods and result in a dynamic configuration of satellites that constantly changes over time. The other option is to specify a desired and relatively fixed configuration and control to this desired end state. A controlled configuration offers a number of spacing options that can be exploited to address specific mission science objectives and requirements (Ref. 15).
The benefits of an uncontrolled constellation are that there are no maneuvers required to establish the desired constellation configuration or to maintain it. The downside is that over time the constellation configuration is undetermined and the science coverage will change over time in an unpredictable fashion. When the Observatories cluster together, they start measuring similar areas over the ocean, thereby reducing science coverage and resulting at times in coverage that does not meet mission requirements (Figure 21). The controlled constellation requires the calculation of maneuvers to establish and then maintain the configuration, but provides predictability to the constellation for science coverage. The configuration can also be selected to “tune” competing science coverage metrics such as percent area coverage and revisit rate. The CYGNSS team has developed a set of tools, based on high fidelity STK ® (Satellite Tool Kit) scenarios that have been used to explore a number of potential configurations to assess the impact on science coverage.
Orbital control: Cost constraints of the CYGNSS mission preclude inclusion of velocity thrusters on the Observatories Although the satellites do not have thrusters, a ΔV can be realized by pitching the vehicle to increase its drag area relative to the other vehicles. This technique, known as "differential drag", results in an increased drag profile that results in an acceleration opposite the velocity vector which can be used to adjust the relative position of the satellites and to avoid potential conjunctions. The unique physical configuration of the CYGNSS Observatory provides an excellent 7:1 drag profile that can be exploited to control the constellation orbital configuration with minimal impact to CYGNSS operational life expectations. 33)
Constellation maintenance: After the constellation orbital configuration has been established, it will be disturbed in one of two ways; atmospheric drag variations and space object avoidance.
1) Atmospheric drag variance: The uncertainties in vehicle state and the imperfect ability to control the vehicle state mean that there will be a very small relative drift rate between the observatories that will eventually grow to a large error that we would want to correct. This will occur over a period of a number of months to years depending on selected tolerance.
2) CA (Conjunction Assessment): The other source of disturbance is maneuvers required to avoid conjunctions with other space objects. Studies have shown that conjunction events will happen frequently enough to be the dominant factor in determining when CYGNSS Observatory orbital maneuvers will occur. In 2013, there are currently over 13,700 objects in the unclassified space catalog of which about 1900 of them are presumed to be active. Most of these objects reside in LEO (Low Earth Orbit, below 2000 km) with a peak density around 800 km caused by a combination of the Fengyun-1C debris and the Iridium-Cosmos collision. Monte Carlo studies have been performed to assess the expected frequency of conjunction events within a given threshold minimum range. The study assumed that the current catalog of space objects is representative of the environment that CYGNSS will encounter during operations. The results of the study show that there will be regular (i.e. weekly) encounters within 2 km and somewhat more infrequent encounters (monthly or less) within 0.5 km.
Due to the large uncertainty in object state, there will likely be a daily process to assess incoming data from the JSpOC (Joint Space Operations Center) for potential conjunctions even though actual conjunctions that require maneuvers will be rare.
Science operations: Following commissioning, the instrument is set to science mode for the duration of the mission, except for brief returns to engineering verification performed bi-annually. In science mode, science measurements are acquired and downlinked with 100% duty cycle. The Observatories are designed to implement nominal Observatory operations and science data collection without on-board schedule command sequences.
Mission Status
• June 22, 2021: NASA has awarded a contract to the University of Michigan for the Cyclone Global Navigation Satellite System (CYGNSS) for mission operations and closeout. A constellation of eight microsatellites, the system can view storms more frequently and in a way traditional satellites are unable to, increasing scientists’ ability to understand and predict hurricanes. 34)
- The total value of the contract is approximately $39 million. The CYGNSS Science Operations Center is located at the University of Michigan.
- For decades, NASA has played a leading role in using Earth-observing satellites to collect the data required to feed numerical weather prediction models. CYGNSS continues that work, using a remote sensing technique called “GPS signal scattering” to see through heavy rain to estimate the strength of surface winds in the inner cores of hurricanes.
- “CYGNSS has been a pioneering mission that has given us new insight into the dynamics of rapidly intensifying tropical cyclones,” said Karen St. Germain, director of NASA’s Earth Science Division. “CYGNSS is also a powerful tool for flood detection on land and ocean microplastic debris detection – that’s the kind of added value we love to see, and it’s paving the way for more science that will have significant societal benefits.”
- The measurements from CYGNSS are useful for research in algorithm development, analysis to assist with future modeling efforts, and Earth system process studies.
- Further operations will enable new research looking at long-term climate variability and increase the sample size of extreme events that can assist with modeling and forecasting. CYGNSS satellites continue to take 24/7 measurements of ocean surface winds, both globally and in tropical cyclones, which can be used to study meteorological processes and improve numerical weather forecasts. On land, the satellites take continuous measurements of flood inundation and soil moisture that are used in hydrological process studies and for disaster monitoring.
• November 9, 2020: NASA recently completed its Senior Review process for Earth Science missions and CYGNSS has been approved to continue science operations through 2023. 35) Another Senior Review will occur then. The constellation of eight spacecraft are healthy and operating nominally in their orbits 524 km above the Earth. They continue to make 24/7 measurements of ocean surface winds, both globally and in tropical cyclones, to help understand meteorological processes and improve numerical weather forecasts. Over land, measurements of flood inundation, water body extent and soil moisture are used in hydrological process studies and for disaster monitoring. 36)
- Our ability to forecast the strengthening of hurricanes has been improved by CYGNSS measurements of their inner core winds, which allow us to track the transfer of energy from the warm ocean water into the atmosphere in the form of latent heat flux. Currently, CYGNSS data are being used in re-analysis investigations, revisiting old hurricane forecasts with new CYGNSS data added to see how the predictions are improved. Eventually, the goal is to use the data directly in operational forecasting by NOAA’s National Hurricane Center. CYGNSS wind observations can also be to provide better estimates of the location of the hurricane, as reported in https://web.archive.org/web/20201024184326/https://journals.ametsoc.org/jamc/article/58/9/1993/343477/Tropical-Cyclone-Center-Fix-Using-CYGNSS-Winds.
- Measurement by CYGNSS over land are used to determine soil moisture content under dense vegetation. This, in turn, allows for the identification of conditions conducive to major locust outbreaks in East Africa. Locating locust breeding grounds before the insects are mature and able to fly provides a unique opportunity for eradication efforts on the ground. This capability is being investigated through a partnership between members of the CYGNSS science team, NASA SERIR, the US Agency for International Development (USAID), and the United Nations Food and Agriculture Organization (FAO). For more information, refer to https://earthobservatory.nasa.gov/images/146495/could-satellites-help-head-off-a-locust-invasion.
- With NASA’s continued support, CYGNSS will be able to continue with its investigations supporting a better understanding of and ability to forecast tropical cyclones, and to expand its investigations into novel applications over land.
• February 24, 2020: NASA is partnering with the New Zealand Ministry of Business, Innovation and Employment, New Zealand Space Agency, Air New Zealand and the University of Auckland to install next-generation Global Navigation Satellite System (GNSS) reflectometry receivers on passenger aircraft to collect environmental science data over New Zealand. 37)
- The program is part of NASA’s Cyclone Global Navigation Satellite System (CYGNSS) mission, a constellation of eight small satellites, launched in 2016, that use signals from Global Positioning System (GPS) satellites that reflect off Earth’s surface to collect science data.
- The CYGNSS satellites orbit above the tropics and their primary mission is to use GPS signals to measure wind speed over the ocean by examining GPS signal reflections off choppy versus calm water. This allows researchers to gain new insight into wind speed over the ocean and will allow them to better understand hurricanes and tropical cyclones.
- In addition to its primary over-water research capabilities, scientists have discovered that the CYGNSS technology is also capable of collecting valuable measurements over land, including of soil moisture, flooding, and wetland and coastal environments.
- “Partnering with New Zealand offers NASA and the CYGNSS team a unique opportunity to develop these secondary capabilities over land. Taken together over time, they’ll also have an important story to tell about the long-term impacts of climate change to these landscapes,” said Gail Skofronick-Jackson, CYGNSS program scientist at NASA Headquarters, Washington.
- The CYGNSS team, led by principal investigator Chris Ruf at the University of Michigan in Ann Arbor, has developed a next-generation GNSS reflectivity receiver with support from NASA’s Earth Science Technology Office. These receivers will be installed in late 2020 on one of Air New Zealand’s Q300 domestic aircraft.
- As the aircraft traverses New Zealand, it will collect data from the land below, some of which will overlap with the flight paths of the CYGNSS satellites. This overlap, which will have frequent data observations from regular commercial flights, will provide the CYGNSS team a wealth of data to use to validate and improve the CYGNSS satellite observations, said Ruf. In addition, the varied New Zealand terrain will provide comparison points with data collected in similar terrains in other parts of the world.
- “As a result of this partnership, both Air New Zealand engineers and researchers across New Zealand will now have the opportunity to work with NASA on a world-leading environmental science mission,” said Peter Crabtree, General Manager of Science, Innovation and International at New Zealand’s Ministry of Business, Innovation and Employment.

- The University of Auckland will host the Science Payload Operation Centre, which will begin operations and data collection in late 2020.
- “Over time, the data that will be collected by these receivers could form one of New Zealand’s largest bodies of long-term environmental data, and as such it represents a wide range of research opportunities,” said radar systems engineer and project lead Delwyn Moller of the University of Auckland.
- Air New Zealand will be the first passenger airline to partner with NASA to collect data for a science mission. Air New Zealand has 23 Q300s in its fleet, and if the approach is successful, the airline will explore introducing the technology more widely.
- “As an airline, we’re already seeing the impact of climate change, with flights impacted by volatile weather and storms. Climate change is our biggest sustainability challenge, so it’s incredible we can use our daily operations to enable this world-leading science,” said Air New Zealand Chief Operational Integrity and Standards Officer Captain David Morgan.
- NASA uses the unique vantage point of space to better understand Earth as an interconnected system. The agency also uses airborne and ground-based monitoring and develops new ways to observe and study Earth with long-term data records and computer analysis tools to better see how our planet is changing. NASA shares this knowledge with the global community and works with institutions in the United States and around the world that contribute to understanding and protecting our home planet.
• December 16, 2019: CYGNSS was launched on December 15, 2016 at 13:27:21 UTC and today marks the completion of its third year on orbit. Much has happened in that time and the future looks very promising, with all eight microsatellites healthy and operating continuously in their nominal science data-taking mode. Year 1 was spent on engineering commissioning and initial ocean wind measurements. In year 2, the ocean wind retrievals were refined and characterized and investigations of observations over land began in earnest. This past year has seen progress on several fronts. An important refinement to the engineering calibration has been developed. Ocean wind measurements in tropical cyclones have been successfully introduced into numerical hurricane forecast models. And the ability to image inland waterbodies with high resolution has been leveraged to demonstrate two new measurement capabilities. 38)
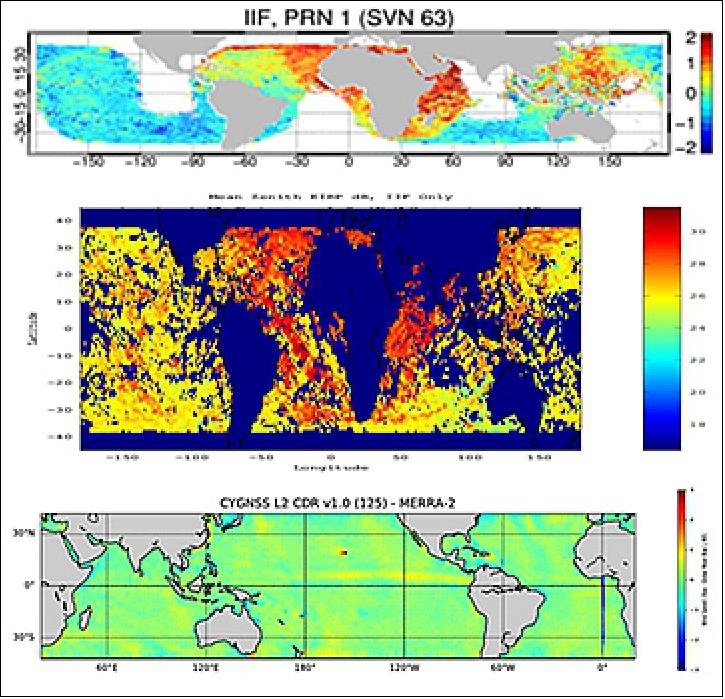
- CYGNSS measures the strength of GPS signals reflected by the Earth surface, from which properties of the surface are derived. To do this accurately requires knowledge of the signal strength transmitted by the GPS satellite. The original approach to calibration assumed each GPS satellite had a unique transmit power level and that it did not vary in time. The unique power levels were estimated using measurements averaged over several months. Subsequent analysis has revealed that GPS transmit power can vary significantly, depending on the particular satellite and on its position in orbit. In order to compensate for the changes, the direct signal GPS receivers on all eight CYGNSS satellites were reprogrammed in 2018 to act as power meters which can monitor the variations in transmit power. 39)
- The impact of this change is illustrated in Figure 25. The top panel shows the geographical distribution of the average error in CYGNSS wind speed for a single GPS transmitter (SVN 63) assuming its transmit power is constant. The center panel shows the actual GPS transmit power as measured by the new on-board monitoring system. Clear localized differences in the measured power are evident which correlate with the errors in wind speed. The bottom panel shows the distribution of average wind speed error after the monitored power is incorporated into the calibration. The discrepancies have been largely removed.
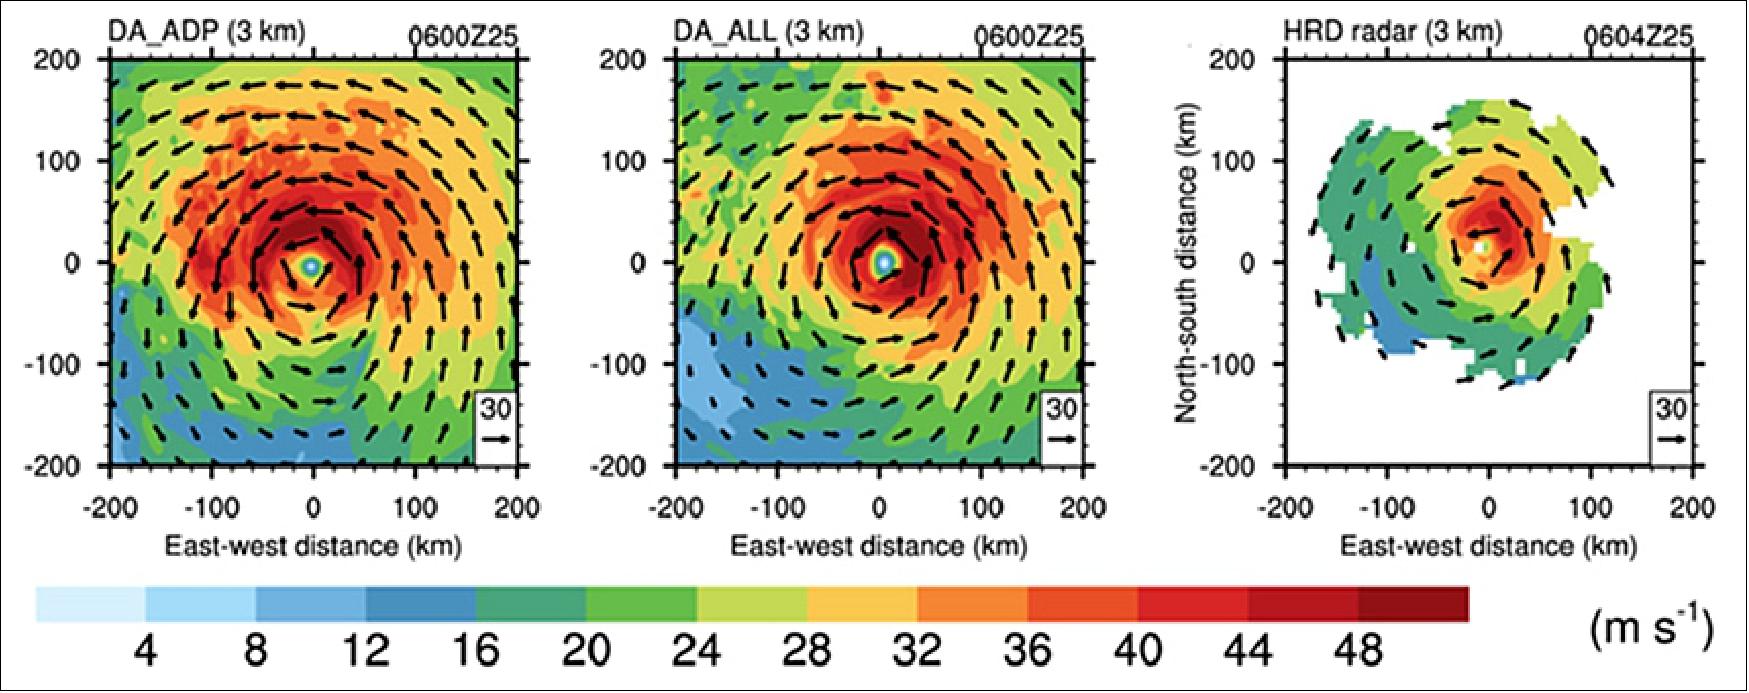
- Over the past year, CYGNSS ocean wind measurements have been added to the HWRF (Hurricane Weather Research and Forecasting) numerical forecast model used by the National Hurricane Center and compared to the standard operational forecast, which does not yet use CYGNSS. To forecast a hurricane, HWRF is first initialized with satellite, airborne, and ground based measurements. The storm is then allowed to develop in software, guided by underlying physical principles of thermodynamics, radiation and mass and energy conservation. An example of this is shown in Figure 26, which presents three versions of the horizontal wind speed at 3 km altitude for Hurricane Harvey on 25 Aug 2018 at 06Z. The left panel is the 24 hr forecast predicted on 24 Aug by the operational version of HWRF without CYGNSS data. The center panel is the HWRF prediction with CYGNSS winds included. Note the azimuthal shift in predicted peak winds into the northeast quadrant when CYGNSS winds are included. The right panel shows measurements made by NOAA’s airborne doppler radar of the actual winds at 3 km. The predicted azimuthal shift is confirmed, suggesting that the storm’s development is being more accurately modeled. 40)
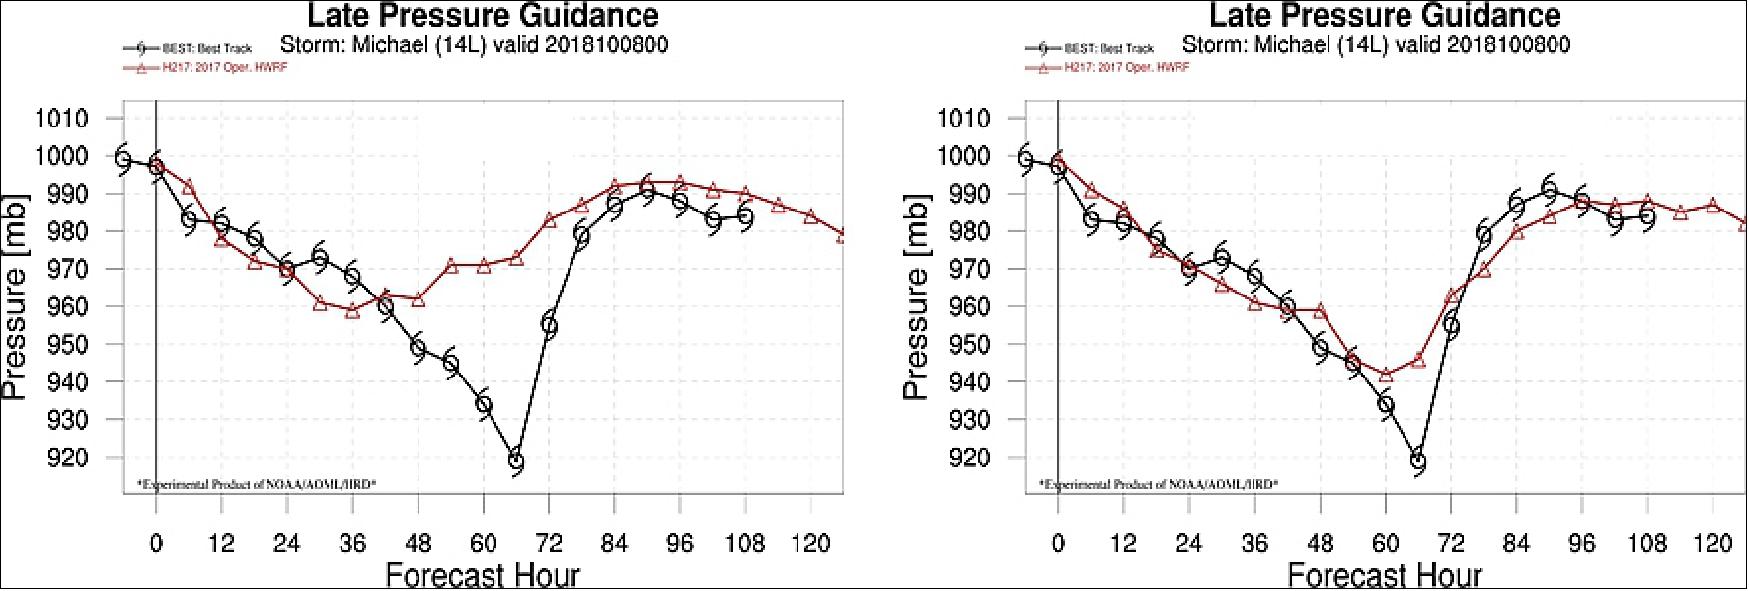
- More accurate modeling of storm development should help forecast the intensity of its surface winds, and this has been demonstrated by another study using HWRF [Annane et al., 2018. Impact of CYGNSS Data on Tropical Cyclone Analysis and Forecasts Using the Operational HWRF. 33rd AMS Conf. Hurricanes Trop. Meteo.]. In this case, a 120 hr forecast of minimum sea level pressure (MSLP) in the eye of Hurricane Michael was conducted on 8 Oct 2018 at 00Z without and with CYGNSS winds included as one of the inputs. The left panel in the following figure shows the true (best track) MSLP in black and the operational forecast (without CYGNSS) in red. The rapid drop in MSLP that occurred between ~30-60 hr is not well forecast. The right panel shows the HWRF forecast with CYGNSS winds included and can be seen to more accurately predict the rapid intensification of the storm.
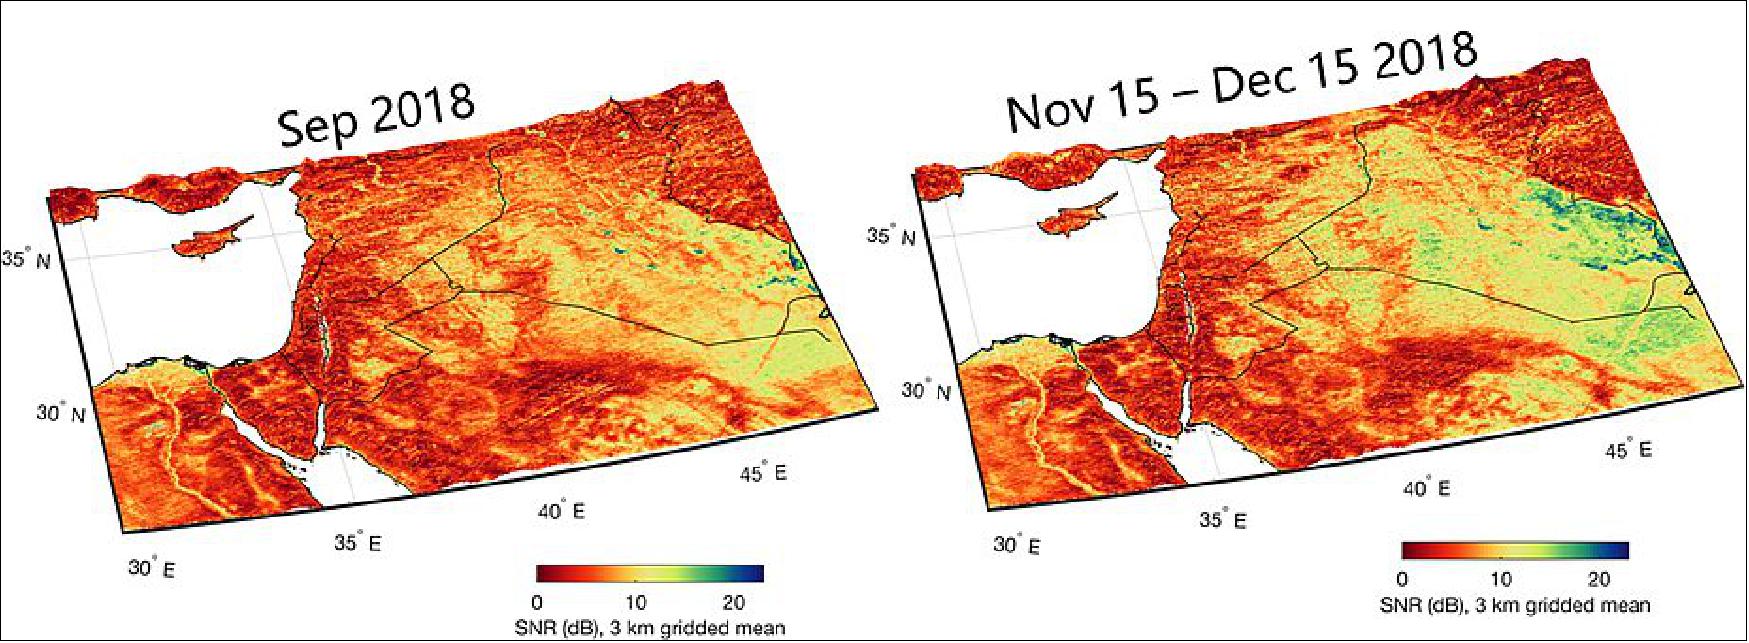
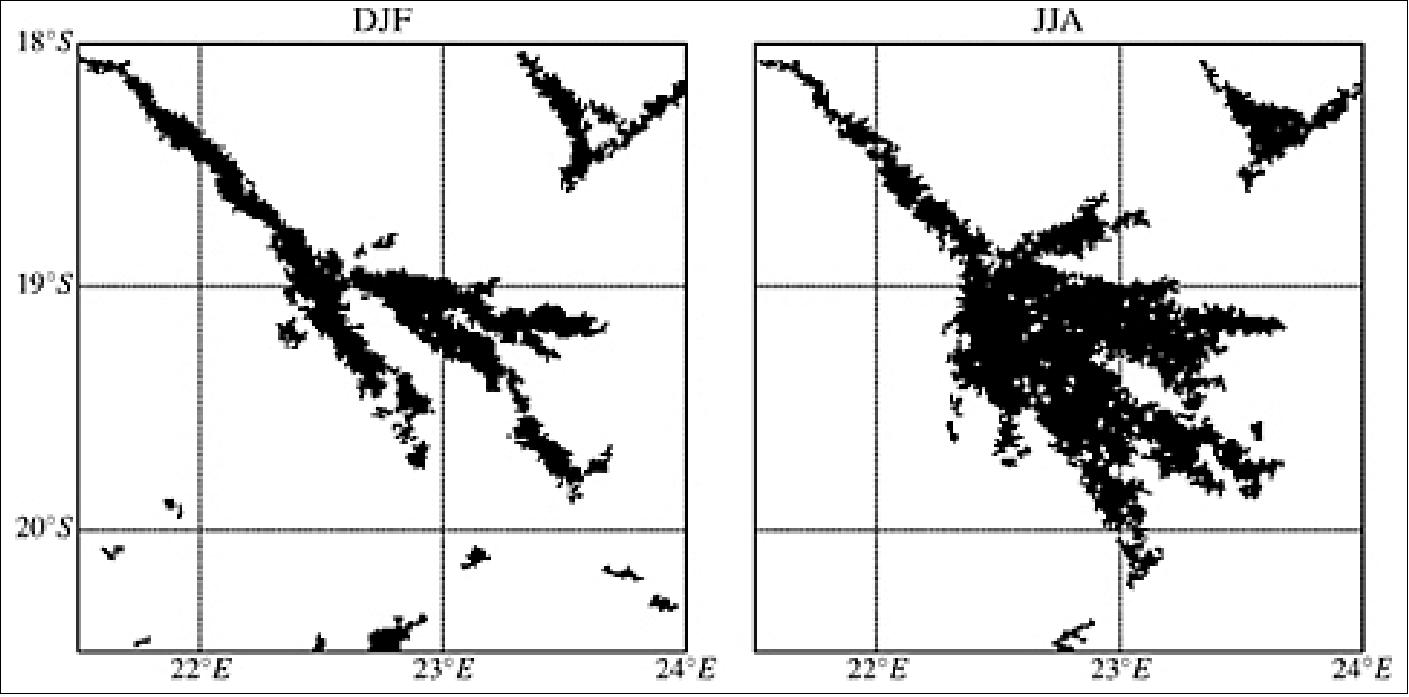
- CYGNSS measurements over land are able to provide high resolution tracks across inland waterbodies when the surface is calm enough to support coherent specular scattering. A new land/water mask has been developed which leverages this capability as well as the ability of CYGNSS to penetrate through clouds, rain and vegetation canopies. As a result, dynamic changes in waterbodies (e.g. due to flooding, seasons or human development) can be resolved better than existing water masks that rely on optical satellite imagers. 41)
- An example of this new capability is shown in the seasonal watermasks of the Okavango Delta in Botswana derived from CYGNSS overpasses in 2018. The left panel, for Dec/Jan/Feb, shows the typical river boundaries that are present during the dry season. The mask in the right panel, for Jun/Jul/Aug, captures the widespread flooding which occurs during the rainy season.
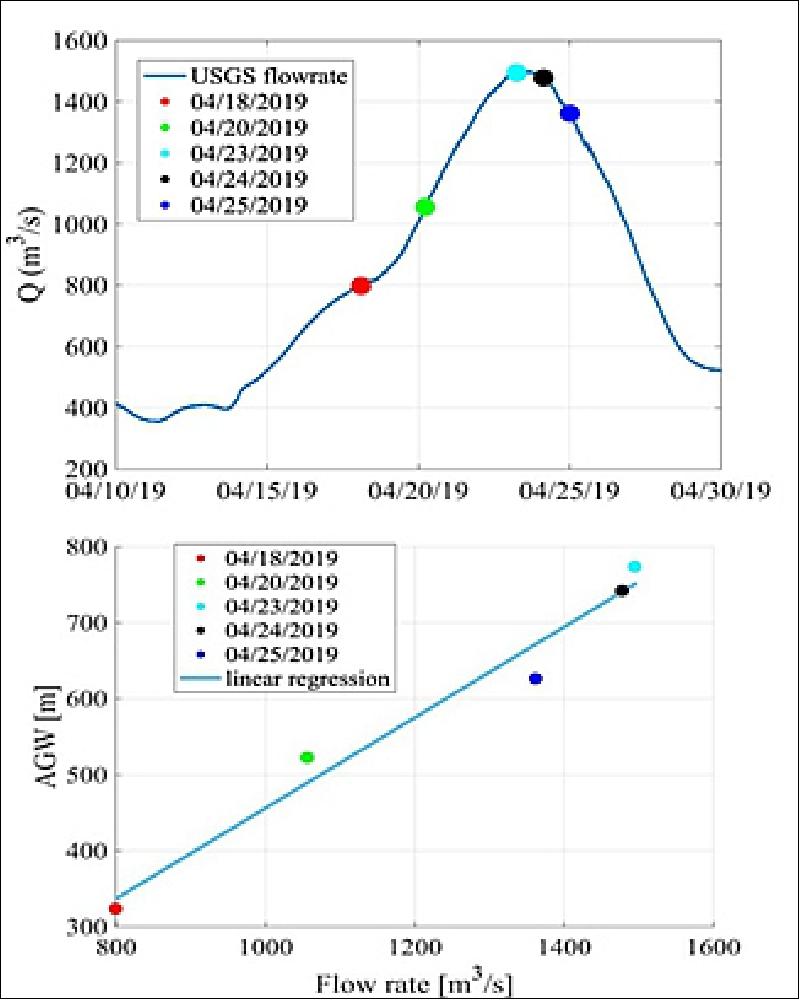
- CYGNSS overpasses of rivers also produce high resolution tracks that can be used to measure a river’s width and infer its streamflow rate. This has been successfully demonstrated using overpasses of the Pascagoula River in Mississippi during a major flood event in April 2019. 42) Streamflow measurements by a USGS river gauge made before, during and after the event are shown in the upper panel below, together with markers at the times of each of five overpasses by CYGNSS. The lower panel shows the Associated GNSS-R Width (AGW) of the river derived from each CYGNSS overpass, together with the Pascagoula’s streamflow rate at the time.
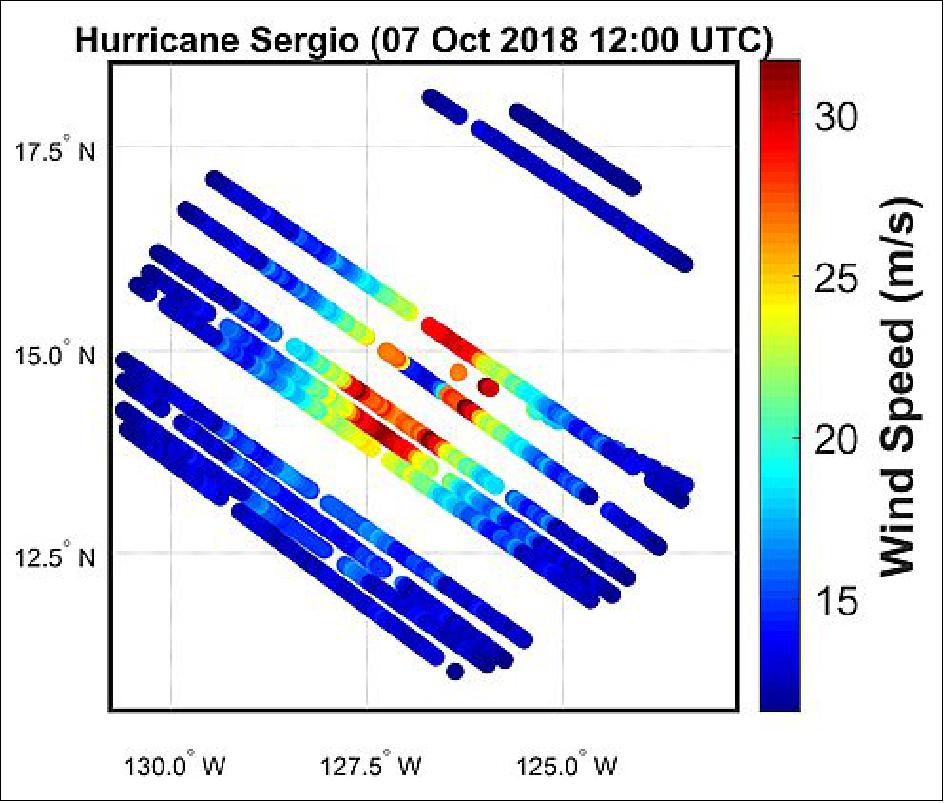
• October 7, 2019: Eight microsatellites flying in a row may be key to improving forecasts of a hurricane's wind speed - detecting whether it will make landfall as a Category 1 or a Category 5. NASA's Cyclone Global Navigation Satellite System (CYGNSS) fleet, launched in 2016, was designed to show whether the same GPS signals your phone uses for navigation can be used to measure winds deep within a hurricane or typhoon. The answer appears to be a resounding yes. 43)
- Weather forecasting models have gotten much better at predicting the future track of a hurricane or typhoon, but they haven't improved at predicting its maximum wind speed, which scientists call intensity. That's because these tropical giants are steered by outside forces, such as regional winds, but their intensity depends on forces within each storm. And while many satellites can see the external winds, they can't see through a hurricane's thick clouds and rain.
- CYGNSS Principal Investigator Christopher Ruf of the University of Michigan in Ann Arbor explained: "To predict intensity, you have to measure wind speed right in the middle of the storm and, until CYGNSS, there hasn't been a way to do it other than flying Hurricane Hunter planes."
- The new CYGNSS data proved to be an excellent match with Hurricane Hunter data collected at the same time during 2017's hurricanes Maria, Irma and Jose. The eight small satellites - orbiting with only a 12-minute gap between each one - collected more data on each storm than could be gathered during a Hurricane Hunter flight.
How to See Through Rain and Clouds
- To see what's in the atmosphere, many Earth-observing satellites send out electromagnetic signals with wavelengths that are just fractions of an inch long. To these short-wavelength signals, a drop of drizzle, speck of dust or any other airborne particle is an impenetrable obstacle. Even though the wavelengths are longer than these tiny particles, they are close enough in size that signals bounce off particles like a billiard ball colliding with another ball. By "reading" these scattered signals, researchers can discern the shape and location of clouds and other obstacles that the signals ran into.
- In other words, short wavelengths let researchers see a storm but not see through it.
- CYGNSS, on the other hand, uses GPS signals. Their wavelength is 19 cm long - far longer than either the short wavelengths most satellite instruments use or any raindrop ever measured. At that wavelength, Ruf said, "You don't see a raindrop at all. You just go right through it." That enables CYGNSS to see through a hurricane and measure the winds at the ocean surface.
- GPS satellites, operated by the U.S. Air Force, are in a much higher orbit than the CYGNSS fleet. As a GPS satellite flies over a tropical cyclone, its signals pass unimpeded through the storm and bounce off the ocean surface. In their lower orbit, CYGNSS's downward-looking GPS receivers are able to intercept signals returning upward. Distortions in these bounced signals show how rough the sea is, enabling researchers to calculate the wind speed that caused the roughness.
Turning Signals Into Measurements
- CYGNSS' eight small satellites have worked well since launch, but the mission's scientists ran into a major hurdle on the path to processing the GPS signals into wind speed data. In designing the mission, scientists assumed that GPS signals are broadcast at constant strength. But when the scientists started to collect data, they found that the signal power from most GPS satellites changes during each orbit and that the degree of change differs from satellite to satellite. These variations threw off the CYGNSS satellites' measurements of high winds by as much as 11 mph (18 km/h).
- "We spent a year or more working on the problem, and we finally got it figured out," Christopher Ruf said. "Basically, the Air Force turns the power up when they go over certain parts of the world where bad guys are trying to jam the signals." Stronger signals are harder to jam.
- Once the CYGNSS team understood the issue, they found a workaround. Each CYGNSS satellite carries not only a primary GPS receiver to collect signals bouncing up from Earth's surface, but also a secondary, smaller receiver for location and tracking. The team reprogrammed the smaller receivers to measure the strength of the broadcast signal arriving from overhead, which gave them the information they needed to correctly process the signals returning from below.
- With that problem solved, the researchers could turn to the task of assessing how CYGNSS data would affect hurricane forecasts.
- Experimenting with a research version of the same hurricane model that the National Oceanic and Atmospheric Administration (NOAA) uses for forecasts, the scientists added CYGNSS data to reconstructions of two of 2017's notable storms, hurricanes Harvey and Irma. The addition of CYGNSS data produced more realistic forecasts, not only of the storms' intensity, but of their tracks and structure. Other studies have shown similar improvements in forecasts of different storms.
An Unexpected Watery Bonus
- To Ruf's surprise, CYGNSS has proven to have an unforeseen application. The CYGNSS team had planned to routinely turn off their receivers when the satellites fly over land, but the team decided to simplify their operations by having the satellites collect data all the time. Two postdoctoral students at NASA's Jet Propulsion Laboratory in Pasadena, California, decided to look at the data from over land. "It was really luck as much as anything, but it turns out there's all kinds of nice science you can do with the land data to measure soil moisture and flooding," Ruf said.
- As the former students, Clara Chew (University Corporation for Atmospheric Research in Boulder, Colorado) and Hugo Carreno-Luengo (Barcelona, Spain), have documented the value of the data, NASA has now officially extended the scope of the mission and invited the science team to redefine the mission purposes. There may be other applications waiting to be discovered as the eight small CYGNSS satellites keep watching hidden winds in tropical storms.
• March 5, 2019: NASA has extended the CYGNSS mission for an additional year and a half. The constellation of microsatellites designed and built at SwRI (Southwest Research Institute) has made history over the last two years, penetrating thick clouds and heavy rains to accurately assess wind speeds and better understand hurricane intensification. Assessments confirmed that all eight spacecraft and their subsystems are healthy and ready to support two more years of operations. 44)
- The microsatellites make frequent measurements of ocean surface winds to monitor the location, intensity, size and development of tropical cyclones. Flying in formation, the spacecraft cover an orbital swath that passes over most of the Earth’s hurricane-producing zone, up to 35 degrees north and south of the Equator.
- “Launched in late 2016, the spacecraft have provided round-the-clock surface wind speed measurements to help improve intensity forecasting of tropical cyclones,” said SwRI’s William Wells, CYGNSS operations phase systems engineer. “The extended mission opens the door for many new science opportunities, in addition to continuing the primary mission objectives. We are making some engineering and operational changes to enable new types of science while maximizing science returns in this second phase.”
- This science is critical because, over the last few decades, forecasters have improved hurricane path prediction significantly, but the ability to predict the intensity of storms has lagged behind. Collecting data in the midst of a storm is difficult and dangerous, but conventional space technology could not provide accurate measurements. GPS signals penetrate intense rainstorms, and CYGNSS uses these signals, reflected off the ocean surface, to calculate wind speeds.
- “For the extended mission, we are ramping up for four new investigations related to tropical cyclones, six in other oceanography disciplines, six that use CYGNSS data in groundbreaking land science applications and many others,” said SwRI’s Jillian Redfern, CYGNSS project manager and mission operations manager. “We are adjusting payload operations to support the new science applications while maintaining production of the core data products already in use by the science community.”
- During the prime mission phase, CYGNSS science has led to 72 refereed journal publications and 158 conference proceedings publications in atmospheric, ocean and terrestrial science as well as space systems engineering.
- “We have made extensive observations of inner core winds and demonstrated that assimilating these data into numerical weather prediction models has a significant positive impact on their ability to forecast a storm’s track, intensity and structure,” said Dr. Chris Ruf, CYGNSS Principal Investigator from The University of Michigan in Ann Arbor, Michigan. “In addition, bonus observations over land have uncovered a wealth of new science applications related to imaging of flood inundation and measuring sub-surface soil moisture. I look forward personally to many more years supporting these efforts and helping to expand the community of our data users."
- SwRI led the engineering development and manages the operation of the constellation. The University of Michigan Climate and Space Sciences and Engineering Department leads the science investigation, and the Earth Science Division of NASA’s Science Mission Directorate oversees the mission. SwRI’s office in Boulder, Colorado, hosts the mission operations center, which commands the spacecraft, collects the telemetry and transmits the data to the science operations center at the University of Michigan.
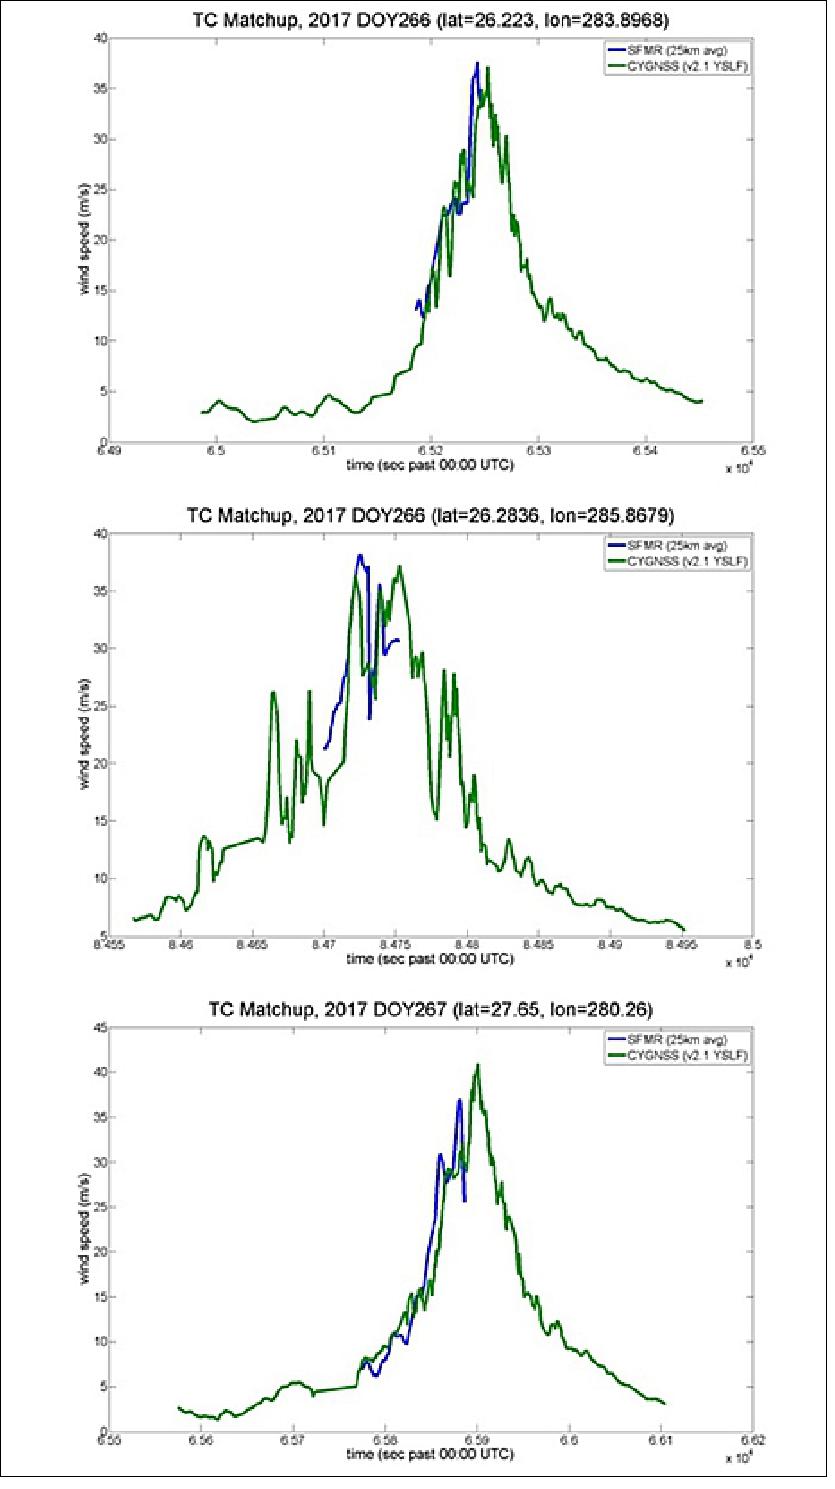
• December 15, 2018: Two year anniversary of CYGNSS on orbit. The constellation of eight CYGNSS microsatellites reached a milestone today, completing its second year on-orbit. The first year had focused primarily on engineering commissioning, calibration and early validation of the science data products. The second year was spent continuing to refine and improve the quality of the science data products, while also applying the measurements to a number of scientific investigations. Some examples of the refined wind speed measurements are shown in Figure 31 for three overpasses of Hurricane Maria, on 23 Sep 2017 at 00:18 (top), 23 Sep 2017 at 00:23 (middle), and 24 Sep 2017 at 00:18 (bottom). 45)
- In the figure, the green trace shows the measurements made by CYGNSS while the blue trace shows measurements made by SFMR (Stepped Frequency Microwave Radiometer) instruments on the NOAA hurricane hunter aircraft that flew into the storms while CYGNSS was passing overhead. The CYGNSS and SFMR measurements can be seen to agree quite well. Quantitative results of the calibration and validation of CYGNSS science data products are described in a Special Issue of the IEEE Journal of Selected Topics in Applied Earth Observations and Remote Sensing.
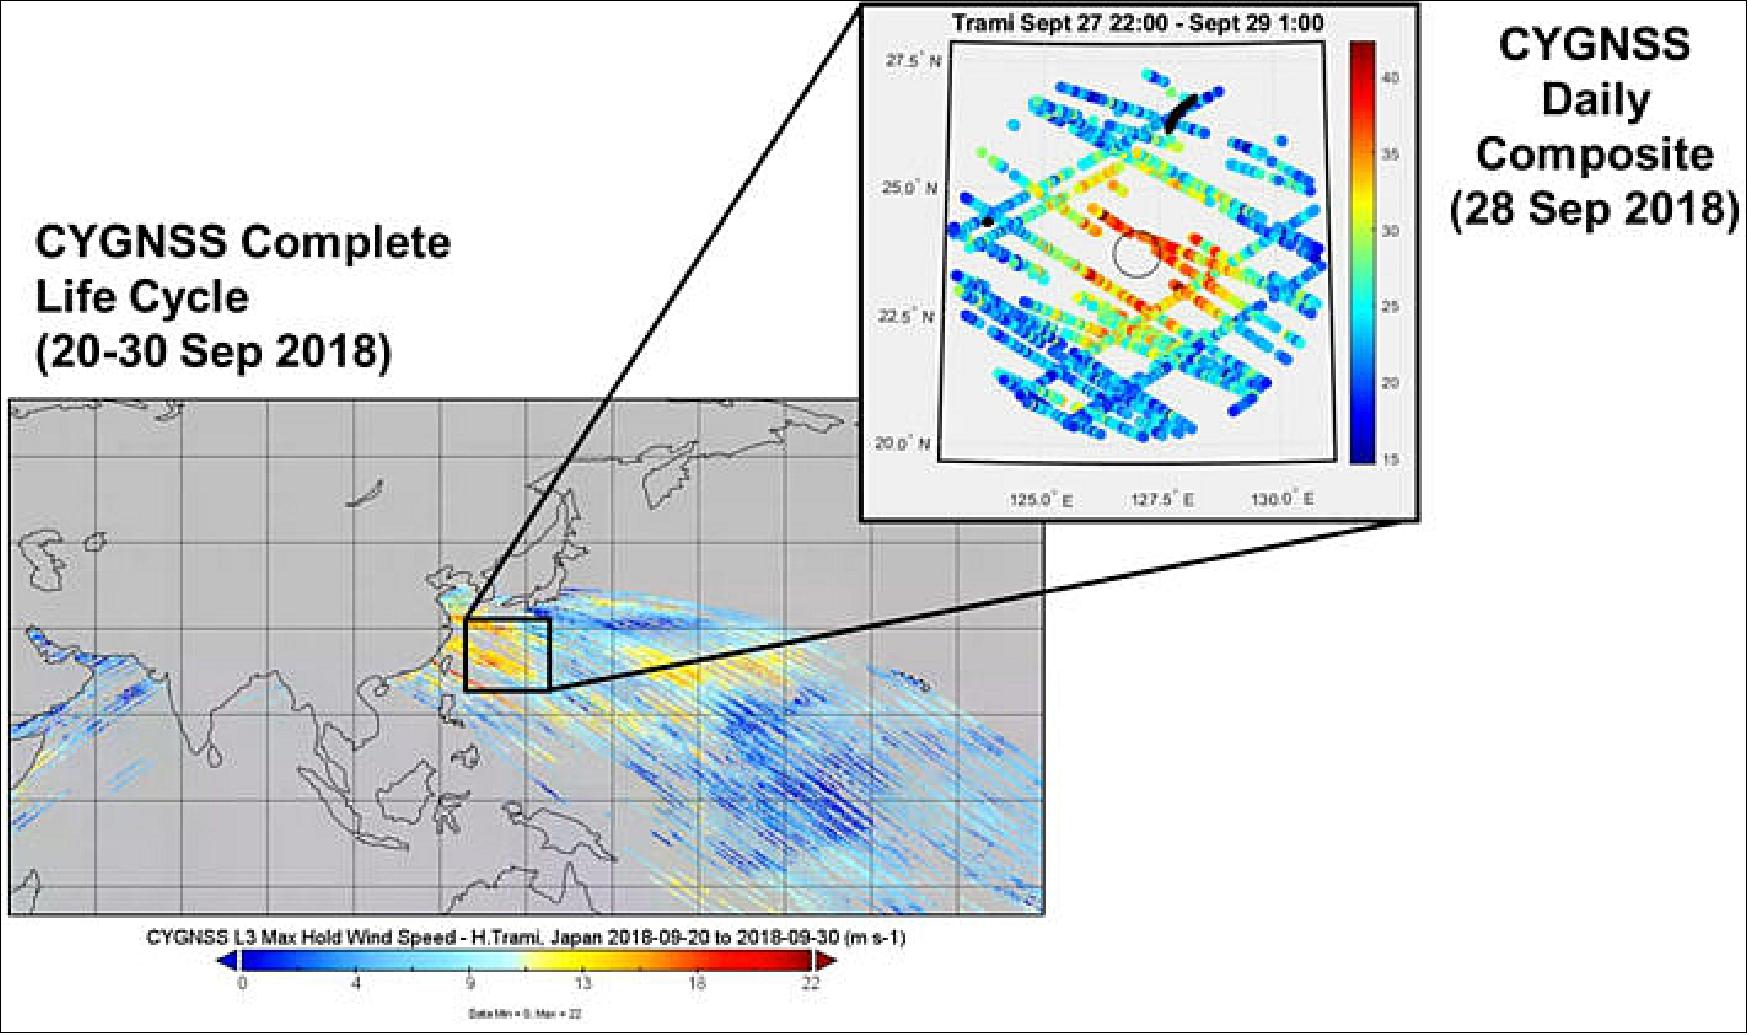
- Measurements by CYGNSS of Typhoon Trami in Sep 2018, shown in Figure 32, illustrate its ability to track the evolution of a storm over its full life cycle. In the figure, the lower left image is a composite over the period 20-30 Sep 2018 of all wind speed measurements made at one phase of the constellation’s orbit. The upper right insert shows all measurements made on 28 Sep 2018, with the measurements re-gridded to a storm-centric coordinate system to illustrate the wind speed structure in the inner core region.
- Science investigations have expanded beyond the primary mission objective to measure wind speed in tropical cyclones. The measurements are being introduced into numerical weather prediction models to assess their impact on the skill in forecasting hurricane track, intensity and structure. Early results look quite promising, with clear signs of a positive impact on forecast skill. The results will be presented in a series of talks at the annual meeting of the American Meteorological Society in January 2019.
- In parallel with the activity over ocean, new science investigations are examining data over land as well. CYGNSS measurements have been found to be sensitive to the surface soil moisture, and to the presence of inland water bodies. Good examples of this are documented in recent publications. Kim and Lakshmi (2018) estimate soil moisture at numerous sites in the continental U.S. over a 12 month period and find close agreement with independent measurements made by ground sensors and another satellite.46) Jensen et al. (2018) demonstrate the ability of CYGNSS to detect and map the extent of flood inundation under dense forest canopies. 47) Chew et al. 48) (2018) use this capability to produce time lapse images of flooding in and around Houston and Havana after landfalls by Hurricanes Maria and Irma, respectively. These results demonstrate the wide range of future applications of CYGNSS data as the mission moves forward into its third year.
• July 30,2018: Hurricanes bring heavy rainfall and strong winds to coastal communities, a potent combination that can lead to devastating damage. In 2016 NASA launched a set of eight satellites called the CYGNSS (Cyclone Global Navigation Satellite System) mission to gather more data on the winds in these tropical cyclones as part of an effort to increase data coverage of hurricanes and aid forecasts. As the first year of data is being evaluated, a new and unexpected capability has emerged: the ability to see through clouds and rain to flooded landscapes. 49)
- The flood maps are possible thanks to one of the innovations of the CYGNSS constellation. The microwave signal the CYGNSS satellites use to detect wind speed based on the choppiness of the ocean is actually not generated by the satellites at all. Instead the satellites use the constant and ubiquitous signals from the Global Positioning Satellite (GPS) system, which is also responsive to reflections from standing water and the amount of moisture in the soil.
- “Before about 2015, people had inklings that you could use GPS reflection data over land to look at various things, but there hadn’t been many observations to prove it,” said Clara Chew, a researcher at UCAR (University Corporation for Atmospheric Research) in Boulder, Colorado. “With the launch of CYGNSS we’ve finally been able to really prove that yes, these signals are very sensitive to the amount of water either in the soil or on the surface."
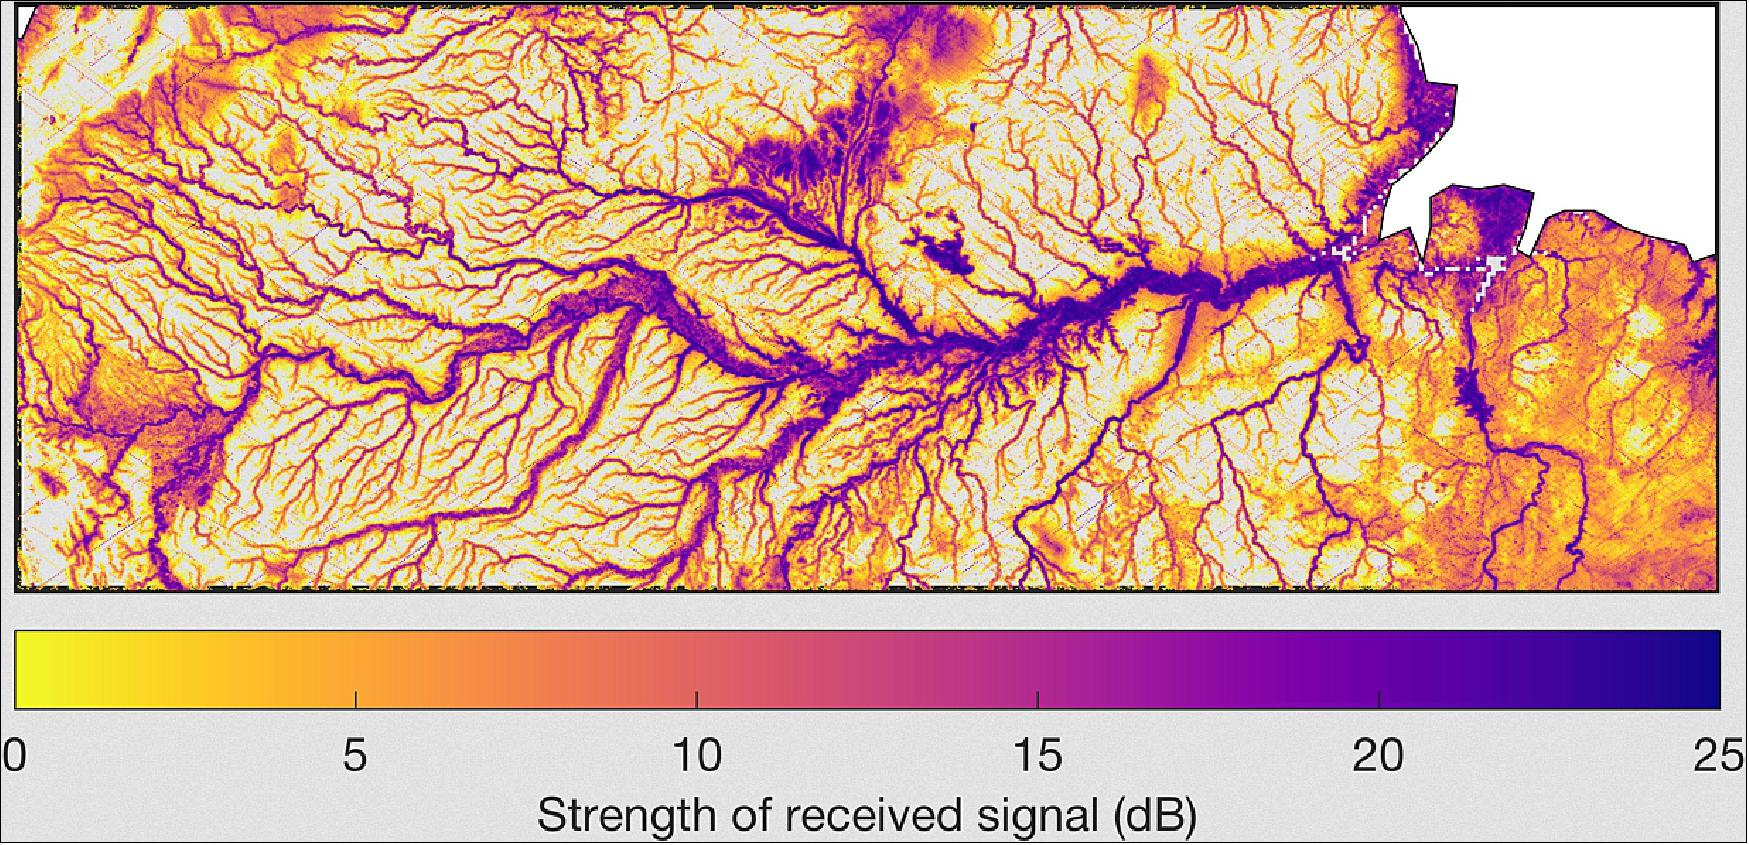
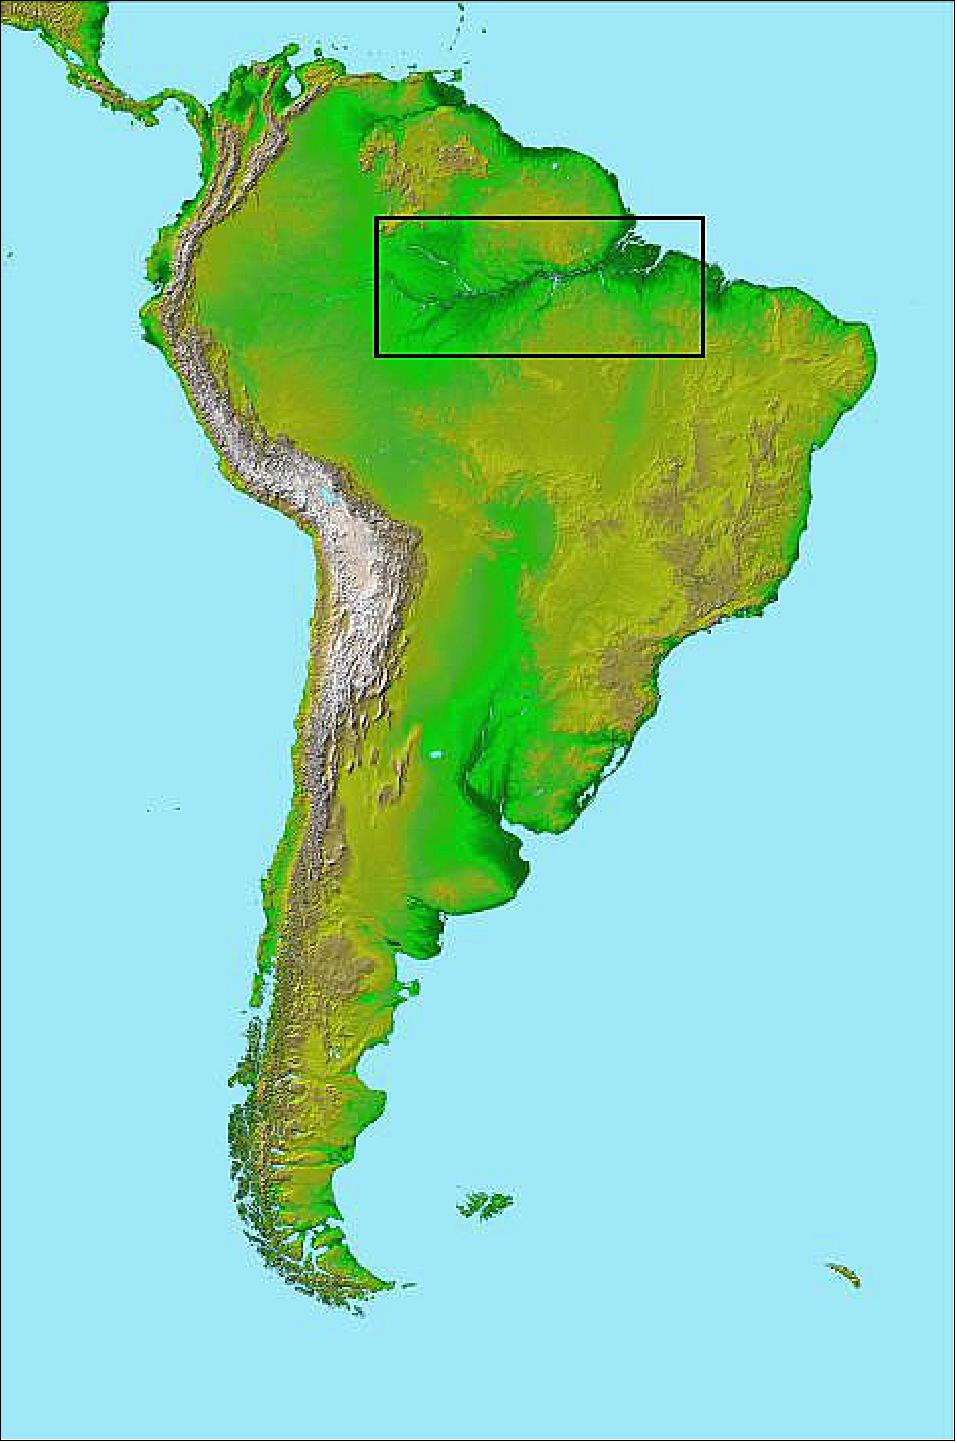
- Chew developed flood inundation maps of the Texas coastline after Hurricane Harvey and of Cuba after Hurricane Irma, as well as flood maps of the Amazon River in Brazil, which overflows its banks seasonally.
- "When we made our first complete map of the Amazon, everyone was really shocked because you can see a lot of the tiniest, tiniest rivers throughout the basin, and nobody knew that we were going to see rivers a hundred meters wide or so in the data," Chew said, noting that the native resolution of data over the ocean varies between 10 and 15 km and it is averaged to a consistent 25 kilometers.
- "When I saw the first land images of inland water bodies, I was amazed at their quality," said Chris Ruf, CYGNSS's principal investigator at the University of Michigan in Ann Arbor. "We had known beforehand that there would be some instances of coherent scattering possible. That's the phenomenon that creates such high-resolution images. It rarely happens over the ocean and we hadn't really considered how often it might happen over land. It turns out that it happens quite frequently, and almost always when observing small inland water bodies. This promises to open up entirely new areas of scientific investigation."
- CYGNSS’s advantage over other space-based sensors for flood detection is its ability to see through clouds, rain and vegetation that may otherwise obscure floodwaters. Currently, flood detection is generally done by optical sensors on the U.S. Geological Survey-NASA Landsat satellites, which can't see through clouds, and the microwave sensors on the European Space Agency's Sentinel-1 and -2, which can't see through vegetation. Capturing data from eight satellites instead of one is another advantage because it decreases the time between observations for locations, meaning more coverage, more rapidly, of flooding in the tropics. Together this means CYGNSS could bridge gaps in current coverage.
- "Flooding from hurricanes can happen really quickly," Chew said. "You can go from dry to a complete flood within a matter of hours. So even with satellites that observe Earth every two to three days you can miss a lot of information such as how quickly an area flooded and the maximum extent of flooding. But if you have more samples, like what CYGNSS gives you, then you can start to really pinpoint these types of things."
- However, this type of detection is still in its early days of development, and Chew and others are exploring how to infer the amount of water present and other parameters to complement soil moisture and flood data from other satellites. In addition, CYGNSS data currently takes two days to go from observation to data users.
- "It's very fitting that one of the new things that CYGNSS is unexpectedly good at determining, the extent of flood inundation, is very often a direct consequence of the thing it was designed to measure, namely hurricanes," Ruf said. "So now, not only will we be able to observe the hurricanes while they are over the ocean, we will now also be able to map much of the damage they cause from flooding after landfall."
• April 2018 - CYGNSS Mission Status and Constellation Configuration: All eight of the CYGNSS spacecraft are in good working order and collecting data with a near-100% duty cycle. The observatories were grouped on a single launch vehicle and have been gradually dispersing into their respective orbital tracks during the past year to improve their sampling statistics. The spacecraft carry no propulsion systems; rather, constellation spacing is adjusted by performing “drag maneuvers,” in which one or more spacecraft at a time are tilted so that the solar panels are approximately perpendicular to the tenuous upper atmosphere, present even at orbital altitude. The additional drag induced by this configuration causes a small decrease in altitude and resultant increase in orbital velocity relative to the rest of the constellation, allowing spacecraft to be repositioned one by one. CYGNSS is the first mission for which differential drag has been used in maintaining constellation spacing. 50)
- CYGNSS Observations of the 2017 Atlantic Hurricanes: The CYGNSS constellation was in orbit and performing nominally during the entirety of the unusually active 2017 Atlantic hurricane season. Because of the exceedingly strong winds and highly disturbed sea state in major hurricanes, it is very difficult to derive reliable reference wind speed data from numerical weather prediction models with which to evaluate CYGNSS retrievals. For this reason, coincidence with validation data gathered with the NOAA P3 Orion “Hurricane Hunter” aircraft is especially useful. During the 2017 Atlantic hurricane season, CYGNSS data were matched to the SFMR (Stepped Frequency Microwave Radiometer) data, which can estimate surface winds in hurricanes, and dropsonde data from the P3 Orion for every named storm—most notably, the destructive hurricanes Harvey, Irma, and Maria. Comparison between the CYGNSS NBRCS (Normalized Bistatic Radar Cross Section) and the SFMR estimated surface winds show that the CYGNSS signal does not saturate, even at surface wind speeds up to 60 m/s (Figure 35).
![Figure 35: Coincident measurements of ocean surface wind speed by SFRM (Stepped Frequency Microwave Radiometer) on P3 Orion “Hurricane Hunter” aircraft [right vertical axis, darker plot] and the CYGNSS NBRCS [left vertical axis, lighter plot] during a simultaneous overpass of Hurricane Maria on September 24, 2017 at 18:17 UTC. As the wind speed increases, so does the ocean surface roughness—which is what CYGNSS measures directly from space. As the ocean surface roughens, it diffusely scatters a larger portion of the GPS signal, resulting in smaller NBRCS in the specular direction with increasing wind speed (image credit: University of Michigan)](https://eoportal.org/ftp/satellite-missions/c/CYGNSS-230621/CYGNSS_Auto13.jpeg)
- CYGNSS Calibration and Validation and Baseline Data Products: Data from CYGNSS consist of the Level-1 (L1) Delay Doppler Map (DDM), which is effectively a map of the diffuse scattering from the ocean surface in a two-dimensional coordinate system consisting of GPS time delay and Doppler frequency shift. Each coordinate is relative to the specular reflection point on the Earth’s surface. Level-2 (L2) products, estimated from the L1 data, include ocean surface wind speed and the MSS (Mean Square Slope) of the ocean surface. A Level-3 (L3) gridded wind speed product is produced from the L2 wind speed estimates at 0.2º spacing and hourly time intervals. Several Level-4 (L4) products, including estimates of tropical cyclone radius of maximum winds, maximum wind speed, and integrated kinetic energy are being developed. Version 2 of the L1 and L2 products was released in December 2017, two weeks prior to the meeting.
• August 2017: Advancements in electronics and nanosatellite technologies combined with recent modeling development are enabling a new class of remote sensing capabilities that present more cost effective solutions to existing problems while opening new applications of Earth remote sensing. Increased temporal sampling on both a global and macro scale is one such example of capability increase enabled by nano- and microsatellites. 51) 52)
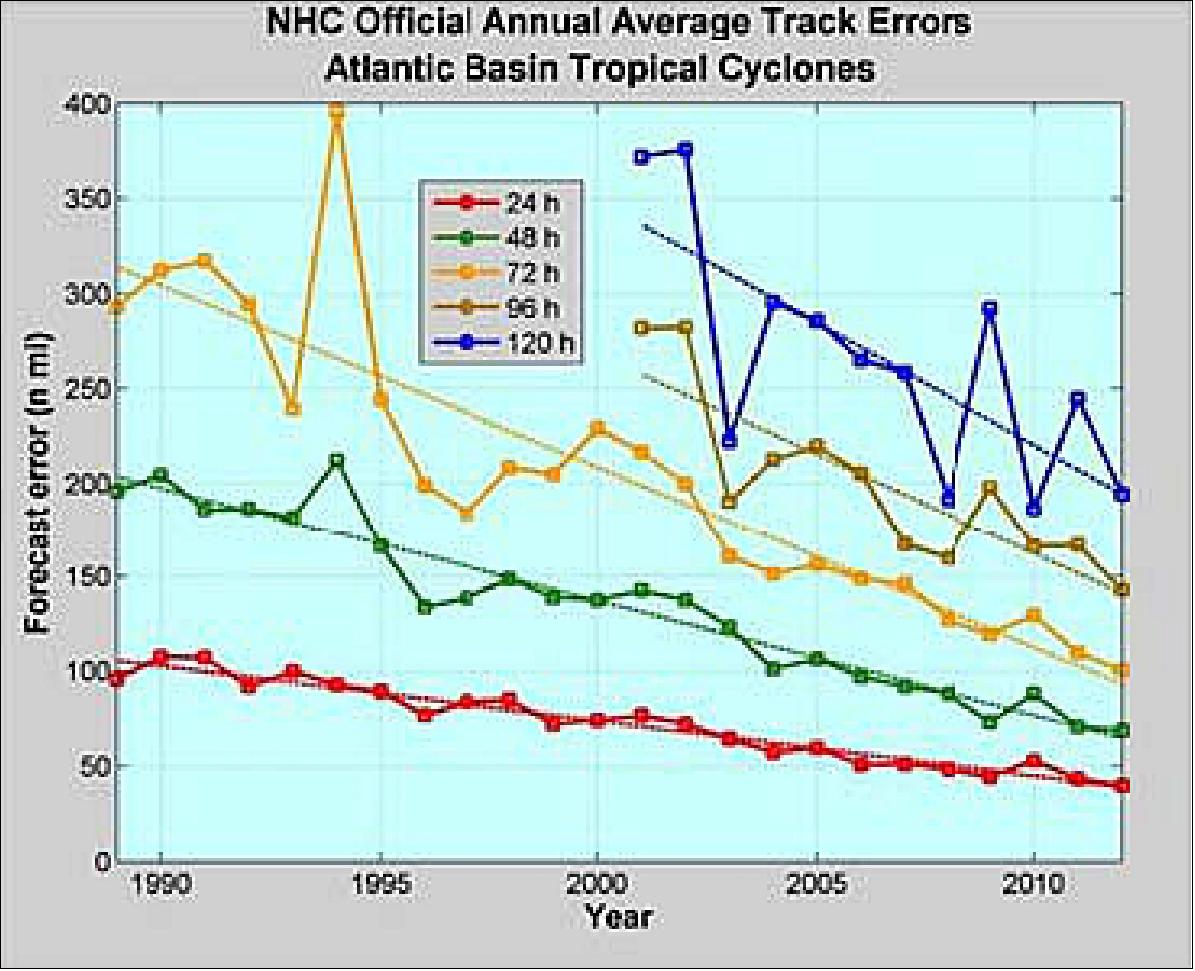
- TC (Tropical Cyclone) track forecasts have improved in accuracy by ~50% since 1990 as illustrated in Figure 36, largely as a result of improved mesoscale and synoptic modeling and data assimilation. This improvement has been made possible largely through the availability of space borne ocean altimetry and wind observatories operating in LEO. These observatories are designed to provide maximized global coverage and high precision altimetry data for large-scale topographic studies which have demonstrated a close relationship between measurement of large-scale Earth phenomena and TC track forecast skills.
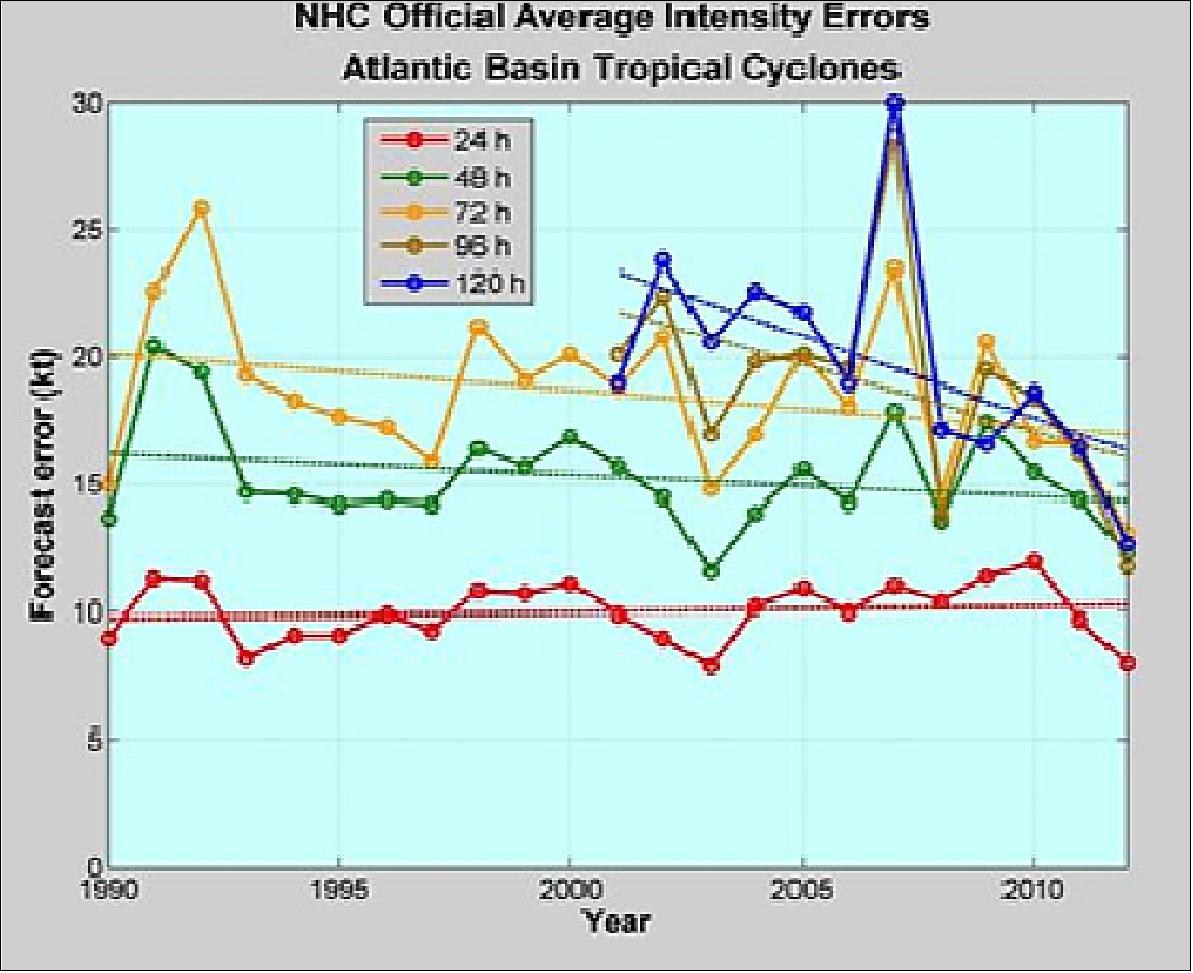
- In that same period since 1990, there has been essentially no improvement in the accuracy of TC intensity forecasts (Figure 37). This is widely recognized not only by national research institutions, but also by the general public as recently demonstrated during Hurricanes Katrina, Irene, and Sandy. The fact that forecast improvements in TC intensity have lagged so far behind those of TC track suggests that the deficiency lies somewhere other than proper observations and modeling of the mesoscale and synoptic environment. Review of dataset gaps lead researchers to conclude TC intensity forecasts are tied to local conditions in and around the TC as it develops.
- Near-surface winds over the ocean are major contributors to and indicators of momentum and energy fluxes at the air/sea interface. The coupling between the surface winds and the moist atmosphere within a TC are thought to be key in its genesis and intensification.
- Operational Overview: Each CYGNSS Observatory collects, processes, and downlinks science and engineering data with no commanding required. Flowing data from each Observatory to the ground segment is the predominant operational activity during the science acquisition mission phase. To streamline operations, the CYGNSS microsatellites are designed to support initiation and completion of ground contacts without any ATS (Absolute Time Sequence) or ground commands. This design supports adding or rescheduling a ground contact by simply coordinating the appropriate ground segment resources.
- ATS command loads are generated and uplinked as required to support calibration activities, instrument mode changes, maneuver commanding, and other special case microsatellite or instrument maintenance commanding. As noted previously, there are no ATS commands required to support routine science data collection or ground contacts.
- Beyond Tropical Cyclones: With the successful transition of CYGNSS into science operations, measurement of ocean winds using GNSS-R techniques are becoming a proven commodity. The CYGNSS database is already being exploited by scientists in studies of the inherent coupling of ocean sea surface conditions and winds to monitor maritime surface conditions within the CYGNSS coverage area, convective dynamics in the Madden-Julian Oscillation, as well as the understanding of general air/sea momentum, heat, and moisture flux transfer. While using GNSS-R for ocean surface related science is being well established by CYGNSS, GNSS-R has potential applications well beyond the tropical ocean surface, most of which have only been developed in the last ten years. They include soil moisture and vegetation sensing, snow depth monitoring, sea ice mapping, and when fused with other data sources, the potential for tsunami detection/warning, avalanche monitoring, and landslide prediction.
- In summary, research has indicated that GNSS remote sensing has the potential to provide environmental scientists a cost effective, wide-coverage measurement network that will greatly increase our knowledge of the Earth's environmental processes. NASA's CYGNSS mission represents the pathfinder in this technology regime with additional GNSS-R based missions in various planning stages. While applications beyond sea surface and wind monitoring require further research, it is clear that if research such as that enabled by the CYGNSS mission is applied, GNSS altimetry and scatterometry hold excellent potential for providing cost effective monitoring techniques by themselves and as complemented by other data sources where some cases represent unique opportunities and capabilities that cannot be achieved by existing traditional remote sensing tools.
• On May 22, 2017, NASA's CYGNSS constellation began regular production of its science data products – measurements of ocean surface wind speed and roughness – with public release of these data facilitated by the NASA PO.DAAC (Physical Oceanography Distributed Active Archive Center). The production and distribution is timed to coincide with the beginning of the Atlantic hurricane season on June 1. 54)
- CYGNSS – a constellation of eight microsatellite spacecraft launched into low inclination, low-Earth orbit over the tropics on December 15 – will make frequent measurements of ocean surface winds in the tropics, with a primary objective of monitoring the location, intensity, size, and development of tropical cyclones.
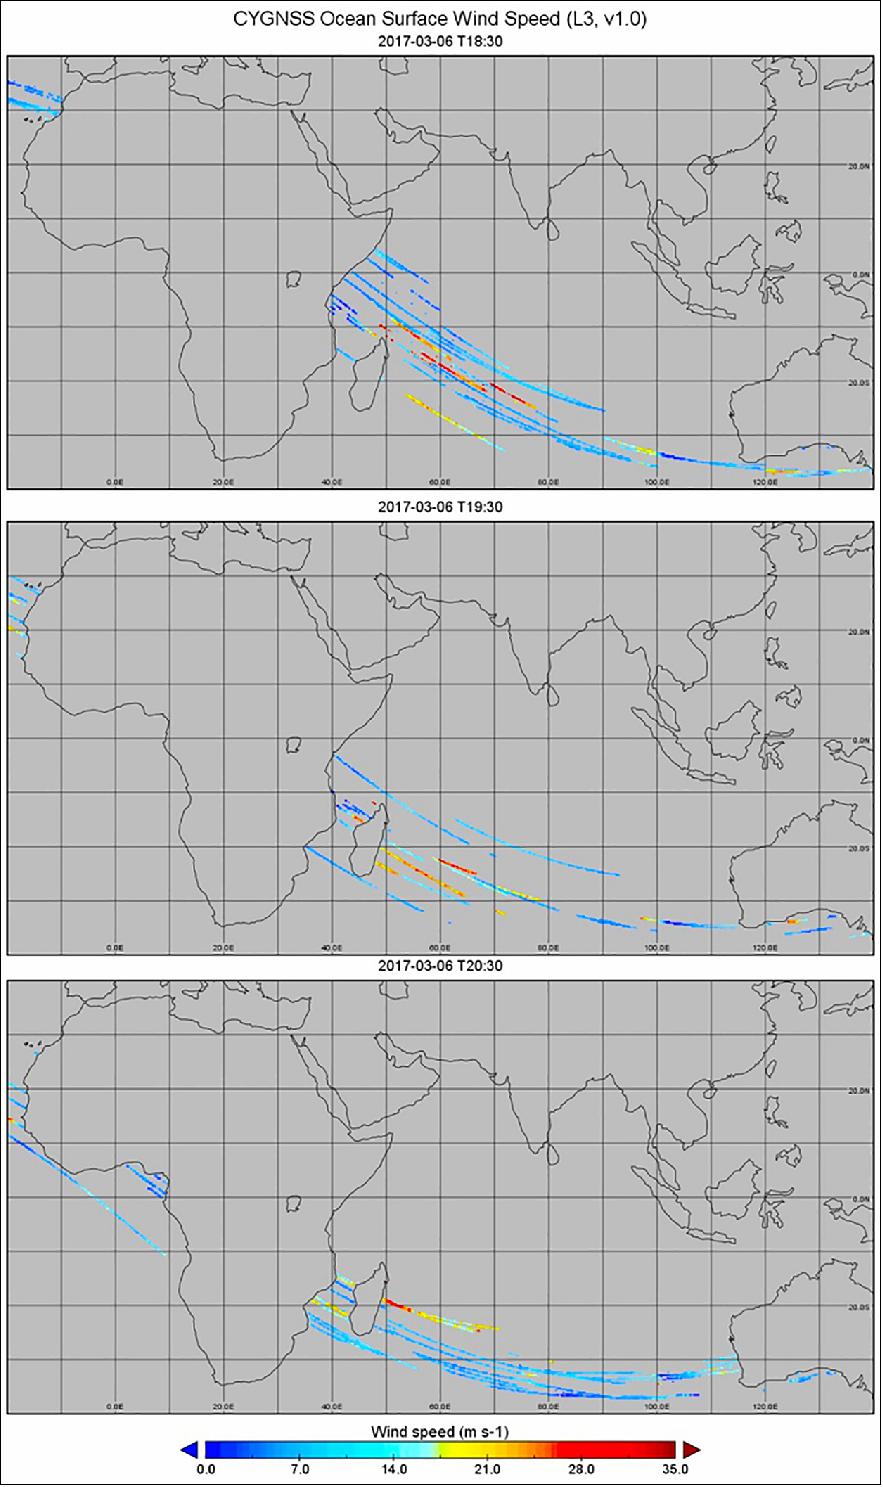
- The ability of the CYGNSS constellation to track the development of surface winds in a major storm is demonstrated by preliminary measurements made during its flyover of Tropical Cyclone Enawo on March 6, as the system approached Madagascar with surface winds in excess of 160 km/h.
- “Successive spacecraft in the constellation observed Enawo over a period of several hours just before it made landfall on Madagascar,” explained Chris Ruf, Professor of Atmospheric Science at the University of Michigan and CYGNSS Principal Investigator. “During the flyover, four of our eight spacecraft were operating in science mode and we managed to capture important elements of the size and structure of the storm.” According to Ruf, the other four spacecraft were still undergoing engineering commissioning activities. “Those activities are now largely complete and, as we enter the Atlantic hurricane season, we expect to have all eight of them available for science observations. This will effectively double our sampling and coverage.”
• March 31, 2017: The NASA's CYGNSS constellation successfully completed the development and on-orbit commissioning phases of its mission on March 23 and moved into the science operations phase. The spacecraft have now begun their science instrument calibration and validation and are on track to deliver the first science data in May, just in time for the start of the 2017 Atlantic hurricane season. 55)
- The CYGNSS spacecraft, launched into low-inclination, low-Earth orbit over the tropics on December 15, will make frequent measurements of ocean surface winds in and near a hurricane’s inner core, an area that up until now has proven impossible to probe accurately from space. CYGNSS is able to measure the surface winds using GPS signals reflected by the ocean surface, which are able to penetrate through the intense rain in a storm’s eye wall.
- "All spacecraft have completed their on-orbit engineering tests and are performing to specification," said SwRI’s Randy Rose, CYGNSS Project Systems Engineer in San Antonio, TX, which designed and built the spacecraft. "It is very gratifying to be seeing how well everything is working. The scientists are going to get everything they'd hoped for, plus some."
- Over the past several decades, forecasters have improved hurricane path prediction significantly, but their ability to predict the intensity of storms has lagged behind. With data from CYGNSS, forecasters hope to improve hurricane intensity forecasts by better understanding how storms rapidly intensify.
- “With CYGNSS, we’re doing important, breakthrough science with a constellation of satellites that are literally small enough to sit on your desk,” said John Scherrer, a program director in SwRI’s Space Science and Engineering Division who oversaw satellite construction. “While these satellites might be small, they provide big returns with data that we expect to one day help weather forecasters make important weather-related forecasts such as storm related damage projections and reliable evacuation orders.”
- SwRI’s office in Boulder, Colorado, hosts the mission operations center, which commands the spacecraft, collects the telemetry, and transmits the data to the science operations center, based at the University of Michigan in Ann Arbor.
- CYGNSS recently demonstrated its ability to observe surface winds in major storms during its flyover of Tropical Cyclone Enawo, on March 6, just hours before the storm made landfall over Madagascar. “Enawo had maximum sustained winds estimated at 125 mph by the Joint Typhoon Warning Center around the time of the CYGNSS overpass,“ said Chris Ruf, Professor of Atmospheric Science at the University of Michigan and CYGNSS Principal Investigator. “The satellites’ measurements responded as expected to changes in the wind speed as they approached and passed over the storm center, showing strong and reliable sensitivity throughout. We are looking forward to the completion of our calibration and validation activities and the beginning of well-calibrated science observations.”
- The CYGNSS mission is led by the University of Michigan. SwRI led the engineering development and manages the operation of the constellation. The University of Michigan Climate and Space Sciences and Engineering department leads the science investigation, and the Earth Science Division of NASA’s Science Mission Directorate oversees the mission.
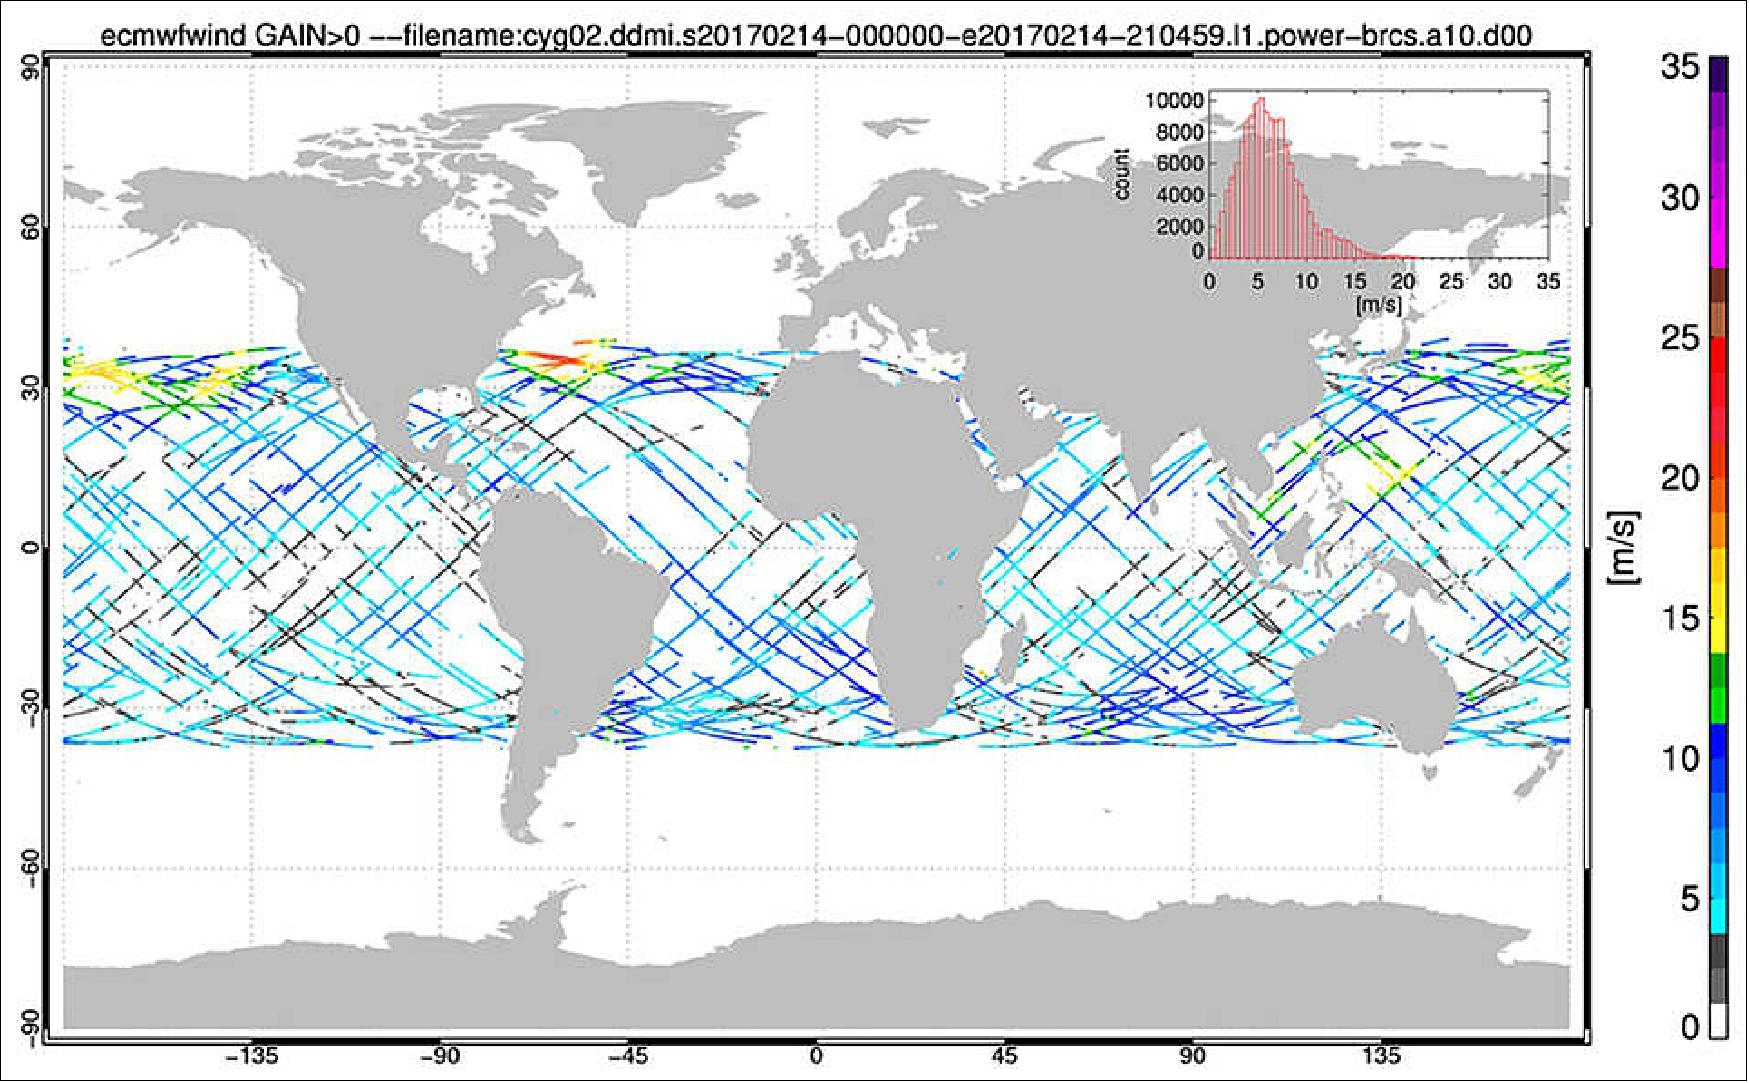
• January 5, 2017: NASA's CYGNSS constellation of eight spacecraft made its “first light” measurements of the ocean surface on Jan. 4, 2017. Measurements were made by one of the eight spacecraft, and mission scientists plan to activate the science instruments on the other seven in the near future. Direct measurements are made of the GPS power reflected by the ocean surface, from which near-surface wind speed can be derived over tropical oceans and, in particular, inside hurricanes. 56)
- Direct science measurements are displayed as a DDM (Delay Doppler Map), which shows the GPS power reflected by the ocean in the vicinity of the targeted measurement location. One such DDM is shown here, measured by constellation spacecraft FM03 on January 4, 2017, at 15:48:31 UTC in the South Atlantic Ocean, east of Brazil.
- “Our first light DDMs are direct confirmation that the CYGNSS science instrument on FM03 is operating as expected,” said Christopher Ruf, CYGNSS principal investigator at the University of Michigan’s Department of Climate and Space Sciences and Engineering in Ann Arbor. “There are still many steps ahead of us leading to reliable improvements in hurricane forecasts, but this was a critical one and it feels great to have it behind us.”
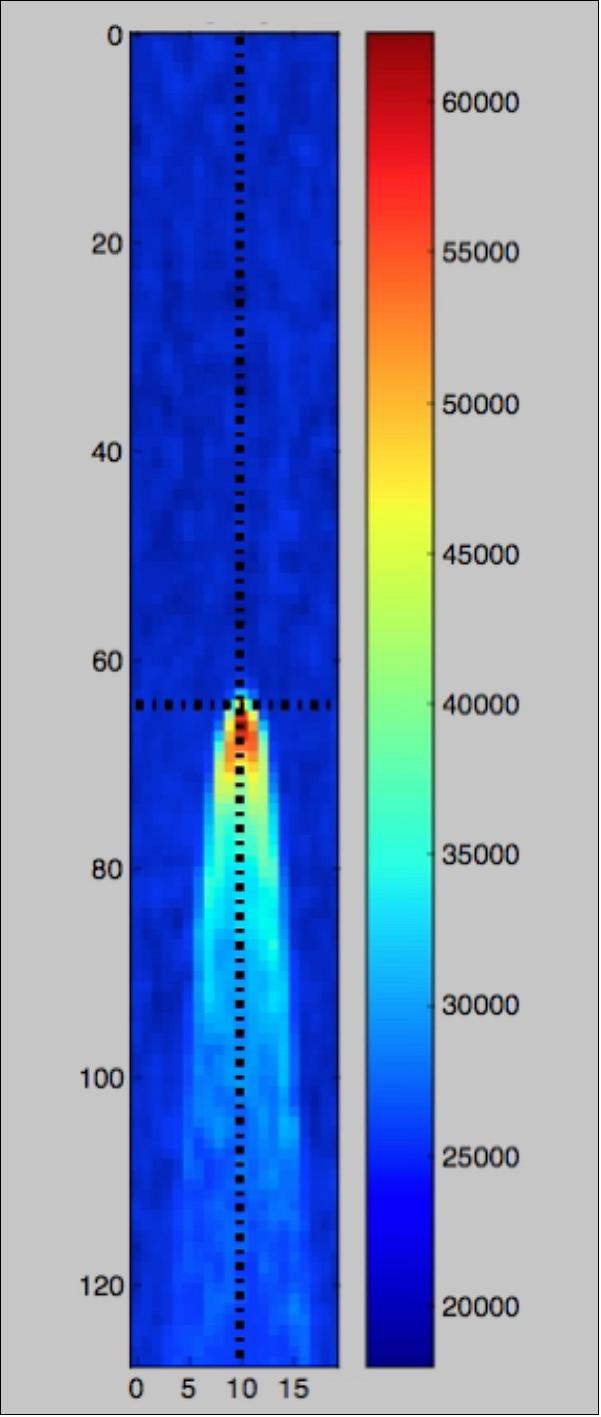
• At 21:41 UTC on Dec. 15, 2016, Chris Ruf, the PI of the mission, stated: ”We have successfully contacted each of the 8 observatories on our first attempt. This bodes very well for their health and status, which is the next thing we will be carefully checking with the next contacts in the coming days.57)
- It is an amazingly rewarding feeling to spend such an intense and focused time working on CYGNSS and then, in a matter of just a few hours, have the entire constellation suddenly come to life. I am excited (and a little exhausted) and really looking forward to diving into the engineering data in the coming days, and then into the science data in the weeks to follow.
• At 21:30 UTC on Dec. 15, 2016, all eight CYGNSS spacecraft were deployed and contacted by various ground stations — 100% success. Full constellation redundancy achieved. 58) 59)
Sensor Complement
Background: The UK-DMC-1 spaceborne demonstration mission of SSTL (Surrey Satellite Technology Ltd., launch Sept. 27, 2003) with the GPS reflectometry receiver onboard, showed that a microsatellite-compatible passive instrument (SRG-10), potentially could make valuable geophysical measurements using GPS reflectometry. The left side of Figure 41 illustrates how the process works. The direct GPS signal is transmitted from the orbiting GPS satellite and received by a RHCP (Right-Hand Circular Polarization) receive antenna on the zenith (i.e., top) side of the spacecraft that provides a coherent reference for the coded GPS transmit signal. The quasi-specular, forward-scattered signal that returns from the ocean surface is received by a nadir- (i.e., downward-) looking LHCP (Left-Hand Circular Polarization) antenna on the nadir side of the spacecraft. The scattered signal contains detailed information about its roughness statistics, from which the local wind speed can be derived (Ref. 32). 60)
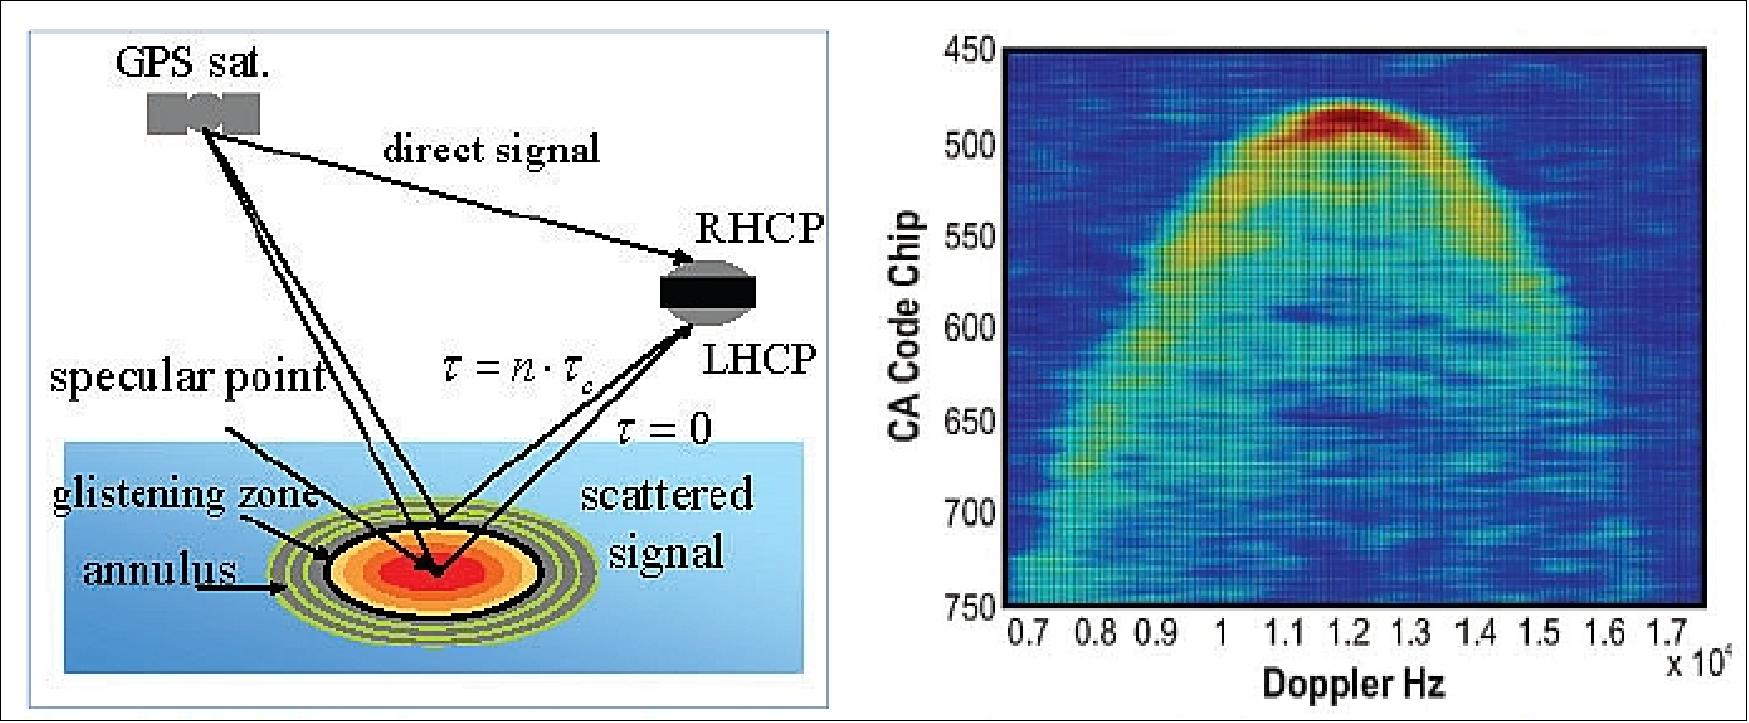
The image on the right of Figure 41 shows the scattering cross section as measured by UK-DMC-1 and demonstrates its ability to resolve the spatial distribution of ocean surface roughness. This type of scattering image is referred to as a DDM (Delay Doppler Map). There are two different ways to estimate ocean surface roughness and near-surface wind speed from a DDM. The maximum scattering cross-section (the darkest shades in the graph) can be related to roughness and wind speed. 61) 62)
This, however, requires absolute calibration of the DDM, which is not always available. Wind speed can also be estimated from a relatively calibrated DDM, using the shape of the scattering arc (the lighter shades in the graph). The arc represents the departure of the actual bistatic scattering from the theoretical purely specular case—i.e., scattering from a perfectly flat ocean surface—which appears in the DDM as a single-point scatterer. The latter approach imposes more-relaxed requirements on instrument calibration and stability than does the former. However, it derives its wind speed estimate from a wider region of the ocean surface, and thus has lower spatial resolution.
After UK-DMC-1, the development of wind-speed retrieval algorithms from DDMs became an active area of research and resulted in the design of a new instrument. called the SGR-ReSI (Space GNSS Receiver – Remote Sensing Instrument). For the development of SRG-ReSI, SSTL and the University of Surrey teamed with the National Oceanographic Centre in Southampton, U.K., the University of Bath, and Polar Imaging Ltd.
Like its predecessor, the SRG-ReSI instrument can make valuable scattering measurements using GPS, but it has greater onboard data storage capacity and can process the raw data into DDMs in real time. It also has been designed with flexibility so it can be programmed while in orbit for different purposes — e.g., tracking new GNSS signals when needed, or applying spectral analysis to received signals. 63)
In effect, the SGR-ReSI fulfils in one module what has historically been handled by three separate units on earlier spacecraft (Figure 42). Specifically:
• It performs all the core functions of a space GNSS receiver, with front-ends supporting up to eight single or four dual-frequency antenna ports
• It is able to store a quantity of raw sampled data from multiple front ends, or processed data in its 1 GB solid-state data recorder
• It has a dedicated reprogrammable field-programmable gate array (FPGA) coprocessor (a Xilinx Virtex 4).
The coprocessor was specifically included for the real-time processing of the raw reflected GNSS data into DDMs. However, it has flexibility to be programmed in orbit as required for different purposes, for example to track new GNSS signals, or to apply spectral analysis to received signals.
For the coprocessor to generate DDMs of the sampled reflected data, it needs to be primed with the PRN, the estimated delay and the estimated Doppler of the reflection as seen from the satellite. These are calculated by the processor in conjunction with the main navigation solution - the data flow for this is shown in Figure 43. Direct signals (from the zenith antenna) are used to acquire, track GNSS signals. From the broadcast Ephemerides, the GNSS satellite positions are known. Then from the geometry of the position of the user and the satellites, the reflectometry geometry can be calculated, and hence an estimate of the delay and Doppler of the reflection.
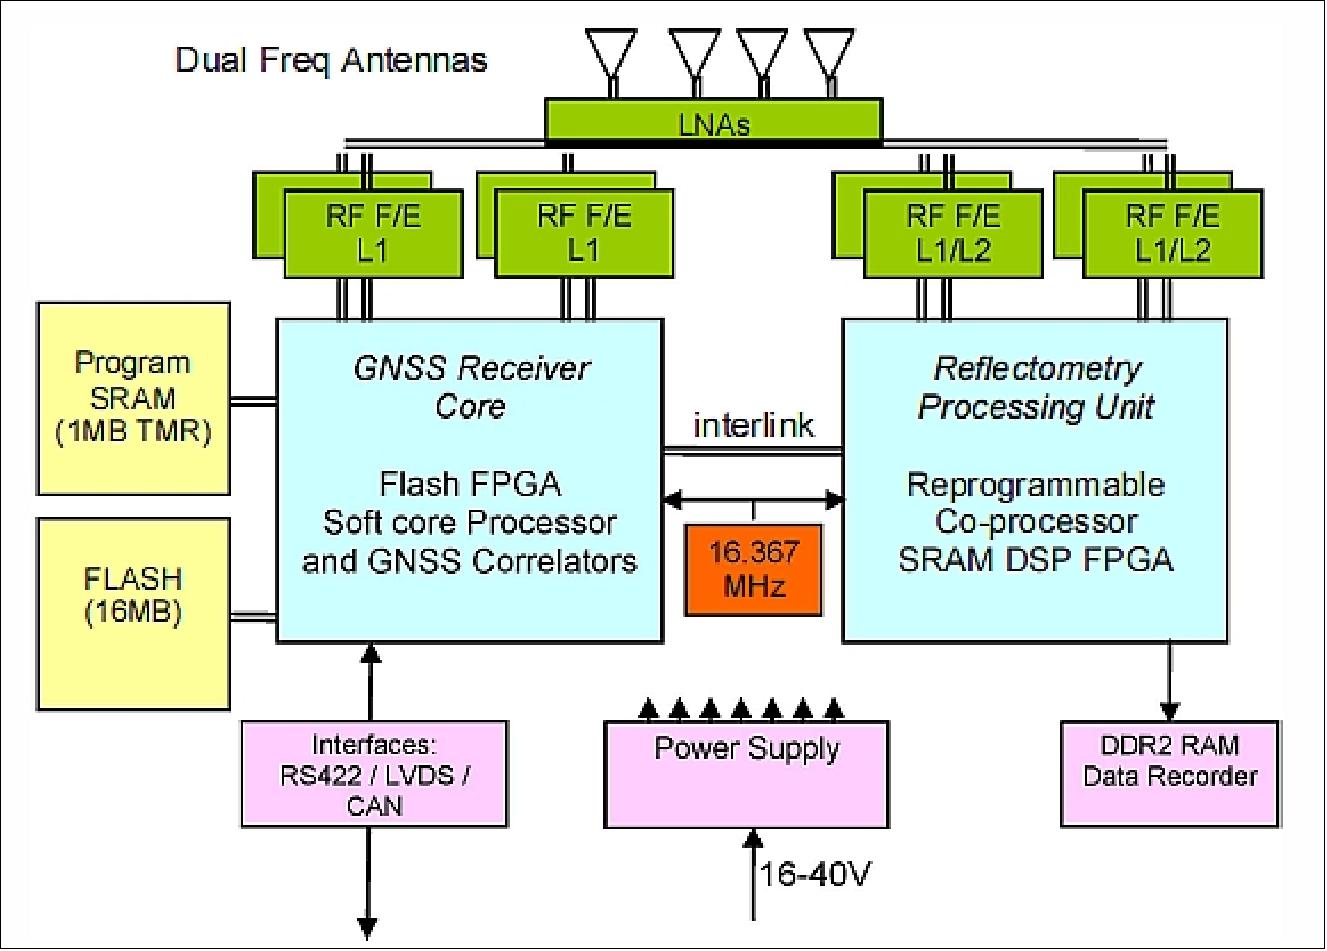
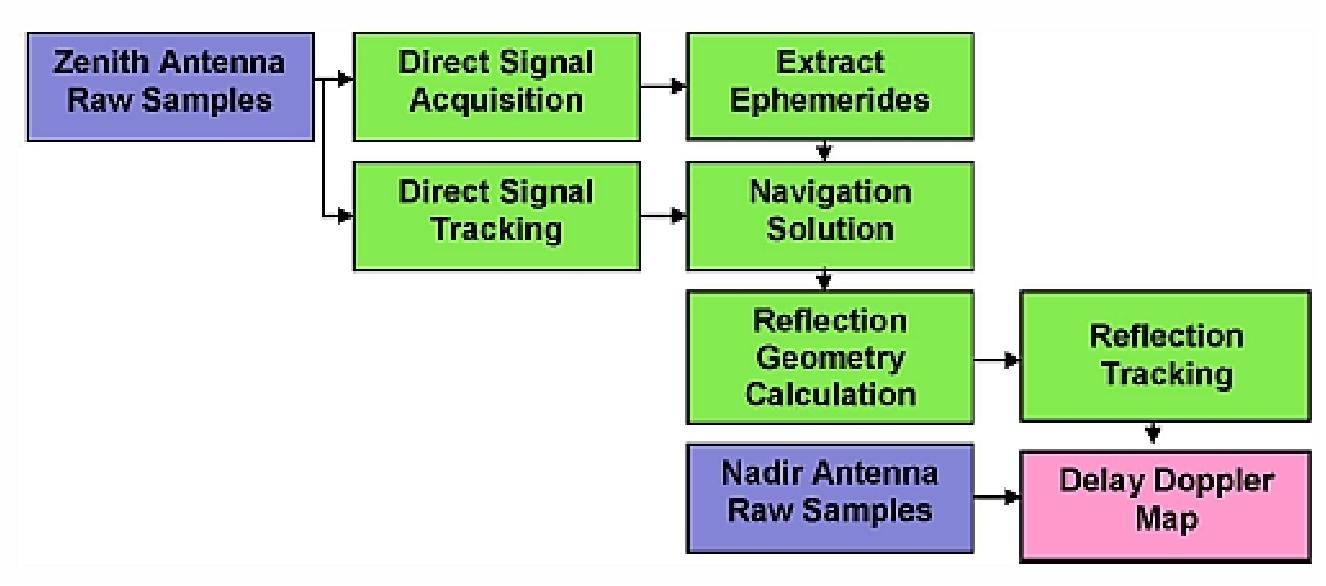
The processing of the DDM (Delay Doppler Map) is performed on the coprocessor using data directly sampled from the nadir antenna (Figure 44). In common with a standard GNSS receiver, the local PRN is generated on board the coprocessor. As an alternative to synchronizing and decoding the reflected signal in a standalone manner, the direct signals can be used to feed the navigation data sense, and assist the synchronization. The sampled data is multiplied by a replica carrier and fed into a matrix that performs an FFT (Fast Fourier Transform) on a row by row basis of the DDM, to achieve in effect a 7000 channel correlator, integrating over 1 ms. Each point is then accumulated incoherently over hundreds of milliseconds to bring the weak signals out of the noise.
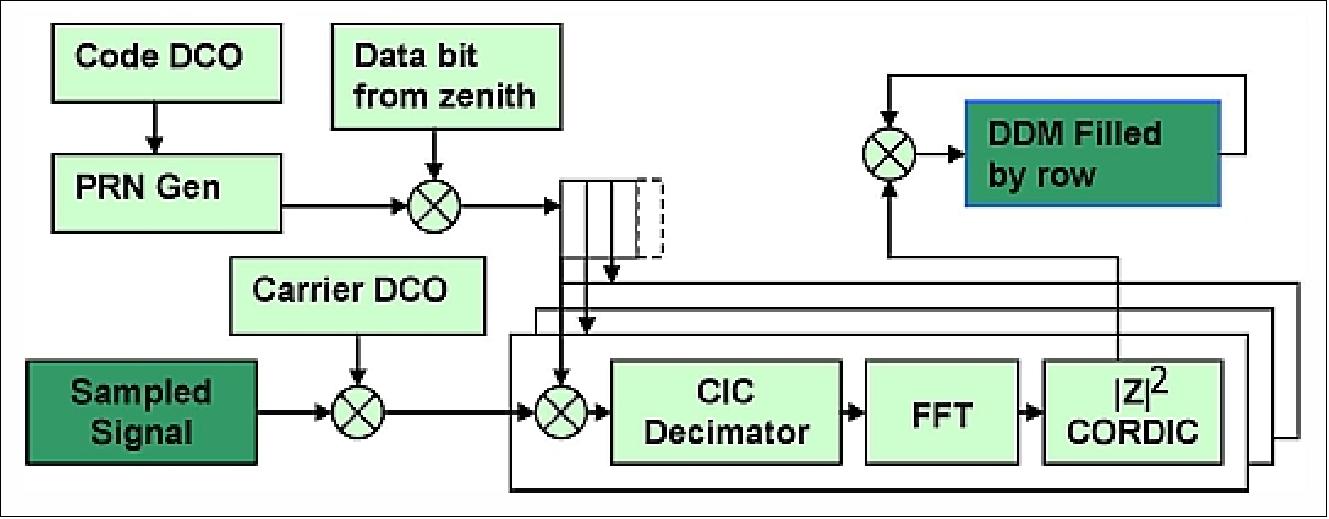
This processing is performed in real-time on board the satellite and greatly reduces the quantity of data required to be stored and for the satellite's downlink, enabling a larger number of reflections to be captured across the globe. The initial implementation has been to predict and track a single reflection from a single downward pointing antenna. It is planned, however, to implement in the Flight Model (Figure 5) the prediction and mapping of four reflections simultaneously from two nadir antennas giving an increased swath.
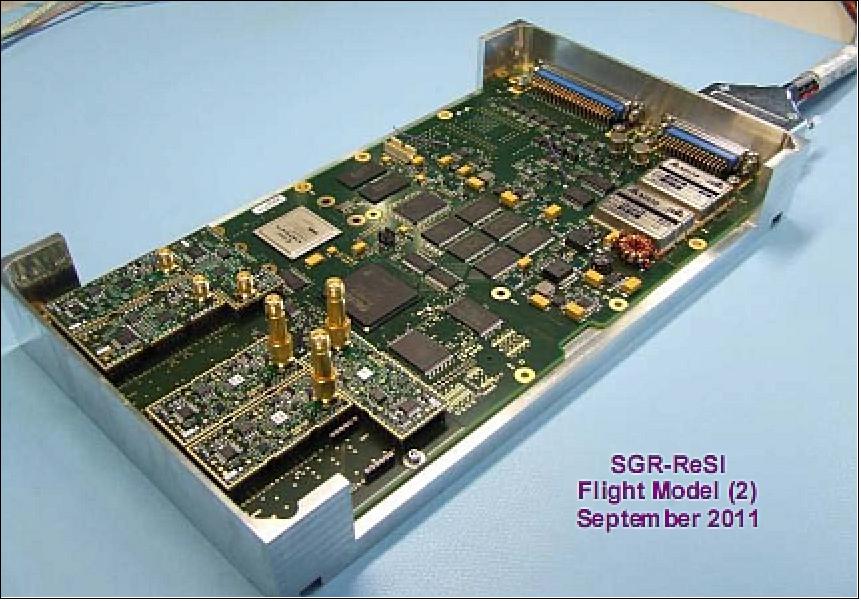
Each CYGNSS observatory will be equipped with a DDMI (Digital Doppler Mapping Instrument), based on the SGR-ReSI design (Ref. 32).
The TechDemoSat-1 of SSTL (launch planned for late 2013, with SGR-ReSI onboard) 64) will act as a valuable precursor and validation of the concept of GNSS Reflectometry for the NASA CYGNSS mission. As the CYGNSS constellation is optimized for the cyclone germination zones near the equator, it has a coverage that is limited globally by the selected inclination of 35°. Future GNSS reflectometry missions covering higher inclinations are likely to make a valuable contribution towards weather knowledge at higher latitudes.
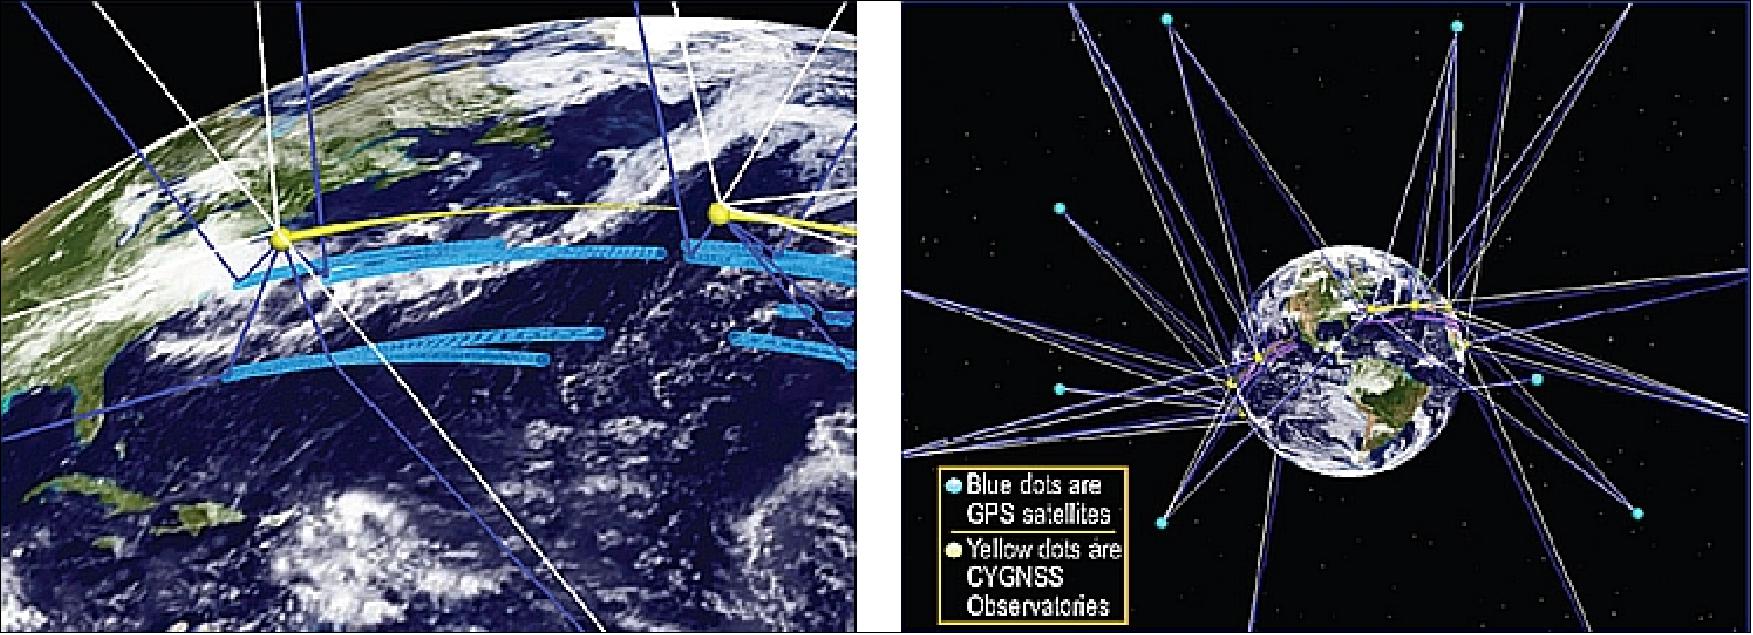
DDMI (Delay Doppler Mapping Instrument)
DDMI is the CYGNSS science instrument using the SGR-ReSI of SSTL. The SGR-ReSI is an upgraded version of the UK-DMC-1 instrument that flew in 2003. The upgrades leverage recent advances in microelectronics that include a new GPS front end monolithic microwave integrated circuit receiver and the addition of a digital signal processing back end. The new front end improves noise performance, adds internal calibration, and raises the digital sample rate. The new back end adds more on-board processing capacity in order to raise the duty cycle of science operations. The upgraded SGR-ReSI has been flight qualified aboard the UK TechDemoSat-1. 65) 66)
In total, the DDMI consists of the Delay Mapping Receiver (DMR) electronics unit, two nadir- pointing antennas for collecting reflected GNSS signals, a zenith-facing antenna to provide a coherent reference for the coded GPS signal plus space-geolocation capability, and a LNA (Low Noise Amplifier) for each DDMI antenna (Figure 47).
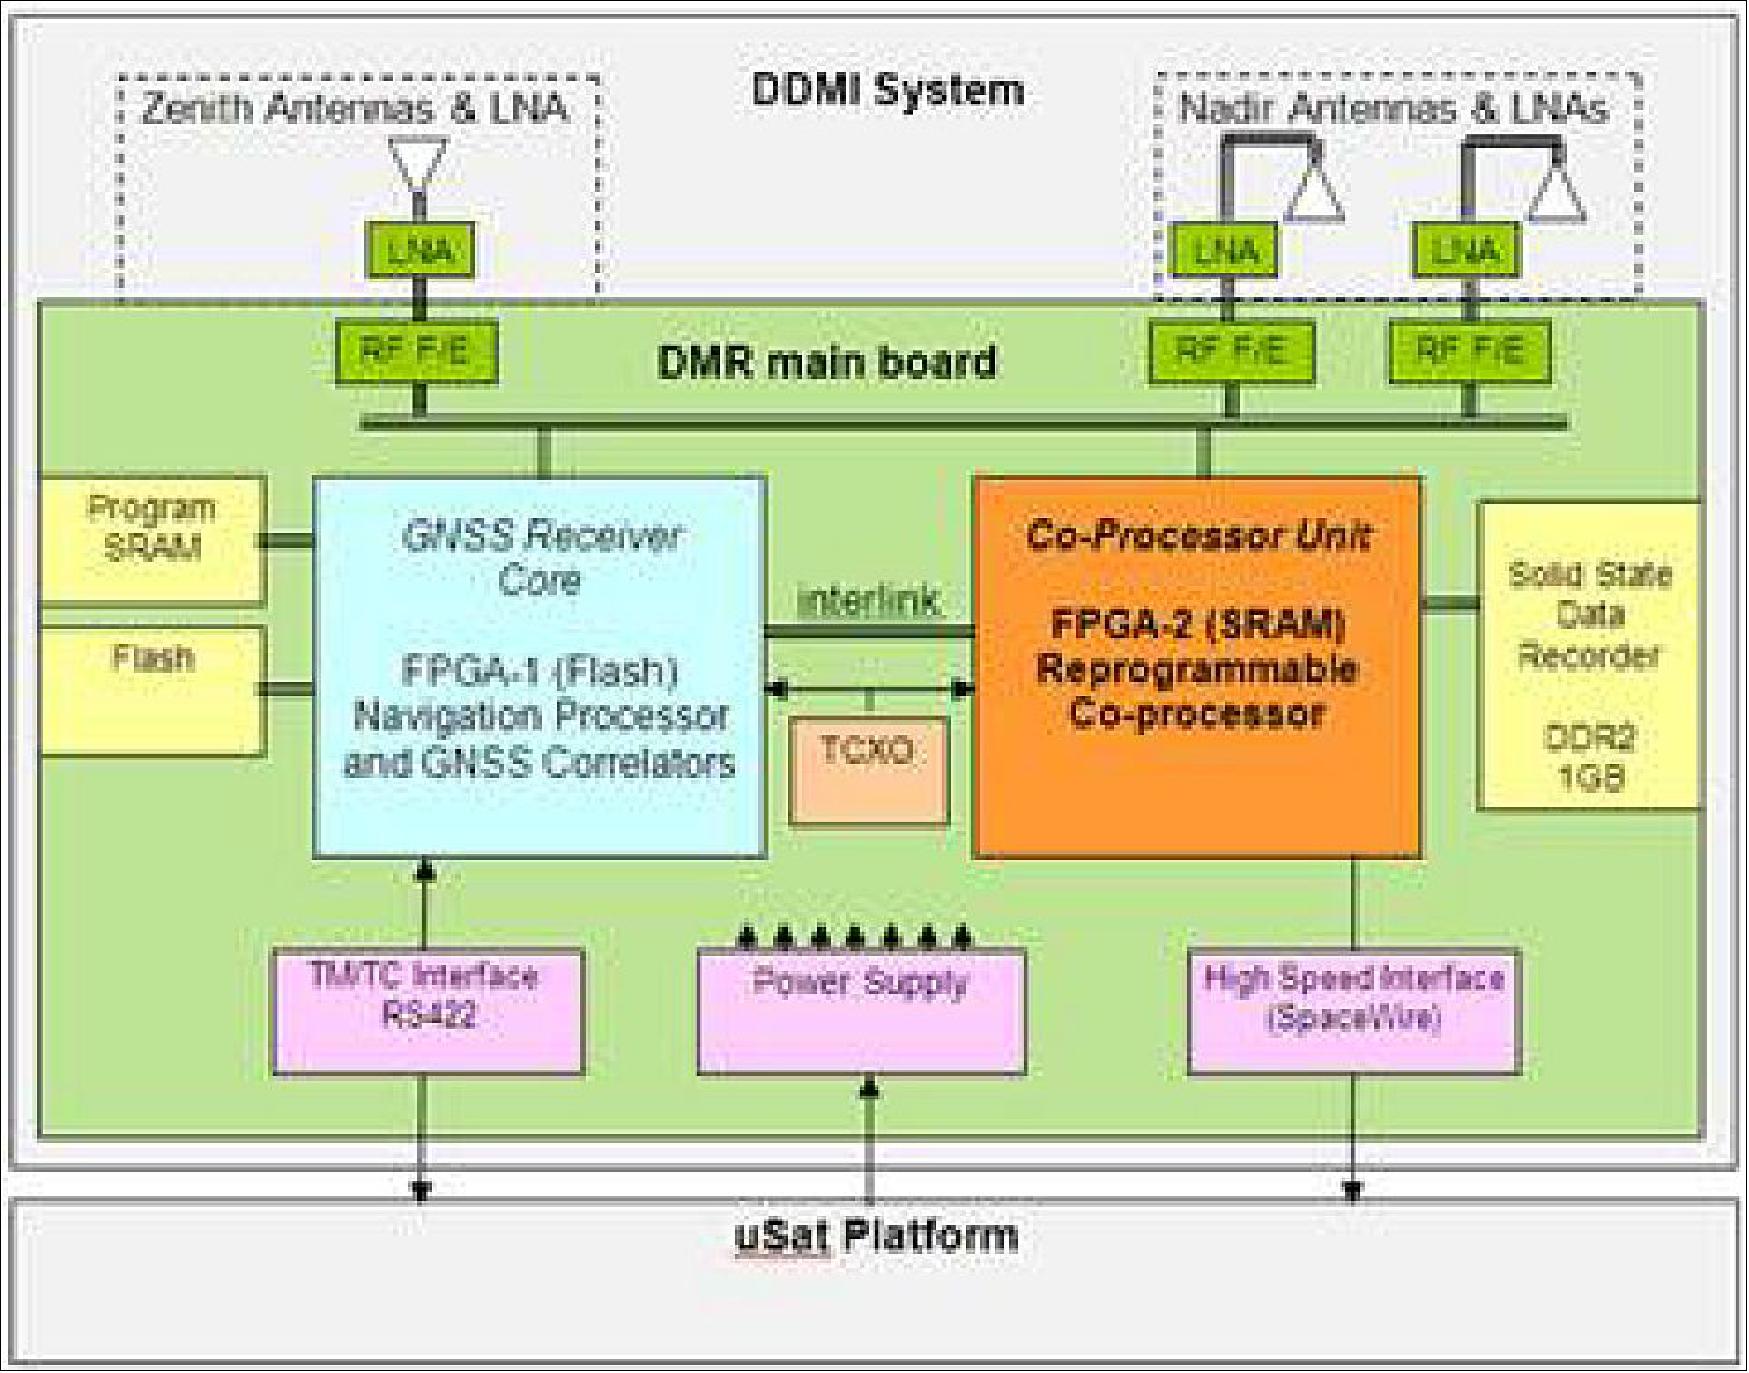
The instrument will be collecting signals directly from GPS satellites and the reflected GPS signal off the ocean surface. The DDMI measures the ocean surface wind field with unprecedented temporal resolution and spatial coverage, under all precipitating conditions, and over the full dynamic range of wind speeds experienced in a TC. It does so by combining the all-weather performance of GPS-based bistatic scatterometry with the sampling properties of a dense satellite constellation.
The GPS receiver performs standard GPS navigation and timing functions, and provides digital signal processing. The Doppler effect processed and mapped aboard each satellite will support up to 4 simultaneous measurements per satellite per second. The maps generated from the GPS signals scattered from the ocean surface are called DDMs (Delay Doppler Maps). - The method of measuring wind speed is not affected by precipitation states, support a continual collection of data through the entire area of interest. The number of satellites and the orbit chosen will result in a full map of the area between the Tropic of Cancer and the Tropic of Capricorn every day (24 hour period).
The DDMI instrumentation consists of the Surrey DMR (Delay Mapping Receiver), plus a zenith and two nadir antennas, also provided by SST-US LLC (Surrey Satellite Technology US LLC), Englewood, CO.
The DDMI will generate DDMs continuously at a low data rate, which will provide a source for ocean roughness measurements across the ocean. In special situations, such as when passing over an active tropical cyclone, the instrument can be operated in Raw Data Mode, where 60 seconds of raw sampled data is accumulated. This allows researchers to fully analyze and re-analyze the acquired data using different processing schemes to ensure that the nominal DDM mode of operation is not losing important geophysical data.
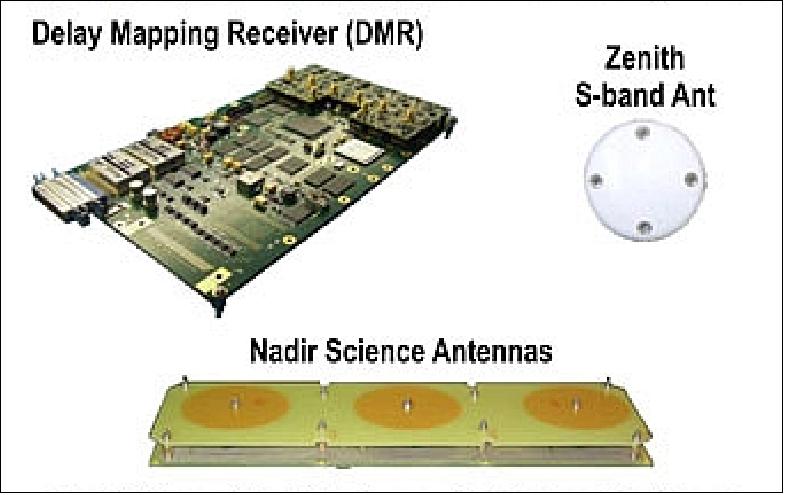
An open-loop tracking algorithm allows each DDM to be processed by predicting the position of the specular reflection point from the known positions of the receiver (i.e. the CYGNSS Observatory) and GPS transmitter (i.e. the GPS spacecraft). There are typically many specular reflections from the surface available at any given time due to the large number of GPS transmitting satellites. Available DDMI resources allow generation of up to four simultaneous DDMs each second, selection of the specific reflection being based on location within the highest sensitivity region of the DDMI nadir antenna pattern. Individual DDM integration times last one second and wind speeds are derived from measurements over a 25 x 25 km2 region centered 234 on the specular point. This results in a total of 32 wind measurements per second by the full constellation. CYGNSS spatial sampling consists of 32 simultaneous single pixel “swaths” that are 25 km wide and, typically, 100s of km long, as the specular points move across the surface due to orbital motion by CYGNSS and the GPS satellites.
The baseline wind speed retrieval algorithm planned for CYGNSS is an extension of one previously developed for the UK-DMC spaceborne mission. 67) The algorithm uses an empirically-derived geophysical model function to estimate the 10 m referenced wind speed from the measured DDM within a 25 x 25 km2 region centered on the specular reflection point. The UK-DMC algorithm has been extended to higher wind speeds by applying a detailed end-to-end simulator of the CYGNSS measurements to a realistic Nature Run simulation of the full life cycle of a Category 4 hurricane. The end-to-end simulator models the complete bistatic radar measurement process, including electromagnetic propagation down from the GPS satellite to the ocean surface, rough surface scattering by the ocean, propagation back up to the CYGNSS satellite, and the engineering design of the CYGNSS GNSS-R receiver. A large population of simulated DDMs, covering a wide dynamic range of wind speeds, is generated and used to extend the geophysical model function from the lower wind speed regime experienced by UK-DMC to the much higher winds of interest to CYGNSS. The RMS wind speed retrieval error is expected to meet or exceed the mission requirement of 2 m/s or 10% of the wind speed, whichever is greater
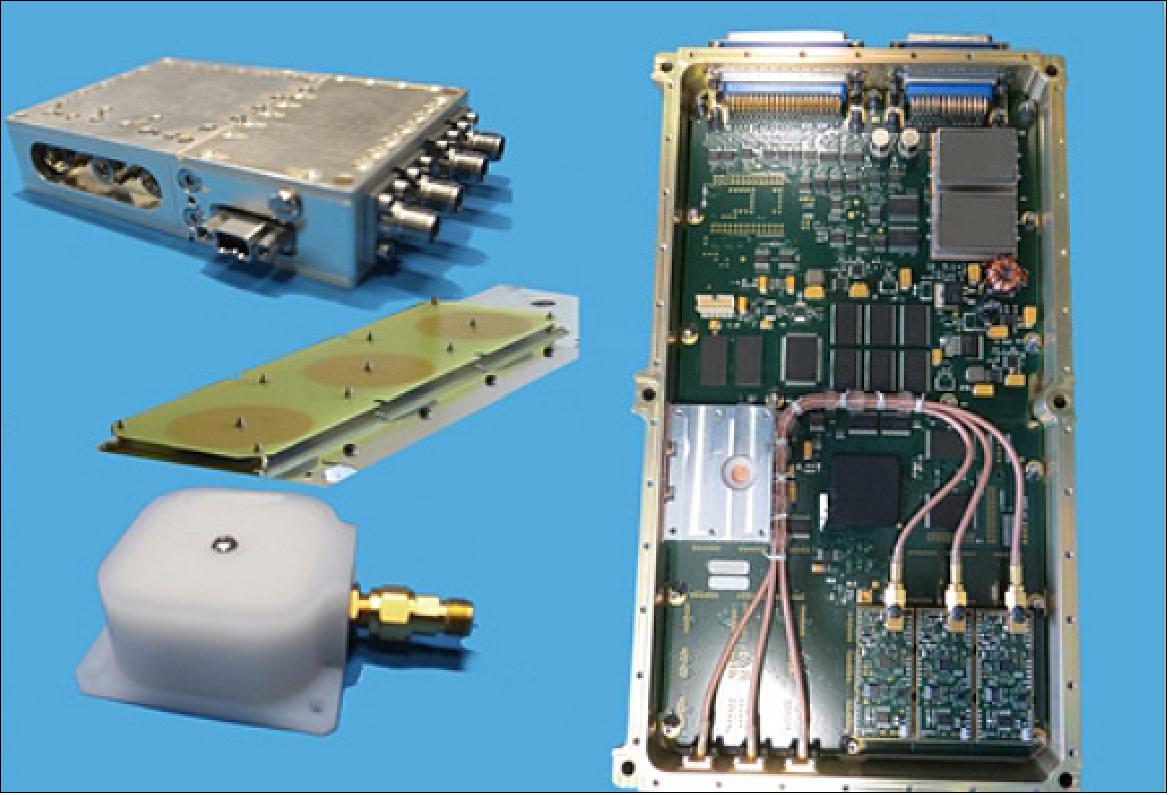
Ground Segment
The CYGNSS ground system consists of the following elements (Ref. 32): 69)
1) MOC (Mission Operations Center), located at the SwRI (Southwest Research Institute) Planetary Science Directorate in Boulder, CO
2) SOC (Science Operations Center), located at the University of Michigan’s Space Physics Research Laboratory in Ann Arbor, MI
3) GDN (Ground Data Network), operated by USN (Universal Space Network), consisting of existing Prioranet ground stations in South Point, HI, in Santiago, Chile, and in Western Australia, some 400 km south of Perth, and at the MOC facility.
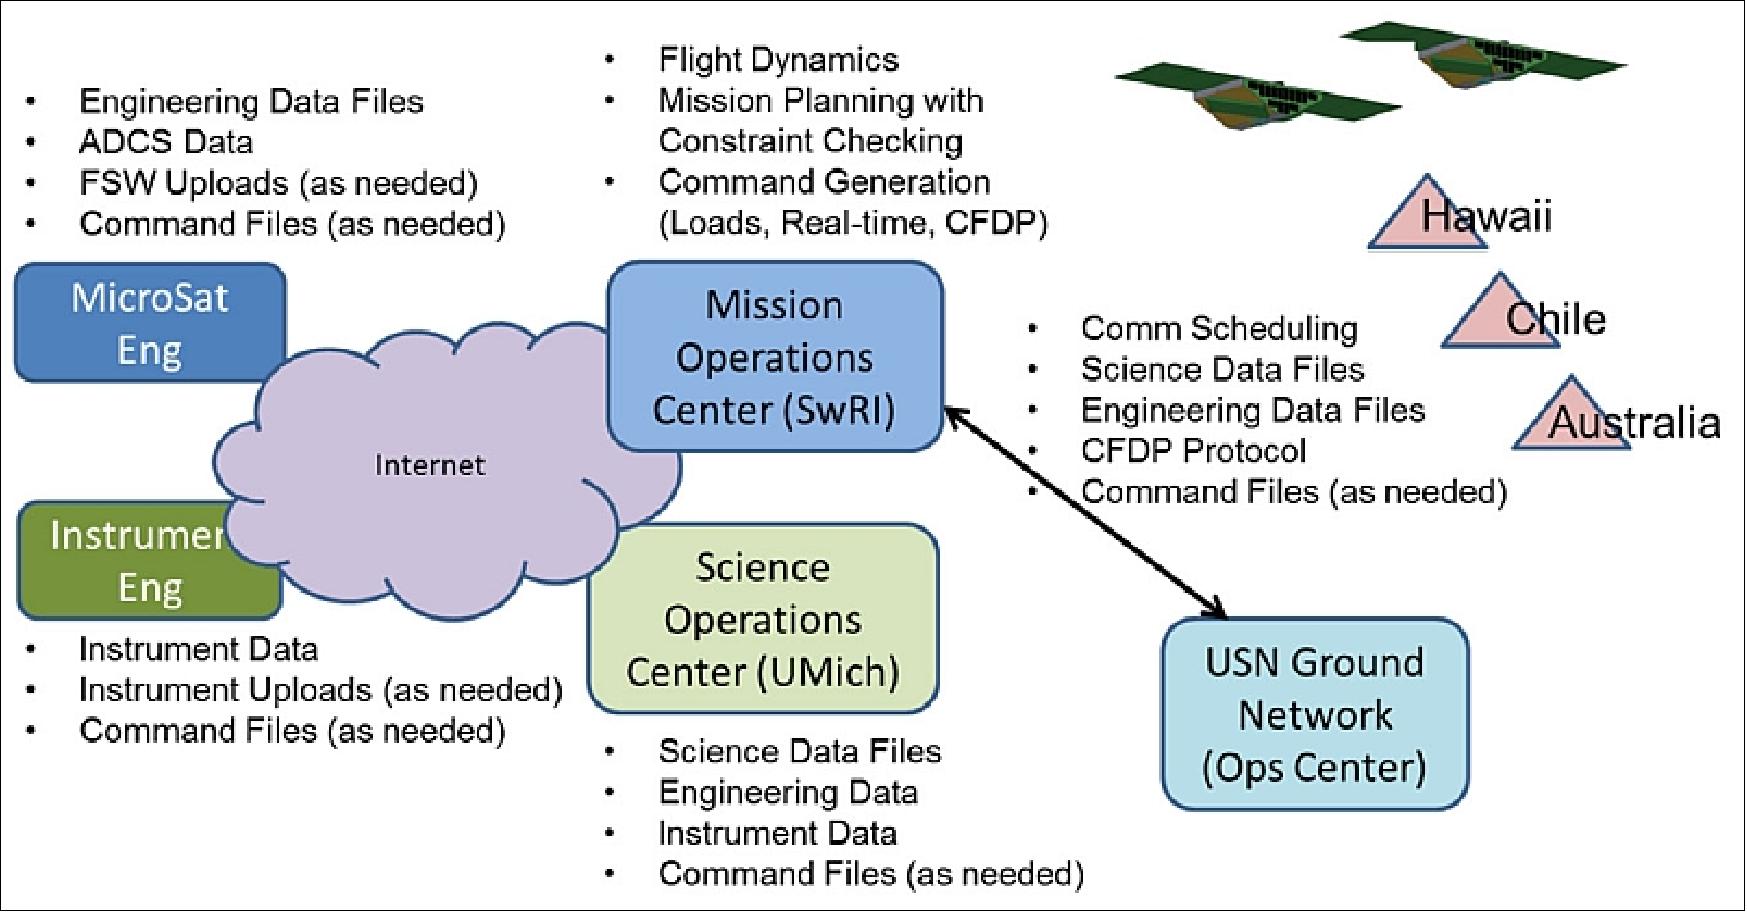
• MOC: During the mission, the CYGNSS MOC is responsible for mission planning, flight dynamics, and command and control tasks for each of the observatories in the constellation. These primary MOC tasks include:
- coordinating activity requests
- scheduling ground network passes
- maintaining the CCSDS/FDP (Consultative Committee for Space Data Systems/File Delivery Protocol) ground processing engine
- collecting and distributing engineering and science data
- tracking and adjusting the orbit location of each observatory in the constellation
- trending microsatellite data
- creating real-time command procedures or command loads required to perform maintenance and calibration activities
- maintaining configuration of onboard and ground parameters for each observatory.
The MOC architecture and top level data flow is illustrated in Figure 51.
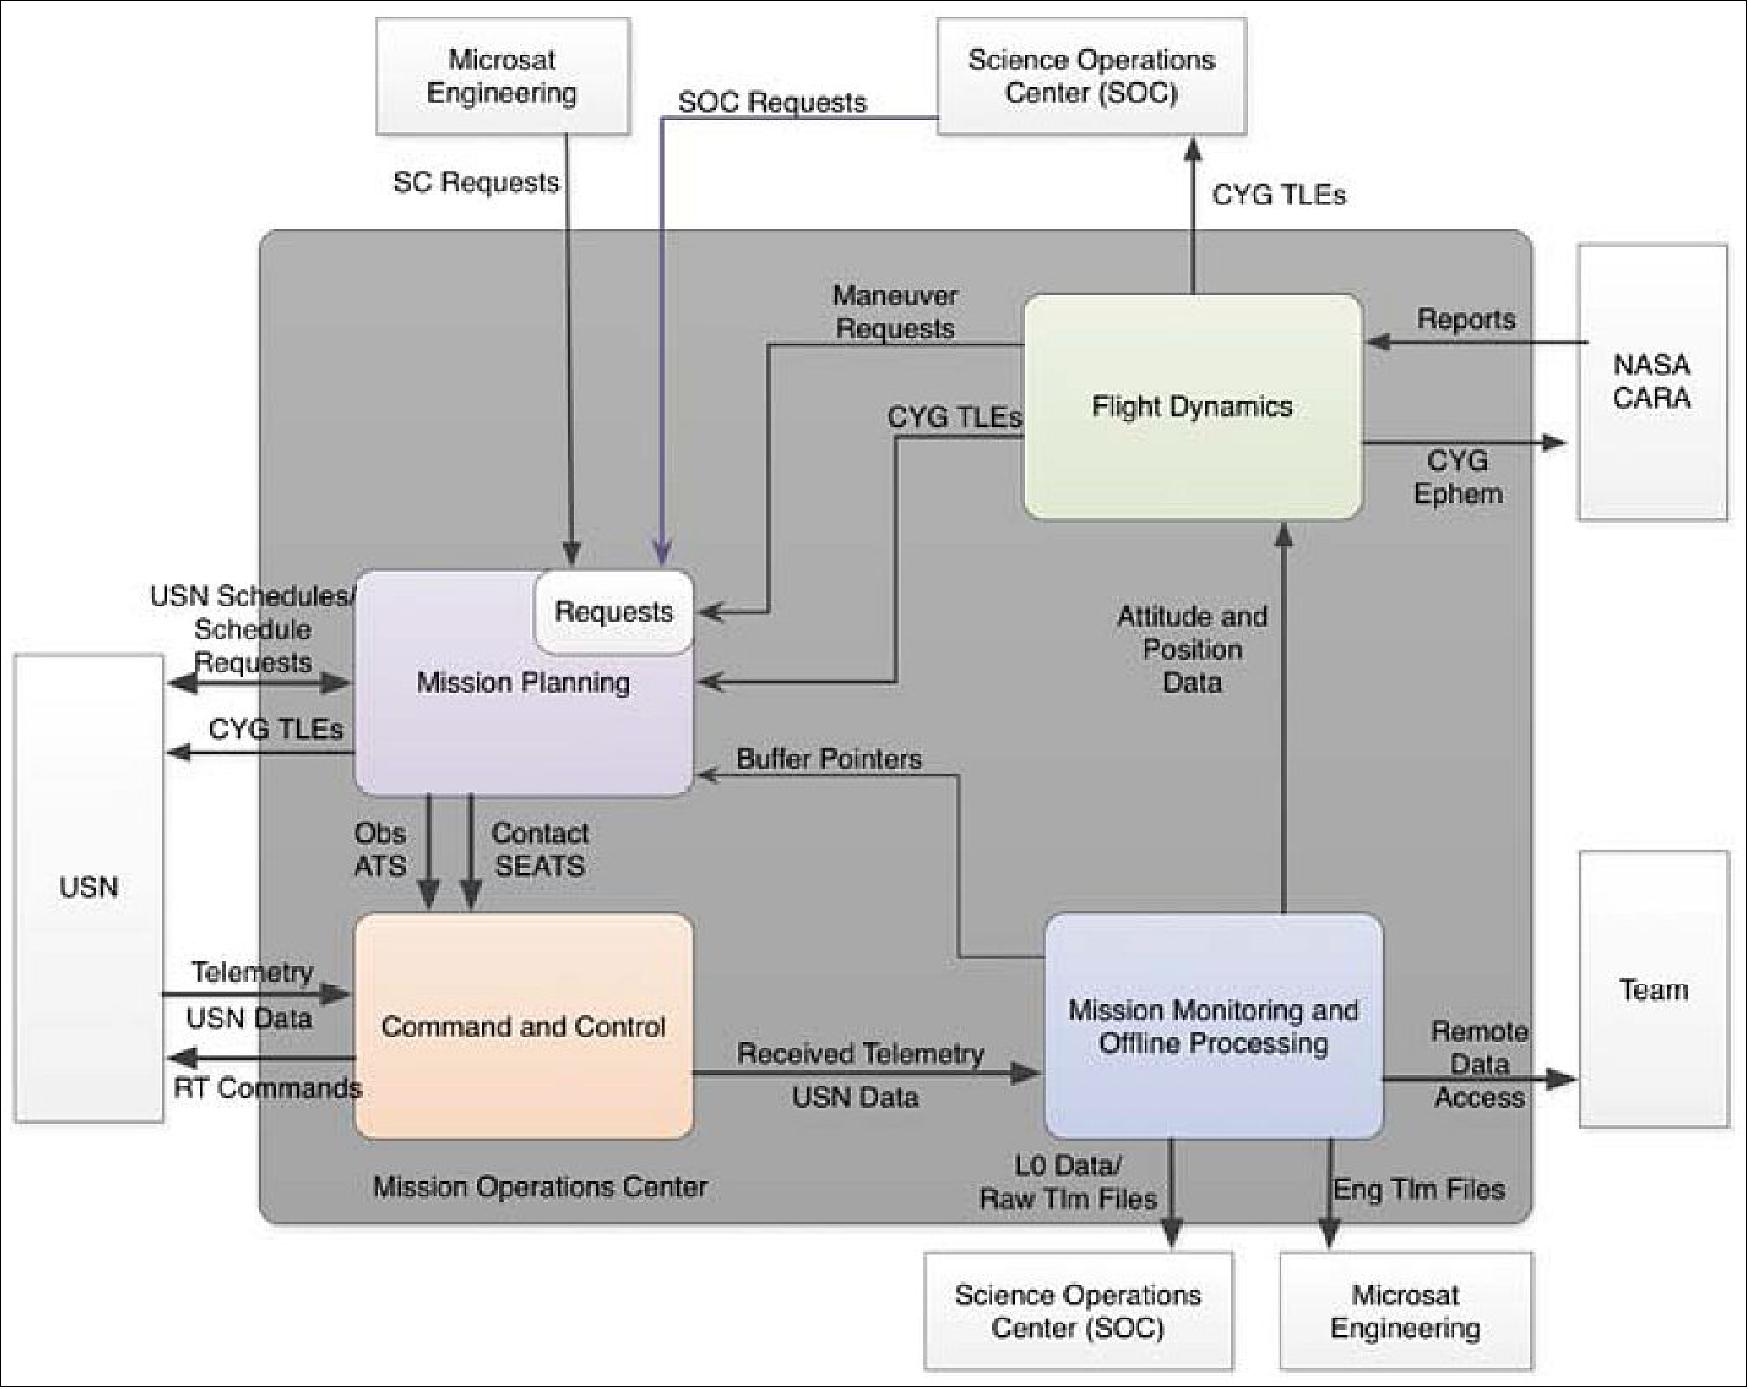
• SOC: The CYGNSS SOC will be responsible for the following items related to calibration/validation activities, routine science data acquisition and special requests, and data processing and storage:
- supporting DDMI testing and validation both prelaunch and on-orbit
- providing science operations planning tools
- generating instrument command requests for the MOC
- processing Levels 0 through 3 science data
- archiving Level 0-3 data products, DDMI commands, code, algorithms, and ancillary data at a NASA DAAC (Distributed Active Archive Center).
During the science phase of the mission, SOC requests for instrument operations will occur infrequently and will typically be sent when the science team wants to collect enhanced science data sampling of special interest events.
The calibration and validation objectives are to:
• verify and improve the performance of the sensor and science algorithms;
• validate the accuracy of the science data products; and
• validate the utility of CYGNSS wind products in the marine forecasting and warning environment.
For satellite ocean wind remote sensing, validation typically involves comparing measurements with numerical weather model wind fields. This allows a relatively large number of collocated comparisons to be obtained in a short amount of time. Since model winds are generally not reliable enough to properly validate very-low or very-high wind speeds, other comparison data are required. Validated wind speed data from satellite sensors, such as scatterometers, can be compared more directly and provide higher wind speed validation. Validation at the highest wind speeds in tropical cyclones will require utilizing data collected from aircraft-based measurements, such as GPS dropsondes, or other remote sensing equipment that might be onboard, such as the Stepped Frequency Microwave Radiometer or the High Altitude Imaging Wind and Rain Airborne Profiler that fly onboard NOAA (National Oceanic and Atmospheric Administration) Hurricane Hunter aircraft.
Another facet of the validation effort will include training forecasters at the NOAA/NHC ( National Hurricane Center) in Miami, FL, to use CYGNSS-derived wind retrievals. At the end of each hurricane season, the retrievals will be provided to the forecasters, so they can evaluate their effectiveness during postseason storm analysis. The objectives of this effort will be to evaluate the value of these data in the operational environment and to get validation feedback from forecasters. Experience has shown that viewing the data from a forecaster’s perspective can reveal performance issues that can remain hidden in global statistics.
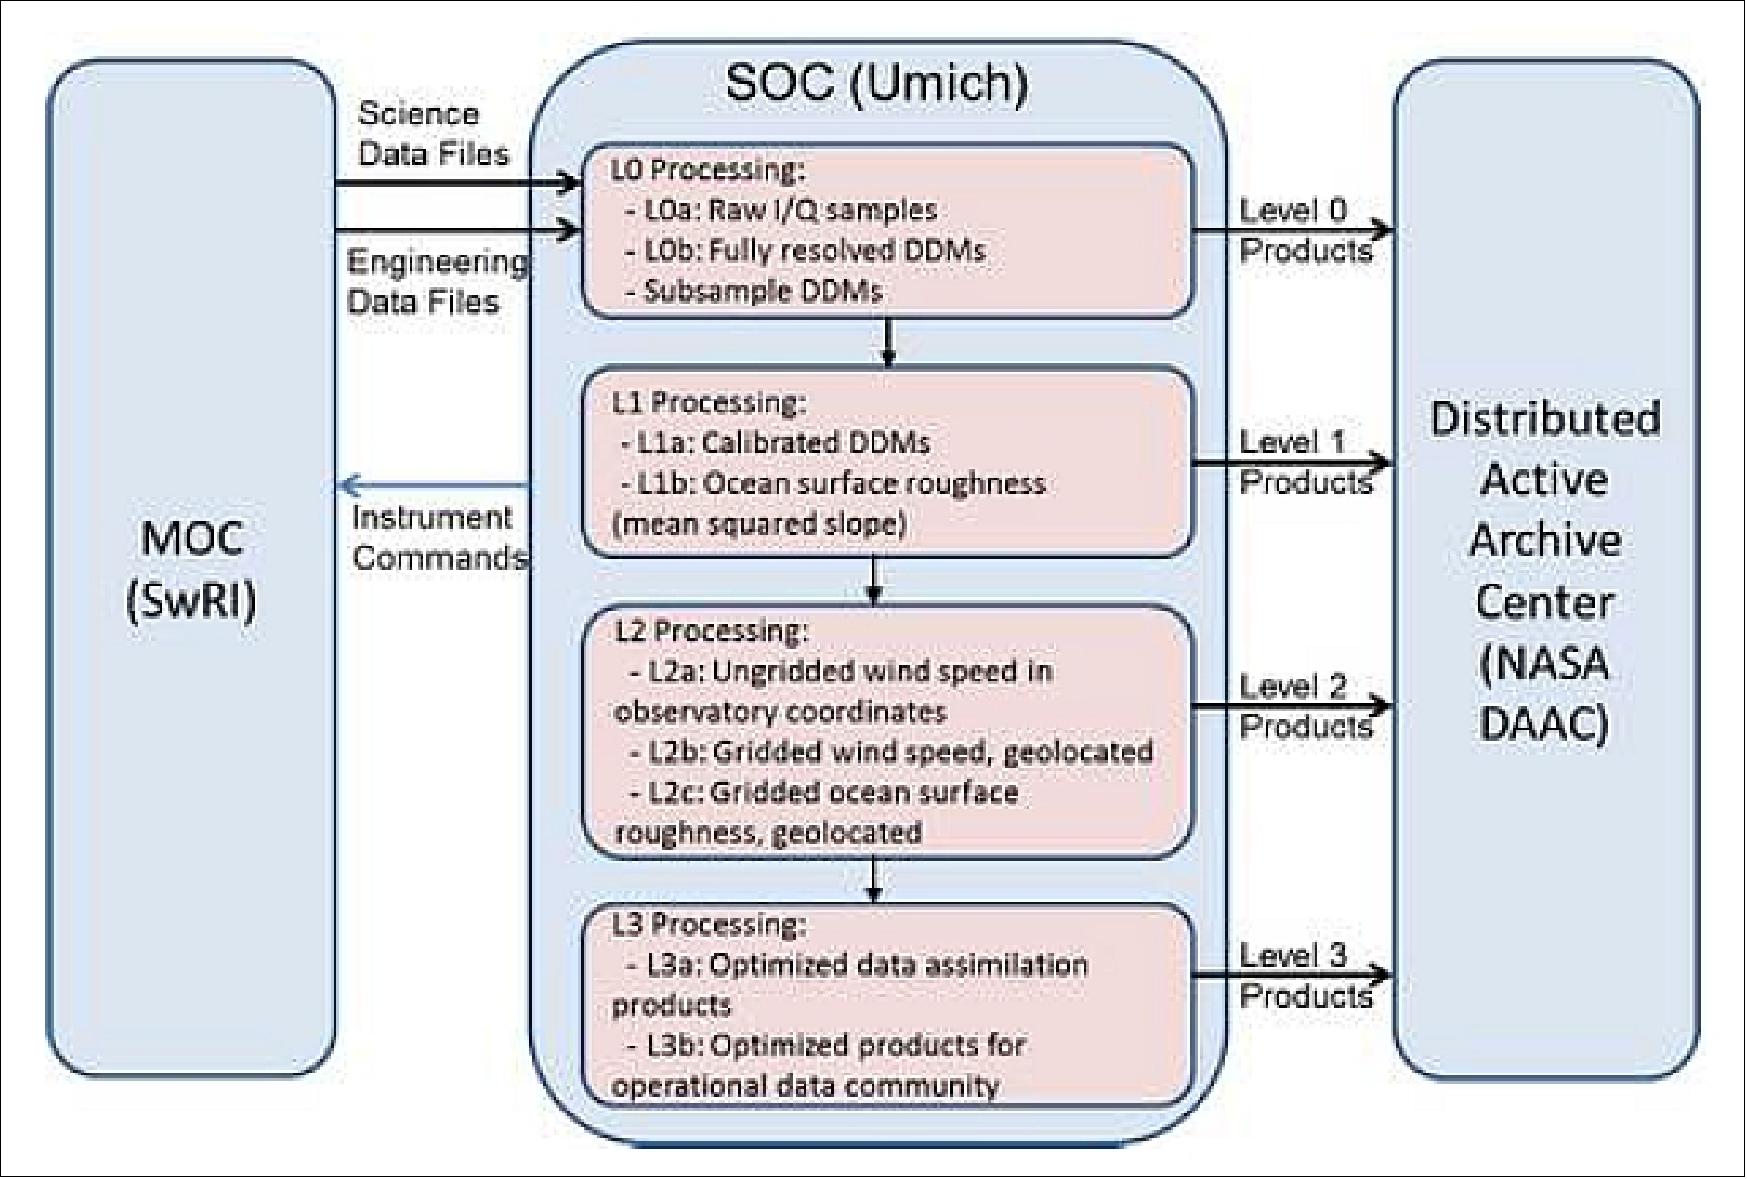
• GDN: CYGNSS selected USN to handle ground communications because of their extensive previous experience with missions similar to CYGNSS. Collocation of a backup CYGNSS MOC server at the USN/NMC (Universal Space Network/Network Management Center) can also be supported.
Note: Universal Space Network, Inc. (USN) is a U.S. based independent subsidiary of SSC with US government approval and oversight. USN is a leader in space operations and ground network services (GNS).USN provides unparalleled coverage through PrioraNet, a seamless network of worldwide satellite tracking and communications assets. These assets include both those owned by USN and those of our collaborative partners. Founded by the aerospace pioneer Charles “Pete” Conrad, Jr., USN reflects his leadership, innovative spirit and dedication to excellence. From the network management centers in Horsham, PA, and Newport Beach, CA, to the global network of ground stations. 70)
Each of the observatories in the CYGNSS constellation will be visible to the three ground stations within the USN for periods that average between 470 and 500 seconds of visibility per pass. Each observatory will pass over each of the three ground stations 6-7 times each day, thus providing a large pool of scheduling opportunities for communications passes. MOC personnel will schedule passes as necessary to support commissioning and operational activities. High-priority passes will be scheduled to support the solar array deployment for each observatory.
For all subsequent stages, the MOC schedules nominal passes for the USN stations for each observatory in the constellation per the USN scheduling process. Each observatory can accommodate gaps in contacts with storage capacity for greater than 10 days’ worth of data with no interruption of science activities.
Data flows between ground segment elements to support routine operations are straight forward. Planning flows consist of emails between the CYGNSS MOC and the USN NMC (Network Management Center) to select and confirm contacts for all CYGNSS Observatories and to communicate the CYGNSS Observatory location Two Line Elements (TLEs) for upcoming contacts. Email communication is also used between the NASA CARA team and MOC as necessary to provide warning of any impending potential conjunctions with a CYGNSS Observatory, transfer of ephemeris data from the MOC to the CARA team for screening.
During a ground contact with an Observatory, the data flows from USN to the MOC consist of engineering telemetry extracted from Virtual Channel (VC) 0 and VC1. At the MOC, this data is limit checked, routed to a real-time archive, and pushed to a location where authorized remote users can access the real-time engineering data for analysis. Due to limited bandwidth availability between the USN remote antenna sites and the USN NMC, it is not feasible to route stored science and engineering telemetry data to the MOC in real-time during the pass. All CYGNSS telemetry data received at the remote antenna site is stored at the antenna site and transferred to the CYGNSS MOC post pass. Once the full data for each contact is received at the MOC, it is processed and distributed to the SOC.
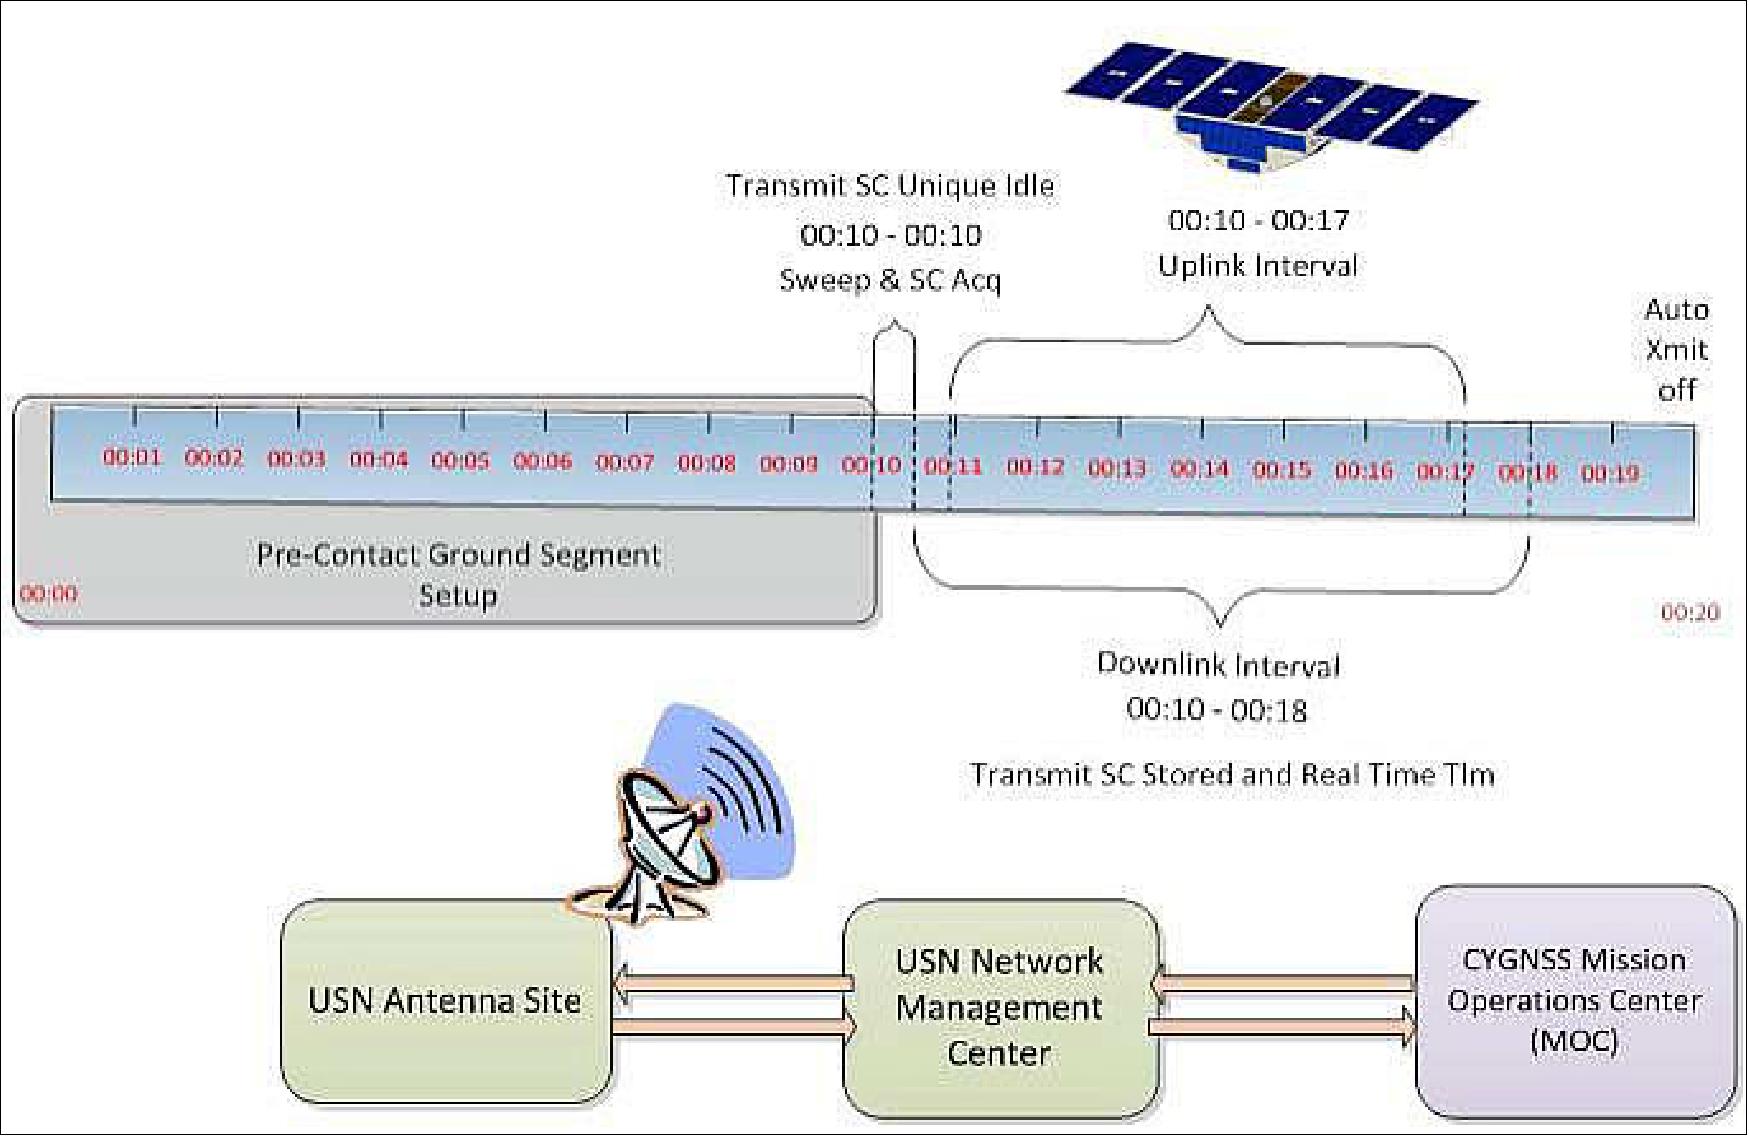
Data Products
The data returned from CYGNSS are expected to expand our knowledge of the rapidly changing environment in the core of a developing tropical cyclone. The SOC is responsible for data product development and dissemination. After science commissioning is complete and the mission enters its nominal science operations stage, the L2 data will be made available for public release.
The CYGNSS science team members will use the fully calibrated L2 data for their own research and make it available to the external user science community and eventually to operational users. Calibration/validation assessment of L2 data quality continues for the life of the mission using an updated version of the same wind field intercomparison database used during science commissioning. Twice a year, nominally at the beginning and end of the Atlantic hurricane season, engineering performance will be verified by a brief (approximately two-week) repeat of the instrument calibration activities performed during engineering commissioning. 71)
The primary goals of CYGNSS are to measure ocean surface wind speeds in all weather conditions — including those inside the eyewall—and measuring wind speed with sufficient frequency to resolve genesis and rapid intensification in the inner core of a tropical cyclone. In addition to success with these two primary objectives, there is likely to be a secondary benefit with direct societal relevance: The CYGNSS team will produce and provide ocean surface wind speed data products to the operational hurricane forecast community and help them assess the value of these products for use in their retrospective studies of potential new data sources. In time, this information will be incorporated into models used to predict the evolution of hurricanes.
While improved hurricane forecasting is not the CYGNSS mission’s primary objective, it is hoped that hurricane prediction—in particular, hurricane intensity forecasts— will improve as a result of the data that the CYGNSS mission returns.
The data will be shared with NOAA and used to help emergency managers make decisions regarding extreme weather planning.
Level 1, Level 2 and Level 3 data processing
Level 1 DDM (Delay Doppler Map) Calibration:
• The raw data measured by the CYGNSS DDMI are Level 0 DDMs proportional to total system power (received signal + instrument noise)
- Convert L0 DDM of raw counts to L1a DDM of receiver power radar scattering cross section
- Convert L1a DDM to L1b DDM of bistatic
Level 2 Wind Speed Retrieval:
• Convert L1b DDM to spatially averaged windspeed over a 25 km x 25 km region centered on the specular point
• Assign an uncertainty to the retrieved windspeed depending on the location of the specular point in the nadir science antenna beam
Level 2 Mean Squared Slope Retrieval:
• Convert L1b DDM to spatially averaged mean squared slope of the ocean surface over a 25 km x 25 km region centered on the specular point
Level 3 Data Processing:
• Gridded Wind Speeds
- Level 3 L2 retrieved windspeed is produced in the spacecraft time & space coordinates
- Level3a re-grids L2 winds to a uniform 0.25º latitude/longitude grid with 3 hr time increment
- L3b re-grids L2 winds for a data assimilation TC forecast model with maximum information content
Data product | Description | First data delivery after IOC | Maximum data latency |
Level 0 | Raw data of total system power (received signal + instrument noise) | 2 months | 6 days |
Level 1a | Calibration DDMs (Delay Doppler Maps) of receiver power | 2 months | 6 days |
Level 1b | Calibrated DDM of bistatic radar cross section | 2 months | 6 days |
Level 2a | Spatially averaged windspeed(plus uncertainty) over a 25 km x 25 km region centered at the specular point, geolocated in spacecraft time & space coordinates | 2 months | 6 days |
Level 2b | Spatially average mean square slopes (plus uncertainty) over a 25 km x 25 km region centered at the specular point, geolocated, in spacecraft time & space coordinates | 2 months | 6 days |
Level 3a | Wind speed, gridded in space and time (1/4º latitude and longitude, 3 hours) | 3 months | 6 days |
Level 3b | Wind speed, gridded and optimized for observing system experiment data assimilation (optimized spatial and temporal resolution) | 3 months | 6 days |
In summary, CYGNSS will measure surface winds in the inner core of tropical cyclones, including regions beneath the eyewall and intense inner rainbands that could not previously be measured from space. These measurements will help scientists obtain a better understanding of what causes the intensity variations in tropical cyclones, such as those observed with Hurricane Katrina, as described earlier. The surface wind data collected by the CYGNSS constellation are expected to lead to:
• improved spatial and temporal resolution of the surface wind field within the precipitating core of tropical cyclones;
• improved understanding of the momentum and energy fluxes at the air-sea interface within the core of tropical cyclones and the role of these fluxes in the maintenance and intensification of these storms; and
• improved forecasting capabilities for tropical cyclone intensification.
Combined, these accomplishments will allow scientists and hurricane forecasters to provide improved advanced warning of tropical cyclone intensification, movement, and storm surge location and magnitude, thus aiding in the protection of human life and coastal community preparedness (Ref. 14).
CYGNSS Simulator
To assess the performance and error characteristics of CYGNSS wind measurements as well as to test different sensor configurations prior to launch, a state of the art end-to-end simulator (E2ES) was developed by the CYGNSS project. Measurements are simulated using realistic, high-resolution wind fields over selected Atlantic and Pacific tropical cyclones of varying strength and structure that occurred during the 2010-2011hurricane seasons. As shown in Table 7, a total of 43 storms were run through the E2ES, which included everything from tropical depression through category 4 strength hurricanes from the Atlantic and Eastern Pacific basins. 72)
Location | TD | TS | H1 | H2 | H3 | H4 |
Atlantic | 1 | 14 | 3 | 0 | 3 | 6 |
Pacific | 3 | 3 | 4 | 1 | 1 | 4 |
Total | 4 | 17 | 7 | 1 | 4 | 10 |
From these measurements, GMFs (Geophysical Model Functions) were developed that relate the CYGNSS measurements to the ocean surface wind speed. The GMFs were then incorporated into a wind speed retrieval algorithm and CYGNSS ocean wind speeds were retrieved for all the tropical storms during 2010-2011. The primary objectives of the subsequent calibration and validation effort are to characterize the forward model, evaluate the performance of each sensor, evaluate the retrieval algorithm(s) and evaluate the retrieved wind speeds. The first step in this process is collocating various “truth” data with the CYGNSS data. These “truth” data include numerical model output parameters, GPS dropsondes, other satellite data (ASCAT, OSCAT, WindSat, AMSR2, etc.) and aircraft-based measurements.
The next steps involve statistical analyses of the collocation database. The GMF is characterized and any unexpected artifacts or trends are analyzed. The collocation database is also used to evaluate measurement performance relative to the instrument characteristics and measurement geometry for each sensor. The wind speed retrieval algorithms are analyzed and their strengths and weaknesses are defined. Quality control flags are developed based upon these analyses to be included with the final product files provided to the end users. Another facet of the wind speed retrieval validation will be in the context of the operational forecasting environment and evaluation of the CYGNSS wind speed product performance by marine forecasters. This type of validation has proven to be invaluable for other satellite data in revealing performance characteristics that aren’t readily apparent from standard statistical analysis.
Utilizing numerical weather model winds allows for a large number of collocations to be obtained in a relatively short amount of time. Statistically, this permits us to characterize the wind speed performance over a certain range of wind speeds with some confidence. Typically this wind speed range is from about 3 m/s to approximately 20 m/s. While the hurricane models can provide wind speeds up to category 5 strength and even the global models do provide wind speeds higher than 20 m/s, the number of collocations isn’t statistically significant enough to make any robust conclusions.
For validation and performance assessment at the higher winds speeds, other comparison data is required. Validated wind speed data from other satellite sensors, such as scatterometers, can be compared more directly and provide some higher wind speed validation truth. Scatterometer wind retrievals have proven to be accurate into the hurricane intensities when the wind fields are broad in areal extent compared to the scatterometer footprint. This is typically seen in intense extratropical cyclones, but is also encountered in some tropical cyclones. During the 2010-2011 period of the simulated CYGNSS measurements, both the OSCAT and ASCAT scatterometers were available. A temporal and spatial matchup window criteria of 3 hours and 25 km were utilized. Validation at the highest wind speeds in hurricanes will require utilizing data that can accurately sample those winds at the spatial scales they occur at. Currently this means using wind speed data collected from aircraft based measurements such as GPS dropsondes or other remote sensing equipment that might be on board such as the SFMR (Stepped Frequency Microwave Radiometer) or the IWARP (Imagining Wind and Rain Airborne Profiler). The maps of Figure54 show the CYGNSS retrievals and OSCAT, ASCAT and GPS dropsonde data from the Atlantic basin during 2010 hurricane season.
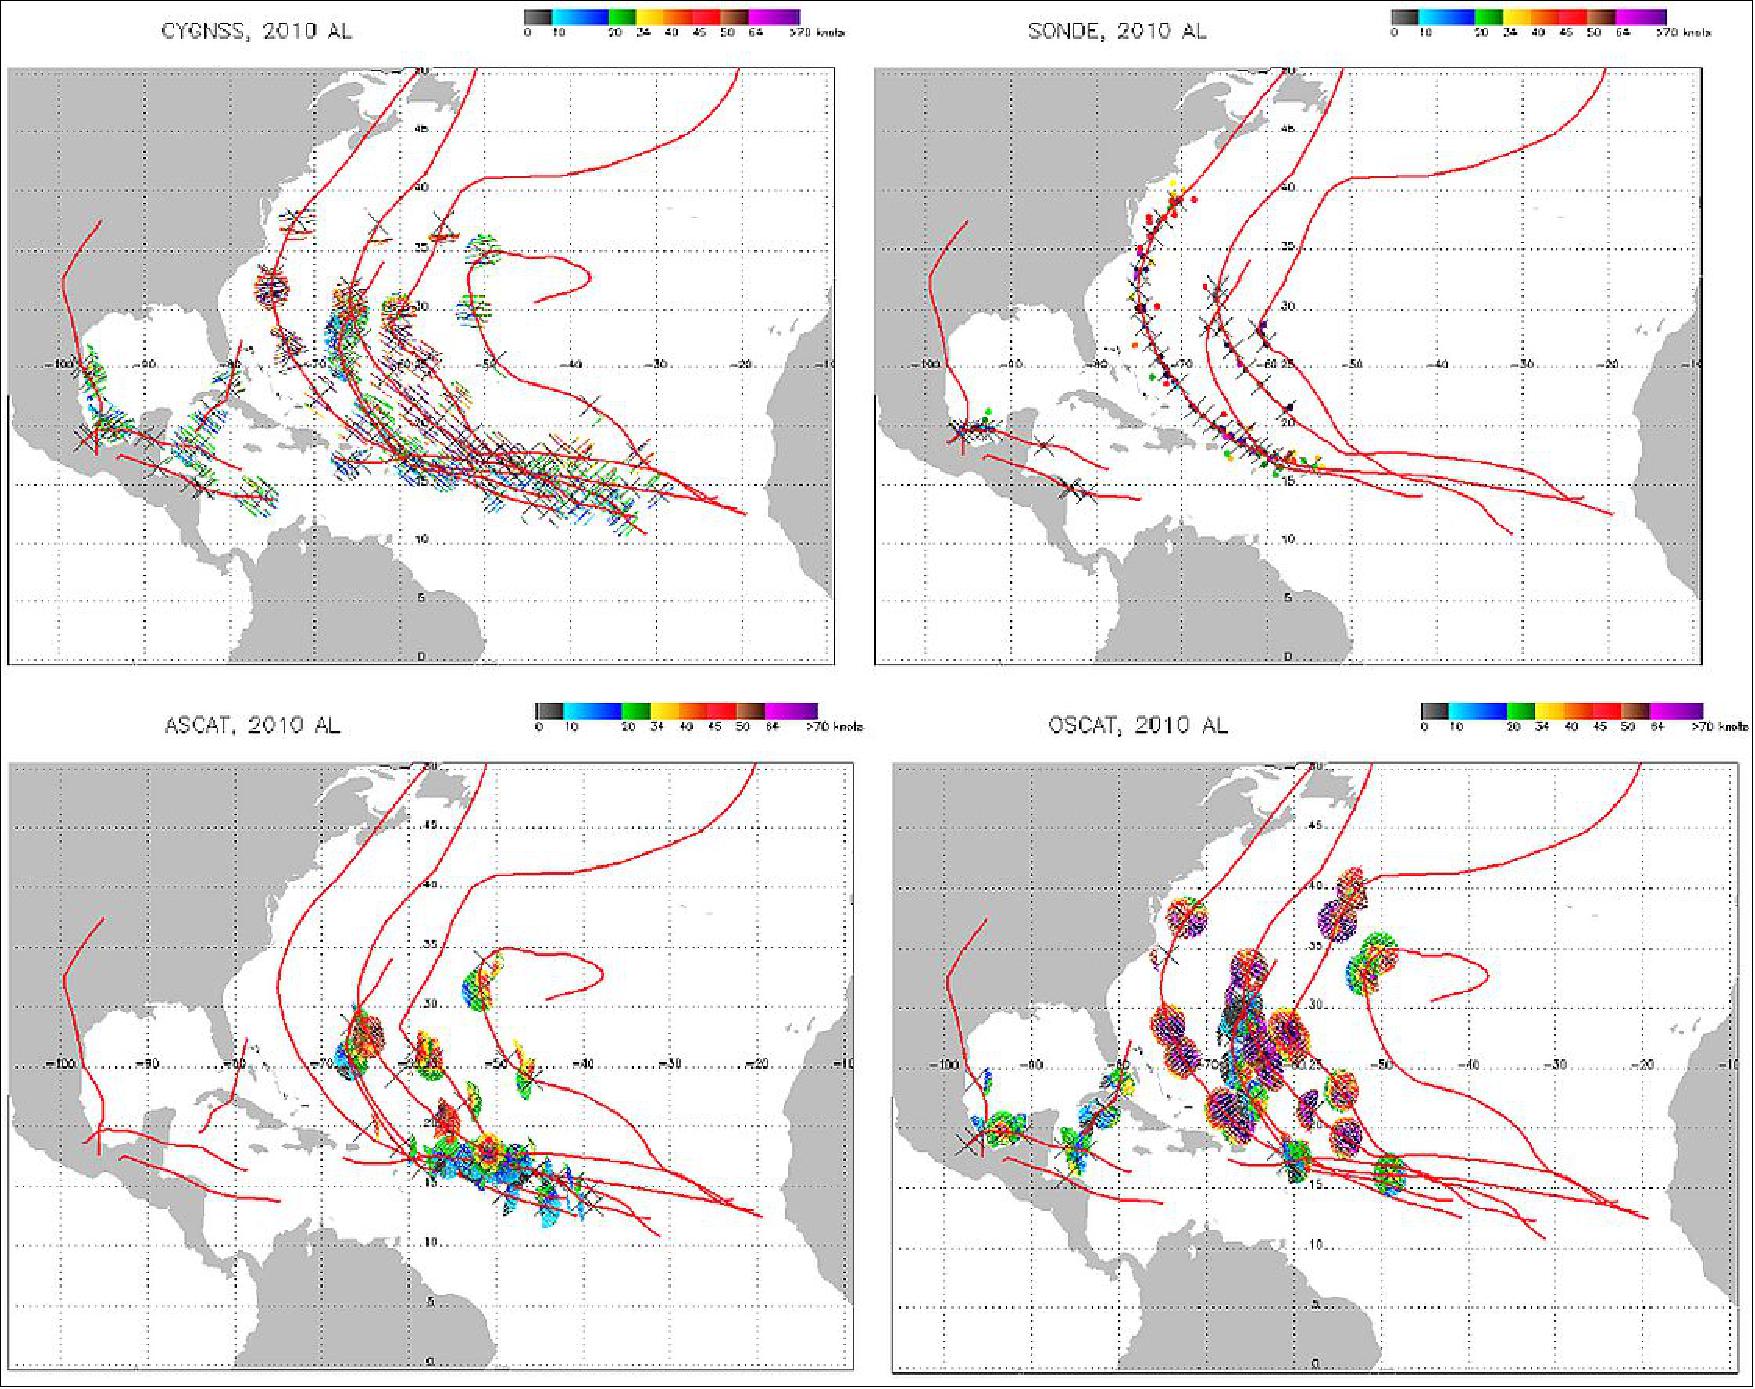
With spatial resolution and measurement uncertainty being tunable parameters, additional analysis will be required to fully understand and characterize the CYGNSS retrievals within the tropical cyclone environment. Within tropical cyclones there are typically strong wind gradients occurring over relatively small spatial scales. Thus one important aspect that we will need to address is what is the proper balance between acceptable uncertainty in the wind speed retrieval and the spatial resolution of the retrieval, where finer spatial resolution will required to resolve the higher wind speeds in the strong wind gradient regions of the tropical cyclone. Another aspect of the CYGNSS retrievals that warrants further investigation is the impact of rain. While CYGNSS retrievals are relatively immune to the propagation path effects of liquid and cloud liquid water, the modification of the surface by rain may have an impact on the CYGNSS retrievals, particularly at the lower wind speeds found in tropical depressions and tropical waves. The improved understanding derived from these analyses will be fed back into the CYGNSS retrieval and quality flagging to achieve a more robust wind product.
References
1) Christopher Ruf, “The NASA EV-2 Cyclone Global Navigation Satellite System (CYGNSS) Mission ,” August 27, 2012, URL of abstract: http://svcp.jpl.nasa.gov/cgi/mtgabstract.cgi?
series=earth&meetingfile=../meetings/2012/es2012082701.txt; URL of presentation: http://svcp.jpl.nasa.gov
/meetings/2012/es/082701/CYGNSS_27Aug2012_Ruf_CYGNSS_JPL_Seminar.pdf
2) Christopher S. Ruf, Scott Gleason, Zorana Jelenak, Stephen Katzberg, Aaron Ridley, Randall Rose, John Scherrer, Valery Zavorotny, “The CYGNSS Nanosatellite Constellation Hurricane Mission,” Proceedings of IGARSS (International Geoscience and Remote Sensing Symposium), Munich, Germany, July 22-27, 2012
3) “NASA’s Weather Prediction Project,” URL: http://aoss-research.engin.umich.edu/missions/cygnss/
4) “CYGNSS fact sheet,” UM, URL: http://aoss-research.engin.umich.edu
/missions/cygnss/docs/CYGNSS_factsheet.pdf
5) John Dickinson, Chris Ruf, Randy Rose, Aaron Ridley, Buddy Walls, “CYGNSS: The Cyclone Global Navigation Satellite System's CubeSat Foundations,” 12th Annual JACIE (Joint Agency Commercial Imagery Evaluation) Workshop, St. Louis, MO, USA, April 16-18, 2013, URL: http://www.cubesat.org/images/stories/Spring_Workshop_2013/Dickinson_CYGNSS.pdf
6) J. D. Harrington, “NASA Selects Low Cost, High Science Earth Venture Space System,” NASA, June 18, 2012, URL: http://www.nasa.gov/home/hqnews/2012/
jun/HQ_12-203_Earth_Venture_Space_System_CYGNSS.html
7) Stephen Clark, “NASA funds satellite mission to measure hurricane winds,” Spaceflight Now, June 21, 2012, URL: http://spaceflightnow.com/news/n1206/21venture/
8) “SwRI building eight NASA nanosatellites to help predict extreme weather events on Earth,” SwRI, June 21,2012, URL: http://swri.org/9what/releases/2012/nanosatellites.htm
9) Randy Rose, Will Wells, Debi Rose, Chris Ruf, Aaron Ridley, Kyle Nave, “Nanosat Technology And Managed Risk; An Update Of The CYGNSS Microsatellite Constellation Mission Development,” Proceedings of the AIAA/USU Conference on Small Satellites, Logan, Utah, USA, August 2-7, 2014, paper: SSC14-VI-4, URL: http://digitalcommons.usu.edu/cgi/viewcontent.cgi?article=3103&context=smallsat
10) Chris Ruf, Maria Paola Clarizia, Scott Gleason, Randy Rose, Aaron Ridley, “The NASA Cyclone Global Navigation Satellite System (CYGNSS) Mission,” Proceedings of the Advanced RF Sensors and Remote Sensing Instruments &Ka-band Earth Observation Radar Missions, (ARSI'14 & KEO'14), ESA/ESTEC, Noordwijk, The Netherlands, Nov. 4-7, 2014
11) Chris Ruf, “Overview of CYGNSS Mission,” NASA CYGNSS Applications Workshop,” NOAA at Silver Spring, MD, USA, 27-29 May 2015, URL: http://aoss-research.engin.umich.edu/
missions/cygnss/appswkshp2015/presentations/Ruf_CYGNSS_Apps_Wkshp_150527.pdf
12) “CYGNSS Applications Workshop,” some presentations, NOAA at Silver Spring, MD, USA, 27-29 May 2015, URL: http://aoss-research.engin.umich.edu/missions/cygnss/appswkshp2015/agenda.php
13) Christopher S. Ruf, Robert Atlas, Paul S. Chang, Maria Paola Clarizia, Jamames L. Garrison, Scott Gleason, Stephen J. Katzberg, Zorana Jelenakak, Joel T. Johnson, Sharanya J. Majajumdar, Andrew O’brien, Derek J. Posselt, Aaron J. Ridley, Randall J. Rose, Valery U. Zavavorotny, ”New ocean winds satellite mission to probe hurricanes and tropical convection,” BAMS, Volume 97 No. 3, March 2016, pp: 385–395, URL: http://journals.ametsoc.org/doi/pdf/10.1175/BAMS-D-14-00218.1
14) Frank Marsik, Christopher Ruf, Allison Lyons, Paul Chang, Zorana Jelenak, Heather Hanson, ”Eight Microsatellites, One Mission: CYGNSS,” The Earth Observer, November-December 2016, Volume 28, Issue 6, pp:04-13, URL: https://eospso.nasa.gov/sites/default/files/eo_pdfs/Nov-Dec%202016%20color%20508.pdf
15) Randy Rose, Will Wells, Jillian Redfern, Debi Rose, John Dickinson, Chris Ruf, Aaron Ridley, Kyle Nave, “NASA’s Cyclone Global Navigation Satellite System (CYGNSS) Mission – Temporal Resolution of a Constellation Enabled by Micro-Satellite Technology,” Proceedings of the 27th AIAA/USU Conference, Small Satellite Constellations, Logan, Utah, USA, Aug. 10-15, 2013, paper: SSC13-IV-6, URL: http://digitalcommons.usu.edu/cgi/viewcontent.cgi?article=2937&context=smallsat
16) Randy Rose, Chris Ruf, Debi Rose, Marissa Brummitt, Aaron Ridley, “The CYGNSS Flight Segment; A Major NASA Science Mission Enabled by Micro-Satellite Technology,” IEEE Aerospace Conference, Big Sky, MT, USA, March 2-9, 2013, URL: [web source no longer available]
17) John Scherrer, “Lessons (Being) Learned: Managing a More Cost‐Effective NASA Mission,” CESAS (Committee on Earth Science and Applications from Space), Washington DC, Sept. 17‐19, 2014, URL: http://sites.nationalacademies.org/cs/groups/ssbsite/documents/webpage/ssb_153131.pdf
18) Bob Allen, “The Science of CYGNSS,” NASA, May 28, 2015, URL: http://www.nasa.gov
/cygnss/the-science-of-cygnss
19) ”Orbital ATK Stargazer Arrives with Pegasus XL and CYGNSS,” NASA, Dec. 2, 2016, URL: https://blogs.nasa.gov/cygnss/
20) Maria Stothoff, Joe Atkinson, ”NASA’s CYGNSS Microsatellites Pass Testing Milestone,” NASA, June 15, 2016, URL: [web source no longer available]
21) ”CYGNSS Undergoes Vibration Testing,” Colorado Space News, Aug. 10, 2016, URL: https://web.archive.org/web/20200807040224/http://www.coloradospacenews.com/cygnss-undergoes-vibration-testing/
22) Bob Allen, ”The first complete CYGNSS spacecraft,” NASA, Feb. 12, 2016, URL: http://www.nasa.gov/cygnss/first-complete-cygnss-spacecraft
23) Steve Cole, Allison Lyons, Maria Stothoff, “NASA Begins to Build Satellite Mission to Improve Hurricane Forecasting,” NASA, Release 15-173, Aug. 19, 2015, URL: http://www.nasa.gov/
press-release/nasa-begins-to-build-satellite-mission-to-improve-hurricane-forecasting
24) http://www.nasa.gov/cygnss
25) Chris Ruf, Scott Gleason, Zorana Jelenak, Steve Katzberg, Aaron Ridley, Randy Rose, John Scherrer, Andrew O'Brien, Yuchan Yu, Valery Zavorotny, “The CYGNSS Nanosatellite Constellation Hurricane Mission,” SSTDM 2014, International workshop on Small Satellite and Sensor Technology for Disaster Management, Bangalore, India, March 31-April 2, 2014, URL: http://www.caneus.org/sstdm/presentations/day2/Session2/06-Scott%20Gleason%20Ruf_etal_CYGNSS_IndiaWorkshop.pdf
26) “CYGNSS hurricane satellite mission passes key review milestone,” SwRI, Sept. 19, 2013, URL: http://www.swri.org/9what/releases/2013/cygnss.htm#.VYQQp0Y_PRI
27) ”Mission Update: Pegasus Flight #43 (CYGNSS),” Orbital ATK, Dec. 15, 2016, URL: https://web.archive.org/web/20170622074425/https://www.orbitalatk.com/news-room/feature-stories/Pegasus43_MissionPage/default.aspx?prid=180
28) ”CYGNSS Hurricane Mission,” NASA, Dec. 15, 2016, URL: https://blogs.nasa.gov/cygnss/
29) ”NASA’s CYGNSS Launch Takes Surrey Satellite’s Space GNSS Receiver into Orbit,” SSTL, Dec. 15, 2016, URL: https://www.sstl.co.uk/media-hub/latest-news/2016/nasa%E2%80%99s-cygnss-takes-sstl-s-gnss-receiver-into-orbit
30) Anna Heiney, ”Newly Launched CYGNSS Microsatellites to Shed Light on Hurricane Intensity,” Dec. 15, 2016, URL: https://blogs.nasa.gov/cygnss/2016/12/15/
newly-launched-cygnss-microsatellites-to-shed-light-on-hurricane-intensity/
31) George H. Diller, Joshua Buck, “NASA Awards Launch Services Contract for CYGNSS Mission,” NASA, Contract Release C14-008, March 28, 2014, URL: http://www.nasa.gov/
centers/kennedy/news/releases/2014/release-20140328.html#.U-TqFKO4T5o
32) Christopher Ruf, Allison Lyons, Alan Ward, “NASA Intensifies Hurricane Studies with CYGNSS,” NASA, The Earth Observer, May-June 2013, Volume 25, Issue 3, pp. 12-21, URL: http://eospso.gsfc.nasa.gov
/sites/default/files/eo_pdfs/May_June_2013_508_color.pdf
33) T. Finley, D. Rose, W. Wells, J. Redfern, K. Nave, R. Rose, C. Ruf, "Techniques for LEO Constellation Deployment and Phasing Utilizing Differential Aerodynamic Drag," AAS/AIAA Astrodynamics Specialist Conference, Hilton Head Island, SC, USA, August 11-15, 2013.
34) Tylar Greene, Sean Potter, ”NASA Extends Cyclone Global Navigation Satellite System Mission,” NASA Press Release 21-084, 22 June 2021, URL: https://www.nasa.gov/press-release/
nasa-extends-cyclone-global-navigation-satellite-system-mission
35) ”NASA Earth Science Senior Review 2020,” NASA, 31 August 2020, URL: [web source no longer available]
36) Chris Ruf, ”Three more years! CYGNSS completes its first Senior Review,” NASA Earth Observatory, 9 November 2020, URL: https://earthobservatory.nasa.gov/blogs/fromthefield
/2020/11/09/three-more-years-cygnss-completes-its-first-senior-review/
37) Ellen Gray, ”NASA, New Zealand Partner to Collect Climate Data from Commercial Aircraft,” NASA Feature, 24 February 2020, URL: https://www.nasa.gov/feature/goddard/2020
/nasa-new-zealand-partner-to-collect-climate-data-from-commercial-aircraft
38) Chris Ruf, ”Happy Birthday, CYGNSS! Three years on orbit,” NASA Notes from the Field, 16 December 2019, URL: https://earthobservatory.nasa.gov/blogs/fromthefield/2019/12/16/happy-birthday-cygnss-three-years-on-orbit/
39) Tianlin Wang, Christopher Ruf, Scott Gleason, Bruce Block, Darren McKague, Andrew O’Brien, ”A Real-Time EIRP Level 1 Calibration Algorithm for the CYGNSS Mission Using the Zenith Measurements,” Proceedings of the 39th annual IGARSS (International Geoscience and Remote Sensing Symposium) 2019, Yokohama, Japan, 28 July - 2August 2019
40) Zhiqiang Cui, Zhaoxia Pu, Vijay Tallapragada, Robert Atlas, Christopher S. Ruf, ”A Preliminary Impact Study of CYGNSS Ocean Surface Wind Speeds on Numerical Simulations of Hurricanes,” Geophysical Research Letters, 2 Vol. 46, Issue 5, 16 March 2019, https://agupubs.onlinelibrary.wiley.com/doi/abs/10.1029/2019GL082236
41) Cynthia Gerlein‐Safdi, Christopher S. Ruf, ”A CYGNSS‐Based Algorithm for the Detection of Inland Waterbodies,” Geophysical Research Letters, Volume46, Issue21, 16 November 2019, Pages 12065-12072, https://agupubs.onlinelibrary.wiley.com/doi/abs/10.1029/2019GL085134
42) April Warnock, and Christopher Ruf, ”Response to Variations in River Flowrate by a Spaceborne GNSS-R River Width Estimator,” Remote Sensing, 22 October 2019, 2450, https://www.mdpi.com
/2072-4292/11/20/2450
43) Carol Rasmussen, ”NASA Smallsats Can Aid Hurricane Forecasts with GPS,” NASA/JPL News, 7 October 2019, URL: https://www.jpl.nasa.gov/news/news.php?release=2019-201
44) ”SwRI-developed satellites enter second phase of operations,” SwRI Press Release, 5 March 2019, URL: https://www.swri.org/press-release/
swri-satellites-second-phase-operations-cygnss-hurricane-monitoring
45) Chris Ruf, ”Two year anniversary of CYGNSS on orbit,” NASA Earth Observatory, 15 December 2018, URL: https://earthobservatory.nasa.gov/blogs/
fromthefield/2018/12/15/two-year-anniversary-of-cygnss-on-orbit/
46) Hyunglok Kim, Venkat Lakshmi, ”Use of Cyclone Global Navigation Satellite System (CyGNSS) Observations for Estimation of Soil Moisture,” Geophysical Research Letters, Volume 45, Issue 16, First published: 06 August 2018, https://doi.org/10.1029/2018GL078923
47) Katherine Jensen , Kyle McDonald, Erika Podest, Nereida Rodriguez-Alvarez, Viviana Horna, Nicholas Steiner, ”Assessing L-Band GNSS-Reflectometry and Imaging Radar for Detecting Sub-Canopy Inundation Dynamics in a Tropical Wetlands Complex,” Remote Sensing, Vol. 10, Issue 9, Published: 7 September 2018, URL: https://res.mdpi.com/remotesensing/remotesensing-10-01431
/article_deploy/remotesensing-10-01431-v2.pdf?filename=&attachment=1
48) Clara Chew, John T. Reager, Eric Small, ”CYGNSS data map flood inundation during the 2017 Atlantic hurricane season,” Scientific Reports, doi: 10.1038/s41598-018-27673-3, 2018, Published online: 19 June 2018, URL: [web source no longer available]
49) Ellen Gray, ”Flood Detection a Surprising Capability of Microsatellites Mission,” NASA/GSFC, 30 July 2018, URL: [web source no longer available]
50) Derek Posselt, Christopher Ruf, ”Summary of the Eighth CYGNSS Science Team Meeting,” The Earth Observer March - April 2018, Volume 30, Issue 2, pp: 20-22 [web source no longer available]
51) Randy Rose, Scott Gleason, Christopher Ruf, ”NASA CYGNSS Mission Update; A Pathfinder for Operational GNSS Scatterometry Remote Sensing Applications,” Proceedings of the 31st Annual AIAA/USU Conference on Small Satellites, Logan UT, USA, Aug. 5-10, 2017, Paper: SSC17-I-04, URL: http://digitalcommons.usu.edu/smallsat/2017/all2017/64/
52) Ronnie Killough, John Scherrer, Randall Rose, Antonina Brody, Jillian Redfern, Keith Smith, Christopher S. Ruf, Terrance Yee, ”CYGNSS Launch and Early Ops: Parenting Octuplets,” Proceedings of the 31st Annual AIAA/USU Conference on Small Satellites, Logan UT, USA, Aug. 5-10, 2017, Paper: SSC17-X-01, URL: http://digitalcommons.usu.edu/smallsat/2017/all2017/136/
53) National Hurricane Center Forecast Verification, 04 April 2017, URL: http://www.nhc.noaa.gov/verification/verify5.shtml
54) ”NASA’s CYGNSS Satellite Constellation Begins Public Data Release,” NASA, May 24, 2017, URL: [web source no longer available]
55) Joe Atkinson, ”NASA’s CYGNSS Satellite Constellation Enters Science Operations Phase,” NASA, March 31, 2017, URL: [web source no longer available]
56) Joe Atkinson, ”CYGNSS Hurricane Mission Measures “First Light” Science Data,” NASA, Jan. 5, 2017, URL: [web source no longer available]
57) Bob Allen, ”A Message From CYGNSS Principal Investigator Chris Ruf,” Dec. 15, 2016, URL: https://blogs.nasa.gov/cygnss/2016/12/15/a-message-from-cygnss-principal-investigator-chris-ruf/
58) Joseph Atkinson, ”Eight for Eight! All Satellites Contacted!,” Dec. 15, 2016, URL: https://blogs.nasa.gov/cygnss/2016/12/15/eight-for-eight-all-satellites-contacted/
59) ”New NASA Hurricane Tracking Mission on Track,” NASA Release 16, 119, Dec. 15, 2016, URL: https://www.nasa.gov/press-release/new-nasa-hurricane-tracking-mission-on-track
60) Chris Ruf, Scott Gleason, Zorana Jelenak, Stephen Katzenberg, Aaron Ridley, Randy Rose, John Scherrer, Valery Zavorotny, “The NASA EV-2 Cyclone Global Navigation Satellite System (CYGNSS) Mission,” IEEE Aerospace Conference, Big Sky, MT, USA, March 2-9, 2013, URL: [web source no longer available]
61) Scott Gleason, “Remote Sensing of Ocean, Ice and Land Surfaces Using Bi-statically Scattered GNSS Signals From Low Earth Orbit,” Ph.D. Thesis, University of Surrey, Gilford, UK, January 2007, URL: http://aoss-research.engin.umich.edu/missions/cygnss
/reference/gnss-overview/Gleason_Thesis_GNSS.pdf
62) M. P. Clarizia, C. Gommenginger, S. Gleason, C. Galdi, M. Unwin, “Global Navigation Satellite System-Reflectometry (GNSS-R) from the UK-DMC Satellite for remote sensing of the ocean surface,” Proceedings of IGARSS 2008, Boston, MA, USA, July 6-11, 2008, URL: https://web.archive.org/web/20160309211558/http://www.sstl.co.uk/getattachment/8ea1074b-b37a-4829-8345-b1bb02656d02/SGR-ReSI
63) Martin Unwin, Philip Jales, Paul Blunt, Stuart Duncan, Marissa Brummitt, Christopher Ruf, “The SGR-ReSI and its application for GNSS reflectometry on the NASA EV-2 CYGNSS mission,” IEEE Aerospace Conference, Big Sky, MT, USA, March 2-9, 2013, URL: [web source no longer available]
64) “SGR-ReSI Space GNSS Instrument,” SSTL, URL: https://web.archive.org/web/20140612042858/http://www.sstl.co.uk/Products/Subsystems/Flying-Soon/SGR-ReSI
65) Randall Rose, John Scherrer, Debra Rose, Christopher Ruf, James Wells, Christine Bonniksen, ”CYGNSS Mission Overview and Preflight Update,” Proceedings of the 30th Annual AIAA/USU SmallSat Conference, Logan UT, USA, August 6-11, 2016, paper: SSC16-VI-1, URL: http://digitalcommons.usu.edu/cgi/viewcontent.cgi?article=3375&context=smallsat
66) ”Surrey’s GPS Receiver Is at the Heart of NASA’s Upcoming CYGNSS Mission,” SST-US, Dec. 2, 2016, URL: https://web.archive.org/web/20180719133812/http://www.sst-us.com/blog/december-2016/surrey-s-gps-receiver-is-at-the-heart-of-nasa-s-up
67) Maria Paola Clarizia, Christopher S. Ruf, Philip Jales, Christine Gommenginger, ”Spaceborne GNSS-R Minimum Variance Wind Speed Estimator,” IEEE Transaction on Geoscience and Remote Sensing, Vol. 52, No 11, Nov. 2014, pp: 6829-6843, URL: [web source no longer available]
68) ”Changing the economics of space,” SST-US LLC, URL: [web source no longer available]
69) Debi Rose, Michael Vincent, Randy Rose, Chris Ruf, “The CYGNSS Ground Segment; Innovative Mission Operations Concepts to Support a Micro-Satellite Constellation,” IEEE Aerospace Conference, Big Sky, MT, USA, March 2-9, 2013, URL: http://ktb.engin.umich.edu/RSG
/pubs_files/AeroConf-2013_Rose-etal_CYGNSS-Ground-Segment.pdf
70) http://www.sscspace.com/universalspacenetwork
71) Maria Paola Clarizia, Christopher Ruf, Andrew O’Brien, Scott Gleason, “A wind speed retrieval algorithm for the CYclone Global Navigation Satellite System (CYGNSS) Mission,” Proceedings of the Advanced RF Sensors and Remote Sensing Instruments &Ka-band Earth Observation Radar Missions, (ARSI'14 & KEO'14), ESA/ESTEC, Noordwijk, The Netherlands, Nov. 4-7, 2014
72) Zorana Jelenak, Paul S. Chang, Seubson Soisuvarn, Faozi Said, “Validation and evaluation of CYGNSS wind retrieval performance,” Proceedings of the IGARSS (International Geoscience and Remote Sensing Symposium) 2015, Milan, Italy, July 26-31, 2015
Space Segment Launch Mission Status Sensor Complement Ground Segment References Back to top