Chang'e-1 (Lunar-1 Mission of China)
Non-EO
CNSA
Quick facts
Overview
| Mission type | Non-EO |
| Agency | CNSA |
| Launch date | 24 Oct 2007 |
| End of life date | 01 Mar 2009 |
Chang'e - 1 (Lunar-1 Mission of China)
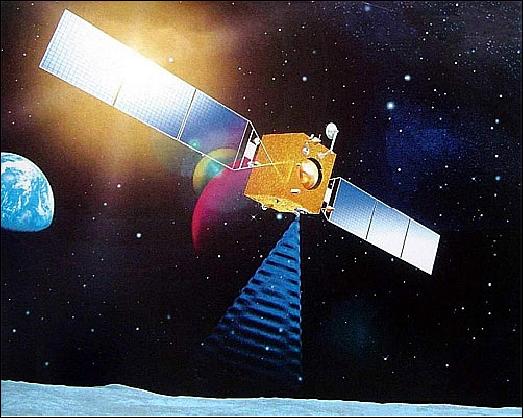
Chang'e-1 is China's first step in CLEP (China Lunar Exploration Program) of unmanned and eventually of manned missions to the moon announced in early 2003 by CNSA (China National Space Administration). The program is named for the Chinese moon goddess Chang'e (Lady Chang’e flying to the Moon——an ancient Chinese legend reflecting the Chinese people’s desire to explore the unknown world). In January 2004, the Chinese government gave its approval for a three-phase robotic lunar exploration program. The first spacecraft in the program, Chang'e-1, is referred to as the “lunar orbiting mission,” will provide observations in a low lunar orbit of about 200 km altitude. 1)
Note: Chang'e-1 is also spelled as Chang'E-1 as well as CE-1 (Chang'E-1).
The science objectives of the Chang'e-1 mission are:
1) To obtain three-dimensional imagery of the lunar surface
2) To analyze the distribution of useful elements and materials below the lunar surface
3) To probe the features of lunar soil
4) To explore the space environment between the moon and Earth and above the lunar surface.
Background
China's Chang'e moon exploration program, CLEP, comprises three mission phases: a) orbiting, b) soft landing, and c) a sample return mission including a lunar landing.
Milestones in China's Lunar Exploration Program (CLEP) Activities: 2) 3) 4)
• In 1991, Chinese space experts proposed lunar exploration program and undertook some advanced research.
• In 1998, CNSA started to define the program.
• In 2001, the White Paper on China’s Space Activities defined the deep space exploration which emphasized on lunar exploration.
• On Jan.23,2004, lunar orbiting project was approved which was the first step for China’s lunar and deep space exploration. 5)
1) Phase 1 of CLEP was designed to be a demonstration of China's technological prowess, involving the launch of lunar orbiters Chang’e-1 in 2007 and Chang’e-2 in 2010.
- Chang'e-1 lunar probe, the moon-orbiting satellite, was launched on Oct. 24, 2007
- Chang'e-2, the second unmanned moon-orbiting mission of phase 1 was launched on Oct. 1, 2010.
2) Phase 2 of CLEP is expected to start in 2013 with the launch of Chang'e-3. In the second phase of the lunar exploration program, two lunar landers will be launched to deploy moon rovers for surface exploration in a limited area.
3) Phase 3 of CLEP is slated for 2017 with the launch of Chang’e-5 on the LM-5E heavy launch vehicle for collecting samples from the lunar surface.
- Also much later in this phase, the program has its sights set on a manned lunar landing for sometime after 2025.
Spacecraft
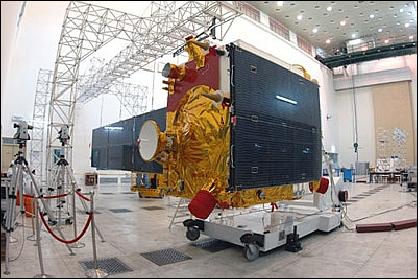
The Chang'e-1 lunar orbiter is based on the DFH-3 communication spacecraft bus series of CAST (3-axis stabilization) with a launch mass of about 2350 kg, about 140 kg of which is the scientific payload (Ref. 3).
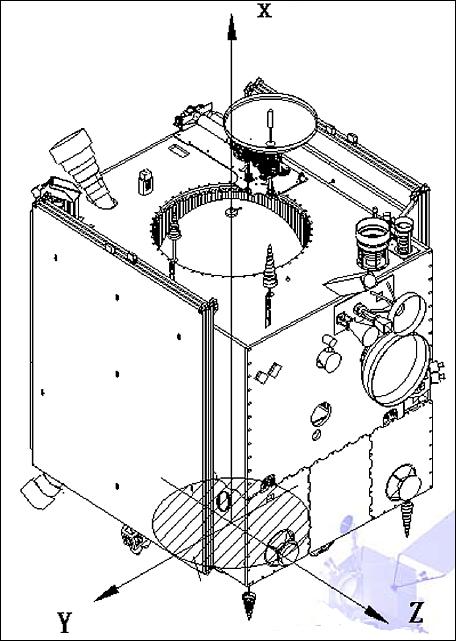
Structure: The main body of the DFH-3 bus uses a box-form structure with the size of 2.22 m x 1.72 m x 2.2 m. Use of a central bearing cylinder, honeycomb panel, box, upper module and bottom module.
The DFH-3 satellite consists of the following elements: the propulsion module, service module, communications module, antenna and solar wings. It has 7 subsystems, including the TCS (Thermal Control Subsystem), GNC (Guidance Navigation and Control) also referred to as AOCS (Attitude and Orbit Control Subsystem), EPS (Electric Power Supply) subsystem, TT&C (Telecommand, Telemetry and Tracking) subsystem, propulsion subsystem, structure and communications subsystem, etc..
TCS: Use of active and passive control, thermal paint, multilayer thermal blankets and insulation material, heater, sensors, heat pipe and controller.
GNC: The spacecraft 3-axis stabilized using the zero-momentum method. Attitude sensing is provided by sun sensors, star trackers, gyroscopes, and UV sensors. Actuation is provided by reaction wheels and thrusters. The pointing accuracy is < 1 (3σ) and the stabilization accuracy is < 0.01º/s.
EPS: Single dimension symmetric solar panel, Si solar cell, area of 22.7 m2, max power output of 1450 W, use of NiH battery (output 48Ah@End Of Life). The solar wing span is 18 m (5.7 m height) with a power provision of 1.7 kW at EOL. A mission life of at least 1 year is expected in lunar orbit.
Propulsion: Use of bi-propellant thrusters with MOH (Metal Hydroxide) and N2O4, for slow spin, angular rate damper, attitude control and orbit maneuver, 1 x 490 N and 2 x (6 x 10 N) thrusters.
OBDH (On-Board Data Handling) subsystem: Use of a two-level distributed redundant subsystem, CTU (Central Terminal Unit), 4 RTUs (Remote Terminal Units), one TCU (Telecommand Unit), one set of redundant SDB (Serial Data Bus).
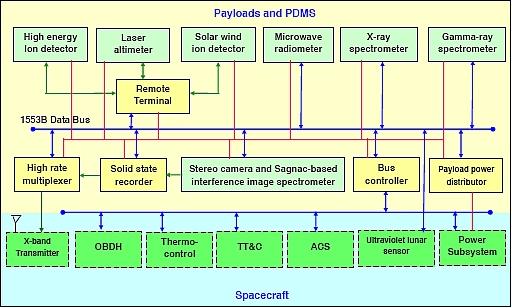
PDMS (Payload Data Management System): The PDMS is a distributed system based on the STD-MIL-1553B data bus. It consists of the BC (Bus Controller), SSR (Solid State Recorder), HRM (High Rate Multiplexer), RT (Remote Terminal) and PPD (Payload Power Distributor). BC manages and controls the STD-MIL-1553B data bus communication.
The stereo camera, the microwave radiometer, the Gamma and X-ray spectrometer access the system via the STD-MIL-1553B data bus. The laser altimeter, the high energy particle detector and solar wind ion detectors connect the system via RT. The Sagnac-based interference image spectrometer transmits the image data via a high-speed channel to SSR. 6)
PDMS provides and distributes the power for all the payloads. The imaging, science and housekeeping data of the experiments are acquired, compressed, packed, and stored by PDMS.
RF communications: The TT&C (Telemetry, Tracking and Command) S-band system has been formed based on China’s existing TT&C technology. Use of a high-gain directional antenna and a medium-gain omni-directional antenna for the probe. Channel encoding is implemented for the downlink channel, using both high and low data rates for information transmission. An upgrade of ground equipment terminals (12 m dish antenna) was needed.
To provide accurate navigation for the probe during its Earth–Moon flight and initial lunar orbiting flight, China’s VLBI (Very Long Baseline Interferometry) system, designed for astronomical observations, will be used besides the ranging and range rate measurement capabilities of the S-band TT&C network. X-band beacon for VLBI. The goal is to provide 100 m accuracy in position determination during lunar orbit. 7)
The PDMS acquired science and housekeeping data are stored in the SSR (Solid State Recorder) or in the payload memories. During an overpass, the stored data and the real time data are being interpolated and encapsulated by the HRM (High Rate Multiplexer) to form a serial of transfer frame according to the CCSDS standards; they are transmitted to the Earth station by S-band transmitters. The downlink data rate is 3 Mbit/s.
The SSR has a storage capacity of 48 Gbit. An image data compression board is included in the SSR, compression radio ≥ 2, which depends on the complicity of the original image.
Launch mass, dry mass | 2350 kg, 1150 kg |
Fuel mass | 1200 kg |
Mass of sensor complement (payload) | 140 kg |
Lunar operational orbit | Altitude of 200 km, inclination = 90º |
Life on orbit | 1 year |
Launch
A launch of Chang'e-1 took place on Oct. 24, 2007 on a CZ-3A (Changzheng-3A or Long March-3A) vehicle from the Xichang Satellite Launch Center in southwest China. 8)
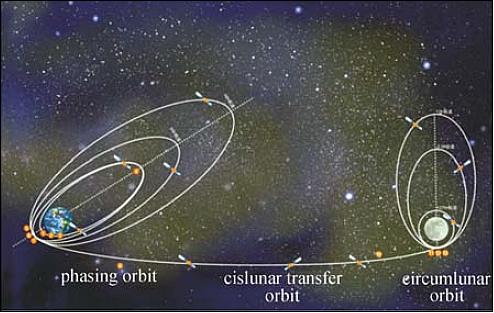
Orbit: The orbit is divided into four phases. The transfer orbit from Earth to the moon will take about 8-9 days.
- Initial launch phase: The probe was launched to a highly elliptical orbit with 31º inclination, 200 km perigee and 51000 km apogee
- Apogee raising phase: The apogee of the orbit was raised gradually by conducting maneuver at perigee three times in a row. After the third maneuver, the probe left the Earth orbit and entered into an Earth-moon transfer orbit.
- Earth-moon transfer orbit (or cislunar transfer orbit): After a journey of 13 days, Change'e-1 reached the moon on Nov. 5, 2007. The spacecraft was decelerated by control rocket propulsion in the reverse direction and was captured by the lunar gravitation to become an orbiter around the moon.
- Lunar orbit: Chang'e-1 operated in a lunar polar orbit with inclination of 90º to lunar equatorial plane. It adopted a circular lunar polar orbit to acquire the remote sensing images with the same resolution along the whole orbit. The selected lunar altitude was 200 km.
- The lunar polar working orbit of 200 km altitude (period of 127 minutes) was reached on Nov. 7, 2007.
The precise orbit determination of Chang’e-1 was performed mainly by using two-way USB (Unified S-band) Doppler and range data collected by Qingdao (120.19°E, 36.04°N) and Kashi (76.03°E, 39.51°N) stations, and was assisted with VLBI delay and delay rate data collected by four VLBI stations, with 25 m at Shanghai and Urumuqi, and 50 m at Beijing and Kunming. - Generally, 3 to 4 tracking passes per day were provided, all data were sampled at 1 Hz (Ref. 24).
The VLBI system for Chang'e-1 was developed by SHAO (Shanghai Astronomical Observatory). SHAO was also responsible for VLBI tracking during the mission. The VLBI assembly consisted of the Shanghai VLBI data processing and command center, four radio telescopes (observation station) located in Shanghai, Beijing, Kunming, and Urumqi, respectively. From Oct. 27 to Nov. 8, 2007, the VLBI system carried out the tracking mission perfectly. The mission phases included the phase-modulation orbit, the Earth-moon transfer orbit and the lunar capture orbit. During this mission, VLBI provided the probe delay, delay rate and the angle position with very high precision to the BACC (Beijing Aerospace Control Center), and it also took part in the near real-time orbit determination and prediction. The results showed, that VLBI has made an important contribution to the CE-1 probe entering the predicted lunar orbit smoothly and safely.
Mission Status
• On 1 March 2009, at 08:13:10 UTC, Chang'e-1 was guided to crash onto the surface of the moon, ending its 16-month mission (impact area: 52.36ºE, 1.50ºS, in the north of Mare Fecunditatis). - The total mission lasted 495 days, exceeding the designed life-span by about four months. During its orbital mission, the probe transmitted 1.37 TB of data to the ground stations. The received data was processed into 4 TB of science data at different levels. 9) 10) 11) 12)
• Feb. 2, 2009: The spacecraft made its third pass into the lunar eclipse.
• Dec. 20, 2008: On this date, the project commanded the spacecraft back to its 100 km circular orbit (Ref. 3).
• On Dec. 12, 2008, the first global image of the moon was released.
• Although the Chang’e 1 mission officially ended in October 2008, the spacecraft continued flying for another four months to conduct further tests to gain experience for future probe missions.
- On 19 Dec. 19, 2008, the spacecraft was lowered again into an elliptical orbit of 15 km x 100 km.
- On Dec. 6, 2008, the Mission Control commanded the spacecraft to lower its orbit to an altitude of 100 km above the lunar surface.
• Oct. 24, 2008: One year after launch, all scientific and engineering goals were accomplished (Ref. 13).
• Aug. 17, 2008: The spacecraft made its second pass into the lunar eclipse.
• Feb. 21, 2008: The spacecraft made its first pass into the lunar eclipse.
• Between November 2007 and October 2008, Chang’e 1 carried out various exploration missions in the lunar orbit, including obtaining three-dimensional images of lunar surface and making outline graphs of lunar geology and structures; searching for useful elements on the lunar surface and analyzing the elements and materials; examining the features and depth of the lunar soil; and exploring the space environment between 40,000 km and 400,000 km from Earth (Ref. 10).
• The science data from Chang’e-1 were received by the Beijing and Kunming ground stations. The first image from the moon's surface was released on Nov. 26, 2007, captured by the CCD camera (120 m resolution). On Dec. 11, 2007, CNSA published more images from the Chang’e-1 spacecraft, showing the far side of the moon.
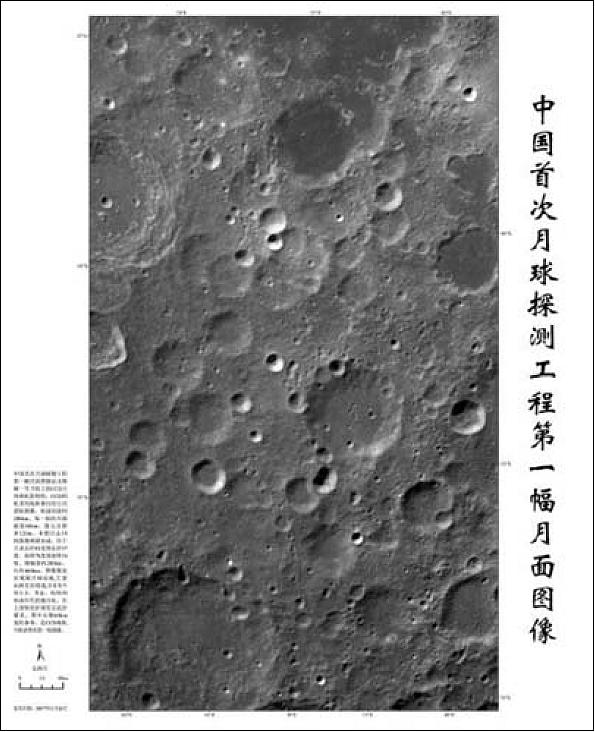
Legend to Figure 7: The first lunar image of Chang’e-1 is a combination product of 19 tracks image data received in the period Nov. 20–21, 2007. Image size: 280 km x 460 km. It was released on Nov. 26, 2007.
• Nov. 20, 2007: The various payload instrument were powered on. Also on November 20, the GRAS (Ground Research & Application System) of CLEP (Chinese Lunar Exploration Program ) received the first lunar image transmitted from CE-1. 13)
• Nov. 7, 2007: The spacecraft reached a circular polar orbit with an altitude of 200 km and a period of 127 minutes.
• Nov. 5, 2007: First LOI (Lunar Orbit Injection) into lunar polar orbit.
• Oct. 31. 2007: The spacecraft entered into LTO (Lunar Transfer Orbit).
Results
1) MRM (Microwave Radiometer, Moon):
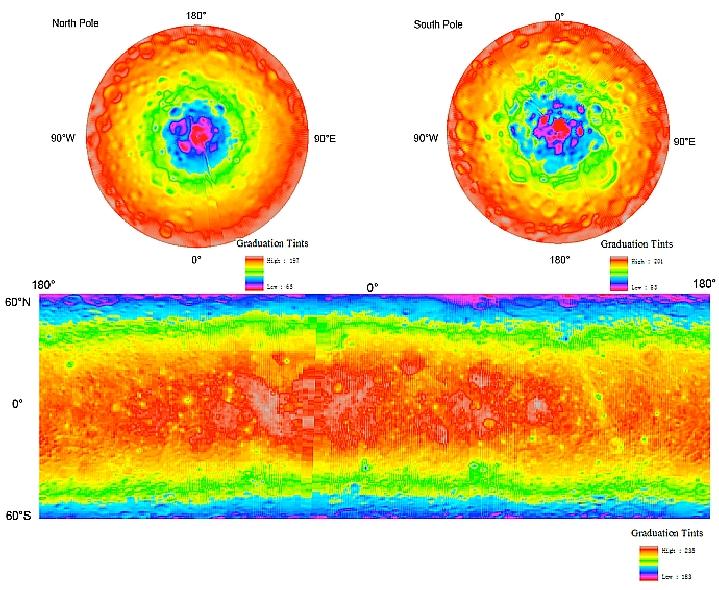
Prior to Chang'e-1, there was no passive, multi-channel, microwave remote sensing of the moon from a satellite. Chang'e-1 had a polar orbit and, thus, was able to observe essentially every location of the moon with a nadir view. Thanks to the long lifespan of Chang'e-1, the MRM obtained brightness temperature data that cover the moon globally eight times, during both lunar daytime and nighttime periods. This global, diurnal coverage provides extremely valuable data for studying the lunar regolith (‘dust’ and impact debris covering almost the entire moon surface). 14) 15) 16)
The Chang'e-1 microwave observations have made several important breakthroughs. MRM passively measured microwave emission in four frequency channels: 3, 7.8, 19.35, and 37 GHz. The higher frequency emission comes from a layer just a little below the surface (a few centimeters), whereas the lower frequency emission can probe depths beyond a few meters. With such penetrative ability, the microwave data can be used to infer thermo-physical properties of the lunar regolith, as well as, to find out about the variation of regolith thickness across the lunar surface. Such information is useful for estimating the distribution and amount of helium 3, a promising nuclear fuel for in situ fusion energy production in the future human settlements on the moon.
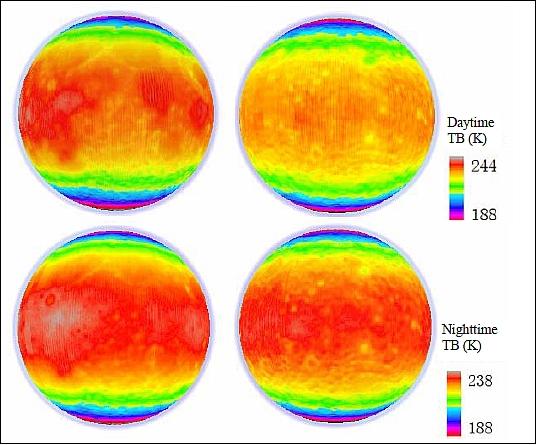
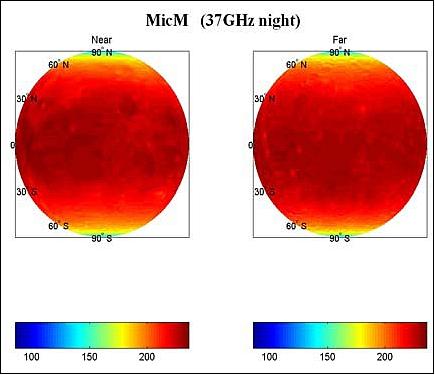
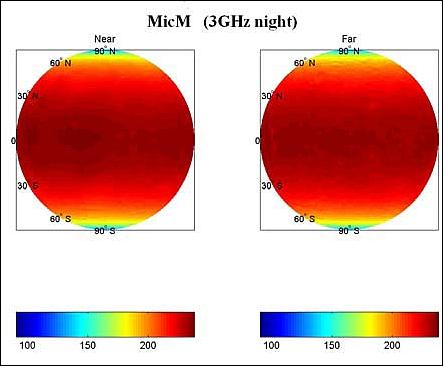
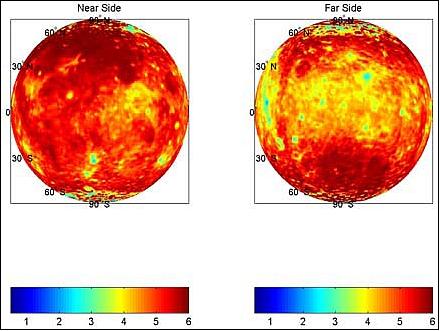
Using the MRM data, global brightness temperature maps (TBL) of the moon were constructed at NAO/CAS (National Astronomical Observatories/ Chinese Academy of Sciences) for different frequencies, and separately for day and night times. The results are particularly revealing. On the 37 GHz daytime map (Figure 8), the maria, which appear dark in visible light, become bright in microwave wavelengths to reflect the higher temperatures (due to stronger absorption in the solar visible spectrum).
2) Coregistration of Stereo Camera images and LAM (Laser Altimeter, Moon) data: 17)
A 1:2.5 million scale global image mosaic has been produced using the CCD images after radiometric and geometric processing, map projection, mosaicking and editing. In the process, LAM DEM (Digital Elevation Model) data was used to correct the positional errors of the geometric processing results.
A coregistration method for stereo imagery and laser altimeter data for 3D high-precision mapping of the lunar surface was performed at IRSA (Institute for Remote Sensing Applications), Beijing, China. In ground processing, DEM imagery is automatically generated from the CCD stereo images based on rigorous pushbroom sensor model and multi-level image matching. The DEM imagery is then registered to LAM data through surface matching with a 3D rigid transformation model. Consequently, the exterior orientation parameters (EOPs) of the images are adjusted using the rigid transformation model so that the images and LAM data are co-registered.
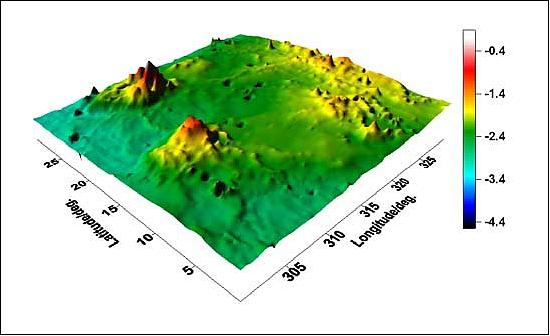
A lunar topography model was obtained based on laser altimeter data. From this model, middle scale volcano and basins have been discovered.
In day time, the strong illumination from high altitude and high albedo rate radical craters will introduce the illumination effect on observing the nearby low altitude, low albedo rate and shallow small slop rate area seriously, and even can “hide” the later area from the light. Based on the lunar global topography model obtained by the Chang’e-1 mission, and by comparing with the lunar gravity model, a volcano named “YUTU Mountain” has been identified. It is a volcano with diameter of ~300 km and a height of ~2 km, located at (14ºN, 308ºE) in Oceanus Procellarum. Besides, the DEM of another volcano named “GUISHU Mountain” in the same area has been improved. 18)
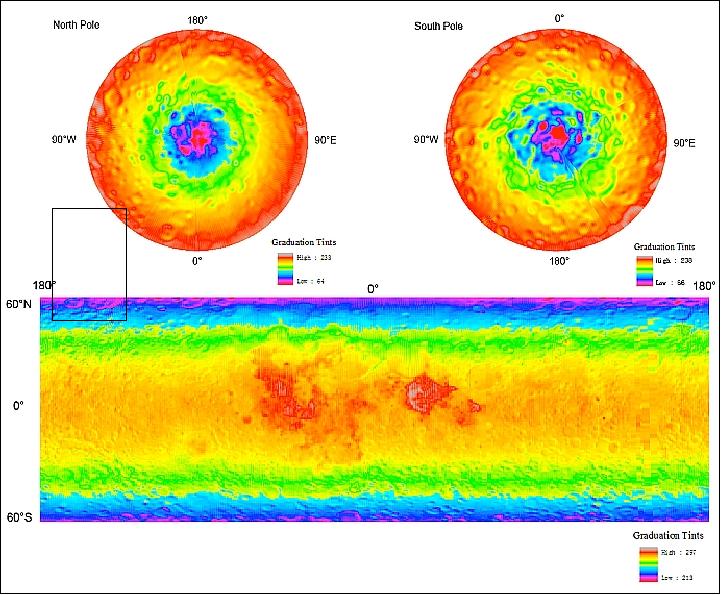
Geophysical characteristics of the moon: The altimetry data make possible improved estimates of the fundamental parameters of the moon’s shape, which are principally derived from the long-wavelength spherical harmonic coefficients. The mean radius of the moon given by CLTM-s01 (Chang’E-1 Lunar Topographic Model) is 1737013 m, and by rotating a flattened ellipsoid to fit the gridded data, the mean equatorial radius, the mean polar radius and the flattening were determined to be 1737646 m, 1735843 m, and 1/963.7526, respectively. 19)
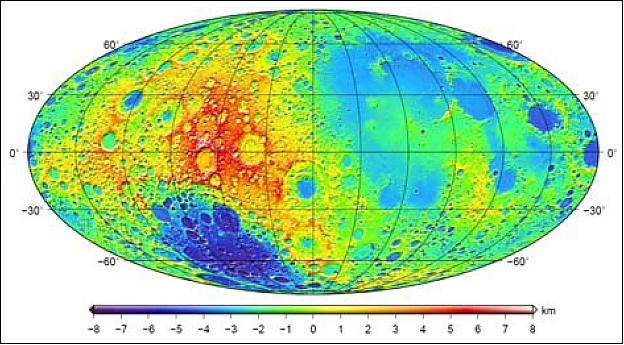
Legend to Figure 12: The map is shown in a global Mollweide projection with a central meridian of 270º E, where the near side and far side hemispheres are on the right and left, respectively. The longitudinal and latitudinal grid lines are spaced at an interval of 30º°.
Sensor Complement
The sensor complement had a mass of ~ 140 kg and was developed by CSSAR ( Centre for Space Science and Applied Research) of CAS ( China Academy of Sciences). To achieve the science goals of the mission, eight scientific instruments were chosen as the payloads of the Chang’e-1. 20) 21)
In order to collect, process, store and transmit the scientific payload data, a PDMS ( Payload Data Management System) is included (PDMS is described under the spacecraft).
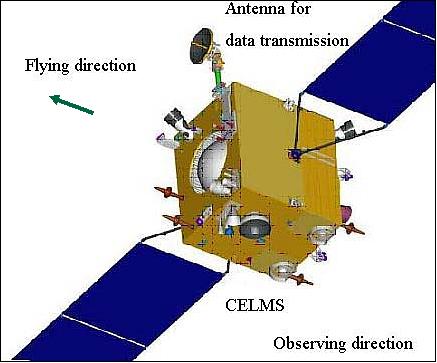
CELMS (Change'e-1 Lunar Microwave Sounder)
CELMS, also referred to as MRM (Microwave Radiometer, Moon), is the main scientific instrument of the mission, a four-frequency microwave radiometer at 3 GHz, 7.8 GHz, 19.3 GHz and 37 GHz. The objective is to monitor the penetration depth of the frequencies into the lunar regolith. The lowest frequency offers the greatest penetration depth. The project selected the frequency of 3 GHz to be able to accommodate the required antenna size on the spacecraft. The highest frequency of 37 GHz is being used to obtain the emission (brightness temperature) from the lunar surface. The two mid-frequencies of 7.8 and 19,35 GHz are used to acquire an internal layer construction and thermal contributions. 22)
Frequency (GHz) | Bandwidth (MHz) | Integration time (ms) | Sensibility (K) | Linearity | Spatial resolution (km) |
3.0 | 100 | 200 | 0.5 | 0.99 | 50 |
7.8 | 200 | 200 | 0.5 | 0.99 | 35 |
19.35 | 500 | 200 | 0.5 | 0.99 | 35 |
37 | 500 | 200 | 0.5 | 0.99 | 35 |
On the basis of the lunar brightness temperature (TBL), the project established MicM (Microwave Moon), the world's first microwave map covering the entire moon surface. The MicM survey is not only important for lunar resources and applications, but is also valuable for lunar and cosmic science.
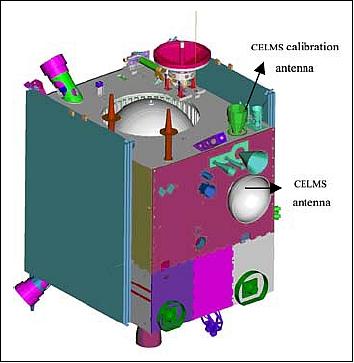
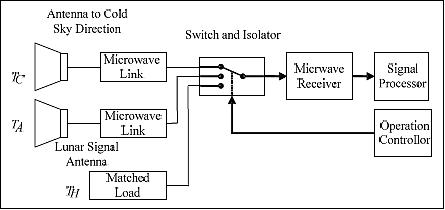
CHELMS calibration: In-orbit calibration is performed using two targets with known radiations; one is the matched load within the receiver with temperature TH, the other is directed into cold space with radiation of TC=2.7 K at CELMS frequencies.
Lunar regolith involves not only the history of lunar formation, but provides also abundant information concerning the origin of the Solar system including Earth. In addition, the regolith provides important information concerning the geology of the moon.
The regolith layer thickness values are obtained from estimates with direct and indirect methods. The thickness values estimated by different methods and different scientist differed much since there were no global data references for such estimations. Figure 17 represents a global map of regolith layer thickness values estimated by CELMS. It appears that CELMS results are thinner when compared to other results.
Stereo Camera
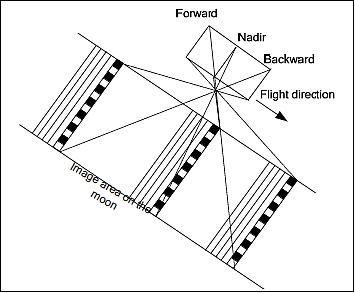
The objective of the CCD imager is to provide stereo imagery at a resolution of about 120 m. The imager is a three-line instrument, observing the target area from three different view angles (forward, nadir and backward), which made it possible to get DEM data and orthophoto image data of the global lunar surface. 23)
Imager | Three-line CCD camera pushbroom system |
Spectral range | 500–750 nm (panchromatic data in 1 channel) |
Spatial resolution at nadir | 120 m |
Swath width | 60 km |
Data quantization | 8 bit |
Base-height ratio | ≥0.6 |
MTF (Modulation Transfer Function) | ≥ 0.2 at Nyquist frequency |
SNR (Signal-to-Noise Ratio), (ρ= 0.2, θ = 60º) | ≥ 100 |
Optical parameters | - Focal length: 23.3 mm |
CCD array | 1024 x 1024 pixels on a chip, with a pixel size of 14 µm |
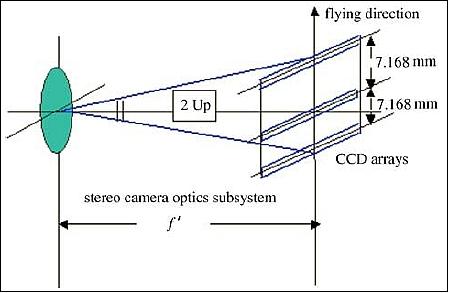
The stereo camera consists of an optics subsystem, a framework to support optics lens, the plane CCD array and corresponding signal processing subsystem. The three parallel rows of the plane CCD arrays can get the nadir (0º), forward (17º), and backward (-17º) view of the moon's surface simultaneously as the spacecraft moves forward.
From Nov. 20, 2007 to July 1, 2008, the CCD camera successfully mapped the whole surface of the moon, including the polar areas, where the solar illumination was quite weak. Generally, orbital image data are distinctly affected by altitude, solar elevation angle, incidence angle, view angle, exposure time, etc.
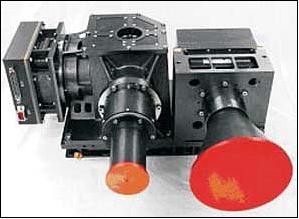
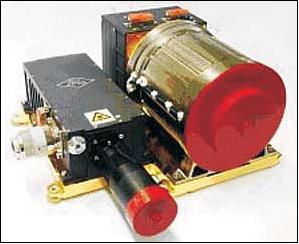
The stereo camera and the Sagnac-based interferometer spectrometer imager (IIM) are integrated together (Figure 20).
IIM (Sagnac-based Imaging Interferometer Spectrometer)
The objective of IIM is to obtain the multispectral imagery of the lunar surface. The VNIR (Visible Near Infrared) reflectance properties of moon are sensitive to the mineralogy, mineral chemistry and physical states of lunar regolith. From the imagery, the distribution of major types of minerals and rocks can be identified (Ref. 20). The instrument features 32 channels in the spectral range of 480 - 960 nm.
Channel No | Center wavelength (nm) | Relative error of wavelength/% | Channel No | Center wavelength (nm) | Relative error of wavelength/% |
1 | 480.91 | 23.22 | 17 | 644.63 | 2.46 |
2 | 488.67 | 13.83 | 18 | 658.64 | 2.47 |
3 | 496.68 | 11.85 | 19 | 673.28 | 2.37 |
4 | 504.96 | 8.20 | 20 | 688.58 | 2.34 |
5 | 513.52 | 6.37 | 21 | 704.60 | 2.30 |
6 | 522.37 | 5.16 | 22 | 721.37 | 2.51 |
7 | 531.54 | 6.00 | 23 | 738.97 | 2.22 |
8 | 541.03 | 5.49 | 24 | 757.44 | 2.48 |
9 | 550.87 | 4.95 | 25 | 776.86 | 2.17 |
10 | 561.07 | 3.88 | 26 | 797.31 | 1.86 |
11 | 571.65 | 3.57 | 27 | 818.85 | 2.00 |
12 | 582.65 | 3.59 | 28 | 841.60 | 1.97 |
13 | 594.07 | 3.95 | 29 | 865.65 | 1.90 |
14 | 605.95 | 3.06 | 30 | 891.11 | 1.87 |
15 | 618.32 | 2.64 | 31 | 918.11 | 4.38 |
16 | 631.20 | 2.36 | 32 | 946.80 | 19.26 |
The IIM instrument is a Sagnac-based pushbroom Fourier transform imaging spectrometer, which operates from visible to near infrared (0.48-0.96 µm). IIM yields a ground resolution of 200 m/pixel and 25.6 km swath width.
On Nov. 26, 2007, the IIM instrument was powered on. The real time data was transmitted to GSDSA (Ground Segment for Data, Science, and Applications) of China’s Lunar Exploration Program.
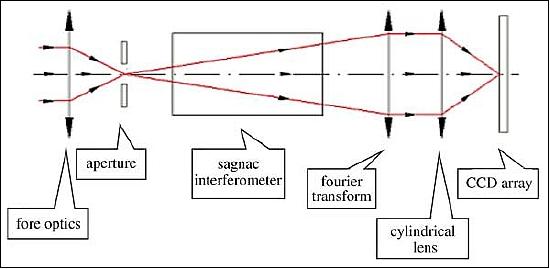
Figure 22 shows the calculated 3-band picture, the synthesized pseudo-color picture using the 3 bands, the interference pattern and the recovered spectrogram.
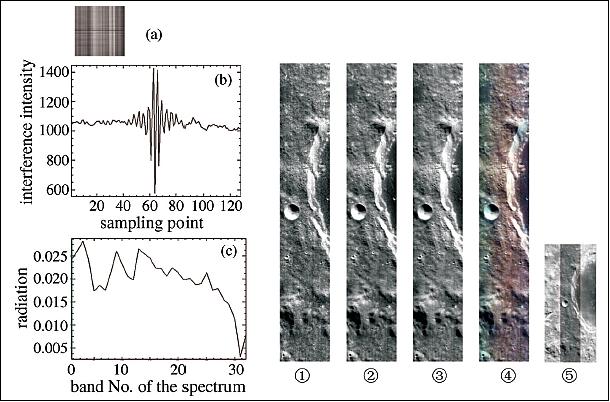
Legend to Figure 22: (a) Interferogram, (b) interferogram curve, (c) spectral curve.
- 1) Spectral image of band No. 4 (its center of wavelength is 504.96 nm)
- 2) Spectral image of band No. 17 (its center of wavelength is 644.64 nm)
- 3) Spectral image of band No. 30 (its center of wavelength is 891.11 nm)
- 4) False color image from band No. 4, No. 17, No. 30
- 5) Relative location of imaging area in the same orbit between image interferometer and CCD Stereo Camera.
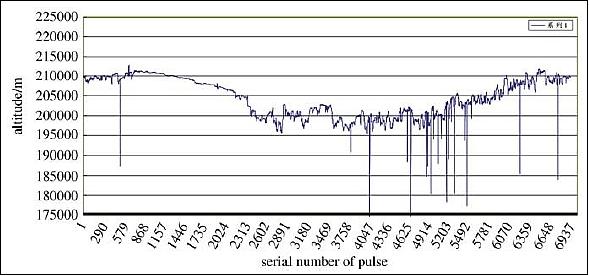
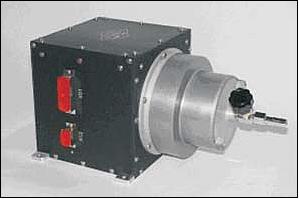
LAM (Laser Altimeter, Moon)
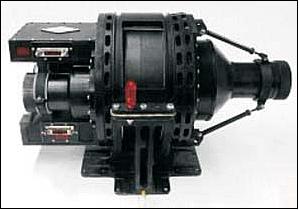
LAM is designed to measure the distance between the spacecraft and the nadir point of the lunar surface. The instrument consists of a laser transmitter and a laser receiver. The laser transmitter utilizes a laser diode pumped Q-switched Nd:YAG laser. The output beam divergence is improved to 0.6 mrad by a Galileo refractor-type collimator. The return pulses are captured by a Cassegrain-type reflector whose aperture is 140 mm; the signal is detected by the Si-APD detector. The travel time of a pulse gives the information of the distance between satellite and the lunar surface.
The LAM circuit box was a control unit used to do the distance measuring and to supply the laser power. The size of the device was 260 mm x 200 mm x 190 mm with a mass of 5.8 kg.
Lunar operating altitude | 200(±25)km |
Spot size (foot print) | < 120 m Ø |
Transmitter wavelength | 1064 nm |
Laser energy/pulse | 150 mJ |
Pulse width | < 7 ns |
Telescope aperture | 140 mm |
PRF (Pulse Repetition Frequency) | 1 Hz |
Range resolution | ≤ 1 m |
Range uncertainty | ≤ 5 m |
Data rate | 384 bit/s |
Instrument mass (total), power | 15.7 kg, 25 W |
The LAM instrument was installed parallel to the Z axis of the orbiter. The boresight of LAM was parallel to the CCD detecting system with a measuring accuracy of ±1'. Both the laser transmitter and receiver telescope were installed facing the lunar surface. The along-track shot spacing was about 1.4 km, assuming a 100% laser ranging probability, and the minimum foot spacing along the equator should be about 7.5 km after two months of measurements.
On Nov. 28, 2007, the LAM instrument was powered on. After several days adjustment and test in orbit, it was changed into normal operating status. The laser altimeter can obtain the elevation data of the whole lunar surface. The data will be used to produce the DEM map of the whole lunar surface.
GRS (Gamma-Ray Spectrometer)
The objective of GRS is to observe the abundance of chemical elements, like C, O, Mg, Al, Si, K, Ca, Fe, Th and U on the planetary surface. The main detector of the instrument is a 12 cm diameter x 7.6 cm long CsI (Tl) crystal. It is surrounded on the sides and back by a single CsI crystal shield, approximately 3 cm thick. This CsI reduces the gamma rays coming from the spacecraft, shield as a charged particle shield, and reduces the Compton background. Two gamma-ray spectra are collected simultaneously, the raw CsI shield spectrum and the CsI (Tl) spectrum in anticoincidence with the CsI shield.
Effective area of the sensor | - Main CsI crystal j 118 mm. |
Energy resolution | ≤ 9% at 662 keV |
Energy range | 300 keV - 9 MeV |
Total energy channels | 512 |
Anticoincidence efficiency | ≥90% |
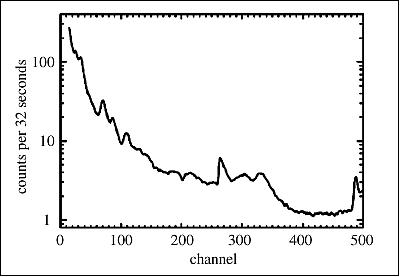
GRS started the normal observation since Nov. 28, 2007. Sample spectra from the GRS that illustrate the excellent quality of the data are shown in Figure 25. It can be seen that typical gamma-ray lines from the lunar surface are clearly identified in the spectra. The data analysis shows that the main performance parameters of GRS met all the requirements of the design.
XRS (X-Ray Spectrometer)
The main goal of XRS is to detect the fluorescent X-ray from the lunar surface and to provide the abundance distribution of three major rock-forming elements: Mg, Al, and Si on the moon. When solar X-rays or Cosmic-rays bombard the lunar surface, some elements will emit fluorescent X-rays. The species of these elements can be identified using the characteristic lines and the abundances can be determined from the intensity of the emitted X-rays.
The elemental composition is crucial in studying not only the geochemical nature of terrains on the moon's surface, but also the history of the impact activity and the volcano-tectonic past on the moon.
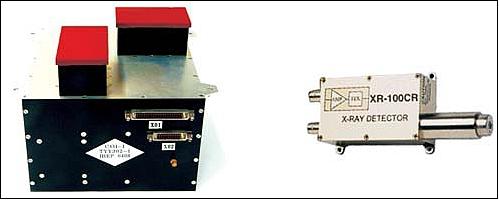
The XRS instrument consists of the lunar X-ray detector and the solar X-ray monitor. The XRS is based on Si-PIN diode technology, a kind of semiconductor detector, having a better energy resolution and less mass than those of proportional counters, which were used in the Apollo-15 and -16 missions and the NEAR mission to the asteroid Eros.
Two types of Si-PIN sensors are used in XRS. One is for the lunar SXD (Soft X-ray Detector) for observations in the range of 1-10 keV, and the other is for the HXD (Hard X-ray Detector) for observations in the range 10-60 keV.
Detection area | - SXD: 1 cm2 (4 units) |
Energy range | - SXD and solar X-ray monitor: 1-10 keV, |
Energy resolution | - HXD: ≤ 10% at 59.5 keV |
Spatial resolution | 170 km x 170 km at an orbital altitude of 200 km |
The commissioning of the XRS instrumentation started at the end of November 2007. It turned out that this activity was coincident with the solar minimum cycle. For comparison, data from NOAA's GOES-XRS instrument, which measured the solar X-ray flux in a soft (1-8 Å and hard (0.5-3 Å) energy band, also showed that during the quiescent period, the solar X-ray had the lowest flux around the A0.3 level.
As the result, no significant elemental characteristic line was found even in the co-adding spectrum from all the SXD during several hours of integration. This situation lasted no longer than 10 days. On December 5, 2007, a sunspot appeared on the east limb of the sun. Then, the solar X-ray flux increased gradually and reached the B1-level in a few days. From Dec. 20, 2007 onwards, the solar X-ray flux started to fall as the sunspot rotated around to the far side of the sun.
During the 15 days of the solar flare period, the spectra obtained by XRS indicated that low energy lines (Mg: 1.25 keV; Al: 1.49 keV and Si: 1.74 keV) were observed and the Calcium (Kα ) line (3.69 keV) was also unambiguous.
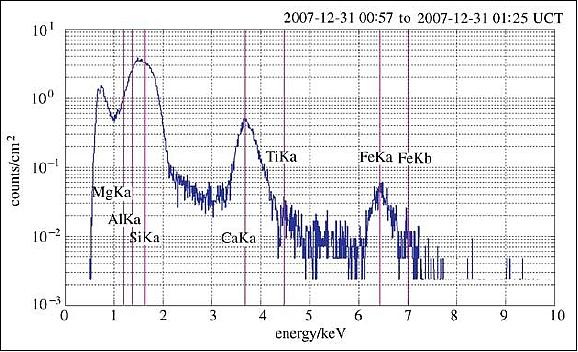
At the end of the year 2007, a big long duration C-class solar flare began at 00:30UTC on Dec. 31, 2007, as shown in Figure 28. The flare lasted for more than 2 hours and nearly 50 minutes corresponding to the XRS observations. When the flare reached its peak C8.7 level, the Chang’e-1 satellite was just flying over the south pole and started to travel northward on the far side of the moon.
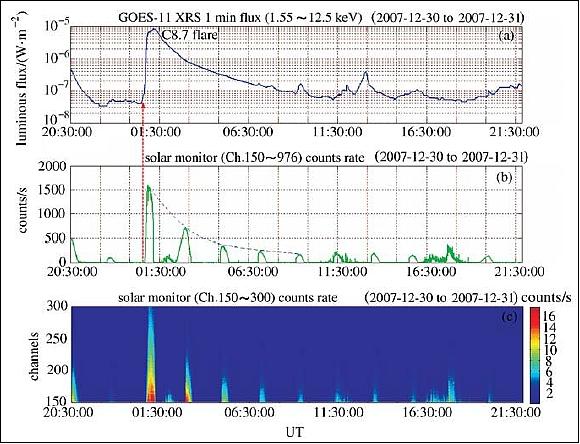
The ground track of XRS was along the 93ºW longitude during the big X-ray flare, and the footprints of the 4 SXD units included areas of only highland lithologies expect the Mare Orientale.
The spectra shown in Figure 29 indicate that a merged peak of low energy lines (Mg: 1.25 keV, Al: 1.49 keV, Si: 1.74 keV) was detected and the Ca Kα-line (3.69 keV) and the Fe Kα (6.40 keV) and Kβ (7.06 keV) lines are also prominent. The quite strong Ca peak implies that the area of lunar surface observed should be enriched in calcium, which coincides with the highland components (eg: anorthosite).
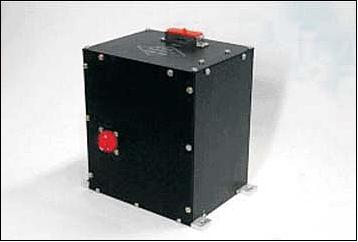
HPD (High-energy Particle Detector)
The objective of HPD , also referred to as HSPD (High-energy Solar Particle Detector), is to observe the heavy ions and protons in the space around the moon. The protons with energies in the range of 4-400 MeV can be detected. The heavy ions, such as He, Li and C, will also be analyzed. Three slices of the semiconductor detector make up the telescope sensor system. When cosmic particles go through the semiconductor detectors, their deposit energy could form electric pulse that is amplified for count. Analyzing the height of the pulse can identify the different particles.
Electrons | E1 ≥ 0.095 MeV |
Protons | P1: 4-8 MeV |
Heavy ions | He: 13-130 MeV. |
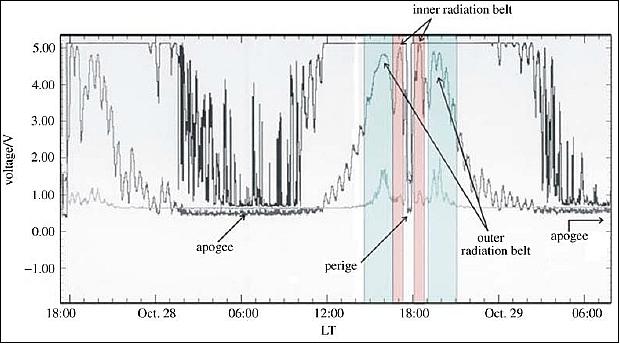
On Oct. 26, 2007, the HPD was powered on. Figure 31 shows the housekeeping parameters response while the satellite was crossing the radiation belt from 2007-10-27 to 2007-10-29. When the satellite entered the moon orbit, the science data show the background noise only and no high energy particle flux was measured due to the solar quiet year. This result is consistent with the anticipation.
SWID (Solar Wind Ion Detector)
Two SWID instruments are designed to analyze the ions with low energy in the same space with high-energy particle detector (HPD). The two detectors are vertical to each other. The solar wind ion detector consists of a collimator, an ion analyzer, and a MCP amplifier.
Particles to be detected | Solar wind ions |
Energy range | 0.05 - 20 keV |
Energy sweep steps | 48 |
FOV (Field of View) | 6.7º x 180º |
Angular resolution | 6.7º x 15º |
Geometric factor | 8.1-10-6 cm2 sr ke. |
On Nov. 26, 2007, SWID was powered on. The observation results show that the data detected by SWID changed periodically, 127 minutes per cycle, and this was identical with the satellite orbit period. Due to the accommodation of the two detectors, installed in different directions, the SWID A instrument detected the solar wind in certain polar angles with the counts increasing and decreasing. The SWID B instrument detected the solar wind in all polar angles with the similar diversification of SWID A. All the results are consistent and expected; they show the instrument is operating nominally and the detected data are available.
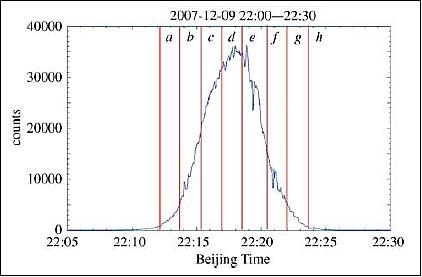
On Dec. 8-9, 2007, the moon was in line between the sun and the Earth, the instruments detected the solar wind plasma.
Figure 33 shows the periodic changes of counts with accumulator of 48 energy steps together at the 9th polar angle with the detector in the solar wind.
Ground Segment
The People's Republic of China and ESA have a long history of scientific collaboration. The first co-operation agreement was signed in 1980, to facilitate the exchange of scientific information. Thirteen years later, the collaboration focused on a specific mission, ESA’s Cluster, to study the Earth's magnetosphere. Then, in 1997, the CNSA invited ESA to participate in Double Star, a two-satellite mission to study the Earth’s magnetic field, but from a perspective which is different from that of Cluster and complementary to it.
During ESA's SMART-1 mission, which ended in September 2006, ESA/ESOC provided China with details of the spacecraft's position and transmission frequencies so that the Chinese could test their tracking stations and ground operation procedures by following it - a part of their preparation for Chang'e-1. 25)
During the development phase of the Chang'e-1 spacecraft, ESA's ground station network ESTRACK was mobilized to provide direct support to China's Chang'e-1 moon mission. The Chang’e-1 mission was supported from the ESA ground stations in Maspalomas and Kourou. During the track on Nov. 1, 2007 for the first time, ESA tracking stations have transmitted telecommands to a Chinese satellite. 26) 27)
This was the culmination of a long preparation performed by BACC (Beijing Aerospace Control Center) and ESOC (European Space Operations Center) that started nearly two years before the launch, where a Chinese delegation visited ESOC in 2005 to explore the possibilities for ESOC to provide tracking support to Chang’e-1. Following detailed discussions on the support ESOC and BACC agreed in February 2006 on a contract to provide the required support.
Following the agreement on the cooperation, ESOC and BACC were faced with the problem of connecting two systems: the BACC missions control system and the ESOC ground station network ESTRACK; this had to happen within the relative short period of one year. The ESOC proposal to BACC was based on ESOC’s model for providing cross support to other agencies such as NASA and JAXA and the proposal from ESOC was to provide the Chang’e-1 support based on CCSDS standards and therefore to provide systems interoperability without modifying the BACC system and the ESOC system. This model hides the implementation on both sides and only defines the interfaces needed to be support on both sides. To measure the success of this the project used the connect of verification and validation.
• Verification: The process of evaluating software to determine whether the products of a given development phase satisfy the conditions imposed at the start of that phase.
• Validation: The process of evaluating software during or at the end of the development process to determine whether it satisfied the specified requirements.
The key to success for this support was the use of a SLE (Space Link Extension) gateway on both sides; therefore ESOC and BACC defined a roadmap to ensure the SLE user function, to be implemented at BACC. The BACC implementation was based on the ESOC SLE API (Application Programming Interface) communication server (using TCP/IP protocols for communications). The problem was that the Chang’e-1 telemetry frame was not compatible with the CCSDS recommendations.
The final suite of CCSDS standards applied to Chang’e-1 (as well as to the follow-up mission Chang’e-2) were:
• Telemetry: SLE Return All Frames (RAF)
• Telecommanding: SLE Command Link Transmission Units (CLTU)
• Orbit Data: Orbit Ephemeris Message (OEM)
• Tracking Data: Tracking Data Message (TDM).
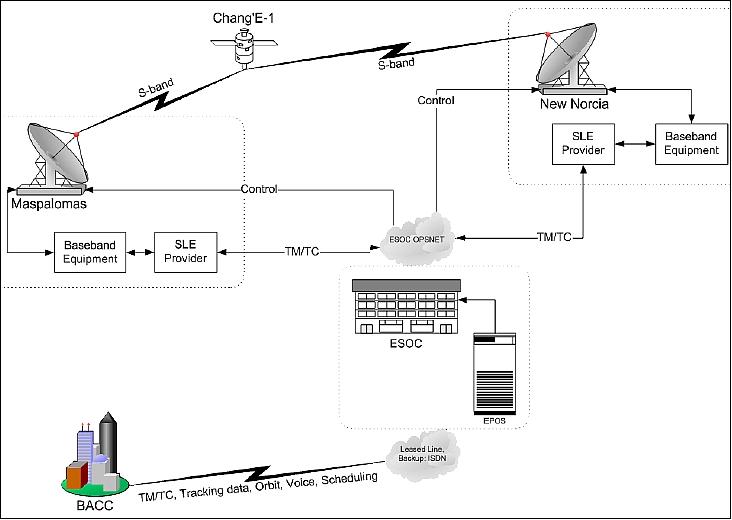
Operations: ESA ground tracking support to China's Chang'e-1 successfully started on November 1, 2007 with the first receipt of telemetry signals from the Chinese mission at ESA's 35 m deep-space station at New Norcia, Australia. Two hours and 39 minutes later, the first telecommands to Chang'e-1 were transmitted via ESA's 15 m station in Maspalomas, Spain, when the satellite was nearly 200,000 km from the Maspalomas station. An hour later, the ESA station in Kourou, French Guiana, also successfully received telemetry and transmitted commands to Chang'e-1.
New Norcia, Maspalomas and Kourou stations are part of ESA's ESTRACK ground station network, and are remotely controlled from ESOC (European Space Operations Center) in Darmstadt, Germany. The successful communications marked a major milestone as this was the first time a telecommand to a Chinese spacecraft has been transmitted from an ESA station. In addition to the receipt of telemetry and transmission of telecommands, the Maspalomas and Kourou stations also performed ranging and Doppler measurements used to determine the spacecraft's location and direction (Ref. 26).
References
1) Li Wang, X. Hou, H. Wang, Q. Zhang, Z. Song, W. Shi, J. Chang, “Present and Prospects for the Chinese Exploration Technology,” Proceedings of the 57th IAC/IAF/IAA (International Astronautical Congress), Valencia, Spain, Oct. 2-6, 2006, IAC-06-A3.6.04
2) “Chang’e Program—China’s Lunar Exploration Activities,” URL: http://sci2.esa.int/Conferences/ILC2005/Manuscripts/HaoXifan-01-DOC.pdf
3) “China Lunar Exploration Program,” Global Space Development Summit, Washington, D.C., USA, November, 12-13, 2009, URL: http://csis.org/files/attachments/091112_Jia.pdf
4) Maohai Huang, “China’s Chang’E Program,” Astronomy from the Moon WG Meeting, 26th IAU GA (International Astronomical Union General Assembly), Prague, Czech Republic, Aug. 14-16, 2006, URL: http://www.astron.nl/moon/pdf/Maohai%20Huang%20-%20Change%20-%20IAU%20GA.pdf
5) “China’s First Lunar Probe - Chang’e 1,” CAST, 2012, URL: http://www.cast.cn/CastEn/Show.asp?ArticleID=17879
6) Huixian Sun, Xiaomin Chen, “The Payload Data Management System for Chang'e-1,” Proceedings of the 59th IAC (International Astronautical Congress), Glasgow, Scotland, UK, Sept. 29 to Oct. 3, 2008, IAC-08.A3.2.A6
7) Yu Zhi-jian, Lu Li-chang, Liu Yung-chun, Dong Guang-liang, “Space operation system for Chang’E program and its capability evaluation,” Journal of Earth System Science, Vol. 114, No 6, Dec. 2005, pp. 795-799, URL: http://www.ias.ac.in/jess/dec2005/ilc-26.pdf
8) “Chang'e-1 - new mission to Moon lifts off,” ESA, Oct. 24, 2007, URL: http://www.esa.int/esaSC/SEMPM53Z28F_index_0.html
9) Ouyang Ziyuan, Li Chunlai, Zou Yongliao, Zhang Hongbo, Lu Chang, Liu Jianzhong, Liu Jianjun, Zuo Wei, Su Yan, Wen Weibin, Bian Wei, Zhao Baochang, Wang Jianyu, Yang Jianfeng, Chang Jin, Wang Huanyu, Zhang Xiaohui, Wang Shijin, Wang Min, Ren Xin, Mu Lingli, Kong Deqing, Wang Xiaoqian, Wang Fang, Geng Liang, Zhang Zhoubin, Zheng Lei, Zhu Xinying, Zheng Yongchun, Li Junduo, Zou Xiaoduan, Xu Chun, Shi Shuobiao, Gao Yifei, Gao Guannan, “Chang’E-1 Lunar Mission: An Overview and Primary Science Results,” Chinese Journal of Space Science, Vol. 30, 2010, pp. 392-403, URL: http://www.cjss.ac.cn/qikan/manage/wenzhang/2010-05-02.pdf
10) Dragon in Space Website, URL: http://www.dragoninspace.com/lunar-exploration/change1.aspx
11) “Missions to the Moon,” Planetary Society, URL: http://www.planetary.org/explore/space-topics/space-missions/missions-to-the-moon.html
12) Huang Yanhong, “Chang'E-1 has blazed a new trail in China's deep space exploration,” Space Ref, Dec. 2, 2009, URL: http://www.spaceref.com/news/viewpr.html?pid=29723
13) W. Zuo, Z.-B. Zhang, X.-Q. Wang, L. Geng , X. Xiao, J.-Z. Liu, J.-J. Liu, X. Tan, X. Ren, L.-Y. Zhang, X.-D. Wang, J.–Q. Feng, L.-L. Mu, G.-L. Zhang, C.-L. Li, “Public Data Release of the Chinese Chang’E Missions,” EPSC Abstracts, Vol. 6, EPSC-DPS2011-995-1, 2011, URL: http://meetingorganizer.copernicus.org/EPSC-DPS2011/EPSC-DPS2011-995-1.pdf
14) Yong-Chun Zheng, Kwing L. Chan, “The First Microwave Image of the Complete Moon,” European Planetary Science Congress 2010, Sept. 20-24, 2010, Rome, Italy, URL: http://lunarscience.nasa.gov/articles/the-first-microwave-image-of-the-complete-moon/
15) Yong-Chun Zheng, Y. L. Zou, K. L. Chan, K. T. Tsang, B. Kong, Z. Y. Ouyang, “Global brightness temperature of the Moon: result from Chang’E-1 microwave radiometer,” EPSC Abstracts, Vol. 5, EPSC2010-224, 2010, European Planetary Science Congress 2010, URL: http://meetings.copernicus.org/epsc2010/abstracts/EPSC2010-224.pdf
16) Yong-Chun Zheng, K. L. Chan, K. T. Tsang, F. Zhang, Y. L. Zou, Z. Y. Ouyang, “The first microwave image of the complete moon from Chang'e-1Lunar Orbiter,” 42nd Lunar and Planetary Science Conference (2011), The Woodlands, TX, USA, March 7-11, 2011, 1352.pdf, URL: http://www.lpi.usra.edu/meetings/lpsc2011/pdf/1352.pdf
17) K. Di, Z. Yue, M. Peng, Z. Lin, “Coregistration og Chang'E-1 Stereo Images and Laser Altimeter Data for 3D Mapping of Lunar Surface,” Special joint symposium of ISPRS Technical Commission IV & AutoCarto in conjunction with ASPRS/CaGIS 2010, Fall Specialty Conference, November 15-19, 2010, Orlando, Florida, USA, URL: http://www.isprs.org/proceedings/XXXVIII/part4/files/Di.pdf
18) J. S. Ping, X. L. Su, Q. Huang, “Recent Selenodetic Progress in Chang'e Lunar Mission,” 41st Lunar and Planetary Science Conference (2010), The Woodlands, TX, USA, March 1-5, 2010, 1059.pdf, URL: ftp://ftp.lpi.usra.edu/pub/outgoing/lpsc2010/full616.pdf
19) Q. Huang, J. S. Ping , M. A. Wieczorek, J. G. Yan, X. L. Su, “Improved global lunar topographic model by Chang'e-1 laser altimeter data,” 41st Lunar and Planetary Science Conference (2010), The Woodlands, TX, USA, March 1-5, 2010, 1265.pdf, URL: http://www.lpi.usra.edu/meetings/lpsc2010/pdf/1265.pdf
20) Ouyang Ziyuan, Jiang Jingshan, Li Chunlai, Sun Huixian, Zou Yongliao, Liu Jianzhong, Liu Jianjun, Zhao Baochang, Ren Xin, Yang Jianfeng, Zhang Wenxi, Wang Jianyu, Mou Lingli, Chang Jin, Zhang Liyan, Wang Huanyu, Li Yongquan, Zhang Xiaohui, Zheng Yongchun, Wang Shijin, Bian Wei, “Preliminary Scientific Results of Chang’E-1 Lunar Orbiter: Based on Payloads Detection Data in the First Phase,” Chinese Journal of Space Science, Vol. 28, No 5, 2008, pp. 361-369, URL: http://www.cjss.ac.cn/qikan/manage/wenzhang/2008-05-01.pdf
21) Sun Huixian, Wu Ji, Dai Shuwu, Zhao Baochang, Shu Rong, Chang Jin, Wang Huanyu, Zhang Xiaohui, Ren Qiongying, Chen Xiaomin, Ouyang Ziyuan, Zou Yongliao, “Introduction to the payloads and the initial observation results of Chang’E-1,” Chinese Journal of Space Science, Vol. 28, No 5, 2008, pp. 374-384, URL: http://www.cjss.ac.cn/qikan/manage/wenzhang/2008-05-03.pdf
22) Jingshan Jiang, Zhenzhan Wang, Xiaohui Zhang, Yun Li, Xuefei Wang , Tao Wang, “China Lunar Probe Chang'e-1 Microwave Sounder, Design and some Results,” Proceedings of IGARSS (IEEE International Geoscience and Remote Sensing Symposium) 2010, Honolulu, HI, USA, July 25-30, 2010
23) “Change-2 Satellite's Camera Resolution Reaches One Meter,” Space Mart, Jan. 14, 2010, URL: http://www.spacemart.com/.../Change_2_Satellite_Camera_Resolution_Reaches_One_Meter
24) Qian Huang, Jingsong Ping, Jianguo Yan , Jianfeng Cao , Geshi Tang, Rong Shu, “Chang’E-1 Laser Altimetry Data Processing,” URL: ftp://202.127.24.130/pub/pjs/%D6%D0%B9%FA%BF%C6%D1%A7%D7%A8%BC%AD/AOGS-PS-0134_1.doc
25) “ESA tracking support essential to Chinese mission,” ESA, Oct. 26, 2007, URL: http://www.esa.int/esaCP/SEMB0DJJX7F_index_0.html
26) G. Billig, E. Sørensen, Xi Luhua, “Chinese Lunar missions Chang’E-1 and Chang’E-2 and the ESOC support: an example of systems interoperability,” Proceedings of SpaceOps 2012, The 12th International Conference on Space Operations, Stockholm, Sweden, June 11-15, 2012
27) Barry E. DiGregorio, “Chinese Satellite Arrives at Moon - Radio tracking and control a technical and political feat,” IEEE Spectrum, Nov. 5, 2007, URL: http://spectrum.ieee.org/aerospace/space-flight/chinese-satellite-arrives-at-moon
The information compiled and edited in this article was provided by Herbert J. Kramer from his documentation of: ”Observation of the Earth and Its Environment: Survey of Missions and Sensors” (Springer Verlag) as well as many other sources after the publication of the 4th edition in 2002. - Comments and corrections to this article are always welcome for further updates (eoportal@symbios.space).