Chandrayaan-1
Non-EO
ISRO
Quick facts
Overview
| Mission type | Non-EO |
| Agency | ISRO |
| Launch date | 22 Oct 2008 |
| End of life date | 28 Aug 2009 |
Chandrayaan-1 Lunar Mission
Spacecraft Launch Mission Status Sensor Complement References
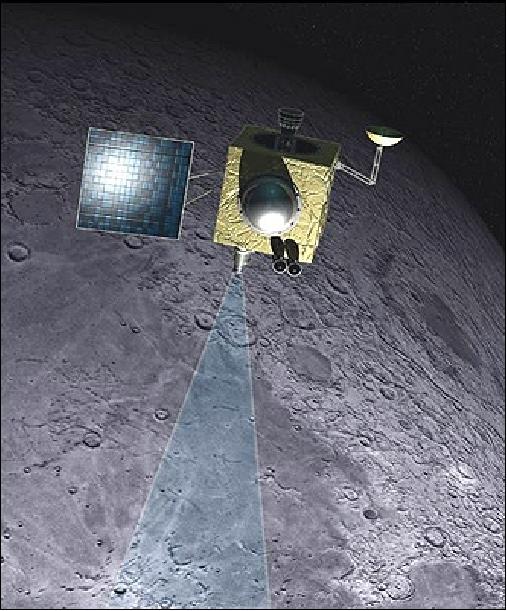
Chandrayaan-1 is India's first mission to the moon, designed and developed by ISRO (Indian Space Research Organization), Bangalore, India. This science mission represents a new dimension and a true challenge in the Indian Space Program. In Hindi, the term chandra means moon, yaan means ship (a litteral translation is MoonCraft). Major science mission objectives are: 1) 2)
• To provide high-resolution mineralogical and chemical imaging of the global surface of the moon, with stereographic coverage of most of the moon's surface with 5 m resolution, to provide new insights in understanding the moon's origin and evolution
• To search for surface or sub-surface water-ice, especially at the lunar poles and study of permanently shadowed north and south polar regions
• To identify chemical end members of lunar highland rocks
• To observe the X-ray (and γ-ray) spectrum in the energy region of 10-200 keV to provide information on lunar volatiles.
Background
A lunar program initiative at ISRO was started by K. Kasturirangan, Chairman of ISRO in 1999. Initial planning of the moon mission at ISRO started in 2000. The Chandrayaan mission was announced by the Prime Minister of India, Mr. Atal Bihari Vajpayee, on August 15, 2003 (Indian Independence Day) as a goal of India's Space Program.
In January 2004, an AO (Announcement of Opportunity), released by ISRO, invited proposals for additional international instruments. A total payload mass of 10 kg, out of the planned 55 kg payload, were offered to the international scientific community. Of the 16 international proposals received, 5 were selected for flight. In September 2004, ISRO announced a possible launch date of the Chandrayaan-1 mission for the fall 2007 or early 2008. As of May 2006, the ISRO sensor complement onboard Chandrayaan-1 consists of the following instruments/payloads: TMC, HySI, LLRI and HEX, as well as MIP (Moon Impact Probe).
• The heads of ESA and ISRO signed a cooperative agreement on June 27, 2005 to include European instruments on board the Chandrayaan-1 spacecraft. ESA provides three instruments of SMART-1 heritage: CIXS, SARA, and SIR-2; in addition, ESA contributes to the hardware of HEX, an ISRO instrument. ESA and ISRO will also share the data resulting from their respective experiments. - A series of discussions between ESA and ISRO concerning the Indian lunar mission were already held at the occasion of lunar and planetary conferences in the timeframe 2002-2004.
• Another agreement was signed between ISRO and the Bulgarian Academy of Sciences. The instrument selected is RADOM.
• The Chandrayaan-1 mission represents also an important step forward in U.S.-India space ties. On May 9, 2006, a MOU (Memorandum of Understanding) was signed between ISRO (G. Madhavan Nair) and NASA (Michael D. Griffin)) in Bangalore, India, to include two NASA instruments (Mini-SAR and M3) on the Chandrayaan-1 spacecraft.
The visit of the NASA Administrator Michael Griffin was predated by an India-US "Conference on Space Science, Applications and Commerce" in Bangalore during June 21-25, 2004. An outcome of this conference was the establishment of a Joint Working Group to enhance the cooperation in civil space projects between India and USA. The Joint Working Group met for the first time in June 2005 in Bangalore. 3) 4)
These instrument commitments along with other operational services and collaborations make Chandrayaan-1 a truly international cooperative moon mission.
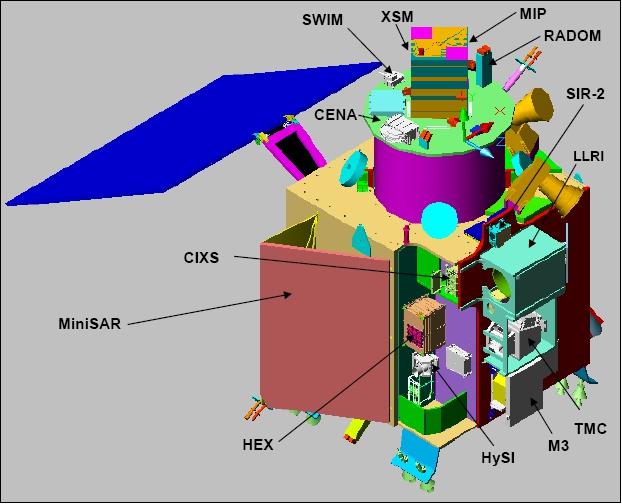
Spacecraft
The spacecraft design makes use of the flight-proven IRS series bus (and of Kalpana-1/MetSat-1 heritage). The spacecraft bus is a cube of 1.5 m side length with a dry mass of 550 kg. Electric power of 750 W is provided by a canted solar array which charges a Li-ion battery.
A bipropellant propulsion system is used to transfer Chandrayaan-1 into lunar orbit and to maintain attitude. The spacecraft is 3-axis stabilized using attitude control thrusters and reaction wheels. Attitude knowledge is provided by star sensors, accelerometers, and an inertial reference unit.
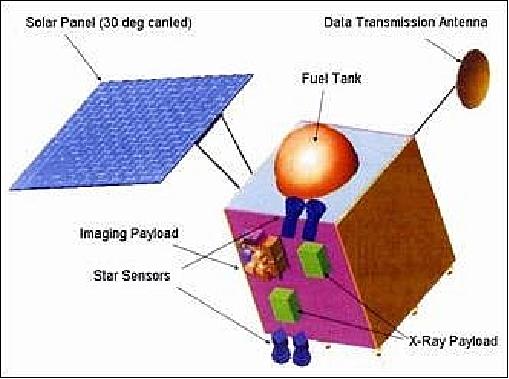
RF communications: The S-band is used for TT&C operations while the X-band provides the downlink for all science data. The onboard SSR-1 (Solid State Recorder-1) is downlinked in X-band at a data rate of 8.4 Mbit/s. The SSR-1 capacity is sized for a 20 minute source data input at 50 Mbit/s (the readout/downlink period is 50 minutes). A data compression scheme is used (both lossy and lossless) to reduce the downlink volume. 5)
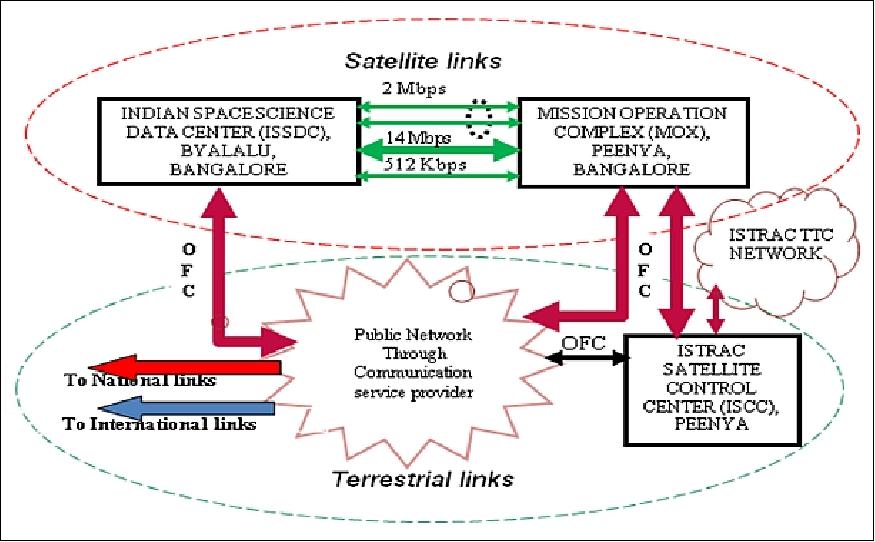
The initial GTO and cruise phases of the spacecraft are being tracked by ISRO's existing S-band network of ISTRAC (ISRO Telemetry and Command Center) stations, up to a slant range of 100, 000 km. Furthermore, a DSN station is being proposed to be installed at Bangalore, and a limited worldwide DSN network of NASA in the early mission phases. 6)
Launch
A launch of Chandrayaan-1 spacecraft took place on October 22, 2008 on a PSLV (Polar Satellite Launch Vehicle, PSLV-C11) from the Satish Dhawan Space Center (SDSC) in Sriharikota, India. 7) 8)
• The launch mass is 1050 kg and the initial orbit is a quasi-GTO (Geosynchronous Transfer Orbit) of 240 km x 24,000 km and an inclination of 18º. 9)
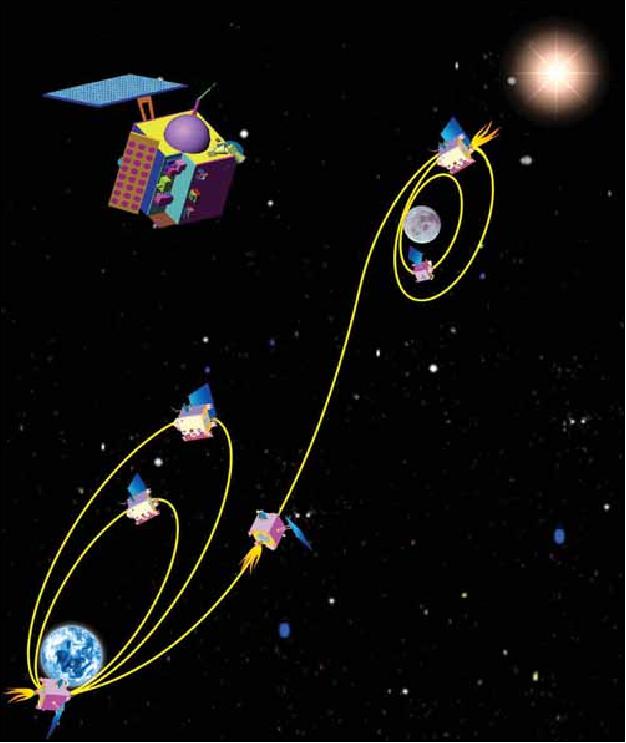
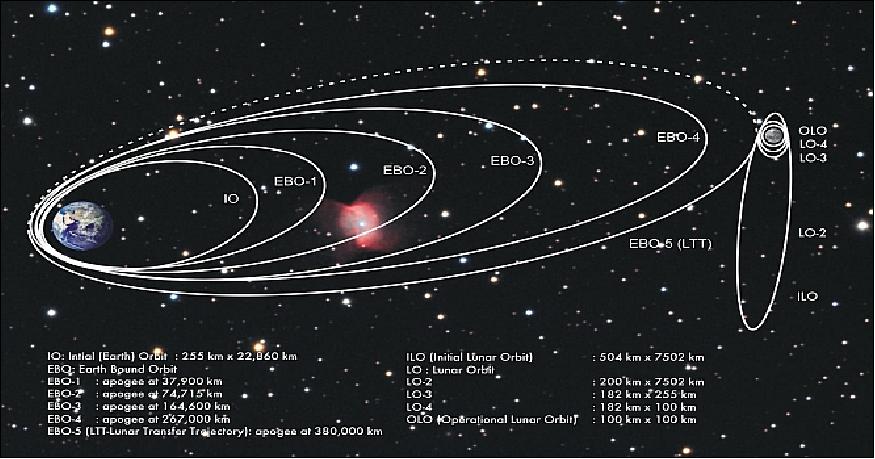
• Subsequently, the spacecraft's own propulsion system will be used intermittently for the lunar transfer trajectory (LTT) in a period of about 5.5 days.
• After the cruse phase to the moon, the spacecraft will be captured into an initial 1000 km lunar insertion orbit which will be lowered to a 200 km (checkout orbit), and finally into a 100 km altitude circular polar orbit (science orbit of the moon).
• The lunar orbital mass of the spacecraft is 550 kg, of which the payload mass is 55 kg (nominal mission design life of 2 years).
Lunar orbit: Once Chandrayaan-1 is in its final circular polar orbit at a 100 km altitude, a MIP (Moon Impact Probe) of 25 kg mass will be released and descend to the lunar surface in a hard landing mode. - MIP itself carries 3 more instruments: a high-resolution mass spectrometer, an S-band altimeter, and a video camera that can study the lunar surface as it crashes onto the moon. The effect of the device's impact will be used to analyze the chemical composition of the moon's dust.
Mission Status
• August 20, 2018: Ice Confirmed at the Moon's Poles: In the darkest and coldest parts of its polar regions, a team of scientists has directly observed definitive evidence of water ice on the Moon's surface. These ice deposits are patchily distributed and could possibly be ancient. At the southern pole, most of the ice is concentrated at lunar craters, while the northern pole's ice is more widely, but sparsely spread. 10)
- A team of scientists, led by Shuai Li of the University of Hawaii and Brown University and including Richard Elphic from NASA's Ames Research Center in California's Silicon Valley, used data from NASA's Moon Mineralogy Mapper (M3) instrument to identify three specific signatures that definitively prove there is water ice at the surface of the Moon. 11)
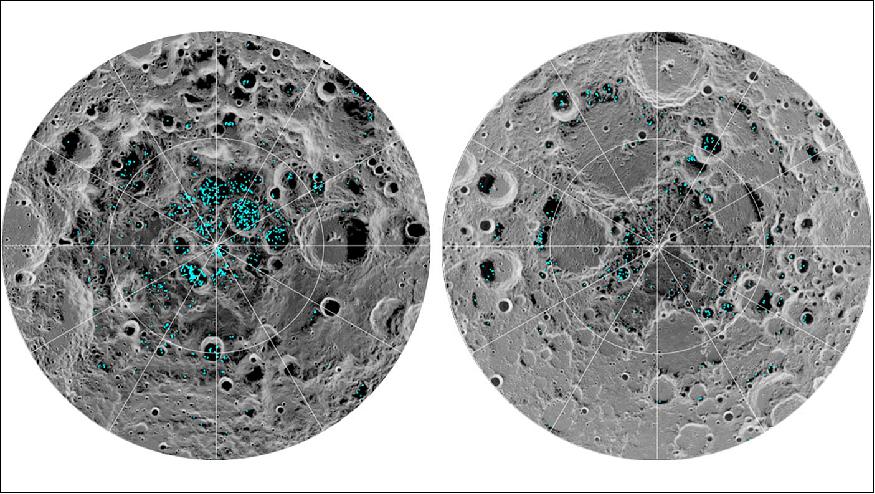
- M3, aboard the Chandrayaan-1 spacecraft, launched in 2008 by ISRO (Indian Space Research Organization), was uniquely equipped to confirm the presence of solid ice on the Moon. It collected data that not only picked up the reflective properties we'd expect from ice, but was able to directly measure the distinctive way its molecules absorb infrared light, so it can differentiate between liquid water or vapor and solid ice.
- Most of the newfound water ice lies in the shadows of craters near the poles, where the warmest temperatures never reach above minus 250 degrees Fahrenheit (-156ºC). Because of the very small tilt of the Moon's rotation axis, sunlight never reaches these regions.
- Previous observations indirectly found possible signs of surface ice at the lunar south pole, but these could have been explained by other phenomena, such as unusually reflective lunar soil.
- With enough ice sitting at the surface — within the top few mm — water would possibly be accessible as a resource for future expeditions to explore and even stay on the Moon, and potentially easier to access than the water detected beneath the Moon's surface.
- Learning more about this ice, how it got there, and how it interacts with the larger lunar environment will be a key mission focus for NASA and commercial partners, as we endeavor to return to and explore our closest neighbor, the Moon.
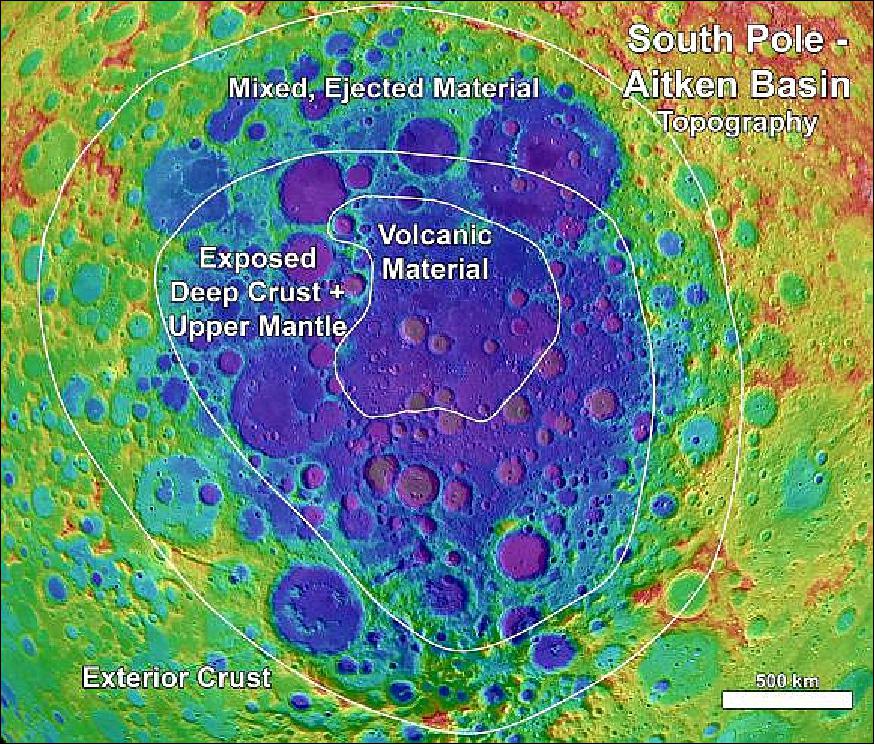
• February 28, 2018: A detailed study of a giant impact crater on the Moon's far side could provide a roadmap for future lunar explorers. The study, by planetary scientists from Brown University, maps the mineralogy of the SPA (South Pole-Aitken) basin, a gash in the lunar surface with a diameter of approximately 2,500 km. SPA is thought to be the oldest and largest impact basin on the Moon, and scientists have long had their eyes on it as a target for future lunar landers. 12)
- "This is a highly detailed look at the compositional structure of this huge impact basin using modern, cutting-edge data," said Dan Moriarty, a postdoctoral researcher at NASA's Goddard Space Flight Center who led the research while a doctoral student at Brown. "Given that it's such an important target for future exploration and perhaps returning a sample to Earth, we hope this will serve as a framework for more detailed study and landing site selection."
- The impact that created SPA is thought to have blasted all the way through the Moon's crust and into the mantle, which is part of the reason that scientists are so interested in it. Visiting SPA and grabbing a sample of that exposed mantle material could provide critical clues about the Moon's origin and evolution. A sample could also help scientists put a firm date on the impact. SPA is thought to be the Moon's oldest basin, so a firm date would be a key milestone in the timeline of lunar history as well as events affecting early Earth.
- But in order to get the right samples, it's important to know the best spots to find them. That's what Moriarty and co-author Carlé Pieters, a professor in Brown's Department of Earth, Environmental and Planetary Sciences, had in mind for this study. They used detailed data from M3 (Moon Mineralogy Mapper), a NASA spectrometer that flew aboard India's Chandrayaan-1 spacecraft for which Pieters is principal investigator. 13)
- "Having global access with modern imaging spectrometers from lunar orbit is the next best thing to having a geologist with a rock hammer doing the field work across the surface." Pieters said. "Ideally, in the future we'll have both working together."
- The research identified four distinct mineralogical regions that form a bullseye pattern within and around the basin. At the bulleye's center is a region of what appears to be deposits of volcanic material, a sign that the center of the basin may have been covered by a volcanic flow sometime soon after the SPA impact. That central region is surrounded by a ring of material dominated by magnesium-rich pyroxene, a mineral thought to be plentiful in the lunar mantle. Outside of that is a ring in which pyroxene mixes with the standard crustal rocks of the lunar highlands. Outside of that ring is the basin exterior, where the signatures of impact-related material disappear.
- The findings have some interesting implications for SPA exploration, the researchers say. The research suggests, for example, that finding pristine mantle material in the middle of the basin might be a bit tricky because of the large volcanic deposit.
- "That's a little bit counterintuitive," Moriarty said. "Typically the deepest excavation would be in the middle of the crater. But we show that the middle of SPA has been covered over by what looks like a volcanic flow."
- So if you're looking for mantle, it might be wise to land in the ring surrounding the center, where what appears to be mantle material is highly concentrated.
- But an ideal landing site, Moriarty says, might be a spot that has both mantle and volcanic material, because those volcanics are interesting in their own right. Their composition is a little different than that of other volcanic rocks found on the Moon, which suggests they have a unique origin.
- "If these rocks are indeed volcanic, it means that there was a really interesting kind of volcanism happening at SPA," Moriarty said. "It could be related to the extreme geophysical environment that would have been in place during the formation of the basin. That would be really interesting to look at in more depth."
- With that in mind, Moriarty says a good spot to land might be near the border of the volcanic center and the pyroxene ring. Another strategy could be to look for a spot where the volcanic material has been pierced by a subsequent impact. Moriarty and Pieters found several such craters in the volcanic patch where the pyroxene material has been re-excavated.
- "We think going after both mantle and volcanics would make for a richer science return," Moriarty said. Moriarty is hopeful that these findings will give mission planners something to think about. China is currently in the process of planning for a mission to SPA. The region has appeared repeatedly on NASA's "decadal survey" of planetary scientists, which is used to inform the agency's mission priorities.
- "Impacts are the dominant process that drove solar system creation and evolution, and SPA is the largest confirmed impact structure on the Moon, if not the entire solar system," Moriarty said. "That makes it an important end member in understanding impact processes. We think this work could provide a roadmap for exploring SPA in more detail."
- The research was supported by NASA's LASER (NNX12AI96G) and SSERVI (NNA14AB01A) programs.
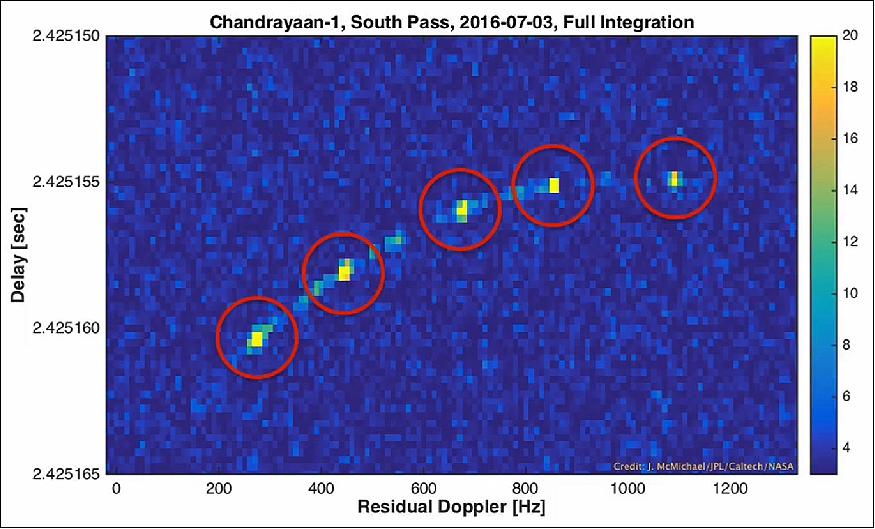
• March 9, 2017: Finding derelict spacecraft and space debris in Earth's orbit can be a technological challenge. Detecting these objects in orbit around Earth's moon is even more difficult. Optical telescopes are unable to search for small objects hidden in the bright glare of the moon. However, a new technological application of interplanetary radar pioneered by scientists at NASA's Jet Propulsion Laboratory in Pasadena, California, has successfully located spacecraft orbiting the moon — one active, and one dormant. This new technique could assist planners of future moon missions. 14)
- "We have been able to detect NASA's LRO (Lunar Reconnaissance Orbiter) and the Indian Space Research Organization's Chandrayaan-1 spacecraft in lunar orbit with ground-based radar," said Marina Brozovic, a radar scientist at JPL and principal investigator for the test project. "Finding LRO was relatively easy, as we were working with the mission's navigators and had precise orbit data where it was located. Finding India's Chandrayaan-1 required a bit more detective work because the last contact with the spacecraft was in August of 2009."
- Add to the mix that the Chandrayaan-1 spacecraft is very small, a cube about 1.5 m on each side — about half the size of a smart car. Although the interplanetary radar has been used to observe small asteroids several million miles from Earth, researchers were not certain that an object of this smaller size as far away as the moon could be detected, even with the world's most powerful radars. Chandrayaan-1 proved the perfect target for demonstrating the capability of this technique.
- While they all use microwaves, not all radar transmitters are created equal. The average police radar gun has an operational range of about 1.6 km, while air traffic control radar goes to about 100 km. To find a spacecraft 380,000 km away, JPL's team used NASA's 70 m antenna at NASA's Goldstone Deep Space Communications Complex in California to send out a powerful beam of microwaves directed toward the moon. Then the radar echoes bounced back from lunar orbit were received by the 100 m Green Bank Telescope in West Virginia.
- Finding a derelict spacecraft at lunar distance that has not been tracked for years is tricky because the moon is riddled with mascons (regions with higher-than-average gravitational pull) that can dramatically affect a spacecraft's orbit over time, and even cause it to have crashed into the moon. JPL's orbital calculations indicated that Chandrayaan-1 is still circling some 200 km above the lunar surface, but it was generally considered "lost."
- However, with Chandrayaan-1, the radar team utilized the fact that this spacecraft is in polar orbit around the moon, so it would always cross above the lunar poles on each orbit. So, on July 2, 2016, the JPL team pointed Goldstone and Green Bank at a location about 16o km above the moon's north pole and waited to see if the lost spacecraft crossed the radar beam. Chandrayaan-1 was predicted to complete one orbit around the moon every two hours and 8 minutes. Something that had a radar signature of a small spacecraft did cross the beam twice during four hours of observations, and the timings between detections matched the time it would take Chandrayaan-1 to complete one orbit and return to the same position above the moon's pole.
- The team used data from the return signal to estimate its velocity and the distance to the target. This information was then used to update the orbital predictions for Chandrayaan-1.
- "It turns out that we needed to shift the location of Chandrayaan-1 by about 180 degrees, or half a cycle from the old orbital estimates from 2009," said Ryan Park, the manager of JPL's Solar System Dynamics group, who delivered the new orbit back to the radar team. "But otherwise, Chandrayaan-1's orbit still had the shape and alignment that we expected."
- Radar echoes from the spacecraft were obtained seven more times over three months and are in perfect agreement with the new orbital predictions. Some of the follow-up observations were done with the Arecibo Observatory in Puerto Rico, which has the most powerful astronomical radar system on Earth. Arecibo is operated by the NSF (National Science Foundation) with funding from NASA's Planetary Defense Coordination Office for the radar capability.
- Hunting down LRO (Lunar Reconnaissance Orbiter) and rediscovering Chandrayaan-1 have provided the start for a unique new capability. Working together, the large radar antennas at Goldstone, Arecibo and Green Bank demonstrated that they can detect and track even small spacecraft in lunar orbit. Ground-based radars could possibly play a part in future robotic and human missions to the moon, both for a collisional hazard assessment tool and as a safety mechanism for spacecraft that encounter navigation or communication issues.
- JPL manages and operates NASA's DSN (Deep Space Network), including the Goldstone Solar System Radar, and hosts the Center for Near-Earth Object Studies for NASA's Near-Earth Object Observations Program, an element of the Planetary Defense Coordination Office within the agency's Science Mission Directorate.
- While the rediscovery of the Chandrayaan-1 orbit after 8 years of silence is indeed a great achievement of the NASA radar technology, the unpowered spacecraft won't come to life again.
Chandrayaan-1, the polar Lunar orbiter mission of ISRO (Indian Space Research Organization), successfully carried out study of Moon's environment and surface processes for a period of about nine months during 2008–2009. The results obtained by the mission established (i) A tenuous but active hydrosphere (ii) Volcanically active and geologically dynamic Moon and (iii) Global melting of Moon's surface regions and formation of magma ocean early in the history of Moon.
Chandrayaan-1 was equipped with a dozen instruments, including an impact probe, which housed three additional instruments. The results obtained by four instruments viz. Chandra's Altitudinal Composition Explorer, Moon Mineral Mapper (M3), SWIM (Solar Wind Monitor) and Mini-SAR (Miniature Synthetic Aperture Radar) gave an insight into an active hydrosphere, with several complex processes operating between lunar surface and its environment. These inferences are based on identification of H, OH, H2O, CO2, Ar etc. in the lunar atmosphere. There are indications that several young (~2 to100 Ma) volcanic regions are present on the Moon as shown by integrated studies using Terrain Mapping Camera and M3 of Chandrayaan-1 and data from other contemporary missions i.e. Kaguya and LRO (Lunar Reconnaissance Orbiter). These data establish that Moon has a dynamic and probably still active interior, in contrast to the generally accepted concept of dormant and quiet Moon.
The discovery of Mg spinel anorthosites and finding of kilometer sized crystalline anorthosite exposures by M3 support the formation of global magma ocean on Moon and differentiation early in its evolutionary history. Furthermore, X-ray Spectrometer data showed anorthositic terrain with composition, high in Al, poor in Ca and low in Mg, Fe and Ti in a nearside southern highland region.
This mission provided excellent opportunity for multilateral international cooperation and collaboration in instrumentation and observation in which a dozen countries participated and contributed to the success of the mission.
Findings of Water on the Moon
• August 2013: Scientists have detected magmatic water — water that originates from deep within the Moon's interior — on the surface of the Moon. These findings represent the first such remote detection of this type of lunar water, and were arrived at using data from NASA's M3 (Moon Mineralogy Mapper) on Chandrayaan-1 of ISRO. 16) 17)
Spectroscopic data from the M3 instrument were analyzed which showed that the central peak of Bullialdus Crater is significantly enhanced in hydroxyl relative to its surroundings. It is concluded that the strong and localized hydroxyl absorption features are inconsistent with a surficial origin. Instead, they are consistent with hydroxyl bound to magmatic minerals that were excavated from depth by the impact that formed Bullialdus Crater. Furthermore, estimates of thorium concentration in the central peak using data from the Lunar Prospector orbiter indicate an enhancement in incompatible elements, in contrast to the compositions of water-bearing lunar samples. 18)
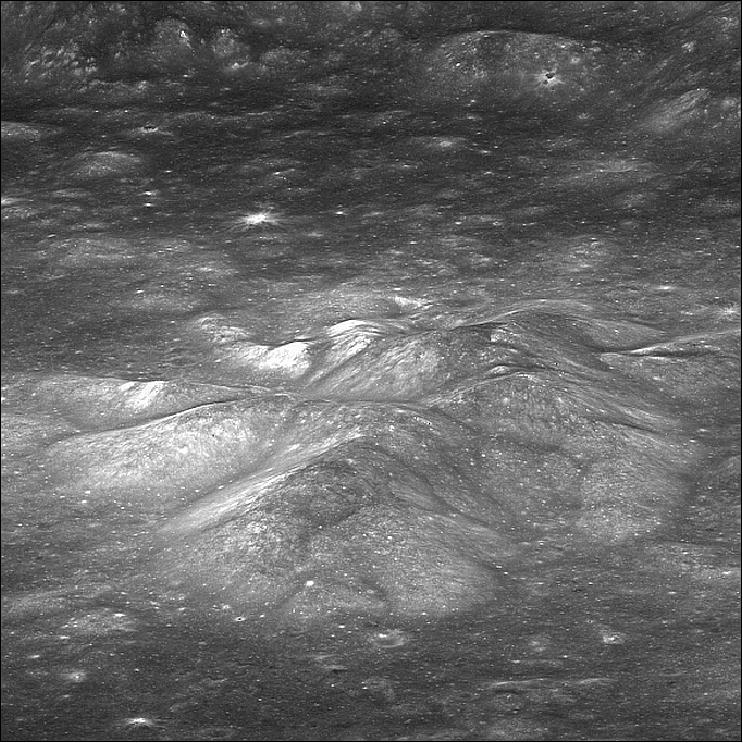
M3 fully imaged the large impact crater Bullialdus in 2009. It's within 25º latitude of the equator and so not in a favorable location for the solar wind to produce significant surface water. The rocks in the central peak of the crater are of a type called norite that usually crystallizes when magma ascends but gets trapped underground instead of erupting at the surface as lava. Bullialdus crater is not the only location where this rock type is found, but the exposure of these rocks combined with a generally low regional water abundance enabled us to quantify the amount of internal water in these rocks. 19) 20)
The detection of internal water from orbit means scientists can begin to test some of the findings from sample studies in a broader context, including in regions that are far from where the Apollo sites are clustered on the near side of the moon. For many years, researchers believed that the rocks from the moon were bone-dry and any water detected in the Apollo samples had to be contamination from Earth (Ref. 17).
• In early March 2010, NASA and ISRO are reporting, that Mini-SAR (also spelled as "MiniSAR") data analysis has revealed ice deposits near the moon's north pole. Mini-SAR had imaged many of the permanently shadowed regions that exist at both poles of the moon. These dark areas are extremely cold and it has been hypothesized that volatile material, including water ice, could be present in quantity here. The main science object of the Mini-SAR experiment was to map and characterize any deposits that exist. 21) 22)
The Mini-SAR instrument found more than 40 small craters (2-15 km in diameter) with sub-surface water ice located at their base. The interior of these craters is in permanent sun shadow. Paul Spudis, the PI of Mini-SAR said: "The new discoveries by Chandrayaan-1 and other lunar missions show that the moon is an even more interesting and attractive scientific, exploration and operational destination than people had previously thought."
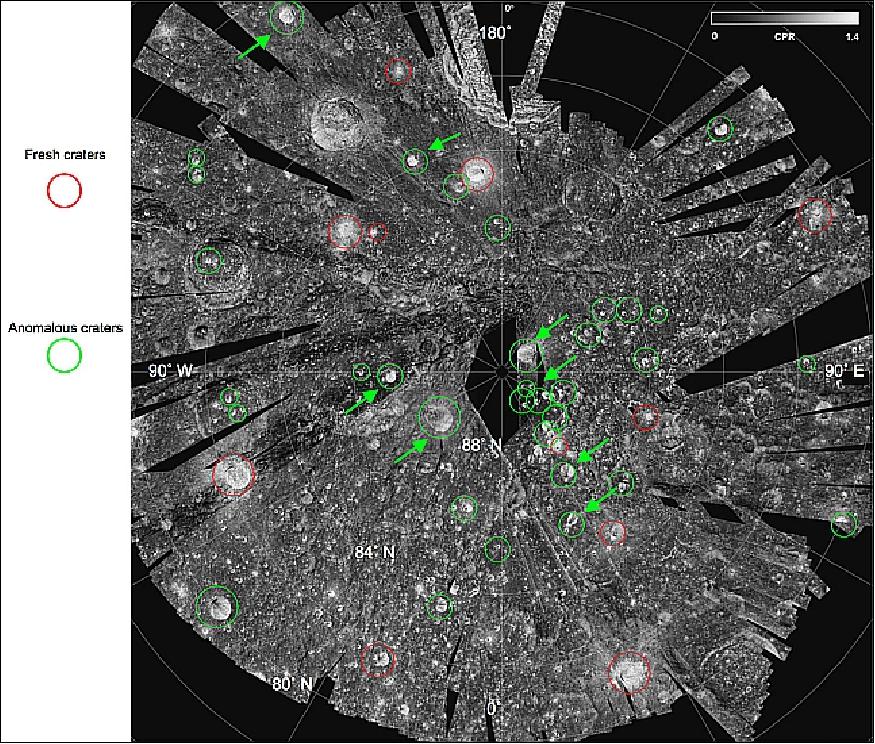
Legend to Figure 11: Mini-SAR map of the Circular Polarization Ratio (CPR) of the north pole of the Moon. Fresh, "normal" craters (red circles) show high values of CPR inside and outside their rims. This is consistent with the distribution of rocks and ejected blocks around fresh impact features, indicating that the high CPR here is surface scattering. The "anomalous" craters (green circles) have high CPR within, but not outside their rims. Their interiors are also in permanent sun shadow. These relations are consistent with the high CPR in this case being caused by water ice, which is only stable in the polar dark cold traps. The project estimates over 600 million cubic meters (1 cubic meter = 1 metric ton) of water in these features.
• In late September 2009, a team of scientists announced finding water molecule signatures across much of the moon's surface with measurements taken by the M3 (Moon Mineralogy Mapper) of NASA. 23)
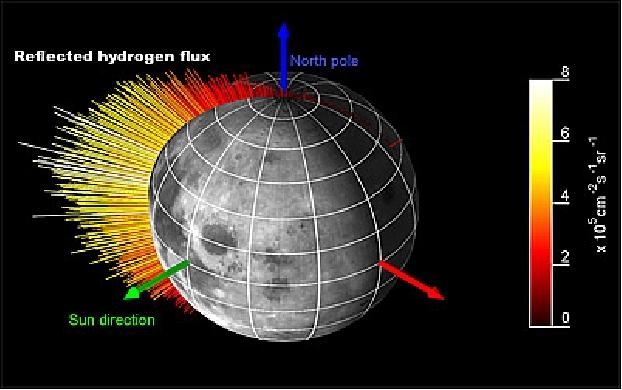
• In October 2009, a second instrument on board India's Chandrayaan-1's lunar orbiter confirmed how the water is being produced. The SARA (Sub keV Atom reflecting Analyzer) instrument of ESA and ISRO confirms the findings of the M3 instrument that solar hydrogen nuclei are indeed being absorbed by the lunar regolith (a loose collection of irregular dust grains on the lunar surface known as regolith). However, SARA data show that not every proton is absorbed. One out of every five rebounds into space. In the process, the proton joins with an electron to become an atom of hydrogen. - The moon acts like a big sponge that absorbs electrically charged particles given out by the sun. These particles interact with the oxygen present in some dust grains on the lunar surface, producing water. 24)
• On Aug. 29, 2009, ISRO lost abruptly contact with the Chandrayaan-1 spacecraft. All attempts failed to recover the mission. As a consequence, ISRO declared the mission to be terminated. The spacecraft has completed 312 days in orbit making more than 3400 orbits around the moon. The planned mission of two years was cut in half. ISRO said the mission was a great success, about 95% of the mission objectives were completed including the collection of over 70,000 images. 25) 26)
During the Chandrayaan-1 mission, the Mini-SAR instrument acquired more than 300 image strips of the Moon, covering more than 90% of both polar regions.
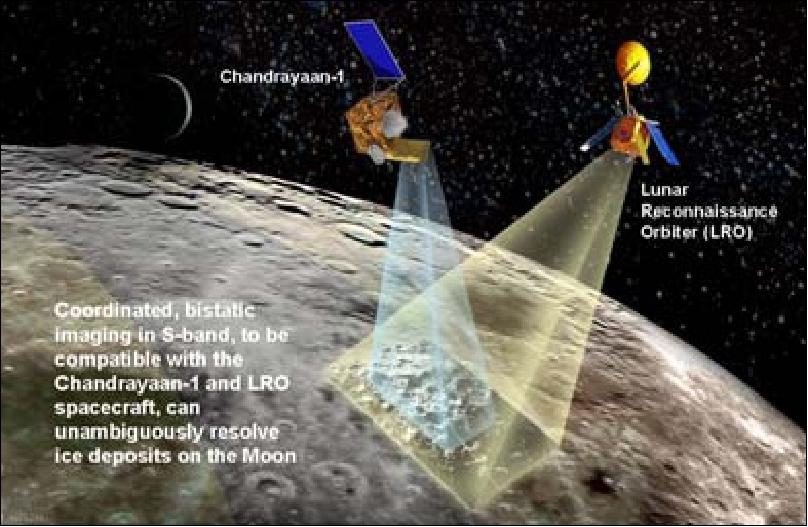
• A planned bi-static radar experiment, involving the Mini-SAR instrument on Chandrayaan-1 and on the LRO spacecraft of NASA, was attempted on Aug. 20, 2009. The objective was to look for possible water ice hiding in polar craters on the moon from locations in nearby orbits. However, while the Mini-SAR on LRO performed the observation, the Mini-SAR on the Chandrayaan-1 spacecraft wasn't able to point into the common target direction to conduct the joint observations in stereo. 27)
• On July 17, 2009, the Chandrayaan-1 spacecraft completed 3000 orbits around the moon. The onboard star sensor used for determining the orientation of the spacecraft started malfunctioning on April 26, 2009. To overcome this anomaly, ISRO devised an innovative technique of using redundant sensors (gyroscopes) along with antenna pointing information and images of specific location on the surface of the moon, for determining the orientation of the spacecraft.
• Orbit raising maneuver on May 19, 2009. After the successful completion of all the major mission objectives, the orbit of Chandrayaan-1 spacecraft, which was at an altitude of 100 km from the lunar surface since November 2008, has now been raised to 200 km. The spacecraft in this higher altitude will enable further studies on orbit perturbations, gravitational field variation of the Moon and also enable imaging lunar surface with a wider swath. 28) 29)
• In April 2009, the Mini-SAR instrument neared completion of the first mapping cycle of the lunar surface. 30)
• In early 2009, the star tracker of the AOCS (Attitude and Orbit Control Subsystem) malfunctioned requiring backup solutions with a gyroscope to maintain the attitude of the spacecraft. Prior to the start of lunar operations in Nov. 2008, Chandrayaan-1 suffered already from overheating. But ISRO was able to change the spacecraft's orientation and cut down on the amount of time the instruments were used to compensate. 31)
• On Dec. 12, 2008, the CIXS (Chandrayaan-1 Imaging X-ray Spectrometer) instrument of the UK and ESA detected the first X-ray signal from the moon. The solar flare that caused the X-ray fluorescence was exceedingly weak, approximately 20 times smaller than the minimum C1XS was designed to detect, which is good news for the sensitivity of the instrument. The detection is a key step in mapping the mineralogical composition of the moon's surface to study its origin and evolution. 32) 33)
• The spacecraft has about 183 kg fuel onboard. Orbital maneuvers need to be carried out on the spacecraft once every 28 days to ensure that it stays in the designated 100 km circular orbit and does not go astray. About three kg fuel is used when onboard motors are fired for carrying out the orbital maneuver.
• The MIP (Moon Impactor Probe) was released on Nov. 14, 2008 from the Chandrayaan-1 spacecraft and touched down on the lunar surface 25 minutes after its ejection (the impact was close to the Shackleton crater a place close lunar south pole). MIP carried three instruments: a video imaging system, a radar altimeter and a mass spectrometer. The video camera took pictures of the Moon as it approached the surface, the radar was used to determine the altitude, and the mass spectrometer was used to study the thin lunar atmosphere. 34)
• Chandrayaan-1 spacecraft successfully reached its final operational orbit around the moon on November 12, 2008. The spacecraft is now circling the moon at an altitude of about 100 km. - After being captured into lunar orbit on November 8, the spacecraft performed three orbit reduction maneuvers. 35)
• Chandrayaan-1 successfully entered lunar orbit on November 8, 2008. The spacecraft fired its engines to reduce velocity and enable the moon's gravity to capture it; the engines were fired for 817 seconds when Chandrayaan-1 was about 500 km away from the moon (504 km x 7502 km current orbit which takes about 11 hours).
• On November 4, 2008, Chandrayaan-1 entered the lunar transfer trajectory and is heading to an apogee of 3,80,000 km. In the fifth and final orbit-raising maneuver, the spacecraft's 440 N liquid-fuel propelled engine was fired for about two and a half minutes. The spacecraft, which is being tracked from ISTRAC (ISRO Telemetry, Tracking and Command Network) in Bangalore, India, is working nominally.
Sensor Complement
The payload consists of 5 devices provided by ISRO plus devices solicited by the international community. India received 16 proposals from around the world to be a part of the moon mission. NASA is providing two instruments while ESA developed three devices, one instrument comes from the Bulgarian Space Laboratory. 36) 37) 38)
TMC (Terrain Mapping stereo Camera)
TMC is an ISRO instrument, designed and developed at SAC (Space Application Center), Ahmedabad, India. TMC is observing in the panchromatic band (400-900 nm) with a spatial resolution of 5 m on a swath of 20 km. The objective is to create a high-resolution atlas in 3-D of the moon's surface. TMC features along-track three-line stereo pushbroom imaging with three linear array detectors for nadir, fore and aft viewing (the 3 linear arrays are in the focal plane of a single lens). The fore and aft view angle is ±25º with respect to nadir. Each of the 3 cameras has a source data rate of 12.7 Mbit/s. 39)
Spectral range | 400-900 nm (panchromatic) |
Optics | Refractive optics with mirror |
Lens focal length | 14 cm, f/No=4 |
Ground resolution | 5 m (from a 100 km lunar orbital altitude) |
Swath width | 20 km |
Forward and aft view angle of instrument | ±25.02º (along-track), |
Detector | APS (Active Pixel Sensor) 8000 elements, linear array |
Dat quantization | 10 bit |
Instrument units (2) | EO module + electronics unit |
Instrument mass, power, size | 6.0 kg, 13 W, 415 mm x 240 mm x 160 mm |
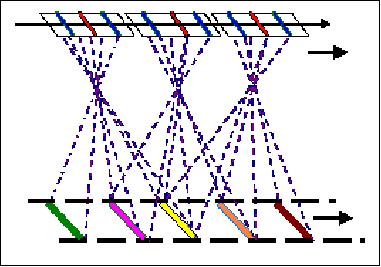
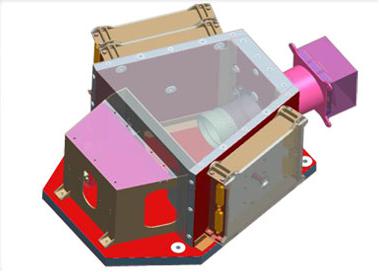
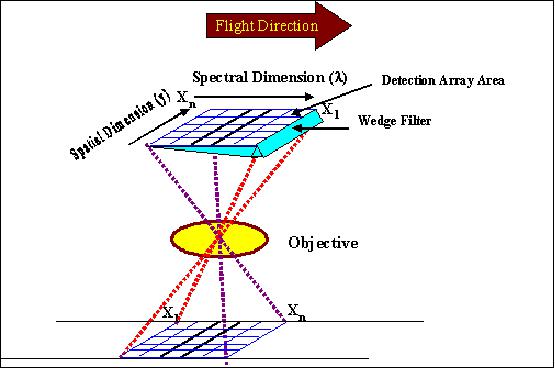
HySI (Hyperspectral Imager)
HySI is an ISRO instrument, designed at developed at SAC, Ahmedabad, India. The instrument is observing in the band 400-930 nm with a spectral resolution of 15 nm and a spatial resolution of 80 m on a swath of 20 km. The objective is mineralogical mapping. HySI features a wedge filter coupled to an area array detector. The wedge filter is an interference filter of varying thickness along one dimension. There are 32 continuous channels available (spectral resolution ≤ 15 nm). The detector array type (256 x 512 pixels) is of APS (Active Pixel Sensor) design. The source data rate of HySI is 3.8 Mbit/s.
Spectral range | 400-950 nm (VNIR) |
Spectral resolution | ≤ 15 nm (32 continuous bands) |
Optics | Refractive optics |
Filter | Spectral separation is done using a wedge filter instead of a prism to save weight |
Swath width (FOV) | 20 km (±13º) |
Spatial resolution | 80 m (from a 100 km lunar orbital altitude) |
Detector array size | APS (Active Pixel Sensor) 512 x 512 pixels |
Instrument units (2) | EO module + electronics unit |
Instrument mass, power, size | 4 kg, 16 W, 275 mm x 275 mm x 205 mm |
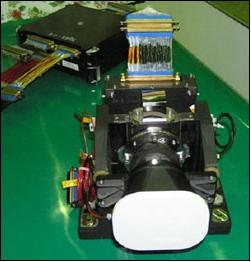
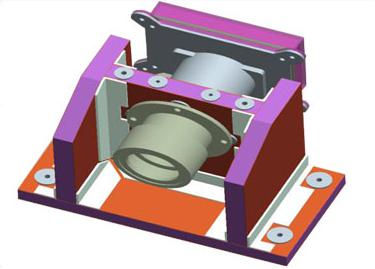
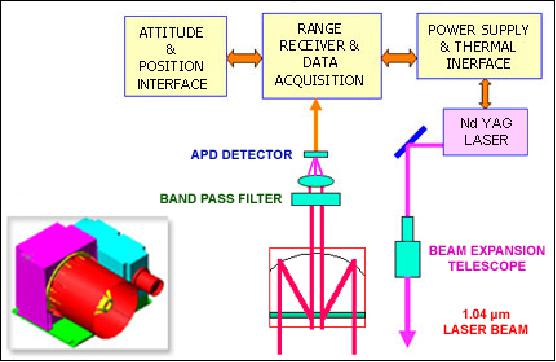
LLRI (Lunar Laser Ranging Instrument)
LLRI is an ISRO device, developed at the Laboratory for Electro-Optics Systems, Bangalore, India. The objective is to provide a means for lunar orbit determination of the spacecraft in support of topological mapping (gravity model). LLRI is a pulsed Nd:YAG solid-state laser (1064 nm laser beam, energy of 20-50 mJ), using a 17 cm optics receiver coupled to a Si-APD (Silicon-Avalanche Photodiode) detector. LLRI operates at 10Hz (5ns pulse) providing a vertical resolution of ≤ 5 m. LLRI and TMC will provide complementary data for generating a topographic map of the moon. The LLRI, in particular, will provide the first such data set for the polar region.
Nd:YAG laser wavelength | 1064 nm |
Laser beam energy | 20-50 mJ |
Optics | 38 mm aperture Galilean telescope (transmitter) |
Vertical resolution | ≤ 5 m (from a 100 km lunar orbital altitude) |
Detector | Si-APD (Silicon-Avalanche Photodiode) |
PRF (Pulse Repetition Rate) | 10 Hz |
Instrument units (2) | EO module + electronics module |
Instrument mass, power size | < 10 kg, 15 W, 350 mm x 350 mm x 240 mm |
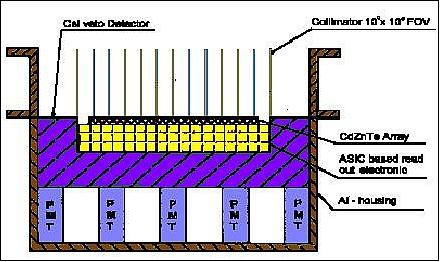
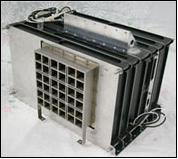
HEX (High Energy X-ray/γ-ray Spectrometer)
HEX is an ISRO instrument (SAC, Ahmedabad) with an ESA contribution. HEX measures in the energy range of 20-250 keV with a ground spatial resolution of about 20-40 km. The objective is to detect such items as: 219Pb, 222Rn degassing, U, Th, etc. to investigate the phenomenon of transport of volatiles on the lunar surface.
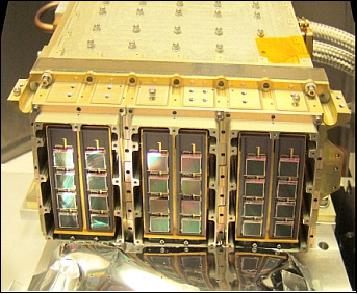
HEX employs CdZnTe solid-state detectors (also referred to as CZT detectors) arrays, each 4 cm x 4 cm (5 mm thick), composed of 256 (16 x 16) pixels (size: 2.5 mm x 2.5 mm). Each CZT array is readout using two closely mounted ASICs, which provide a self-triggering capability. A specially designed collimator provides a FOV (Field of View) of 40 km x 40 km. The mass of the HEX device is about 16 kg, a power consumption of 24 W, and a size of 180 mm x 145 mm x 194 mm.
HEX uses a CsI anticoincidence system for reducing background noise. The instrument observations are primarily intended for the study of volatile transport on the moon using the 46.5 keV γ-ray line from 210Pb decay as tracer. An attempt will be made to infer compositional characteristics of the lunar terrain from a study of the continuum background in this energy range as well as low resolution Th and U mapping of terrains enriched in these elements.
MIP (Moon Impactor Probe)
MIP is an ISRO instrument, developed by the Vikram Sarabhai Space Center (VSSC), Trivandrum, India. The primary objective is landing the probe at the desired location and to qualify some technologies for a soft landing mission.
MIP is carrying a highly sensitive mass spectrometer, a video camera, and a radar altimeter. The impactor will be released at the beginning of the mission and an attempt will be made to land the probe in a predetermined location on the lunar surface. Apart from the video imaging of the landing site, the onboard mass spectrometer will try to detect a possible presence of trace gases in the lunar exosphere.
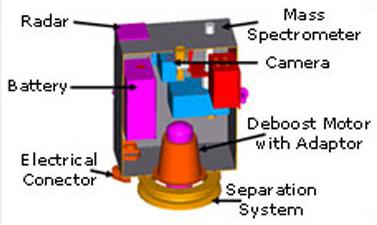
MIP has a mass of 29 kg and rides on the top deck of the main orbiter. After release and during the descent phase, the payload is spin stabilized. The descent phase to the surface of the moon is estimated to be about 20 minutes.
CIXS (Chandrayaan-1 Imaging X-ray Spectrometer)
CIXS is an ESA funded instrument, designed and developed at RAL (Rutherford Appleton Laboratory), UK (PI: M. Grande, University of Wales, Aberystwyth, UK). CIXS is an upgraded version of D-CIXS (Demonstration of a Compact Imaging X-ray Spectrometer) heritage, flown on ESA's SMART-1 mission; it replaces the LEX (Low Energy X-ray) instrument of ISRO, originally planned for Chandrayaan-1. 40) 41)
The primary goal of the CIXS instrument, also referred to as C1XS (Chandrayaan-1 X-ray Spectrometer), is to carry out high quality X-ray spectroscopic mapping of the moon. CIXS employs the X-ray fluorescence technique observing in the energy range of 1-10 keV by measuring elemental abundance of Mg, Al, Si, Ca, Fe, Ti distributed over the surface of the moon with a nominal spatial resolution of 25 km. CIXS has been designed as a thin, low profile detector.
The CIXS instrument hardware is built by an international team led by RAL. There is also a major science and design contribution from ISRO/ISAC at Bangalore, India. The CESR (Centre d'Etude Spatiale des Rayonnements) of CNRS in Toulouse, France is providing the 3-D Plus amplifier assemblies, and there is an important contribution to the detector development from Brunel University, UK.
The instrument uses the recently developed technology of the Swept Charge Device (SCD) X-ray detectors, mounted behind low profile gold/copper collimators and aluminium /polycarbonate thin film filters. The SCD is a CCD-like device which achieves near Fano-limited spectroscopy below -10ºC. It's read out is similar to a conventional CCD, requiring 575 clock triplets to read out the 1.1cm2 detector area. Micro-machined collimators provide a FOV of 14º FWHM (Full Width Half Maximum), equivalent to 25 km from an altitude of 100 km. A deployable door protects the instrument during launch and cruise, and also provides a Fe55 calibration X-ray sources for each of the detectors.
The SCD system has the virtue of providing superior X-ray detection, spectroscopic and spatial measurement capabilities, while also operating at near room temperature. A deployable shield protects the SCDs during passages through the Earth' s radiation belts, and from major particle events when at the moon. In order to record the incident solar X-ray flux at the moon, which is needed to derive absolute lunar elemental surface abundances, CIXS carries also an X-ray Solar Monitor (XSM), provided by the University of Helsinki, Finland. which is also used as a calibrator.
XSM is a complementary experiment alongside CIXS providing simultaneous observations of solar X-rays using a solid-state detector. The XSM consists of a separate Si detector unit on the spacecraft. The non-imaging HPSi PIN sensor has a wide FOV to enable sun visibility during a significant fraction of the mission lifetime, which is essential for obtaining calibration spectra for the X-ray fluorescence measurements by the imaging C1XS spectrometer. The energy range (1-20 keV), spectral resolution (~ 250 eV at 6 keV), and sensitivity (~ 7000 cps at flux level of 10-4 W m-2 in the range 1-8 Å) are tuned to provide optimal knowledge about the solar X-ray flux on the lunar surface, matching well with the activating energy range for the fluorescence measured by C1XS.
In comparison to D-CIXS, CIXS and XSM will be far better calibrated. The RESIK X-ray beam facility at RAL, UK, is designed to provide a controlled X-ray beam (continuum + lines) using a variety of targets. The 24 SCD detectors for CIXS underwent calibration measurements to address individual spectral response, absolute detection efficiency and angular response of the collimator. In addition, the dependence of these parameters on temperature were also studied. A Si-PIN detector calibrated at the Synchrotron facility, PTB, BESSY II was used as the reference for absolute calibration. The extensive calibration measurements and generation of a more detailed instrument response should provide the most accurate results on the major fluorescent X-ray line flux from the lunar surface. 42)
The CIXS instrument has a mass of 5.2 kg, a power consumption of 28 W, and a size of 185 mm x 112 mm x 140 mm. In normal solar conditions, CIXS will be able to detect elemental Mg, Al and Si on the lunar surface. During solar flare events, it might be possible to detect other elements such as Ca, Ti and Fe.
SARA (Sub keV Atom Reflecting Analyzer)
SARA was designed and developed jointly for ESA by IRF (Institute of Space Physics), Kiruna, Sweden (PI: S. Barabash of IRF), ISRO's Vikram Sarabhai Space Center at Trivandrum (Kerela State of India), JAXA of Tokyo, and the University of Bern, Switzerland. The objective is to map the composition of LENAs (Low Energy Neutral Atoms) kicked-off from the outermost layer of the moon's surface by the solar wind. LENA imaging is an important observation technique in planetary environments. - Note: Since the moon does not possess a global magnetosphere or an extended atmosphere, the solar wind ions can directly precipitate onto the moon's surface resulting in the production of LENAs through sputtering and backscattering processes. LENAs in this context are defined as atoms in the energy range of 10 eV to a about 2 keV. 43) 44) 45)
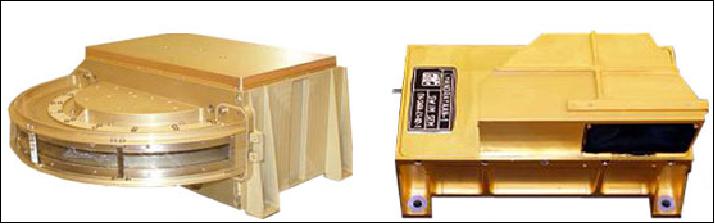
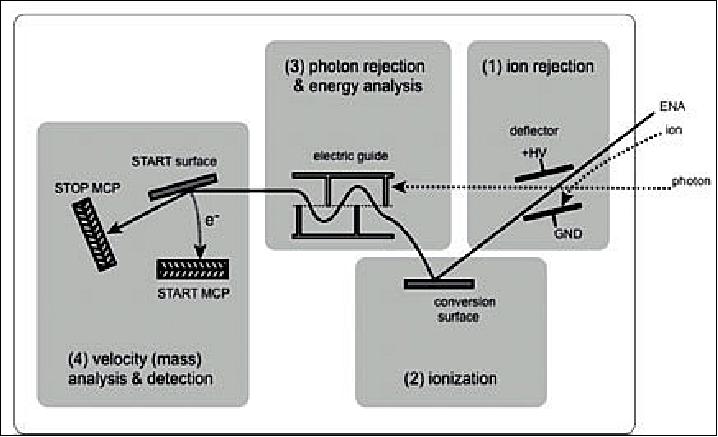
The SARA instrument consists of of three major subsystems: LENA sensor [which is also referred to as CENA (Chandrayaan-1 Energetic Neutral Analyzer)], SWIM (Solar Wind Monitor), and DPU (Data Processing Unit), and it is being built in collaboration between the participating institutes. At the CENA sensor, the neutral atoms are converted to positive ions on an ionization surface, after being swept away from the ambient flux by an electrostatic deflector, and then enter the sensor. The particle velocity is taken by a time-of-flight measurement, and the energy and mass are deduced by the electrostatic analyzer. The mass resolution is such that H, O, Na-Mg, K-Ca and Fe group elements can be distinguished. Since the moon does not have a magnetosphere or atmosphere, neutral atom density in the moon's environment is extremely small, produced mainly by sputtering due to solar wind ions. The contribution due to micrometeorite vaporization and solar photon simulated desorption is estimated to be small in this low energy region of interest. CENA imaging of the neutral atoms will thus provide maps of the sputtered elements which can be converted into surface composition maps, making suitable corrections for the sputtering yield and the solar wind flux, which depends on the cosine of the solar zenith angle.
Energy range | 10 eV to 2 keV (CENA) |
FOV (Field of View) | 15º x 160º (CENA) |
Instrument units (3) | CENA, SWIM, DPU |
Instrument mass, power, size | 3.5 kg, 3.0 W, 180 mm x 145 mm x 194 mm |
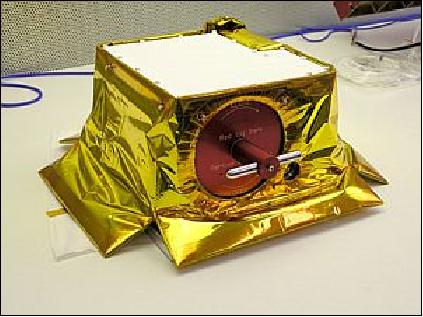
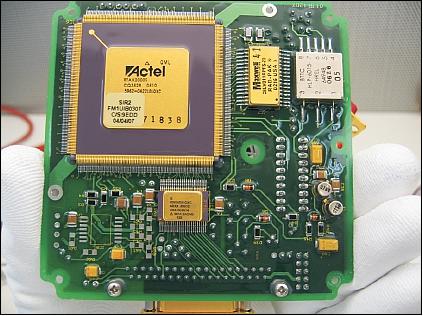
SIR-2 (Near Infrared Spectrometer)
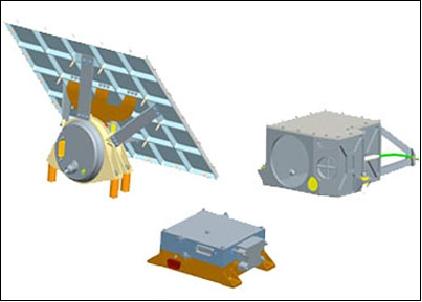
SIR-2 is an ESA instrument of SIR (SMART-1 Infrared Spectrometer) heritage. SIR-2 is being developed for ESA by MPS (Max Planck Institut für Sonnensystemforschung), Katlenburg-Lindau, Germany, in collaboration with the University of Bergen (UiB), Norway. UiB is designing the ICU (Instrument Control Unit) which is based on the fault-tolerant and radiation-tolerant LEON3-FT-RTAX processor of Aeroflex Gaisler, Sweden. The PSU (Power Supply Unit) of SIR-2 is built by the Space Research Center, Polish Academy of Science (SRC/PAS), Warsaw.
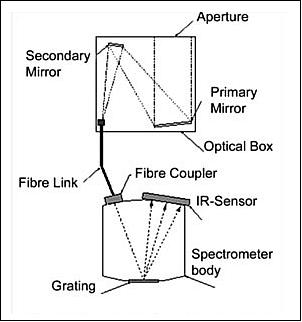
SIR-2 is an upgraded, compact grating, near-infrared spectrometer, which covers the wavelength range between 0.93 and 2.45 µm, with a spectral resolution of Δλ pixel = 6 nm and an angular resolution of 2.2 mrad. The instrument collects reflected sunlight off the moon's surface with the help of a main and secondary mirror. This light is led through an optical fiber to the instrument's sensor head where it hits a grating. The light dispersed by the grating ultimately reaches a detector which consists of a row of photosensitive pixels which measure the intensity of the dispersed light at the different wavelengths and produces an electronic signal which is read out and processed by the experiment's electronics.
The objective of SIR-2 is to address the surface-related aspects of lunar science in the following broad categories:
• Analyze in unprecedented detail the lunar surface in various geological/mineralogical and topographical units
• Study the vertical distribution of crustal material
• Investigate the process of basin, maria and crater formation on the moon
• Explore the "space weathering" processes of the lunar surface
• Survey mineral lunar resources for future landing sites and exploration.
The SIR-2 NIR data, combined with the hyperspectral data from the HySI instrument on Chandrayaan-1, will provide, for the first time, a full spectral coverage of the olivine and large part of the pyroxene bands, thus allowing to extract from the data the necessary input parameters for the mineralogical mixing models.
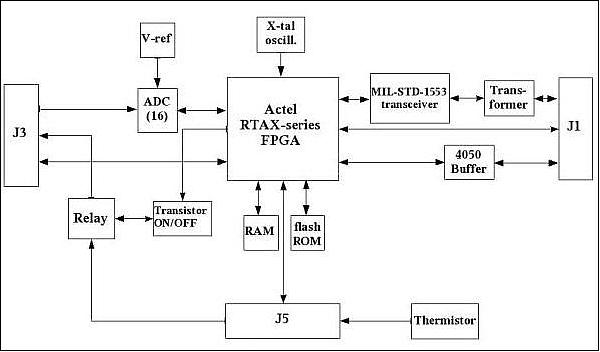
The SIR-2 instrument consists of three main parts, sensor unit, power unit, and the the ICU. The main electronics consists of the InGaAs photodiode detector array, the readout electronics, a 16 bit analog-to-digital converter (ADC), a microprocessor/controller for data and command handling and a custom designed DC/DC converter which powers the various parts of the electronics. The instrument has a mass of 2.3 kg, a power consumption of 2.2 W, and a size of 260 mm x 171 mm x 143 mm (EO module), 146 mm x 125 mm x 33.5 mm (electronics box). 46) 47)
Mini-SAR (Miniature Synthetic Aperture Radar)
Mini-SAR is a NASA and DoD (USA) instrument package, designed by JHU/APL (Johns Hopkins University/Applied Physics Laboratory) of Laurel, MD, and NAWC (Naval Air Warfare Center), Patuxent River, MD, USA. Mini-SAR is being built by Raytheon with BAE & Surrey Satellites. The Naval Air Warfare Center is the executing agent, with JHU/APL providing the instrument SOC (Science Operations Center), backup ground station and science and programmatic support. 48) 49) 50)
The main objective is to chart the moon's poles (radar-scanning for water ice thought to be present in permanently shadowed lunar craters). These ice deposits would represent a significant potential resource for the manned human base that is to be set up at one of the moon's poles late in the next decade.
Measurement concept: Mini-SAR will transmit RCP (Right Circular Polarization) and receive both LCP (Left Circular Polarization) and RCP. In scatterometer mode, the system will measure the RCP and LCP response in the altimetry footprint along the nadir groundtrack. The system will measure the surface RF emissivity, allowing a determination of the near normal incidence Fresnel reflectivity. Meter-scale surface roughness and circular polarization ratio (CPR) will also be determined for this footprint. This allows the characterization of the radar and physical properties of the lunar surface (e.g., dielectric constant, porosity) for a network of points. When directed off nadir the radar system will image a swath parallel to the orbital track by delay/Doppler methods (SAR mode) in both RCP and LCP.
Since ice in concentration exhibits the Coherent Backscatter Opposition Effect (CBOE), which causes an increase in radar echo reflectivity and CPR enhancement along the backscatter direction, Mini-SAR will allow extensive data to be collected on the location and distribution of lunar ice deposits. At S-band, CBOE is sensitive to 1-10 meter-scale ice deposits covered by up to 40 cm of dry lunar regolith.
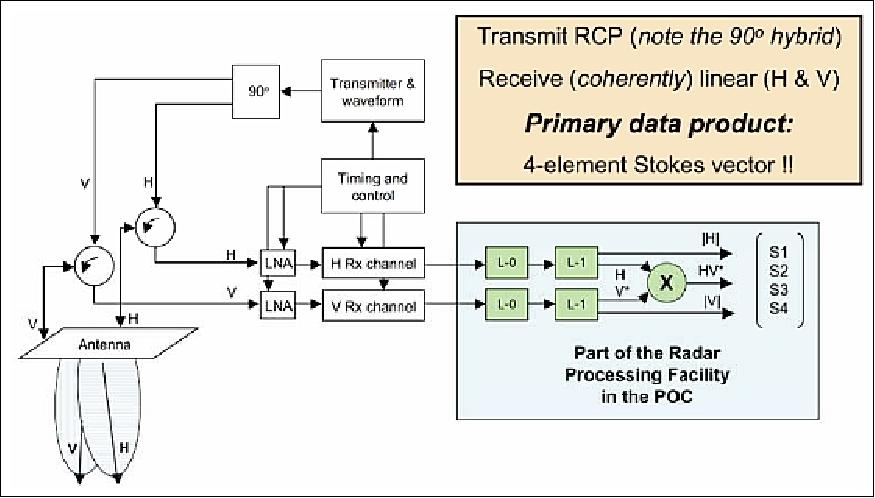
The Mini-SAR instrument features a new hybrid-polarity architecture, a dual-polarized system with a linearly-polarized antenna - leading to a simpler yet more capable radar. The essential feature of the hybrid-polarity architecture is: transmit circular polarization (by driving the orthogonal linear feeds simultaneously by two identical waveforms, 90º out of phase), and receive H and V linear polarizations, coherently. Once calibrated, the H and V single-look complex amplitude data are sufficient to form all four Stokes parameters, from which the circular-polarization ratio may be found, along with several other quantitative characterizations in the image domain. 51) 52) 53) 54) 55)
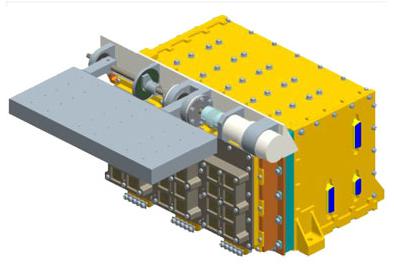
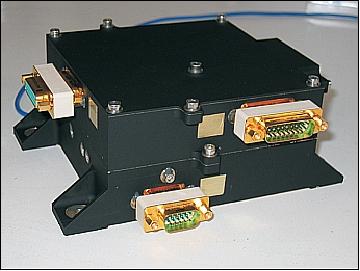
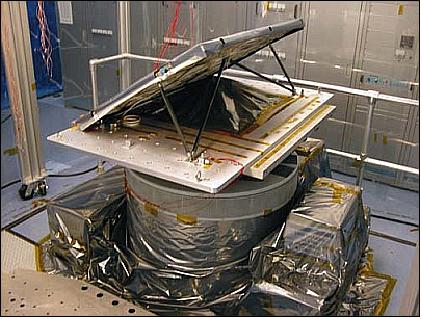
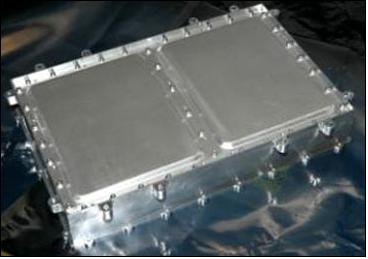
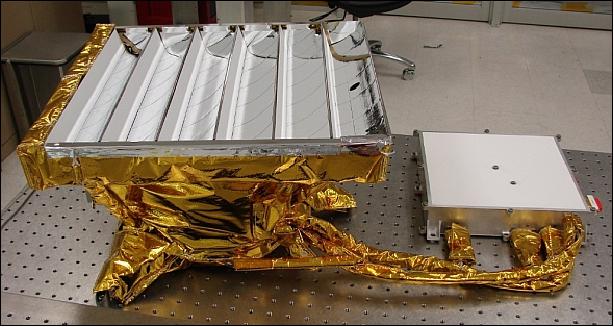
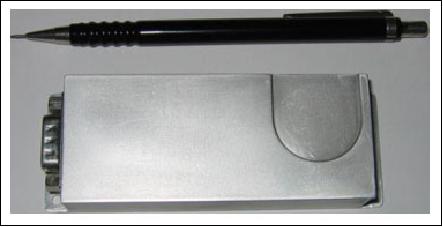
The Mini-SAR system consists of an electronics box and antenna (Figure 35); data handling and storage are handled by the Chandrayaan-1 spacecraft data subsystem. The Mini-SAR electronics box contains the waveform generator, digital circuits, receiver and transmitter (Figure 34). The electronics box is mounted on the back of the moon-facing panel on the Chandrayaan-1 spacecraft.
A form-core, cross linear array antenna allows a broadband approach with a single antenna panel, without any deployable mechanisms (e.g. feeds) while meeting stringent weight and volume constraints. The thermal design, materials selection, manufacturing, and test qualification heritage of Chandrayaan-1 Mini-SAR antenna were applied also to the LRO Mini-RF unit. The combined mass of the antenna and electronics is less than 9 kg.
A processor module based on a heritage OBC 695 and associated firmware and software, developed by SSTL (Surrey Satellite Technology Ltd) controls the Mini-SAR system. Data handling and processing is done via the Chandrayaan-1 spacecraft solid state memory and data handling systems.
Center frequency | 2.38 GHz (S-band), corresponding to a wavelength of 13.6 cm |
Antenna gain | 24.97 dBi (min) |
Antenna size, mass | 60 cm x 180 cm, x 5 cm; 3.3 kg |
Peak RF power | 20 W (max) |
PRF (Pulse Repetition Frequency) | 3.1 kHz |
Polarization | - Transmit: RCP (Right Circular Polarization), |
Incidence angle | 33º |
Spacecraft orbital height | 100 km |
Spacecraft velocity in lunar orbit | 1631 m/s |
SAR mission duration (max/orbit) | < 10 minutes |
Specific radar cross section | - 30 dB at 45º angle of incidence; 150 m ground range resolution |
Independent looks | 16 |
Nominal SNR (Signal-to-Noise-Ratio) | 10 dB |
Swath | 8 km (range) |
Spatial resolution | 150 m |
Instrument mass, power | 8.1 kg, 50 W |
Imaging of the lunar surface by the Mini-SAR mapper precludes the simultaneous imaging of the moon by the other Chandrayaan-1 sensors due to power limitations. The main goal of Mini-SAR on Chandrayaan-1 is to conduct systematic SAR mapping polewards of 80º for both poles.
Data products from Mini-SAR include maps of lunar surface scattering properties, including maps of CPR, indicative of ice. The polar backscatter maps will have a typical resolution of 1-2 km/pixel. In addition, complete SAR mosaics are being obtained in both RCP and LCP of the polar regions at about 150 m/pixel. These images will display the locations of polar ice and the topography and morphology of the permanently dark regions around both lunar poles.
If the Chandrayaan spacecraft and its instruments are still operational when the NASA mission LRO (Lunar Reconnaissance Orbiter) arrives in lunar orbit (June of 2009), then an attempt is being made to conduct a bistatic imaging experiment with the Mini-RF imager of LRO. By transmitting RCP from the Chandrayaan-1 Mini-SAR and receiving RCP and LCP on the LRO, it is possible to image the polar deposits through the beta (phase) angle, providing definitive evidence for the presence of water ice at the poles. Monostatic radar can only image the deposits at zero phase (β = 0) and thus, there is always an ambiguity as to the high back scattering, being caused by roughness (surface) or ice (volume) scattering. Bistatic imaging can eliminate this ambiguity. Coordinated radar observations from Chandrayaan-1 and LRO spacecraft should be a high priority for these mission operations.
Parameter | Chandrayaan-1 | LRO (Lunar Reconnaissance Orbiter) |
Instrument | Mini-SAR | Mini-RF |
Frequency | S-band | S-band and X-band |
Polarization | - Tx: RCP | |
Scatterometry | S-band | none |
Imager | Regional maps | Site-specific selections |
Resolution (m/pixel) | 150 baseline | 150 baseline, 30 m zoom |
Looks | 16 | 16 |
Swath (km) | 8 | 6 or 4 |
Altitude (km) | 100 | 50 |
Incidence angle | 33º | 45º |
Interferometry | No | Experimental |
Laboratory calibration data was acquired before launch during spacecraft integration and test. The overarching goal of these activities was to ensure production of a calibrated instrument. All waveforms in the waveform table were tested on brass board hardware while selected waveforms were tested on flight hardware. Additional waveform testing was done on the flight instrument during thermal vacuum temperature ramp cycles. Internal calibration data are acquired every time Mini-SAR takes a science data collect; a chirp, noise, and tone calibration is done both immediately before, and immediately after a data collect.
External calibration is planned en route to the moon by taking data using ground-based assets. During the translunar cruise phase, the project will conduct calibration measurements with the Greenbank Radio Telescope in West Virginia, USA. A transmitted signal from Mini-SAR is received by Greenbank while the antenna boresight is scanned via spacecraft attitude changes over a range of angles.
The Mini-SAR instrument was activated on November 17, 2008 and acquired SAR images of both poles during a commissioning test. The instrument performed nominally. 56)
M3 (Moon Mineralogy Mapper)
M3 is a NASA funded instrument, a state-of-the-art high spectral resolution imaging spectrometer (VNIR, SWIR) jointly designed and developed at JPL and at Brown University, Providence, RI (PI: C. M. Pieters). The objective is to characterize and map the mineral composition of the moon to improve our understanding about the early evolution of the terrestrial planet. 57) 58) 59)
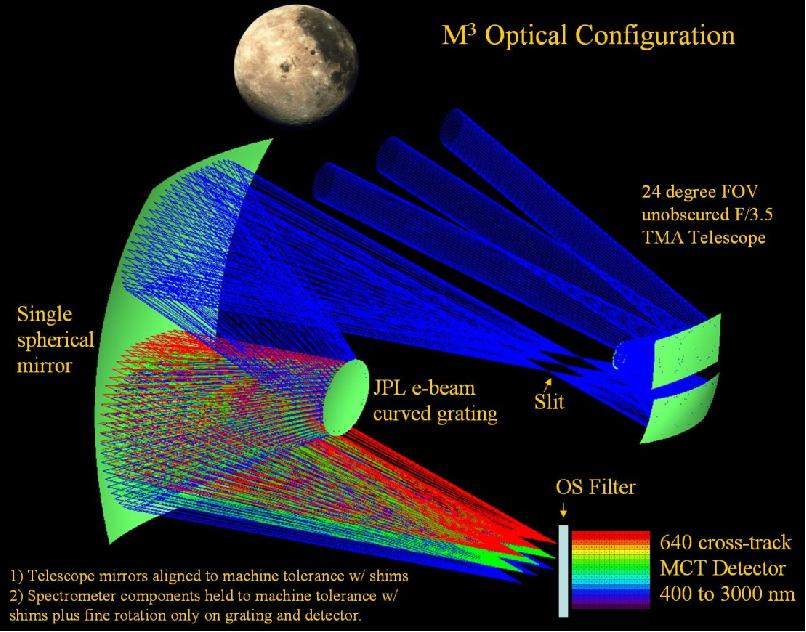
M3 uses a compact system of optics (the mirrors that collect and direct the light) known as an "Offner" design, which produces little or no distortion, either spatially or spectrally. The instrument is a pushbroom imaging spectrometer providing two spatial and one spectral dimension (use of a HgCdTe detector array. The instrument provides solar reflectance spectra of the moon's surface:
- 0.70 to 3.0 µm [0.43 to 3.0 µm projected]
- 40 km FOV, contiguous orbits
- high SNR
- 1 Gbyte/orbit of data
The spectral range is being dispersed into 261 discrete bands of 10 nm width. The high spectral resolution data enables to detect the fine detail required for mineral identification.
Operational modes of M3: Since the M3 instrument observations yield very high data rates, mapping the entire surface of the moon at both high spatial and spectral resolution would exceed the nominal operational lifetime of the mission. Therefore, the M3 instrument has been designed to operate in two distinct modes: target mode and global mode. 60)
• The target mode captures the high spectral and spatial resolution data desired for science applications (zeroing in on features of special interest).
• Global (mapping the entire surface). In global mode, the instrument merges groups of pixels to reduce the data rate and accommodate the limited available downlink time. This will result in an effective spatial resolution of 140m and spectral resolution of 40 nm.
All data will be acquired from the nominal 100 km polar orbit of Chandrayaan-1 yielding a 40 km wide field of view.
- Global-mode data will be acquired in 145º latitudinal swaths at a spatial resolution of ~140 m/pixel and will measure spectra from 86 of the available 260 spectral channels.
- The target-mode data will be acquired at ~70 m/pixel using the full spectral range of the instrument. Targeted data can be acquired in ~12º swaths per orbit and the coverage need not be continuous. The target mode thus requires the definition of science regions along each operational orbit.
Instrument optics | All aluminum optics, FOV= 24º, unobscured f/3.5, TMA (Three Mirror Anastigmatic) telescope |
Spectral range | 700 to 3000 nm @ 10 nm spectral resolution (optional mode of 400 to 3000 nm @ 10 nm spectral resolution) |
Sampling | 10 nm across the spectral range |
Spectral response | ≤ 1.2 of sampling FWHM (Full Width Half Maximum) |
Spectral uniformity | < 10% variation of spectral position and FWHM across the field of view |
Detector array | The detector provides 640 spatial elements in cross-track. A 640 by 480 element substrate removed HgCdTe detector array and 6604A readout (sensitive from 400 to 3000 nm), detector pitch = 27 µm, RSC 6604A FPA @JPL |
Spectrometer | Offner Spectrometer (Zakos design)- providing a high SNR, high uniformity, and a simple design |
Grating | Single dual-blaze electron-beam grating (JPL convex three zone blazed e-beam lithographic grating) |
Swath | Spatial swath of 40 km (from a 100 km moon orbit) with sampling ~70 m IFOV (global coverage from planned orbit and data downlink limits) |
Radiometric response | SNR > 400 equatorial reference, > 100 polar reference |
Cryocooler | K508 Ricor cryocooler with backup |
Calibration | Deployable calibration panel for solar view radiometric calibration |
Data quantization | Data sampling: 14 bits measured, 12 reported |
Instrument mass, power | < 10 kg, < 13 W |

Background: M3 was selected in early 2005. The first spectrum was acquired in the laboratory on December 15, 2006. Calibration took place during the month of April 2007. A complete set of spectral, radiometric, spatial and uniformity calibration measurements was acquired. Following laboratory calibration M3 completed a pre-ship review on May 3, 2007. Initial integration of M3 at ISRO was completed on August 10, 2007 with M3 successfully commanded from the Chandrayaan-1 spacecraft system.
RADOM (Radiation Dose Monitor)
RADOM was developed by the Solar Terrestrial Influences Laboratory of the Bulgarian Academy of Sciences (BAS), Sofia, Bulgaria (PI: T. P. Dachev). The objective is to monitor qualitatively and quantitatively the radiation environment (particle flux) around the moon. The specific goals are:
• Measure the particle flux, deposited energy spectrum, accumulated absorbed dose rates in lunar orbit
• Provide an estimate of the dose map around the moon at different altitudes and latitudes
• Evaluate the shielding characteristics (if any) of the moon near environment towards galactic and solar cosmic radiation and solar particle events
• Study the radiation hazards during the moon exploration through the Chandrayaan-1 mission. Data obtained will be used for the evaluation of radiation environment and radiation shielding requirements on future manned moon missions.
RADOM is a miniature spectrometer-dosimeter containing one semiconductor detector of 0.3 mm thickness, one charge-sensitive preamplifier and two micro controllers. The Si detector with an area of 2 cm2 has a mass of 0.139 gram. Its threshold level is 8 keV. The pulse analysis technique is used for obtaining the deposited energy spectrum, which is further converted to the deposited dose and flux in the silicon detector. The exposure time for one spectrum is fixed at 30 seconds. RADOM measures the spectrum of the deposited energy from primary and secondary particles in 256 channels. The instrument will make its measurements in the lunar environment as a function of altitude as the spacecraft descends from the lunar capture orbit to its final altitude of 100 km. 61)
References
1) J. N. Goswami, M. Annadurai, "Chandrayaan-1 Mission to the Moon," 58th IAC (International Astronautical Congress), International Space Expo, Hyderabad, India, Sept. 24-28, 2007, IAC-07- A3.6.A.02
2) http://www.isro.org/chandrayaan/htmls/home.htm
3) "ISRO and NASA Sign MOU on Chandrayaan-1," May 9, 2006, URL: http://solarsystem.nasa.gov/news/display.cfm?News_ID=14835
4) Jayati Datta, S. C. Chakravarty, "Chandrayaan-1, India's First Mission to Moon," URL: http://www.isro.org/chandrayaan/resources/Chandrayaan-1-booklet.pdf
5) A. Krishna, N. S. Gopinath, N. S. Hedge, N. K. Malik, "Imaging and power generation strategies for Chandrayaan-1," Journal of Earth System Science, Vol. 114, No 6, 2005; URL: http://www.ias.ac.in/jessci/dec2005/ilc-20.pdf
6) V. Siddiramulu, K. Sampathkumar, K.Malarmani, C. J. Murali, S. K. Shivakumar, "Communication Network for Chandrayan-1 Mission," Proceedings of the SpaceOps 2010 Conference, Huntsville, ALA, USA, April 25-30, 2010, paper: AIAA 2010-2178
7) "PSLV-C11 Successfully Launches Chandrayaan-1," ISRO, Oct. 22, 2008, URL: http://www.isro.gov.in/pressrelease/scripts/pressreleasein.aspx?Oct22_2008
8) N. V. Vighnesam, Anatta Sonney, B. Subramanian, N. S. Gopinath, "India's First Lunar Mission Chandrayaan-1 Launch and Early Orbit Phase Orbit Determination," Proceedings of the 60th IAC (International Astronautical Congress), Daejeon, Korea, Oct. 12-16, 2009, IAC-09.C1.3.7
9) N.V. Vighnesam, Anatta Sonney, Pramod Kumar Soni, "India's Lunar Mission (Chandrayaan-1) Orbit Determination System," Proceedings of the 57th IAC/IAF/IAA (International Astronautical Congress), Valencia, Spain, Oct. 2-6, 2006, IAC-06-C1.5.06
10) "Ice Confirmed at the Moon's Poles," NASA/JPL, News Feature: 2018-195, 20 August 2018, URL: https://www.jpl.nasa.gov/news/news.php?release=2018-195
11) Shuai Li, Paul G. Lucey, Ralph E. Milliken, Paul O. Hayne, Elizabeth Fisher, Jean-Pierre Williams, Dana M. Hurley, Richard C. Elphic, "Direct evidence of surface exposed water ice in the lunar polar regions," Proceedings of the National Academy of Sciences, PNAS August 20, 2018. 201802345; published ahead of print August 20, 2018, https://doi.org/10.1073/pnas.1802345115, URL: http://www.pnas.org/content/pnas/early/2018/08/14/1802345115.full.pdf
12) Kevin Stacey, "Research details mineralogy of potential lunar exploration site," Brown University, 28 Feb. 2018, URL: https://news.brown.edu/articles/2018/02/spa
13) D. P. Moroarty III, C. M. Pieters, "The Character of South Pole - Aitken Basin: Patterns of Surface and Sub-Surface Composition," Journal of Geophysical Research: Planets, Vol. 123, 20 Feb. 2018, https://doi.org/10.1002/2017JE005364
14) "New NASA Radar Technique Finds Lost Lunar Spacecraft," NASA/JPL, March 9, 2017, URL: https://www.jpl.nasa.gov/news/news.php?feature=6769
15) Narendra Bhandari, Neeraj Srivastava, "Active moon: evidences from Chandrayaan-1 and the proposed Indian missions," Geoscience Letters, October 2, 2014, 1:11, URL: http://link.springer.com/article/10.1186/s40562-014-0011-y/fulltext.html
16) Paulette Campbell, "Scientists Detect Magmatic Water on Moon's Surface," JHU/APL, August 26, 2013, URL: http://www.jhuapl.edu/newscenter/pressreleases/2013/130826.asp
17) Dwayne Brown, Rachel Hoover, Paulette Campbell, "NASA-Funded Scientists Detect Water on Moon's Surface that Hints at Water Below," NASA, Release 13- 267, URL: http://www.nasa.gov/press/2013/august
/nasa-funded-scientists-detect-water-on-moons-surface-that-hints-at-water-below/#.Uh2oqH_ODWI
18) Rachel Klima, Joshua Cahill, Justin Hagerty, David Lawrence, "Remote detection of magmatic water in Bullialdus Crater on the Moon," Nature Geoscience,August 25, 2013, doi:10.1038/ngeo1909
19) Jason Major, "Evidence of Internal Moon Water Found," Universe Today, August 27, 2013, URL: http://www.universetoday.com/104380/evidence-of-internal-moon-water-found/
20) Rachel Klima, Joshua Cahill, Justin Hagerty, David Lawrence, "Bullialdus Crater: Probing Mineralogy and Local Hydroxyl Abundance," Lunar Science Forum, July 18, 2012, URL: http://lunarscience.nasa.gov/wp-content/uploads/2012/08/38_Klima_NLSI_2012.pdf
21) "Additional evidence of water activity on moon," NASA Feature, March 2010, URL: http://www.nasa.gov/mission_pages/Mini-RF/multimedia/feature_ice_like_deposits.html
22) "Mini-SAR on Chandrayaan-1 finds ice deposits at moon's North pole," ISRO, March 2, 2010, URL: http://www.isro.org/pressrelease/scripts/pressreleasein.aspx?Mar02_2010
23) "NASA Instruments Reveal Water Molecules on Lunar Surface," NASA, Sept. 24, 2009, URL: http://www.nasa.gov/topics/moonmars/features/moon20090924.html
24) "How the Moon produces its own water," Science Daily, Oct. 19, 2009, URL: http://www.sciencedaily.com/releases/2009/10/091015091605.htm
25) "ISRO terminates Chandrayaan-1 moon mission: Nair," Aug. 30, 2009, URL: http://www.dnaindia.com/india/report_isro-terminates-chandrayaan-1-moon-mission-nair_1286368
26) "Radio Contact Lost With Chandrayaan-1," Aug. 29, 2009, Universe Today, URL: http://www.universetoday.com/2009/08/29/radio-contact-lost-with-chandrayaan-1/
27) Nancy Atkinson, "Anticipated Joint Experiment with Chandrayaan-1 and LRO Failed," Universe Today, Sept. 10, 2009, URL: http://www.universetoday.com/2009/09/10
/anticipated-joint-experiment-with-chandrayaan-1-and-lro-failed/
28) "The Orbit of Chandrayaan-1 Raised," May 27, 2009, URL: http://www.lunarexplorers.net/node/672
29) http://www.isro.org/chandrayaan/htmls/ImageMoon.htm
30) "Mini-SAR Nears Completion of First Mapping Cycle," NASA, April 2, 2009, URL: http://www.nasa.gov/mission_pages/Mini-RF/news/mini-sar_first_map_cycle.html
31) Nancy Atkinson, "Chandrayaan-1 Rescued from Failure," Universe Today, July 17, 2009, URL: http://www.universetoday.com/2009/07/17/chandrayaan-1-rescued-from-failure/
32) "Chandrayaan-1 Instrument Detects First X-ray Signature from Moon," Jan. 23, 2009, Universe Today, URL: http://www.universetoday.com/2009/01/23
/chandrayaan-1-instrument-detects-first-x-ray-signature-from-moon/
33) "European lunar X-ray camera more sensitive than expected," Jan. 26, 2009, SpaceRef, URL: http://www.spaceref.com/news/viewpr.html?pid=27434
34) http://www.universetoday.com/2008/11/14
/moon-impact-probe-hits-paydirt-or-pay-regolith%E2%80%A6/
35) "Chandrayaan-1 Reaches Final Orbital Home," ESA, Nov. 13, 2008, URL: http://www.esa.int/esaSC/SEM9X74DHNF_index_2.html
36) http://www.isro.org/chandrayaan/htmls/psexperiments.htm
37) J. N. Goswami, K. Thyagarajan, M. Annadurai, "Chandrayaan-1: Indian Mission to Moon," 37th LPSC (Lunar and Planetary Science) Conference, Houston, TX, USA, March 13-17, 2006, URL: http://www.lpi.usra.edu/meetings/lpsc2006/pdf/1704.pdf
38) Ben Bussey, "Chandrayaan-1 Mission: An update," URL: http://lunar.gsfc.nasa.gov/library/06_Chandrayaan_Bussey.pdf
39) K. Kumar, R. Chowdhury, "Terrain Mapping Camera for Chandrayaan-1," Journal of Earth System Science, Vol. 114, No 6, 2005, URL: http://www.ias.ac.in/jessci/dec2005/ilc-14.pdf
40) M. Grande, B. J. Maddison, P. Sreekumar, J. Huovelin, B. J. Kellett, C. J. Howe, I. A. Crawford, A Holland, and the C1XS Team, "The C1XS X-ray spectrometer on Chandrayaan-1," 39th Lunar and Planetary Science Conference, Houston, TX, USA, March 10-14, 2008, URL: http://www.lpi.usra.edu/meetings/lpsc2008/pdf/1620.pdf
41) K. H. Joy, I. A. Crawford, B. Kellett, M. N. Grande, and the C1XS Science Team, "The scientific case for the Chandrayaan-1 X-ray spectrometer," 39th Lunar and Planetary Science Conference, Houston, TX, USA, March 10-14, 2008, URL: http://www.lpi.usra.edu/meetings/lpsc2008/pdf/1070.pdf
42) S. Narendranath K. C, P. Sreekumar, B. J. Kellet, M. Wallner, C. J. Howe, B. Maddison, C. Erd, M. Grande, "Instrument response of the Chandrayaan-1 X-ray spectrometer (C1XS)," 39th Lunar and Planetary Science Conference, Houston, TX, USA, March 10-14, 2008, URL: http://www.lpi.usra.edu/meetings/lpsc2008/pdf/1136.pdf
43) A. Bhardwaj, S. Barabash, Y. Futaana, Y. Kazama, K. Asamura, D. McCann, R. Sridharan, M. Homström, P. Wurz, R. Lundin, Low Energy Neutral Atom Imaging on the Moon with the SARA Instrument aboard Chandrayaan-1 Mission," Journal of Earth System Science, Vol. 114, No 6, 2005, pp 749-760; Special issue: Proceedings of the International Conference on Exploration and Utilization of the Moon, 22-26 November 2004, Udaipur, Rajasthan, India
44) A. Bhardwaj, S. Barabash, Y. Futaana, Y. Kazama, K. Asamura, D. McCann, R. Sridharan, M. Holmstrom, P. Wurz, R. Lundin, "Low Energy Neutral Atom Imaging on the Moon with the SARA Instrument aboard Chandrayaan-1 Mission," . Journal of Earth System Science, Vol. 114, No. 6, 2005, pp. 749-760, Indian Academy of Sciences
45) D. McCann, S. Barabash, Y. Futaana, H. Nilsson, A. Bhardwaj, "Miniature ion mass analyzer of the Chandrayaan-1 mission," Geophysical Research Abstracts, Vol. 8, 09793, 2006
46) U. Mall, A. Nathues, H. U. Keller , "SIR - 2: The NIR Spectrometer for the Chandrayaan-1 Mission," 37th AAS Division for Planetary Sciences Meeting, Session 57, Cambridge, UK, Sept. 4-9, 2005, paper: 57-09, Bulletin of the American Astronomical Society, Vol. 37, 2005, p.749
47) http://www.isro.org/chandrayaan/htmls/sir-2_esa.htm
48) P. Spudis, J. N. Goswami, "Chandrayaan Mission Objectives and future lunar programs," 2007, URL: http://www.lpi.usra.edu/meetings/leag2007/presentations/20071002.spudis.pdf
49) P. D. Spudis, B. Bussey, C. Lichtenberg, B. Marinelli, S. Nozette, "Mini-SAR: An Imaging Radar for the Chandrayaan-1 Mission to the Moon," 36th LPSC (Lunar and Planetary Science) Conference, Houston, TX, March 14-15, 2005
50) D. B. J. Bussey, P. D. Spudis, S. Nozette, C. L. Lichtenberg, R. K. Raney, W Marinelli, H. L. Winters, "Mini-RF: Imaging radars for exploring the lunar poles," 39th Lunar and Planetary Science Conference, Houston, TX, USA, March 10-14, 2008, URL: http://www.lpi.usra.edu/meetings/lpsc2008/pdf/2389.pdf
51) R. K. Raney, "Comments on Hybrid-Polarity SAR Architecture," Proceedings of IGARSS 2007 (International Geoscience and Remote Sensing Symposium), Barcelona, Spain, July 23-27, 2007
52) R. K. Raney, "Hybrid-Polarity SAR Architecture," Proceedings of IGARSS ( IEEE International and Geoscience Remote Sensing Symposium), Denver, CO, July 31-Aug. 4, 2006
53) R. K. Raney, "On dual-polarized SARs and the Stokes parameters," Proceedings of EUSAR 2006. Dresden, Germany, May 16-18, 2006.
54) R. Keith Raney, Anthony Freeman, "Hybrid-Polarity SAR Architecture," Proceedings of the 4th International POLinSAR 2009 Workshop, Jan. 26-30, 2009, ESA/ESRIN, Frascati, Italy, URL: http://earth.esa.int/workshops/polinsar2009/participants/141/pres_1_Raney_141.pdf
55) Paul Spudis, Stewart Nozette, Ben Bussey, Keith Raney, Helene Winters, Christopher L. Lichtenberg, William Marinelli, Jason C. Crusan, Michele M. Gates, "Mini-SAR: an imaging radar experiment for the Chandrayaan-1 mission to the Moon," Current Science, Vol. 96, No 4, Feb. 25, 2009, Special Section: Chandrayaan-1,
56) P. D. Spudis, D. B. J. Bussey, B. Butler, L. Carter, J. Gillis-Davis, J. Goswami, E. Heggy, R. Kirk, T. Misra, S. Nozette, M. Robinson, R. K. Raney, T. Thompson, B. Thomson, E. Ustinov, "The Mini-SAR imaging radar on the Chandrayaan-1 Mission to the Moon," 40th Lunar and Planetary Science Conference, The Woodlands, TX, USA, March 23-27, 2009, URL: http://www.lpi.usra.edu/meetings/lpsc2009/pdf/1098.pdf
57) R. O. Green, C. Pieters, P. Mouroulis, G. Sellar, M. Eastwood, S. Geier, J. Shea, "Calibration, Shipment and Initial Spacecraft Integration of the Moon Mineralogy Mapper (M3) Imaging Spectrometer for the Chandrayaan-1 Mission," 39th Lunar and Planetary Science Conference, Houston, TX, USA, March 10-14, 2008, URL: http://www.lpi.usra.edu/meetings/lpsc2008/pdf/1803.pdf
58) C. M. Pieters, J. N. Goswami, R. N. Clark, M. Annadurai, J. Boardman, B. Buratti, J.-P. Combe, M. D. Dyar, R. Green, J. W. Head, C. Hibbitts, M. Hicks, P. Isaacson, R. Klima, G. Kramer, S. Kumar, E. Livo, S. Lundeen, E. Malaret, T. McCord, J. Mustard, J. Nettles, N. Petro, C. Runyon, M. Staid, J. Sunshine, L. A. Taylor, S. Tompkins, P. Varanasi, "Character and Spatial Distribution of OH/H2O on the Surface of the Moon Seen by M3 on Chandrayaan-1," Science, Oct. 23, 2009, Vol. 326, No 5952, pp. 568-572
59) Robert O. Green, Carle Pieters, Pantazis Mouroulis, "Moon Mineral Mapper (M3): A high Uniformity and High Precision Science Imaging Spectrometer in the Solar Reflected Spectrum," 2006, URL:
http://trs-new.jpl.nasa.gov/dspace/bitstream/2014/41093/1/06-2159.pdf
60) N. Petro, C. Pieters, J. Boardman, R. Green, J. Head, P. Isaacson, J Nettles, E. Malaret, M. Staid, J Sunshine, S. Tompkins, "Targeting for the Moon Mineralogy Mapper (M3) instrument on the Chandrayaan-1 mission," 39th Lunar and Planetary Science Conference, Houston, TX, USA, March 10-14, 2008, URL: http://www.lpi.usra.edu/meetings/lpsc2008/pdf/1696.pdf
61) "Radiation Dose Monitor Experiment (RADOM - BAS)," URL:
http://www.chandrayaan-i.com/chandrayaan1/how/payloads/radom.html
The information compiled and edited in this article was provided by Herbert J. Kramer from his documentation of: "Observation of the Earth and Its Environment: Survey of Missions and Sensors" (Springer Verlag) as well as many other sources after the publication of the 4th edition in 2002. - Comments and corrections to this article are always welcome for further updates (eoportal@symbios.space).
Spacecraft Launch Mission Status Sensor Complement References Back to top