CALIPSO (Cloud-Aerosol Lidar and Infrared Pathfinder Satellite Observations)
EO
Lidars
Atmosphere
Cloud type, amount and cloud top temperature
Launched in April 2006, CALIPSO (Cloud-Aerosol Lidar and Infrared Pathfinder Satellite Observations) is a cloud and aerosol observation satellite operated by the National Aeronautics and Space Administration (NASA) and Centre National d’Etudes Spatiales (CNES). Its observations are used to determine the role of clouds and aerosols in regulating the Earth’s climate.
Quick facts
Overview
| Mission type | EO |
| Agency | NASA, CNES |
| Mission status | Mission complete |
| Launch date | 28 Apr 2006 |
| End of life date | 31 Jul 2023 |
| Measurement domain | Atmosphere |
| Measurement category | Cloud type, amount and cloud top temperature, Atmospheric Temperature Fields, Cloud particle properties and profile, Aerosols |
| Measurement detailed | Cloud top height, Cloud cover, Cloud optical depth, Aerosol optical depth (column/profile), Cloud ice (column/profile), Cloud imagery, Cloud base height, Aerosol Extinction / Backscatter (column/profile), Cloud ice effective radius (column/profile) |
| Instruments | CALIOP, IIR, WFC |
| Instrument type | Lidars, Imaging multi-spectral radiometers (vis/IR) |
| CEOS EO Handbook | See CALIPSO (Cloud-Aerosol Lidar and Infrared Pathfinder Satellite Observations) summary |
Summary
Mission Capabilities
CALIPSO carries three instruments: a Cloud-Aerosol Lidar with Orthogonal Polarisation (CALIOP), an Imaging Infrared Radiometer (IIR), and a Wide Field Camera (WFC). CALIOP uses a two-wavelength laser transmitter to obtain vertical profiles of clouds and aerosols from the detected backscatter. IIR provides context to nighttime CALIOP observations and acquires the size of particles within semi-transparent clouds, while WFC provides context for daytime CALIOP observations.
Performance Specifications
CALIOP emits two laser pulses with wavelengths 532 nm and 1064 nm and a pulse repetition frequency (PRP) of 20.16 Hz. It has a horizontal spatial resolution of 333 m and a vertical resolution of 30 m. IIR observes over three spectral bands, all thermal infrared (TIR): 8.7 µm, 10.5 µm, and 12.05 µm. IIR has a spatial resolution of 1 km x 1 km and a swath width of 64 km x 64 km, while WFC has a spatial resolution of 125 m and a swath width of 61 km.
CALIPSO maintains a sun-synchronous orbit with an altitude of 685 km, inclination of 98.2°, and period of 98.3 minutes.
Space & Hardware Components
CALIPSO utilises the Proteus bus developed by Thales Alenia Space. It was launched aboard NASA’s Boeing Delta II launch vehicle along with another cloud observation satellite named CloudSat, at the Vandenberg Air Force Base in California, USA. Both satellites joined the A-Train, a constellation of satellites that follow the same orbit. CloudSat experienced a mechanical error in February 2018, causing both CALIPSO and CloudSat to leave the A-Train to a lower orbit and form the C-train.
Telemetry, Tracking, and Command (TT&C) communications are transmitted via S-band radio frequencies with a downlink rate of 727 kbit/s and an uplink rate of 4 kbit/s. Payload data is transmitted in X-band at a rate of 80 Mbit/s.
WFC is no longer operational as of April 2020.
CALIPSO (Cloud-Aerosol Lidar and Infrared Pathfinder Satellite Observations)
Spacecraft Launch Mission Status Sensor Complement Ground Segment References
CALIPSO, alias PICASSO-CENA (Pathfinder Instruments for Cloud and Aerosol Spaceborne Observations / Climatologie Etendue des Nuages et des Aerosols), and alias ESSP-3 (Earth System Science Pathfinder-3), is a satellite science mission, a collaborative NASA/CNES project in the ESSP (Earth System Science Pathfinder) program of NASA. Other project partners (algorithm development, etc.) are Hampton University in Hampton, VA, and IPSL (Institut Pierre Simon Laplace), Jussieu, France.
The overall science objective of the mission is to profile the vertical distribution of clouds and aerosols and their role in the heating/cooling of the Earth (improve of estimates for direct and indirect radiative forcing, improve accuracy of long-wave radiative fluxes at the Earth's surface and within the atmosphere, assessment of cloud feed back in the climate system). The study of cloud and aerosols radiative impacts is within the GCRP (Global Climate Research Program) of WMO providing in particular inputs for GEWEX (Global Energy and Water Cycle Experiment) and CLIVAR (CLImate VARiability and predictability). 1) 2) 3) 4) 5) 6) 7) 8)
The mission is managed by NASA/LaRC. CNES supplies the S/C and an IR imaging sensor (of IASI heritage). NASA/LaRC provides the main instrument suite (a Ball-built lidar sensor) and S/C launch services aboard a Taurus launch vehicle. CNES provides S/C operations, the payload operations center is located at LaRC.
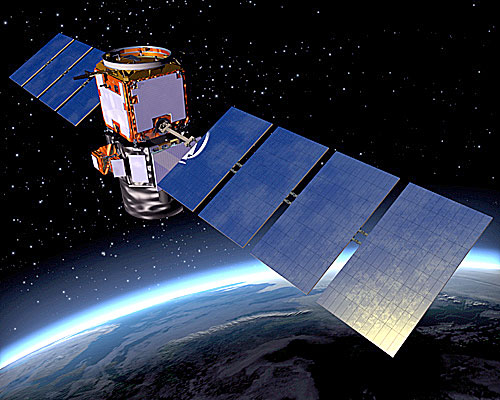
Spacecraft
The S/C employes an enhanced Proteus bus (of Jason-1 heritage), developed by Thales Alenia Space (prime contractor, formerly Alcatel Alenia Space), and funded by CNES. The platform structure has has dimensions of 2.46 m (height) x 1.51 m x 1.91 m. When deployed the solar arrays extend to 9.72 m. All the equipment units are accommodated on four lateral panels; the hydrazine mono-propellant system with a 40 liter tank and four 1 N thrusters are positioned on and under the lower plate. 9)
The S/C is three-axis stabilized. The normal in-orbit platform attitude control is based on a gyro-stellar concept. Three accurate 2-axis gyroscopes are used for stability requirements and attitude propagation. Attitude acquisition is obtained using magnetic and solar measurements (two 3-axis magnetometers and eight coarse sun sensors). The AOCS can provide yaw steering. Four small reactions wheels generate a torque for attitude control, they are de-saturated using magnetic torquers. The pointing attitude restitution is 0.05º (3 σ) on each axis. Accurate attitude determination is based on two star trackers (nominal and redundant) measurements. Both star trackers are accommodated on the payload in the STA (Star Tracker Assembly), equipped with an autonomous thermal control (the star trackers, SED16, were built at EADS Sodern). Each star tracker has a 25º circular FOV and includes a CCD detector (1024 x 1024) which is regulated to a temperature of -10ºC by a Peltier device. A GPS receiver provides satellite position information for accurate orbit ephemeris determination and onboard time delivery.
Electric power is generated by two symmetric wing arrays attached near to the satellite center of mass with two single axis stepping motor mechanisms. Each wing is constituted of four 1.5 x 0.8 m panels covered with classical silicon cells. The power is distributed through a single non-regulated primary electrical bus (23/37 V with an average 28 V voltage), using a Li-Ion battery (9 series-3 parallel technology) developed by SAFT, France. Up to 16 switchable power lines (5 A max) can be provided to the payload.
The DHU (Data Handling Unit) performs its tasks through the OBC (MA 31750 processor). It supports all onboard functions including the management of the communication links with every satellite unit, including the payload, either via discrete point-to-point lines, or via a MIL-STD-1553-B bus. The S/C mass is 635 kg including 28 kg of hydrazine, power = 560 W (average). The design life is 3 years.
RF communications: An onboard data storage capability of 60 Gbit is provided for the payload data and 2 Gbit for platform housekeeping data. TT&C communications are in S-band with data rates of 727 kbit/s for telemetry (QPSK modulation) and 4kbit/s for telecommands. The payload data are transmitted in X-band at 80 Mbit/s. The CCSDS packet standard protocol is used for telemetry encoding and telecommand decoding.
Launch
A launch of CALIPSO took place on April 28, 2006 from VAFB, CA (co-manifested with CloudSat, on a Delta-II 7420-10C vehicle). 10) 11)
Orbit: The CALIPSO spacecraft is part of the formation flight in the so-called “A-Train” (Aqua in the lead and Aura at the tail) or afternoon constellation. Near sun-synchronous orbit, altitude = 705 km, inclination = 98.05º, the ascending node crossing time is around 13:30 hours.
All members of the A-train employ the WRS-2 (World Reference System-2), a global catalog notation system for data which enables a user to inquire about satellite imagery (ground coverage in any repeat cycle) over any portion of the world by specifying a nominal scene center designated by PATH and ROW numbers. However, CALIPSO and CloudSat are not using the WRS-2 reference. CALIPSO is controlled to a customized grid shifted 215 km east from the WRS-2. And CloudSat is flying in close formation with CALIPSO (12.5 ± 2.5 s ahead of it).
Observation strategy: The train consists of the following S/C: Aqua, CloudSat, CALIPSO, PARASOL, and Aura. The objective is to provide a coincident set of data on aerosol and cloud properties, radiative fluxes and atmospheric state essential for accurate quantification of aerosol and cloud radiative effects. The formation flight of CALIPSO with Aqua and CloudSat includes the following constraints:
• CALIPSO shall maintain the formation with Aqua
• CloudSat shall maintain the formation with CALIPSO.
The CALIPSO orbit is maintained so that a target area can be observed within 6 minutes of each other (CALIPSO and Aqua). The relevant Aqua instruments for CALIPSO are: CERES, MODIS, AIRS, and AMSR-E.
Mission Status
• August 10, 2021: Every evening, small fish and microscopic animals called zooplankton journey to the ocean surface, where they feast on microscopic plants under the moonlight before returning to the depths at dawn. With data collected during the EXport Processes in the Ocean from Remote Sensing (EXPORTS) field campaign in 2019 to the Northeastern Pacific Ocean, scientists have now shown that some zooplankton living in the twilight zone of the ocean at depths of greater than 300 meters swim up and down also in response to shifts in light due to cloud cover. 12)
- The nightly trek from the ocean depths to the surface has been called the largest migration on Earth, because of both the number of animals who make the nightly trek and how far these tiny creatures travel roundtrip. NASA has observed this global migration with a space-based laser on the CALIPSO satellite. The discovery that when clouds pass overhead, zooplankton make "mini-migrations" of about 50 feet on average comes from data collected during NASA's EXPORTS mission, which seeks to better understand the export and fate of carbon from the upper ocean to the deep using satellite observations and state of the art ocean technologies. During the expedition, they used an instrument called an ADCP (Acoustic Doppler Current Profiler) to measure ocean currents. The instrument sends out pings of sound that bounce off suspended material in the water column, like particles or zooplankton. Some of those pings are reflected to the instrument, while others are scattered.
• July 14, 2020: A space-based laser that measures clouds and small atmospheric particles has provided a unique view of the massive Saharan dust plume that crossed the North Atlantic Ocean in June. 13)Satellite observations from CALIPSO, GOES-East, and other instruments provide critical information to track the vertical and horizontal transport of Saharan dust. Atmospheric scientists can then plug that data into their air quality models, which helps fine tune them and allows for better prediction of effects from these events. Though long range Saharan dust events occur every summer, the unusually large quantity of dust remaining after this plume's trans-Atlantic voyage earned it the nickname “Godzilla.”
- The animation here includes images and data from instruments on board the CALIPSO and the National Oceanic and Atmospheric Administration (NOAA) GOES-East satellites, which observed the event unfold in great detail June 18-27. The animation visualizes true-colour photographs from the GOES-East imager beneath vertical profiles of measurements acquired from CALIPSO's lidar several hours earlier. Together, they show the impressive extent of the dust plume across the ocean and into the atmosphere.
• June 27, 2020: Winds routinely drive clouds of Saharan dust out of West Africa and across the Atlantic Ocean in the summer. But the intensity and extent of a plume that departed Africa in June 2020. As the dust blanketed the Caribbean Sea and darkened skies in several states in the U.S. Southeast, several meteorologists called the event “historic.” 14)CALIOP instrument data was used to log the dusts distribution and height. While dust routinely blows across the Atlantic Ocean, scientists rarely see plumes as large and dense with particles as the one that darkened Caribbean skies in June 2020.
- Air pollution experts are not the only specialists who are closely following this event. Meteorologists track dust storms because the dry, dusty air can inhibit the formation of clouds and prevent hurricanes. Infectious disease researchers watch them because dust plumes can be vectors for viral and bacterial diseases. Climate scientists study dust because big events can absorb enough light to affect Earth’s radiation budget. Others will be watching for impacts on the oceans. Outbreaks of Saharan dust can play a key role in fertilizing the nutrient-poor soils of the Amazon rainforest in the winter and spring.
• November 27, 2019: Every night, countless small sea creatures – from squid to krill – swim from the ocean depths to near the surface to feed. This vast nightly animal migration is a critical part of Earth’s climate system (carbon cycle) — was observed globally for the first time using CALIPSO and CALIOP. 15) 16)
- Researchers observed this vertical migration pattern using the CALIPSO (Cloud-Aerosol Lidar and Infrared Pathfinder Satellite Observations) satellite — a joint venture between NASA and the French space agency, CNES (Centre National d'Etudes Spatiales) — that launched in 2006. They published their findings in the journal Nature Wednesday. 17) CALIOP allowed researchers to sample these migrating animals on a global scale every 16 days for 10 years. Though CALIPSO's laser was designed to measure clouds and atmospheric aerosols, it can penetrate the upper 20 meters of the ocean's surface layer. If the migrating animals reach this layer, they are detected by CALIPSO.
- The study looks at a phenomenon known as DVM (Diel Vertical Migration), in which small sea creatures swim up from the deep ocean at night to feed on phytoplankton near the surface, then return to the depths just before sunrise. Scientists recognise this natural daily movement around the world as the largest migration of animals on Earth in terms of total number.
• September 30, 2019: The Lidar In-space Technology Experiment (LITE), developed and built at Langley, was the principal payload on space shuttle Discovery during STS-64. Between Sept. 9 and 20, 1994, LITE operated for 53 hours, collected more than 40 gigabytes of data (a lot for the time), and covered 1.4 million kilometres of ground track. 18)
- Though its mission was short-lived, LITE's influence continues to show itself in other projects. Space-based lidar systems such as CALIPSO, which measures atmospheric aerosols and clouds, are giving scientists reams of data that are constantly improving their understanding of how the atmosphere works. The Atmospheric Dynamics Mission Aeolus (ADM-Aeolus), a first-of-its-kind European Space Agency (ESA) satellite that uses lidar to measure wind profiles, launched in 2018 and will improve weather forecasting. With a changing climate and an intensification of severe storms and wildfires, these instruments are of increasing benefit to humanity. Global views and data from CALIPSO can help scientists track smoke from wildfires as it travels vast distances and affects air quality in places hundreds or even thousands of miles away. It can also help the commercial airline industry direct traffic when a volcanic eruption lofts dangerous plumes of ash high into the atmosphere.
• September 27, 2018: CloudSat and CALIPSO were designed to complement each other in the 1990s. They launched together on the same rocket in 2006. Then they spent more than 10 years orbiting Earth in formation with a coterie of other satellites in what's known as the A-Train, or afternoon constellation. 19) Flying together enables the A Train satellites to gather diverse measurements of the Earth below at nearly the same time as they circle the globe pole-to-pole, crossing the equator around 1:30 p.m. local time every day. The nearly simultaneous observations allow scientists to build a more sophisticated understanding of the Earth system than would be possible if the measurements were separated. Other members of the A Train include NASA's Aqua, Orbiting Carbon Observatory-2 and Aura spacecraft, along with the Japan Aerospace Exploration Agency’s Global Change Observation Mission - Water (GCOM-W1) satellite. In the A-Train, measurements from CloudSat's radar and CALIPSO's lidar were combined to revolutionise the way scientists see clouds and the tiny particles suspended in the atmosphere collectively known as aerosols. Scientists have long known that there are important interrelationships between clouds and aerosols, but prior to the launch of CALIPSO and CloudSat, did not have the tools to understand how they interact.
- In the early 1990's scientists came up with the idea of putting two "active" sensors in space to take complementary measurements of Earth's atmosphere. CloudSat and CALIPSO are known as "active" sensors because they direct beams of energy at the Earth (Radio wave signals in the case of CloudSat and laser light in the case of CALIPSO) and measure how these beams reflect from the clouds and aerosols in the atmosphere. Other orbiting science instruments use "passive" sensors that rely on collecting reflected sunlight or radiation emitted from the Earth or clouds to make measurements.
- In the A-Train, which orbits approximately 705 km above Earth's surface, the satellites initially flew one after the other, about 15 seconds apart. That allowed them to take near-simultaneous measurements of clouds. The combination of high-powered radar and lidar gave researchers an unprecedented view into those clouds' vertical structures. For instance, some passive sensors have difficulty "seeing" through wispy, high-altitude cirrus clouds that might mask thicker clouds below. But CALIPSO's lidar is able to see the vertical structure of the cirrus clouds and much of the thicker clouds below, while CloudSat's radar probes the even thicker and rain-producing clouds below. The satellites also have complemented each other by revealing important insights about the effects of aerosols on clouds and precipitation. That had been a point of great uncertainty. Data products from both CALIPSO and CloudSat have been cited in thousands of scientific publications.
• September 13, 2017: One of CloudSat's four reaction wheels, which help it manoeuvere, became unusable. Though CloudSat can still operate with only three reaction wheels, the potential loss of a second wheel could have caused it to drift too close to another A-Train satellite.
- In February CloudSat moved to a "safe-exit orbit" below the A-Train. CloudSat scientists hoped if they offered to move their satellite into CALIPSO's disposal orbit. There, they could spend the beginning years of a decades-long descent into Earth's atmosphere squeezing out every last possible drop of coordinated data and joint science. CALIPSO and CloudSat were intended to be a pair and so eventually the decision was reached to also remove it from its current orbit.
- CALIPSO began its exit from the A-Train and entered its new orbit Sept. 20. The C-Train orbit is approximately 688 km above the Earth's surface. It'll take some time to get the satellites in phase with one another, and they'll be a little farther apart than they once were, about 60 seconds. But once they're completely settled in they'll continue to provide indispensable, complementary views of clouds and aerosols for what scientists hoped would be another two years . Then, about 25 years from now, long after both sister satellites have stopped working, they will burn up and disintegrate as they reenter the very atmosphere they spent so long observing together.
• May 2017: After 11 successful years of science operations, CNES and NASA agreed to extend the Calipso mission for another 3 years (2018-2020). 20) 21) In addition to maintaining the French scientific community’s dynamic and structure in the field of space lidar, 4 essential objectives have been identified to justify a 3-year extension:
a) An extended observation period also allows for richer statistical sampling and increases the chances to observe punctual events such as volcanic eruptions
b) Observational continuity with future missions extending the Calipso mission to 2020 will ensure continuity with the CATS (NASA, lidar aboard the ISS, already in orbit), ADM-Aeolus (ESA, planned for launch in early 2018), and possibly EarthCARE (ESA, launch due in August 2019) missions. ESA missions Aeolus and EarthCARE will operate lidars on different wavelengths (355 nm instead of 532 and 1064 nm), so data will have to be recalibrated in order to provide continuous series from active sensors. A longer simultaneous observation period will provide a better comparison and analysis of specific data from each of these missions. Calipso will also improve these missions’ Cal/Val exercises (as suggested in a co-written letter from the Aeolus and Earthcare mission scientists).
c) Contributing to several upcoming scientific campaigns such as EUREC4A (S. Bony, the Field Study, 2020), EXAEDRE (Eric Defer, 2018), MOSAIC (Arctic, 2020)
d) Developing new applications: Two new research activities are growing rapidly: data mining using air quality prediction models (the Copernicus C3S and CAMS services, as well as the French national meteorological service Météo-France, have expressed great interest for this field), and assessing the oceanic surface layer’s optical properties.
- When it comes to the space segment of the Calipso mission, the satellite had been in orbit for over 11 years; every redundancy is still in place and the payload is still operating at full capacity with comfortable leeway for both temperature and power. Calipso will be able to stay its course on the A-Train at least until 2019, and then slowly drift eastward from Aqua, but without any effect on the satellite or its mission. The WFC and IIR instruments remain fully operational and the lidar’s performance is generally excellent. However, low-energy impulses can be observed in the SAA above the planet’s poles, and the laser’s pressure levels lead to Corona impulses such as the one observed on the primary laser in 2009. Therefore, the current laser should soon be switched off to be replaced by the primary laser, which should be out of the critical pressure zone.
| Conclusion |
| |
FY18-20 | FY21-23 | ||
Aqua | Continue | Continue |
|
Aura | Continue/Reduce | Continue/Reduce | Stop TES Operations/Finalize Dataset |
CATS | Continue | N/A |
|
Calipso | Continue | Continue |
|
Cloudsat | Continue/Augment* | Continue/Augment | Cross-calibration for climate record |
DSCOVR EPIC & NISTAR | Continue/Augment* | Continue/Augment* | Additional Competed Science Needed |
GPM | Continue | Continue |
|
OCO-2 | Continue/Augment* | Continue | Refine XCO2 algorithm for flux req'ts |
QuickSCAT | Continue/Augment for 1 year/2 years depending on ScatSat Stability |
| |
SMAP | Continue | Continue |
|
SORCE | Continue/Augment | Continue/Augment |
|
TCTE | Continue/Augment | N/A |
|
Terra | Continue/Augment* | Continue | MISR algorithm update |
• December 20, 2016: A new study, using the NASA satellite instrument CALIOP orbiting Earth on the CALIPSO mission, has found that small, environmental changes in polar food webs significantly influence the boom-and-bust, or peak and decline, cycles of phytoplankton. 22) NASA’s CALIOP (Cloud-Aerosol LIdar with Orthogonal Polarization) used its laser to take measurements for the study. Scientists used the instrument to continuously monitor plankton in polar regions from 2006 to 2015. CALIOP allowed for the study of high-latitude ocean ecosystem during times of year when scientists were previously completely blind.
- Ocean ecosystems typically are monitored with satellite sensors that simply measure sunlight reflected back to space from the ocean. These instruments have a problem seeing the ocean plankton in polar regions because of limited sunlight and persistent clouds that obscure their view of the ocean surface. The CALIOP lidar shines its own light – a laser – and can illuminate and measure the plankton day or night, in between clouds, and even through some clouds.
- The current CALIOP lidar was engineered to take atmospheric measurements, not optimized for ocean measurements. Nonetheless, the CALIOP ocean measurements are scientifically valuable, as demonstrated by the results of this study. New lidar technology is being tested that would allow scientists to better measure how phytoplankton are distributed through the sunlit layer of the ocean.
• On April 28, 2016, the CALIPSO spacecraft was 10 years on orbit. Leaders from the cooperative mission of NASA and CNES (Centre National d’Etudes Spatiales), the space agency of France, gathered on April 21, at NASA/LaRC (Langley Research Center) in Hampton, Virginia, to celebrate this remarkable and durable record of success. 24)
- Since its launch in 2006, CALIPSO has orbited the Earth tirelessly, using its lasers to take more than 5.7 billion lidar (light detection and ranging) measurements probing the vertical structure and properties of clouds and other particles — such as dust, sea salt, ash and soot — in the air. For atmospheric scientists, the ability to regularly and accurately examine clouds and particles at different heights was something new. In addition to the other equipment flying on the A-Train, CALIPSO has offered observations in formerly unobserved areas.
- Also, scientists are able to combine CALIPSO’s measurements with those of other Earth-observing satellites circling the globe in a cooperative path called the A-Train constellation. CALIPSO and CloudSat, a satellite containing a cloud-profiling radar, launched together on a Delta II rocket, now fly in formation with satellites named Aqua, Aura, GCOM-W (Global Change Observation Mission-Water) and OCO-2 (Orbiting Carbon Observatory-2). Combining measurements from these A-Train satellites offers a clearer view of what’s happening in the atmosphere. Originally designed as a three-year mission, CALIPSO at this point has past its 10th anniversary.
• May 2015: (9 years after launch) CALIPSO observations are a recognised and unique contribution to the study of clouds and aerosols, and in the validation of climate models. The 2015 GIEC (Groupe d'experts intergouvernemental sur l'évolution du climat) repport highlights it. A new extension by 2 years of the CALIPSO mission in the A-TRAIN was confirmed for 2016-2017, it enabled 25): Long term observation needed to understand the role of clouds and aerosols on the Earth's climate, CALIPSO/OCO-2 coupled observations to study the influence of the aerosols on the CO2 restitution, An overlap or continuity with the CATS, ADM-Aeolus, EarthCARE and SAGE-III missions, and the estimation of the contribution of the Lidar measurements to the ocean colour thematic, by a measurement campaign using the 30 º depointing capability in order to observe the phytoplankton while minimizing the specular reflections.
• March 2015: Wind and weather pick up on average 182 million tons of dust each year and carry it past the western edge of the Sahara (at 15° W longitude). The dust then travels 2500 km across the Atlantic Ocean, though some drops to the surface or is flushed from the sky by rain. The CALIPSO satellite quantified in three dimensions how much dust makes its trans-Atlantic journey. Scientists measured the volume of dust and calculated how much phosphorus gets carried across the ocean. 26) This study provides a first multiyear satellite-based estimate of dust deposition into the Amazon Basin using three-dimensional (3-D) aerosol measurements over 2007–2013 from the CALIOP (Cloud-Aerosol Lidar with Orthogonal Polarization) instrument. CALIOP can distinguish dust from other particles based on optical properties. CALIOP can distinguish dust from other particles based on optical properties. In Feb. 2015, NASA produced an animation showing that wind and weather pick up on average 182 million tons of dust each year and carry it past the western edge of the Sahara (at 15° W longitude).
• November 27, 2014: CALIPSO passed the 5 billion of laser shootings: 1.62 billion for the primary laser and 3.38 for the secondary laser (nominally used since 2009), thus a total of 100 seconds of light emission for 8 years and 7 months of data in orbit! 30) The CALIPSO mission exploitation has been extended until the end of 2015. Beginning in 2015, another 2 years extension will be discussed by the 2 agencies (Ref. 32).
• 2012: The CALIPSO spacecraft and its payload are operating nominally in 2012. 32)NASA and CNES extend CALIPSO mission exploitation until the end of 2013. Beginning 2013, another 2 years extension will be studied by the 2 agencies. - Already in June 2011, the NASA Earth Science Senior Review recommended an extension of the Calipso mission up to 2015. 33)
• 2011: The CALIPSO spacecraft and its payload were operating nominally in 2011. The CALIPSO mission provided the first multi-year global dataset of lidar aerosol and cloud profiles. CALIOP active profiling in conjunction with A-Train and CALIPSO passive observations opened new fields of investigation into the role of aerosols and clouds in the climate system, from direct comparison with model outputs and ongoing developments in data assimilation. 34)
• April 2010: the CALIPSO spacecraft completed its 4th year in orbit. Since the laser switch in March 2009, the mission continued nominally and the laser performances are excellent. 35) The spacecraft and its payload operated nominally in 2010. NASA requested a mission extension in the A-Train to the end of 2011. In 2009 the Senior Review Panel recommended to NASA that an extended mission status would lead to more fundamental science results. In addition, the synergy between CALIPSO and other A-train components was vital and the measurements were crucial as a bridge to the next satellite lidar mission: the ADM (Atmospheric Dynamics Mission), the European Space Agency lidar scheduled for launch in 2011, as well as EarthCARE (2013) and ACE (2015). 36) 37) 38)
• April 2009: CALIPSO resumed operations after switching from its primary to its backup laser in March 2009. The backup laser was designed into CALIPSO to make it robust, in case the primary laser became unreliable. In early 2009 the primary laser began to behave erratically, due to a slow pressure leak in the laser's canister. The backup laser provided its first observation data on March 12, 2009. The instrument then resumed normal operations and underwent a calibration review. The release of standard data products resumed in late April 2009. 39) 40) 41)
• December 2006: the CALIPSO mission started the distribution of its data products. This data release consisted of data beginning in mid June 2006 and includes Level 1 radiances from each of the instruments. This release also included the lidar Level 2 vertical feature mask and cloud and aerosol layer products. The CALIPSO data are available through the Atmospheric Science Data Center (ASDC) at NASA/LaRC.
• June 2006: CALIPSO joined the A-train and the satellite was in routine operations. CALIPSO is controlled to ± 10 km at equator crossing. After launch, the spacecraft underwent a commissioning phase of 38 days. Based on telemetry data, the pointing performance of the spacecraft was < 0.02º about each axis. 42)
Sensor Complement
The payload consists of three co-aligned nadir viewing instruments: CALIOP (Cloud-Aerosol LIdar with Orthogonal Polarization), IIR (Imaging Infrared Radiometer), and WFC (Wide-Field Camera).
• CALIOP has a two-wavelength laser transmitter and a three-channel receiver
• The IIR is a three-channel infrared radiometer
• The WFC is a visible imager with a single channel.
The two passive sensors image a 60 km swath centered on the lidar footprint. 43)
CALIOP (Cloud-Aerosol Lidar with Orthogonal Polarization)
CALIOP is provided by NASA/LaRC (built by Ball Aerospace and Technologies Corporation). The objective is to acquire vertical profiles of elastic backscatter (distributions of aerosols and clouds, cloud particle phase) at dual-wavelength frequencies from a nadir-viewing geometry during the day and night phases of the orbit.
CALIOP consists of a laser transmitter subsystem, a receiver subsystem, and the payload controller (PLC) subsystem. The laser transmitter subsystem consists of two redundant lasers, each with a beam expander, and a beam steering system ensuring alignment between the transmitter and receiver. The Q-switched Nd:YAG lasers use a crossed porro prism resonator design to minimize alignment sensitivity and polarization outcoupling to provide a highly polarized output beam. Frequency doubling produces simultaneous pulses at 1064 nm and at 532 nm. Each laser produces 110 mJ of energy at each of the two wavelengths at a pulse repetition rate of 20.16 Hz, although only one laser is operated at a time. Beam expanders reduce the angular divergence of the laser beam to produce a footprint of 70 m diameter on the Earth's surface.
Two orthogonal polarization components (parallel and perpendicular to the polarization plane of the transmitted beam) are measured at 532 nm. Vertical profiles are measured from the surface to 40 km with the 532 nm channel, with the upper region used for normalization/calibration. The other two channels span 0 to +26 km, covering the cloud and aerosol measurement region with polar stratospheric clouds occurring toward the top of the range. The maximum vertical resolution is 30 m, the footprint diameter on the ground is 70 m. The horizontal spacing between footprint centers is 333 m (along-track). Low altitude data are being downlinked at full resolution. At altitudes above 5 km, resolutions are reduced by on-board averaging. 44) 45) 46) 47) 48) 49)
Lidar type | Nd:YAG, diode-pumped, Q-switched, frequency-doubled |
Wavelength (2) | 532 nm and 1064 nm |
Energy/pulse | 105 - 115 mJ |
PRF (Pulse Repetition Frequency) | 20.16 Hz |
Pulse width | 20 ns nominal |
|
|
Telescope aperture diameter | 1.0 m |
FOV (Field of View) | 130 µrad |
Digitization rate | 10 MHz |
Detector type (532 nm channel) | PMT (Photomultiplier Tube) |
Detector type (1064 nm channel) | APD (Avalanche Photodiode) |
Horizontal/vertical resolution | 333 m/30 m |
Data rate | 332 kbit/s |
Instrument mass, power | 156 kg (CALIOP only), 124 W |
Calibration: CALIOP is calibrated in three steps.
• First, the 532 nm parallel channel signal is calibrated to the predicted molecular volume backscatter coefficient in the 30-34 km region. The molecular backscatter coefficient can be accurately estimated using temperature and pressure profiles from a gridded meteorological analysis product. The 30-34 km region was chosen as the aerosol backscatter in that region is insignificant with respect to molecular backscatter and the molecular density does not exhibit large variations. The parallel-polarized component of the molecular backscatter is derived from the estimate of total molecular backscatter by taking into account the bandwidth of the receiver optical filters. Independent estimates of the 532 nm parallel channel calibration constant are computed at approximately 700 km intervals over the dark side of each orbit and interpolated to the day side.
• Second, the calibration of the 532-nm parallel channel is transferred to the perpendicular channel via insertion of a pseudo-depolarizer in the receiver optical path upstream from the polarization beamsplitter (Figure 25). The pseudo depolarizer ensures that, regardless of the polarization state of the backscatter incident on the receiver, an equal amount of light is sent to the parallel and perpendicular channels of the receiver downstream of the depolarizer. The pseudo depolarizer will be inserted periodically during the mission, to track any relative change in sensitivity of the parallel and perpendicular channel detectors.
• Third, the calibration of the 532 nm channels is transferred to the 1064 nm channel via comparison of the return signals from high-altitude cirrus clouds. Cirrus cloud particles are large compared to the transmitted wavelengths, so the backscatter coefficients will be nearly equal at 532 nm and 1064 nm. By choosing clouds for which the ratio of particulate to molecular scattering is 50 and above, the calibration can be transferred with high accuracy. This calibration can be performed on both the dark and daylight side of the orbit, wherever cirrus of sufficient backscatter strength exist.
IIR (Imaging Infrared Radiometer)
IIR is provided by CNES and developed at EADS Sodern, France. The objective is to measure calibrated radiances at 10.5 and at 12 µm over a 40 km swath (the two wavelengths are chosen to optimize the joint Lidar/IIR retrievals of cirrus emissivity and particle size).
IIR is a nadir-viewing, non-scanning imager having a 64 km x 64 km swath with a pixel size of 1 km. The CALIOP beam is nominally aligned with the center of an IIR image. IIR uses a single microbolometer detector array (uncooled), with a rotating filter wheel providing measurements at three channels in the window region, on either side of the O3 absorption band at 9.6 µm. The central wavelengths (and spectral widths) of the three channels are 8.65 µm (0.9 µm), 10.6 µm (0.6 µm), and 12.05 µm (1.0 µm). These wavelengths were selected to optimize joint CALIOP/IIR retrievals of cirrus cloud emissivity and particle size. 50) 51) 52) 53)
The IIR device is composed of:
• The ISM (Imaging Sensor Module), constituted of an objective (aperture 0.75) optimized in the thermal infrared, a microbolometer detector array, specific electronics, a passive cooler to refrigerate the whole, and some mechanical pieces
• A filter-carrying wheel enabling to insert alternately 3 spectral filter in front of the camera
• A black body to calibrate the camera
• A pointing mirror rotating to sequentially select between the Earthview, the black body and the direction of the cold space (second source for calibration).
On-orbit calibration: The calibration procedure requires viewing scenes at two different known temperatures. A cold scene calibration (4 K) is achieved by observing deep space every 8 seconds, while a hot scene calibration (300 K) is performed every 40 seconds using an internal blackbody source.
Spectral bands (3) | 8.7 µm, bandwidth: 0.9 µm |
Spatial resolution (IFOV) | 1 km x 1 km (64 x 64 pixels) |
FOV or swath width | 64 km x 64 km (90 mrad x 90 mrad) |
Microbolometer detector array | Boeing U3000 detector |
Radiometric performance | NEΔT < 0.5 K @ 210 K; Absolute calibration accuracy < 1 K |
Data rate | 50 kbit/s |
Instrument mass, volume | 24 kg, 490 mm x 550 mm x 320 mm |
Power consumption | 27 W |
Note: The IIR instrument is also referred to as CIM-02 (Caméra Infra-rouge Multimission) on the CALIPSO mission. CIM-02 is of CIM-01 heritage flown on the MetOp-01 mission of EUMETSAT (CIM-01 is also referred to as the “IASI Infrared Imager”). CIM02 differs from CIM01 through its optical interface, the objective and the radiator have been re-designed.
WFC (Wide-Field Camera)
WFC was built by Ball Aerospace (a modified version of a commercial star camera, CT-633, a pushbroom type device with a CCD detector array of 512 x 512 pixels). The objective is to provide meteorological context and highly accurate spatial registration between the CALIPSO and the Aqua mission. 54) 55)
WFC is a digital CCD camera with a spectral coverage of 620-670 nm (single band) providing images of a 61 km swath with a spatial resolution of 1 km. In a 5 km central band, the spatial resolution is 125 m. Although the WFC comes with a 512 x 512 CCD array, it essentially operates in the pushbroom line array fashion by reading out only one row of pixels per image frame. Nominally, 488 of the 512 pixels in the target row are being utilized. To minimize smearing effects during readout operations, most of the CCD array is masked off except about 30 rows near the center.
The source data rate is 26 kbit/s. The WFC imagery is also being used to assess the cloud fraction within 1 km IIR pixels to enhance the retrieval of cloud properties from the IIR data.
Parameter | Specification | Comment |
Bandpass | 620-670 nm | Compatible with MODIS channel 1 |
Single pixel IFOV | 125 m x 125 m | 24 µm pixels; 135 mm focal length |
Full swath FOV | 61 km | 488 pixels in cross-track |
Dynamic range | 16 bit | Standard on CT-633 |
SNR at Lmax, (730 Wm-2 µm-1 sr-1) | 435 | f/8 lens and full-well, capacity of 150 ke- |
SNR at Ltyp, (12 Wm-2 µm-1 sr-1) | 51 | as above |
Data rate | 26 kbit/s |
|
Ground Segment
The CALIPSO ground segment is comprised of two main components:
1) SOGC (Satellite Operations Ground System), consisting of:
• SOCC (Satellite Operations Control Center), located in Toulouse (France)
• TT&C S-band ground stations at Kiruna (Sweden) and Aussaguel (France)
• A digital communication network that provides communication between ground segment components.
2) MOGS (Mission Operations Ground System), dedicated to mission management, detailed payload data processing, payload programming and monitoring and preparation of commands. It consists of:
• The payload data delivery system, including the X-band ground stations located in Alaska (prime), and Hawaii (backup)
• MOCC (Mission Operations Control Center), in Hampton, VA (NASA/LaRC).
Data and quick-looks of the CALIPSO mission are archived at the NASA/LaRC Atmospheric Sciences Data Center (ASDC). A mirror data site, part of the French ICARE structure, is located in Lille and operated by CNES, CNRS, the University of Lille, and the Région Nord-Pas-de-Calais. 56)
The thematic pole ICARE is managing the production and distribution of the scientific outputs of PARASOL and CALIPSO through its data processing and management center in Lille (CGTD). In the case of CALIPSO, it acts as a mirror site of NASA. In late 2009, the CGTD ICARE was managing the distribution of four TB of data per month, for the benefit of 380 registered users.
References
1) D. M. Winker, B. A Wielicki, “The PICASSO-CENA Mission,” Part of the EUROPTO Conference on Sensors, Systems and Next Generation Satellites, Proceedings of SPIE, Vol. 3870, Florence, Italy, Sept. 20-24, 1999, pp. 26-36
2) J. Blouvac, B. Lazaed, J. M. Martinuzzi, “CNES Small Satellites Earth Observation Scientific Future Missions, IAA 2nd International Symposium on Small Satellites for Earth Observation, Berlin, April 12-16, 1999, pp. 11-14
3) J. Reagan, D. Winker, “PICASSO-CENA: Combined Active-Passive Sensing from Space,” Proceedings of IGARSS'99, Vol. 1, pp. 240-242
4) D. M. Winker, “Global Observations of Aerosols and Clouds from combined Lidar and passive Instruments to improve Radiation Budget and Climate Studies,” The Earth Observer, Vol. 11, No 3, May/June 1999, pp. 22-25
5) D. Q. Robinson, “PICASSO-CENA Satellite-Based Research Mission: K-12 Education and Public Outreach (Student use of remote sensing for research validation),” Proceedings of the IEEE/IGARSS 2000 Conference, Honolulu, HI, July 24-28, 2000
6) http://smsc.cnes.fr/CALIPSO/Fr/
7) http://www.nasa.gov/mission_pages/calipso/main/index.html
8) http://smsc.cnes.fr/CALIPSO/dossier_de_presse_va.pdf
9) F. Paoli, J. Blouvac, “CALIPSO: A Small Satellite in Low Earth Orbit for the Study of the Clouds and Aerosols,” Proceedings of the IAC 2005, Fukuoda, Japan, Oct. 17-21, 2005, IAC-05-B5.2.02
10) NASA CloudSat-CALIPSO Press Kit, April 2006, URL: http://www.nasa.gov
/pdf/147741main_cloudsat-calipso4.pdf
11) Corinne Salcedo, Laurie M. Mann, “CALIPSO and CloudSat Coordinated Ascent Phase to the EOS Afternoon Constellation,” SpaceOps 2006 Conference, Rome, Italy, June 19-23, 2006, paper: AIAA 2006-5759 URL: http://www.ai-solutions.com/Portals/0/
AI%20Docs/Technical%20Paper%20Library%20pdf/2006/10.pdf
12) Sofie Bates, ”Passing Clouds Cause Some Marine Animals to Make Mini-Migrations During the Day,” NASA Feature, 10 August 2021, URL: https://www.nasa.gov/feature/esnt/goddard/2021/
passing-clouds-cause-some-marine-animals-to-make-mini-migrations-during-the-day
13) Kristyn Damadeo, ”NASA, CNES Space Laser Measures Massive Saharan Dust Plume,” NASA /LaRC , 14 July 2020, URL: https://www.nasa.gov/feature/langley/
nasa-cnes-space-laser-measures-massive-saharan-dust-plume
14) ”A Dust Plume to Remember,” NASA Earth Observatory, 27 June 2020, URL: https://earthobservatory.nasa.gov/images/146913/a-dust-plume-to-remember
15) ”NASA, French Space Laser Measures Massive Migration of Ocean Animals,” NASA Press Release 19-091, 27 November 2019, URL: https://www.nasa.gov/press-release/
nasa-french-space-laser-measures-massive-migration-of-ocean-animals
16) ”Satellite Observes Massive Ocean Migration,” NASA Earth Observatory, Image of the Day for 4 December 2019, URL: https://earthobservatory.nasa.gov/
images/145941/satellite-observes-massive-ocean-migration
17) Michael J. Behrenfeld, Peter Gaube, Alice Della Penna, Robert T. O’Malley, William J. Burt, Yongxiang Hu, Paula S. Bontempi, Deborah K. Steinberg, Emmanuel S. Boss, David A. Siegel, Chris A. Hostetler, Philippe D. Tortell & Scott C. Doney, ”Global satellite-observed daily vertical migrations of ocean animals,” Nature, 27 November 2019, https://doi.org/10.1038/s41586-019-1796-9
18) Joe Atkinson, ”Beam of LITE: 25 Years of Earth-observing Lidar in Space,” 30 September 2019, URL: https://web.archive.org/web/20201229163653/https://www.nasa.gov/feature/langley/a-beam-of-lite-25-years-of-earth-observing-lidar-in-space/
19) Joe Atkinson, ”Sister Satellites, Briefly Separated, Working Together Again,” NASA, 27 September 2018, URL: [web source no longer available]
20) ”Events Archive,” CNES, 27 Nov. 2017, URL: https://calipso.cnes.fr/en/CALIPSO/GP_actualite.htm
21) Douglas Vandemark (Chair), Mark Bourassa, Shu-Hua Chen, Heidi Dierssen, Paul Houser, Lyatt Jaegle, Carol Johnson, Guosheng Liu, George Mount, David Mitchell, Jun Wang, Diane Wickland, Curtis Woodcock, ”NASA Earth Science Senior Review Subcommittee Report - 2017,” Submitted to the NASA Earth Science Advisory Committee, June 22, 2017, URL: https://smd-prod.s3.amazonaws.com
/science-pink/s3fs-public/atoms/files/2017-NASA-ESSR_V2_FINALcorrected.pdf
22) Dwayne Brown, Joe Atkinson, ”Space Laser Reveals Boom-and-Bust Cycle of Polar Ocean Plants,” NASA, Release 16-121, Dec. 20, 2016, URL: https://www.nasa.gov/
press-release/space-laser-reveals-boom-and-bust-cycle-of-polar-ocean-plants
23) Michael J. Behrenfeld, Yongxiang Hu, Robert T. O’Malley, Emmanuel S. Boss, Chris A. Hostetler, David A. Siegel, Jorge L. Sarmiento, Jennifer Schulien, Johnathan W. Hair, Xiaomei Lu, Sharon Rodier, Amy Jo Scarino, ”Annual boom–bust cycles of polar phytoplankton biomass revealed by space-based lidar,” Nature Geoscience,Published online Dec. 19, 2016, doi:10.1038/ngeo2861, URL of abstract: http://www.nature.com/ngeo/journal/vaop/ncurrent/full/ngeo2861.html
24) Sam McDonald, ”CALIPSO Celebrates 10 Years of Cloud Observations from Space,” NASA, April 22, 2016, URL: http://www.nasa.gov/feature/langley/
calipso-celebrates-10-years-of-cloud-observations-from-space
25) 8th CALIPSO Exploitation Review, 3rdMission Extension Review (REDEM) at CNES Toulouse,” CNES, May 2015, URL: https://calipso.cnes.fr/en/CALIPSO/GP_actualite.htm
26) Ellen Gray, “NASA Satellite Reveals How Much Saharan Dust Feeds Amazon’s Plants,” NASA, The Earth Observer, Volume 27, Issue 2, March-April 2015, pp: 46-47, URL: http://eospso.gsfc.nasa.gov/sites/default/files/eo_pdfs/Mar_Apr_2015_color_508.pdf
27) Tony Phillips, “Desert Dust Feeds Amazon Forests,” NASA Science News, April 29, 2015, URL: http://science.nasa.gov/science-news/science-at-nasa/2015/29apr_amazondust/
28) Hongbin Yu, Mian Chin, Tianle Yuan, Huisheng Bian, Lorraine A. Remer, Joseph M. Prospero, Ali Omar, David Winker, Yuekui Yang, Yan Zhang, Zhibo Zhang, Chun Zhao, “The Fertilizing Role of African Dust in the Amazon Rainforest: A First Multiyear Assessment Based on CALIPSO Lidar Observations,” Geophysical Research Letters, Vol. 42, pp:1984–1991, March 18, 2015, doi: 10.1002/2015GL063040
29) Joy Ng, Kayvon Sharghi, Kel Elkins, Greg Shirah, Horace Mitchell, Brian Monoe, Hongbin Yu, Ellen T. Gray, “Satellite Tracks Saharan Dust To Amazon In 3-D,” NASA, Goddard Media Studios, Feb. 24, 2015, URL: http://svs.gsfc.nasa.gov/cgi-bin/details.cgi?aid=11775
30) “CALIPSO Latest News,” CNES, Nov. 27, 2014, URL: http://smsc.cnes.fr/CALIPSO/GP_actualite.htm
31) “8th Joint Steering Group meeting / confirmation of a new 2 years extension of CALIPSO mission,” CNES, Nov. 19, 2013, URL: http://smsc.cnes.fr/CALIPSO/GP_actualite.htm
32) http://smsc.cnes.fr/CALIPSO/index.htm
33) George Hurtt (Chair), Ana Barros, Richard Bevilacqua, Mark Bourassa, Jennifer Comstock, Peter Cornillon, Andrew Dessler, Gary Egbert, Hans-Peter Marshall, Richard Miller, Liz Ritchie, Phil Townsend, Susan Ustin,“NASA Earth Science Senior Review 2011,” June 30, 2011, URL: http://science.nasa.gov/media/medialibrary/2011/07/22/2011-NASA-ESSR-v3-CY-CleanCopy_3x.pdf
34) D. M. Winker, J. Pelon, “The CALIPSO mission,” COSPAR 2010, 38th COSPAR Scientific Assembly, Bremen, Germany, July18-25, 2010, URL: http://www.cnes.fr/automne_modules_files
/standard/public/p8628_67f2ab5f07f7bb51f0fb15f9ad97615319_Atmosphere.pdf
35) http://smsc.cnes.fr/CALIPSO/GP_actualite.htm
36) Steven A. Ackerman (chair), Richard Bevilacqua, Bill Brune, Bill Gail, Dennis Hartmann, George Hurtt, Linwood Jones, Barry Gross, John Kimball, Liz Ritchie, CK Shum, Beata Csatho, William Rose, Carlos Del Castillo, Cheryl Yuhas, “NASA Earth Science Senior Review 2009,” URL: http://nasascience.nasa.gov
/about-us/science-strategy/senior-reviews/2009SeniorReviewSciencePanelReportFINAL.pdf
37) Debra Werner, “NASA Budget fpr Earth Science Lags Behind Rising Expectations,” Space News, January 4, 2010, p. 1 & 4
38) Christophe Maréchal, Nadège Quéruel, David G. Macdonnell, Carolus A. Verhappen, Patricia L. Lucker, “ Flying in a spacecraft constellation: a coordination puzzle,” Proceedings of the SpaceOps 2010 Conference, Huntsville, ALA, USA, April 25-30, 2010, paper: AIAA 2010-2254
39) “CALIPSO Makes Successful Switch to Backup Laser, Keeping Important Data Stream Alive,” NASA, April 16, 2009, URL: http://www.nasa.gov/topics/earth/features/calipso-laserswitch.html
40) http://www-calipso.larc.nasa.gov/
41) http://smsc.cnes.fr/CALIPSO/GP_actualite.htm
42) J. Blouvac, F. Paoli, P. Landiech, P. Castillan, “CALIPSO Small Satellite Flight Commissioning,” Proceedings of the 57th IAC/IAF/IAA (International Astronautical Congress), Valencia, Spain, Oct. 2-6, 2006, IAC-06-B5.4.09
43) D. M. Winker, J. Pelon, J. A. Coakley Jr., S. A. Ackerma n, R. J. Charlson, P. R. Colarco, P. Flama nt, Q. Fu, R. M. Hoff , C. Kittaka, T. L. Kubar, H. Le Treut, M. P. Mcc ormi ck, G. Mégie, L. Poole, K. Powell, C. Trepte, M. A. Vaughan, B. A. Wielicki, “The CALIPSO Missio n - A Global 3D View of Aerosols and Clouds,” BAMS (Bulletin of the American Meteorological Society), Vol. 91, Issue 9, Sept. 2010, pp. 1211-1229, URL: http://journals.ametsoc.org/doi/pdf/10.1175/2010BAMS3009.1
44) David Winker, William Hunt, Carl Weimer, “The On-Orbit Performance of the CALIOP Lidar on CALIPSO,” Proceedings of the 7th ICSO (International Conference on Space Optics) 2008, Toulouse, France, Oct. 14-17, 2008, URL: [web source no longer available]
45) D. Winker, C. Hostetler, W. Hunt, “ CALIOP: The CALIPSO Lidar,” Proceedings of 22nd ILRC (International Laser Radar Conference), Matera, Italy, July 12-16, 2004, ESA SP-561, Vol. II, pp. 941-944
46) L. R. Poole, D. M. Winker, J. R. Pelon, M. P. McCormick, “CALIPSO: Global aerosol and cloud observations from lidar and passive instruments,” Proceedings of SPIE, Vol. 4881, 9th International Symposium on Remote Sensing, Aghia Pelagia, Crete, Greece, Sept. 23-27, 2002
47) http://www-calipso.larc.nasa.gov/about/payload.php#CALIOP
48) D. M. Winker, W. Hunt, C. Hostetler, “Status and performance of the CALIOP lidar,” Proceedings of SPIE, Vol. 5575, 2004, pp. 8-15, URL: http://www-calipso.larc.nasa.gov/resources/pdfs/SPIE_5575-3.pdf
49) D. Winker, “CALIPSO,” Nov. 15, 2004, TWP-ICE Planning Meeting, Darwin, Australia, URL: http://www.bom.gov.au/bmrc/wefor/research/twpice/
Darwin_Nov_2004_meeting/S1/S1_WinkerTWPICE_CALIPSO.pdf
50) http://smsc.cnes.fr/CALIPSO/GP_iir.htm
51) G. Corlay, M.-C. Arnolfo, T. Bret-Dibat, A. Lifferman, J. Pelon, “The infrared Imaging Radiometer for Picasso-Cena,” http://smsc.cnes.fr/CALIPSO/IIR_ICSO00_S2-06.pdf
52) http://www.sodern.com/sites/en/ref/CALIPSO_160.html
53) IIR brochure of EADS Sodern, URL: http://www.sodern.com/sites/docs_wsw/RUB_160/FICHE_IIR.pdf
54) C. Weimar, R. Schwiesow, M. LaPole, “CALIPSO: lidar and wide-field camera performance,” Proceedings of SPIE, `Earth Observing Systems IX,' Edited by W. L. Barnes, J. J. Butler, Vol. 5542, 2004, pp. 74-85
55) M. C. Pitts, Y. Hu, J. C. Currey, D. Winker, J. D. Lambeth, “CALIPSO Algorithm Theoretical Basis Document Wide Field Camera (WFC) Level 1 Algorithms,” Oct. 25, 2005, URL:
http://www-calipso.larc.nasa.gov/resources/pdfs/WFC_Level1_baseline_v1.0.pdf
56) “CALIPSO Data User's Guide,” Oct. 4, 2010, NASA/LaRC, URL:
http://www-calipso.larc.nasa.gov/resources/calipso_users_guide/
Spacecraft Launch Mission Status Sensor Complement Ground Segment References Back to top