Skip to content
eoPortal

Satellite Missions Catalogue

Biomass (Biomass Monitoring Mission for Carbon Assessment)

Nov 9, 2017

EO

|

ESA

|

Land

|

Approved

|

Biomass Satellite mission focuses on biomass monitoring for carbon assessment. Biomass will address the status and dynamics of forestry for a better understanding of the carbon cycle.

Quick facts

Overview

Mission typeEO
AgencyESA
Mission statusApproved
Measurement domainLand
Measurement categoryVegetation
Measurement detailedAbove Ground Biomass (AGB), Vegetation Canopy (height), Vegetation Canopy (cover)
InstrumentsP-Band SAR
Instrument typeImaging microwave radars
CEOS EO HandbookSee Biomass (Biomass Monitoring Mission for Carbon Assessment) summary

Related Resources

Biomass satellite
Biomass Satellite (Image credit: ESA)

Summary

Mission Capabilities

Biomass will carry a P-band Synthetic Aperture Radar (P-SAR) onboard, alongside its corresponding P-band Antenna Feed Subsystem. There are currently two competing instrument design concepts; Concept A and Concept B. Both concepts use a single-offset reflector antenna system consisting of a feed array and a large deployable mesh reflector with a circular projected aperture diameter of 11.5 m or 12 m. Concept A uses three pairs of radiators with tapered excitation in elevation, whereas only two pairs of radiators with equal excitation are used for Concept B. 

Using P-SAR data, it will be possible to quantify the carbon cycle on a global scale. This information is critical in understanding dramatic changes taking place on Earth because of its close connection with both fossil fuel combustion and land use change. The P-band wavelength enables observations in topography covered by dense vegetation, features in deserts and in ice sheets. This data can additionally be used to provide scientific support for international treaties and agreements, improve predictions of landscape-scale carbon dynamics, provide observations to initialise and test the land element of Earth system models, reduce uncertainties in carbon flux and provide key information for forest resources management.

Performance Specifications

P-SAR will operate in a Stripmap mode with a swath width of approximately 50 km illuminated by a single antenna beam. Global coverage will be obtained by the interleaved stripmap operations among three complementary swaths, with the operating incidence range between 23° and 35°. P-SAR will provide accurate, frequent and global information on forest properties at a spatial scale of 200 m, making it possible to address a range of critical issues.

Biomass will be placed in a sun-synchronous near circular dawn-dusk orbit at an altitude of approximately 666 km and an inclination of 97.97°. The baseline observation principle is based on a double-baseline interferometric acquisition, with a repeat cycle of 17 days.

Space & Hardware Components

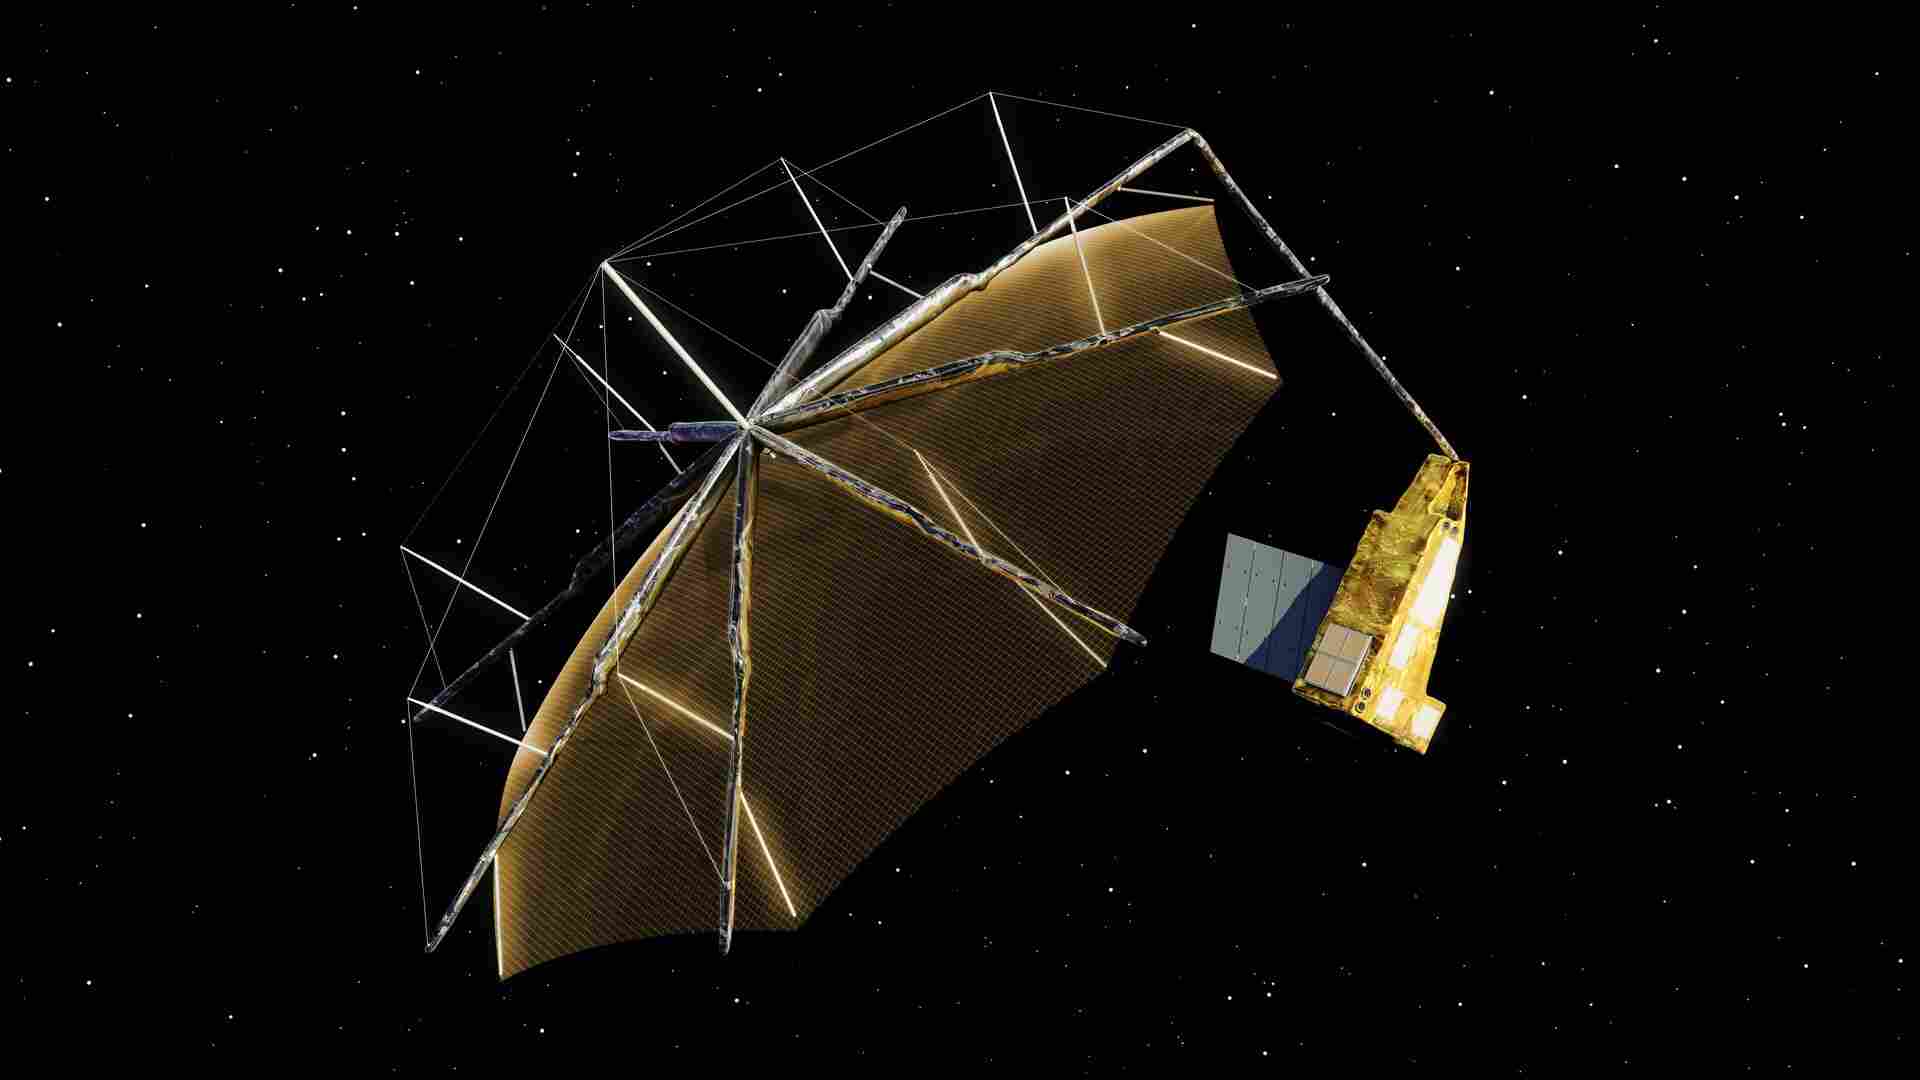
The Biomass spacecraft comprises a single satellite platform carrying the P-SAR, with the design largely constrained by the accommodation of the SAR antenna on a 12 m deployable reflector. This large antenna with an offset feed array and a single beam enables a high level of map accuracy and must be folded for launch inside a Vega launcher.

Airbus Defence and Space UK have been contracted to develop the spacecraft with Harris Corporation to provide the 12 m deployable reflector and precision boom assembly.

Biomass (Biomass Monitoring Mission for Carbon Assessment)

Spacecraft   Development Status   Launch   Sensor Complement   References


In May 2013, ESA's Earth Observation Program Board selected the Biomass mission as its 7th Earth Explorer mission following the review of three candidate concepts. Earth Explorers are research missions dedicated to specific aspects of Earth's environment whilst demonstrating new technology in space. Earth Explorer missions focus on the atmosphere, biosphere, hydrosphere, cryosphere and the Earth's interior with the overall emphasis on learning more about the interactions between these components and the impact that human activity is having on natural Earth processes.

The Biomass mission concept is set to become the next in a series of satellites developed to further our understanding of Earth. The mission aims to take measurements of forest biomass to assess terrestrial carbon stocks and fluxes for a better understanding of the carbon cycle. 1) 2) 3) 4)


Background:

The primary environmental science challenge in the early 21st century is to improve our understanding of how global changes are affecting the Earth System, and the feedback within this system, so that human societies can assess their likely impacts and adopt ways to mitigate and adapt to them.

Deeply embedded in the functioning of the Earth system is the carbon cycle, which consists of intermeshed processes by which carbon is exchanged between the atmosphere, land and ocean (Figure 1). Quantifying this global-scale cycle is fundamental to understanding many of the dramatic changes taking place on Earth because of its close connection with both fossil fuel combustion and land use change. These are the two most significant drivers of global change, leading to increases in atmospheric CO2 and the associated global warming (IPCC, 2007). 5)

Terrestrial processes play a crucial role in the carbon cycle through the carbon uptake and respiration associated with plant growth, emissions due to the disturbance of natural processes (e.g. wildfires) and anthropogenic land use change. There is strong evidence that over the last 50 years the terrestrial biosphere has acted as a net carbon sink, removing from the atmosphere approximately one-third of the CO2 emitted in the process of fossil fuel combustion (Canadell et al., 2007).6) However, the status, dynamics and evolution of the terrestrial biosphere are the least well-understood and most uncertain elements of the carbon cycle.

Consequently, the UN Framework Convention on Climate Change (UNFCCC) has identified biomass as an Essential Climate Variable that is needed to reduce uncertainties in our knowledge of the climate system (GCOS, 2004). 7) While global observation programs for most terrestrial ECVs (Essential Climate Variables) are advanced or evolving, there is currently no such effort for biomass (Houghton et al., 2009). 8)

In addition, the sequestration of carbon in forest biomass is the only mechanism for mitigating climate change recognized under the Kyoto Protocol, other than reduced emissions.

Scientific Objectives:

The Biomass mission will address a fundamental gap in our understanding of the land component of the Earth system, which is the status and the dynamics of Earth’s forests, as represented by the distribution of forest biomass and its changes. With accurate, frequent and global information on these forest properties at a spatial scale of 200 m, it will be possible to address a range of critical issues with far-reaching scientific and societal consequences.

In particular, the Biomass mission will help to:

- reduce the large uncertainties in the carbon flux due to changes in land use

- provide scientific support for international treaties, agreements and programs such as the UN’s REDD (Reducing Emissions from Deforestation and Forest Degradation in Developing Countries) program

- improve understanding and predictions of landscape-scale carbon dynamics

- provide observations to initialize and test the land element of Earth system models

- provide key information for forest resources management and ecosystem services.

The Biomass mission will explore Earth’s surface for the first time at the P-band wavelength. The observations can have a wide range of as yet unforeseen applications (mapping subsurface geological features in deserts in support of palaeohydrological studies and ice sheets, the surface topography of areas covered by dense vegetation).

Figure 1: The global carbon cycle for 2000–09 showing estimates of the net amount of carbon (Gt) that cycles between the atmosphere, ocean and land every year (green boxes), and the amounts of carbon stored in the atmosphere and in the land (data from the Global Carbon Project). The amount of carbon stored in forest biomass is the least understood component of this cycle (image credit: ESA/EOGB)
Figure 1: The global carbon cycle for 2000–09 showing estimates of the net amount of carbon (Gt) that cycles between the atmosphere, ocean and land every year (green boxes), and the amounts of carbon stored in the atmosphere and land (data from the Global Carbon Project). The amount of carbon stored in forest biomass is the least understood component of this cycle (image credit: ESA/EOGB)

Biomass addresses one of the most fundamental questions in our understanding of the land component in the Earth system, namely the status and the dynamics of forests, as represented by the distribution of biomass and how it is changing.

Gaining accurate and frequent information on forest properties at scales that allow changes to be observed will mean that the scientific community is equipped to address a range of critical issues with far-reaching benefits for science and society. Moreover, Biomass will greatly improve our knowledge of the size and distribution of the terrestrial carbon pool. And provide much-improved estimates of terrestrial carbon fluxes. In addition, the mission responds to the pressing need for biomass observations in support of global treaties such as the UN REDD+(Reducing Emissions from Deforestation and forest Degradation) initiative – an international effort to reduce carbon emissions from deforestation and land degradation in developing countries. These mission objectives respond directly to the specific scientific challenges in ESA's Living Planet Program (Ref. 19). 9) 10) 11) 12) 13) 14) 15)

In addition, the measurements made by Biomass offer the opportunity to map the elevation of Earth’s terrain under dense vegetation, yielding information on subsurface geology and allowing the estimation of the glacier and ice-sheet velocities, critical to our understanding of ice-sheet mass loss in a warming Earth.

Biomass also has the potential to evolve into an operational system, providing long-term monitoring of forests – one of Earth’s most important natural resources.

Before the launch of the BIOMASS P-band SAR satellite, only spaceborne L-band data from ALOS PALSAR until 2011 and ALOS-2 (launch on May 24, 2014) are available for biomass studies. 16)

Some stations in ESA's Earth Explorer Opportunity Mission selection process

• March 2005: In response to ESA's Second Call for Earth Explorer Opportunity Missions, a P-band SAR payload was proposed to provide the spatial distribution and dynamics of forest biomass. 17)

- Climate change and its consequences constitute the most important environmental problem of the 21st century. The most critical element in understanding climate change is the quantification of the carbon cycle, of which a crucial component is the terrestrial biosphere.

- However, the status, dynamics and evolution of the terrestrial biosphere are the least understood and the most uncertain elements in the carbon cycle, at all scales. Information on vegetation biomass is urgently needed to assess the present terrestrial carbon distribution. It is also essential, in combination with ecological models and other data sources, to identify carbon sources and sinks and their variation over time; to predict how these may change in the future, and to develop indicators of the status of the global climate system.

• In 2009, the three candidate Earth Explorer Core missions, namely BIOMASS, CoReH2O (Cold Regions Hydrology high-resolution Observatory) and PREMIER (Process Exploration through Measurement of infrared and millimeter-wave Emitted Radiation) were selected for feasibility study and their resulting Reports for Mission Selection were published in June 2012. 19) 20)

• March 2, 2013: BIOMASS was among the three missions down selected for phase A studies.

- Following the User Consultation Meeting held in Graz, Austria on 5-6 March 2013, the Earth Science Advisory Committee (ESAC) has recommended implementing Biomass as the 7th Earth Explorer Mission within the frame of the ESA Earth Observation Envelope Program.

• On May 7, 2013, ESA's Earth Observation Program Board selected ‘Biomass’ to become the seventh Earth Explorer mission. The innovative satellite aims to map and monitor one of Earth’s most precious resources. The satellite will be designed to provide, for the first time from space, P-band radar measurements that are optimized to determine the amount of biomass and carbon stored in the world’s forests with greater accuracy than ever before (Ref. 1).

• On Feb. 18, 2015, the ESA Member States gave the green light for the Biomass mission full implementation. 21)

• On April 29, 2016, ESA and Airbus Defence and Space UK signed a €229 million contract to build the next Earth Explorer: the Biomass satellite, due to begin its mission in 2021. 22)

 
Figure 2: Overview of the Biomass architecture (image credit: ESA, Ref. 2)

The primary scientific objectives of the Biomass mission are to determine the distribution of above-ground biomass in the world forests and to measure annual changes in this stock throughout the mission to greatly enhance our understanding of the land carbon cycle. To achieve these objectives, the Biomass sensor will consist of a P-band (435 MHz) Synthetic Aperture Radar (SAR) in side-looking geometry with full polarimetric and interferometric capabilities. The main architectural elements of the Biomass mission are shown in Figure 2. 23) 24) 25) 26) 27) 28) 29)

Biomass will provide global maps of forest biomass stocks at a spatial resolution in the order of 4 ha, once a year over the life of the five-year mission. These maps will greatly improve existing forest inventories and give vastly improved information for managing Earth’s forest resources.

Biomass will also provide maps of biomass change, which can be linked to disturbance, degradation, land-use change, and forest growth. In addition, the full resolution of the instrument of around 0.25 ha will be used to detect deforestation; linking this to the coarser resolution maps of biomass will allow associated carbon losses to be estimated at scales commensurate with the processes of land-use change. The Biomass observation requirements have been derived from these high-level objectives (Table 2).

Parameter

Requirement

Instrument type

P-band full polarimetric interferometric SAR

Center frequency

435 MHz (P-band, 70 cm wavelength)

Bandwidth

6 MHz (ITU allocation)

Near incidence angle

>23º (threshold); 25º (goal)

Cross-polarization ratio (cross-talk)

≤-25 dB (threshold); ≤-30 dB (goal)

Channel imbalance

≤-34 dB

Residual phase error

≤10º

Spatial resolution (≥6 looks)

≤ 60 m (across-track) x 50 m (along-track)

PSLR

≤-16 dB

ISLR

≤-9 dB

Noise equivalent σ0

≤ –27 dB (threshold); ≤ –30 dB (goal)

Total ambiguity ratio

≤ -18 dB

Radiometric stability

≤ 0.5 dB (1σ)

Radiometric bias

≤ 0.3 dB (1σ)

Dynamic range

35 dB

Table 2: Biomass mission observation requirements


Observation Principle

Biomass will be based on a P-band polarimetric SAR mission with controlled inter-orbit distances (baselines) between successive revisits to the same site. At each acquisition, the radar will measure the scattering matrix, from which the backscattering coefficients (equivalent to radar intensity) will be derived in each of the different linear polarization combinations, i.e. HH, VV, HV & VH (where H and V stand for horizontal and vertical transmitted and received), and the inter-channel complex correlation.

For interferometric image pairs, the system will provide the complex interferometric correlation (coherence) between the images at each linear polarization. PolInSAR (Polarimetric interferometric SAR) coherence and PolSAR (Polarimetric SAR) backscatter observations provide independent, complementary information that can be combined to give robust, consistent and accurate retrieval of biomass. In addition tomography techniques, using a multi-baseline polarimetric SAR acquisition will be used to complete the knowledge of the vertical structure of the forest (Figure 3). By exploiting these capabilities, Biomass will build up a unique archive of information about the world’s forests and their dynamics (Ref. 25).

Figure 3: Biomass observation principle based on three complementary techniques (image credit: ESA)

Measurement techniques

The three measurement techniques exploited by BIOMASS and illustrated in Figure 3 yield complementary information on forest properties: 30)

1) Horizontal mapping

In polarimetric mode, after calibration and correction for ionospheric effects, each BIOMASS pixel measures the scattering matrix, from which the backscattering intensity will be derived in each of the linear polarization combinations, i.e. HH, VV, HV & VH, where H and V stand for horizontal and vertical transmitted and received signals.

For a forest canopy, the P-band radar waves penetrate deep into the canopy, and their interaction with the structure of the forest (through volume scattering, surface scattering or double bounce scattering mechanisms) differs between polarizations. P-band SAR is particularly sensitive to large forest constituents, such as the trunk and large branches, where most of the biomass resides, and polarizations can be chosen to minimize the contribution from the ground and effects arising from topographic and soil moisture variation. Hence P-band polarimetric measurements can be used to map AGB (Above Ground Biomass), as demonstrated from airborne data for temperate & boreal forests and tropical forests.

2) Height mapping

Using repeat revisits to the same location with controlled inter-track distances, the BIOMASS SAR system will measure the polarimetric complex interferometric correlation between image pairs. Thanks to them is possible to estimate the height of scattering in the forest canopy as a function of polarization (PolInSAR). This allows canopy height to be derived, assuming a model for the vertical structure of scatterers in the forest. Numerous airborne experiments over temperate, boreal and tropical test sites have shown that forest height can be mapped with accuracy comparable to that of airborne lidar.

A crucial factor here is that at the long wavelength used by BIOMASS, temporal coherence is preserved over much longer timescales than, for example, at L-band. This is because BIOMASS is sensitive to larger structures in the canopy, which more are more stable; in addition, the longer wavelength makes the phase less sensitive to small motions of the dominant scatterers. BIOMASS will be the first spaceborne radar sensor providing large-scale height maps using PolInSAR, although the application of the technique from space has been demonstrated using Shuttle Imaging Radar (SIR-C) L-band data.

3) 3-D mapping

The P-band frequency used by BIOMASS is low enough to ensure penetration through the entire canopy, even in dense tropical forests. As a consequence, the resolution of the vertical structure of the forest will be possible using tomographic methods from the multi-baseline acquisitions to be made by BIOMASS. This is the concept of SAR tomography, which has been implemented with airborne systems and will be available for the first time using space with the BIOMASS mission. When the vertical resolution is less than half the forest height, it is possible to split the vertical distribution of the backscatter intensity into several layers, without assuming any prior knowledge about the forest's vertical structure. As expected, the bottom layer contains mainly ground scattering and the backscatter from this layer is very weakly correlated with AGB.

However, in two different tropical forest sites in French Guiana, the backscatter from a layer at about 30 m above the ground was found to be strongly correlated with AGB, up to biomass densities of 450-500 t/ha, allowing the production of wide-area biomass maps. Findings from airborne data are expected to carry across to BIOMASS, despite the coarser spatial and vertical resolution available in BIOMASS tomography.

Mission Concepts

The technical description of the Biomass mission is derived from the preparatory activities and shows how candidate implementation concepts can respond to the scientific requirements. The system description is mainly based on the results of the work performed during two parallel Phase A system studies by two industrial consortia, led by Astrium DS Ltd. and Thales Alenia Space, Italy. Consequently, two implementation concepts marked A and B, are described in what follows.

The space segment comprises a single spacecraft carrying a P-band SAR, operating in stripmap mode in a near-polar, sun-synchronous quasi-circular frozen orbit at an altitude of 634–666 km, depending on the different mission phases. The baseline Vega launcher will inject the satellite into its target orbit. The orbit is designed to enable repeat-pass interferometric acquisitions throughout the mission’s life. The baseline is different for the interferometric (in the order of 2 km at the equator) and the tomographic phases (below 1 km at the equator).

Acquisitions are made at dawn/dusk, i.e. 06:00/18:00 local time (at the equator), to minimize the adverse influence of the ionosphere on the radar signal. The Biomass mission will last five years and will comprise a tomographic phase with a duration of 1 year followed by the interferometric phase.

The strategy for meeting the baseline requirement is based on the selection of an orbit with a ‘controlled drift’, flying the satellite in an orbit where the altitude is slightly higher or lower than that of the exact repeating orbit. The coverage build-up for the observation concept is shown in Figure 2 and the combined roll of the satellite to acquire 3 consecutive interferometric images, with controlled drift of the orbit.

Figure 4: Coverage strategy (image credit: ESA)


Spacecraft

The Biomass space segment comprises a single LEO (Low Earth Orbit) satellite platform carrying the SAR instrument. The SAR antenna is based on a large deployable reflector (12 m circular projected aperture) with an offset feed array and a single beam. The satellite configuration is strongly constrained by the accommodation of the very large reflector antenna inside the Vega launcher. This large antenna must be folded for launch and deployed in orbit to form a stable aperture throughout the mission’s life.

The overall configuration of Concept A is shown in Figure 3 and is compatible with COTS (Commercial-Off-The-Shelf) reflectors from the US manufacturers Harris Corporation (HC) and Northrop Grumman (NG). For Concept A, the reflector is illuminated by a 3 x 2 array of cavity-backed circular microstrip radiators, which is mounted onto the –Y wall of the satellite at the lower end (not visible in the figures).

Figure 5: Artist's rendition of the BIOMASS satellite configurations (image credit: Airbus DS)

Harris Corporation has been selected by Airbus Defence and Space UK, the builder of the Biomass satellite, to provide a 12-meter deployable reflector and precision boom assembly for this carbon-monitoring craft (Figure 5). 31) The Harris deployable reflector is a major component of the SAR antenna and enables the Biomass satellite to obtain a high level of map accuracy not attainable by ground measurement techniques alone. With more than 80 reflectors in orbit, Harris is the leading supplier of large reflector apertures and deployable mesh reflector-feed antenna systems.


Mission Status

• April 13, 2022: The largest antenna ever tested in ESA’s Hertz radio frequency test chamber is this 5 m diameter transponder antenna, which will operate down on the ground to help calibrate the Biomass mission, which will chart all the forests on Earth. 32)

Figure 6: “This is a particularly challenging test campaign both in terms of the size of the antenna and the very low P-band frequency that Biomass will be using, which allows it to pierce through forest canopies to acquire individual trees,” explains ESA antenna engineer Luis Rolo, overseeing the test campaign. “Usually when we test a large satellite here, its antenna is significantly smaller, typically between 0.5 and 2 m across. But this entire structure is a radiating antenna in its own right, its sides coming near to the chamber walls.“What this means is that the testing process highlights some aspects of the chamber we’ve never seen before, even after many years of testing. But we’ve come up with a measurement method involving multiple acquisitions from different spots within the chamber, combined carefully to subtract such environmental effects, yielding very accurate results.” (image credit: ESA-SJM Photography)
Figure 6: “This is a particularly challenging test campaign both in terms of the size of the antenna and the very low P-band frequency that Biomass will be using, which allows it to pierce through forest canopies to acquire individual trees,” explains ESA antenna engineer Luis Rolo. “Usually when we test a large satellite here, its antenna is significantly smaller, typically between 0.5 and 2 m across. But this entire structure is a radiating antenna in its own right, its sides coming near to the chamber walls. What this means is that the testing process highlights some aspects of the chamber we’ve never seen before, even after many years of testing. But we’ve come up with a measurement method involving multiple acquisitions from different spots within the chamber, combined carefully to subtract such environmental effects, yielding very accurate results.” (image credit: ESA-SJM Photography)

- Part of ESA’s technical heart in the Netherlands, the metal-walled ‘Hybrid European Radio Frequency and Antenna Test Zone’ chamber is shut off from all external influences. Its internal walls are studded with radio-absorbing ‘anechoic’ foam pyramids, allowing radio-frequency testing without any distorting reflections.

- Its name starts with ‘Hybrid’ because the chamber can assess radio signals from antennas both in localised ‘near-field’ terms or else on a ‘far-field’ basis as if the signal has crossed thousands of kilometres of space.

- Biomass will deploy a massive 12 m diameter reflector to harness P-band radar signals to perform a five-year census of all Earth's trees.

- Based in Australia, this transponder will be integrated onto a mobile positioning system inside a protective radome, allowing it to track the Biomass satellite moving across the sky. The transponder antenna will reflect radar signals from Biomass back to it, to help confirm the mission is operating optimally. The transponder was developed and built by the Italian company IDS.

• January 26, 2022: Antennas are among the most complex systems aboard a satellite – making them demanding to produce and often unpredictable to test. Tiny variables in their building, mounting or operation may impact their working performance in a big way. So ESA teamed up with Danish company TICRA to develop a method of forecasting such discrepancies well before an antenna construction even starts. 33)

Biomass 12 m wire-mesh reflector
Figure 7: Biomass 12 m wire-mesh reflector. (image credit: L3Harris Technologies)

- Direct inspiration for the project came from ESA’s Biomass mission. Biomass will deploy a massive 12-m diameter reflector to harness long-wavelength ‘P-band’ radar signals, piercing through forest canopies to perform a five-year census of all the trees on Earth.

- “In the case of Biomass’s antenna, we face a very specific problem,” explains ESA antenna engineer Nelson Fonseca. “Because of its sheer size and the signals it employs, it is not feasible to test on Earth. Instead, we predict its in-orbit performance using software modelling – but then we also need a way to quantify the reliability of our model.”

- Consulting with Denmark’s TICRA, Nelson found the antenna software company was already looking into this question more generally, in response to the wider needs of the space industry. In particular –with the number of satellites in orbit forecast to grow radically, driven by commercial megaconstellations – satellite antennas are shifting from grand-scale one-offs in nature towards a future of efficient, economical mass production.

Figure 8: Software models are used to forecast the nominal performance of space antennas before they are made - but the actual built performance rarely maps onto the nominal (image credit: TICRA)

- “Current antenna simulation tools can only predict nominal performance,” explains Erik Jørgensen, Chief Technology Officer at TICRA. “But when we actually test the built versions of antennas we almost never observe nominal performance – there is always a degree of variation.

- “Why? Because the built version of anything can never be entirely identical to the original design. There will always be slight variations introduced in the course of manufacturing, mounting and operating these extremely complex radio-frequency systems. Even a size difference of a few tenths of a millimeter, tiny power variations or structural misalignments will add uncertainty into the actual working performance.”

- “One way antenna designers take account of this uncertainty is by engineering in generous performance margins,” Nelson explains. “This is in fact the approach used in Biomass, but this leads to demanding requirements with an impact on cost and schedule.”

- Oscar Borries, Head of Team Mathematics and AI at TICRA, likes to illustrate this problem as follows: “Imagine you have the job of putting up chandeliers, but you’re not sure how many screws you need to fix them to the ceiling. So you use lots of screws to be on the safe side – but in space terms, such margins mitigate against price and performance.

- “Another approach is what is called ‘Monte Carlo simulations’ – like putting up tens of thousands of chandeliers to see how many of them will stay up without falling. Space companies and agencies run simulation after simulation of their antenna in action to see small variations in performance each time, gradually building up a statistical picture of the uncertainty range (Figure 10).

Figure 9: Quantifying uncertainty in built antenna performance to 95% confidence. The expected value is (almost) never the observed performance (image credit: TICRA)
Figure 9: Quantifying uncertainty in-built antenna performance to 95% confidence. The expected value is (almost) never the observed performance (image credit: TICRA)
Figure 10: Using Monte Carlo analysis, space companies and agencies run simulation after simulation of their antenna in action to see small variations in performance each time, gradually building up a statistical picture of the uncertainty range. Such bulk simulations are hugely costly in terms of time and computing resources however, and provide only very rough approximations. The black line shows the actual value, the red line shows the result from accumulated Monte Carlo simulations and the green shows the value from the uncertainty quantification algorithm (image credit: TICRA)
Figure 10: Using Monte Carlo analysis, space companies and agencies run simulation after simulation of their antenna in action to see small variations in performance each time, gradually building up a statistical picture of the uncertainty range. Such bulk simulations are hugely costly in terms of time and computing resources, however, and provide only very rough approximations. The black line shows the actual value, the red line shows the result from accumulated Monte Carlo simulations and the green shows the value from the uncertainty quantification algorithm (image credit: TICRA)

- As an alternative, TICRA investigated an uncertainty quantification approach based on ongoing calculations based on a single continuous function that represents the full system performance, rather than a large number of functions that each only represent a small part of the system. The mathematics involved are hugely challenging, but the result is a much more efficient method of quantifying uncertainty.

- “Our antenna software makes us a world leader in this field, but we are also a small company, and this concept represented a challenging and risky development,” adds Oscar.

Figure 11: Front end of TICRA's prototype uncertainty quantification software, analysing a reflectarray antenna on a CubeSat (image credit: TICRA)

- “So we ended up collaborating with ESA through the Agency’s General Support Technology Programme, GSTP, to help bring promising technology to the market. One of the main advantages this brings was the continuous consultancy from the ESA side, including many of the best people in the sector.”

- In practice, the software will be used in various ways, beyond simulating the expected performance of antennas. Designs can be carefully optimised, not just for performance but also in terms of cost, by pinpointing the components that prove to have the least impact on performance, allowing them to be swapped out with cheaper commercial alternatives. It could also be used for yield analysis, to predict how many components in a batch will perform within specifications.

- Nelson adds: “This project is really a win-win because we get specific benefit for the Biomass mission, but the resulting software, which will be released commercially later this year, will also boost the competitiveness of the overall European space industry.”

Figure 12: Modelling contoured beam coverage. Antenna beams can be contoured carefully for desired ground coverage. This image shows an uncertainty quantification software model of the footprint of a contoured reflectarray beam. The solid line shows the design-optimised pattern, the dashed line the lower 5% of the confidence interval. The conclusion is a clearly visible risk of depointing, about 0.1 dB peak gain reduction (image credit: TICRA)
Figure 12: Modelling contoured beam coverage. Antenna beams can be contoured carefully for desired ground coverage. This image shows an uncertainty quantification software model of the footprint of a contoured reflectarray beam. The solid line shows the design-optimised pattern, and the dashed line is the lower 5% of the confidence interval. The conclusion is a visible risk of depointing, about 0.1 dB peak gain reduction (image credit: TICRA)

• November 15, 2021: With more than 100 global leaders at COP26 (United Nations Framework Convention on Climate Change/Conference of Parties-21) in Glasgow, UK (conference dates: 31. October to 12. November 2021) having pledged to halt and reverse deforestation and land degradation by the end of the decade to help address the climate crisis, the health of the world’s forests is high on the political agenda.

ESA’s Biomass mission will soon play a key role in delivering novel information about the state of our forests, how they are changing over time, and advance our knowledge of the carbon cycle. The mission is now in its last phases of development, having recently passed several key milestones. 34)

- The COP26 pledge on deforestation and degradation from over 100 leaders representing more than 85% of the world’s forests is good news in the battle to redress the balance between the amount of carbon dioxide emitted to the atmosphere through human activity and the amount absorbed by Earth’s carbon sinks. Forests are, of course, an important carbon sink.

Figure 13: Earth's lungs. Absorbing around 8 Gigatons a year of carbon dioxide from the atmosphere a year, forests play a crucial role in the carbon cycle and climate system. However, forest degradation and deforestation, particularly in tropical regions, are causing much of this otherwise stored carbon to be released back into the atmosphere, exacerbating climate change. Quantifying the global cycle is essential to understanding the rapid changes that forests are undergoing and the subsequent implications for our climate (image credit: K. Ooms-Walls)

- Absorbing gigatons of atmospheric carbon dioxide a year, Earth’s forests play a crucial role in the carbon cycle and climate system.

Figure 14: Global carbon budget. The Paris Agreement adopted a target for global warming not to exceed 1.5ºC. This sets a limit on the additional carbon we can add to the atmosphere – the carbon budget. Only around 17% of the carbon budget is now left. That is about 10 years at current emission rates. But there is sufficient uncertainty (indicated by the ± signs in the graphic across all the components of the carbon cycle that there is a small probability we have no remaining carbon budget. This means that even if emissions were to go to zero today, warming would still exceed 1.5ºC. - Fundamental to understanding the global carbon cycle is accurate knowledge of how much carbon is stored in the atmosphere, ocean and terrestrial biosphere – the carbon stocks and the rate of flow, or fluxes, between these stocks. With forest biomass representing a proxy for stored carbon, ESA's Biomass mission will measure forest biomass, height and disturbance to address gaps in our knowledge of the carbon cycle [image credit: ESA (data source: Global Carbon Project)]

- However, forest degradation and deforestation, particularly in tropical regions, are causing much of this otherwise stored carbon to be released back into the atmosphere, exacerbating climate change. Recent research shows that the Amazon rainforest is now actually releasing more carbon dioxide into the atmosphere than it absorbs. 35)

- Even with the new pledge in place, quantifying the global cycle is essential to understanding how forests are changing and the subsequent implications for our climate.

- ESA’s forest mission, Biomass, will use a novel measuring technique to deliver completely new information on forest height and above-ground forest biomass from space. Forest biomass not only includes the tree trunk, but also the bark, branches and leaves.

- Measurements of forest biomass can be used as a proxy for stored carbon – but this is poorly quantified in most parts of the world. Data from the Biomass mission will reduce the major uncertainties in calculations of carbon stocks and fluxes on land, including carbon fluxes associated with land-use change, forest degradation and forest regrowth.

- This will lead to a better understanding of the state of Earth’s forests, how they are changing over time, and advance our knowledge of the carbon cycle.

- However, mapping forest biomass from space is a huge technical challenge. Forests are complex structures – and different tree species and dense canopies make them difficult to measure.

- Rising to the challenge, ESA’s Biomass satellite will use a specific type of radar instrument that can see through clouds, which typically shroud tropical forest, and penetrates the canopy layer, allowing the biomass of trees to be estimated.

- It will be the first satellite to carry a fully polarimetric P-band synthetic aperture radar for interferometric imaging. Thanks to the long wavelength of the P-band, around 70 cm, the radar signal can slice through the whole forest layer.

- Scheduled for liftoff in 2023, the development of the mission is well on the way and completion is in sight.

- ESA’s Biomass Project Manager, Michael Fehringer, said, “The build of the satellite involves more than 50 industrial teams all over Europe and one major supplier in the US. The satellite platform, everything except the radar instrument, is currently being assembled at Airbus in Stevenage in the UK. Most of the avionic units such as the onboard computer, the power control unit and the reaction wheels to control the satellite's motion have already been mounted onto the structure. And, the first switch-on of the satellite has taken place already.

- “At L3Harris Technologies in Florida, in the US, the satellite’s reflector, which measures a whopping 12 m across, has gone through its full test campaign, including a very successful final deployment. The reflector is now ready to be shipped to Europe.

- “At Airbus in Friedrichshafen in Germany, the engineering model of the satellite’s synthetic aperture radar has also been completely tested, demonstrating that we have a fully functioning instrument. All this means that it will be ready to be installed onto the satellite next year so that we will be ready for final testing and then liftoff in 2023.”

- ESA’s Biomass Mission Scientist, Bjorn Rommen, added, “Forests have a major role to play in both the carbon problem and the carbon solution. The world’s forests are vast and difficult to access providing very limited coverage for ground measurements. For instance, the Amazon basin is over six million km2.

- “Measurements from ESA’s Biomass mission will result in improved knowledge of the overall carbon stored in forests whilst at the same time improve estimates of carbon emissions from land-use change and forest degradation, as well as addressing land carbon uptake from forest growth.”

Figure 15: With liftoff scheduled for 2023, engineers are busy building and testing ESA’s Biomass satellite. The photo shows the satellite’s 12-meter reflector in the cleanroom at L3Harris Technologies in Florida, USA, where engineers tested its deployment procedure. The satellite will be launched with this huge antenna folded up, and once safely in orbit around Earth, a three-piece boom deploys the stowed reflector bundle into position. When the boom hinges lock into their final positions the reflector bundle is released and then opened to provide a highly accurate and stable 12-meter aperture wire-mesh reflector. This reflector will receive P-band data reflected from the world’s forests – data that will carry information about forest biomass and forest height, leading to a better understanding of the state of our forests, how they are changing over time, and advance our knowledge of the carbon cycle (image credit: L3Harris Technologies)
Figure 15: With liftoff scheduled for 2023, engineers are busy building and testing ESA’s Biomass satellite. The photo shows the satellite’s 12-meter reflector in the cleanroom at L3Harris Technologies in Florida, USA, where engineers tested its deployment procedure. The satellite will be launched with this huge antenna folded up, and once safely in orbit around Earth, a three-piece boom deploys the stowed reflector bundle into position. When the boom hinges lock into their final positions the reflector bundle is released and then opened to provide a highly accurate and stable 12-meter aperture wire-mesh reflector. This reflector will receive P-band data reflected from the world’s forests. Data will carry information about forest biomass and forest height, leading to a better understanding of the state of our forests, how they are changing over time, and advance our knowledge of the carbon cycle (image credit: L3Harris Technologies)
Figure 16: Biomass: weighing Earth’s forest from space. Around 30% of Earth’s land surface is covered by forest. Absorbing around 8 Gigatons a year of carbon dioxide from the atmosphere, forests play a crucial role in the carbon cycle and climate system. ESA's Biomass mission will measure forest biomass and will lead to a better understanding of the state of Earth’s forests, how they are changing over time, and advance our knowledge of the carbon cycle (video credit: University of Sheffield/NCEO/Humanstudio)
 

- In addition to developing the Biomass mission, ESA is also working with the Group on Earth Observations (GEO) – a partnership of national governments and participating organizations – to collect tree-by-tree reference data and build a global database that can be used for validation.

- ESA’s Biomass Mission Manager, Klaus Scipal, explains, “GEO-TREES has just been kicked off as a GEO community activity. Its aim is to establish a sustainable funding mechanism to support ecologists and experts working in the forest to take the tree-by-tree measurements that are needed to validate our products and to build trust in them.

- “Our goal is to establish 300 forest biomass reference plots distributed globally, following the measurement protocol and the recommendations from the Committee on Earth Observation Satellites to validate above-ground biomass.”

Figure 17: Measuring trees. While ESA’s Biomass mission will deliver new information on forest height and above-ground forest biomass from space, work through GEO-TREES will establish a sustainable funding mechanism to support ecologists and experts working in the forest to take the tree-by-tree measurements that are needed to validate Biomass products. The goal is to establish 300 forest biomass reference plots distributed globally, following the measurement protocol and the recommendations from the Committee on Earth Observation Satellites to validate above-ground biomass. Measuring trees in tropical forest is a challenging – besides having to work in a hostile environment and needing ecological expertise, it often requires some acrobatic skill (image credit: O. Phillips/University of Leeds)
Figure 17: Measuring trees. ESA’s Biomass mission will deliver new information on forest height and above-ground forest biomass from space. GEO-TREES will establish a sustainable funding mechanism to support ecologists and experts working in the forest to take the tree-by-tree measurements that are needed to validate Biomass products. The goal is to establish 300 forest biomass reference plots distributed globally, following the measurement protocol and the recommendations from the Committee on Earth Observation Satellites to validate above-ground biomass. Measuring trees in tropical forests is challenging – besides having to work in a hostile environment and needing ecological expertise, it often requires some acrobatic skill (image credit: O. Phillips/University of Leeds)

• September 22, 2021: Forests, especially tropical rainforests, are guardians against climate change. But our forests are burning. They are withering and dwindling. Our guardians are themselves threatened by climate change. A new European Space Agency (ESA) satellite mission, currently being built by Airbus, is set to investigate exactly how our forests are faring. The name says it all: Biomass. 36)

- Our forests and global climate are closely linked. Forests are huge carbon stores. They cover around one-third of the world’s surface, but they store about half of the carbon bound on Earth. With their needles and leaves, they filter the carbon dioxide in the air that is so harmful to the environment and split it into oxygen and carbon. They release vital oxygen back into the air and retain the carbon.

- Forests also influence evaporation, water cycles and thus the weather. Interconnected forest areas function like huge air-conditioning systems. Tropical forests also have a cooling effect on the climate. However, if temperatures rise worldwide, tropical forests may dry out and die. If the forests die, the carbon stored in them is released and their important climate-regulating and cooling function is lost.

- Carbon is stored in many different types of forests, such as boreal forests, tropical rainforests, mangroves, urban forests and plantations. These forests differ in their ability to store carbon and produce biomass. But experts estimate that up to 75 % of the world's biomass is found in forests. And the forests are shrinking. On an unimaginable scale: since 2010, 11 million hectares per year, or the equivalent of roughly 30 football fields per minute!

- ESA's Biomass environment and climate mission will therefore monitor tropical rainforests. Its main scientific objectives include determining the distribution of above-ground biomass in the rainforests and measuring the annual changes in this mass.

- Biomass and vegetation height are recorded at a resolution of 200 m, and intrusions in the forest system, such as clear-cutting, at a resolution of 50 m. The spacecraft will carry the first spaceborne P-band radar to deliver exceptionally accurate maps of tropical, temperate and boreal forest biomass that cannot be obtained on the ground. Biomass will achieve this using a ‘synthetic aperture radar’ to send down signals from orbit and record the resulting backscatter, building up maps of tree height and volume. To see through leafy treetops to the trees themselves, Biomass will employ long-wavelength ‘P-band’ radar, which has never previously flown in space. It will have its signals amplified to travel down from a 600-km altitude orbit down to Earth and back.

- The mission will collect frequent information on global forests to determine the distribution of their above-ground biomass and measure annual changes. This unique satellite will provide a full global map of forest biomass stocks at a spatial resolution in the order of 4 ha, once every year over the life of the five-year mission, providing an entirely new dataset for climatologists to work with.

- These maps will greatly improve existing forest inventories and give vastly improved information for managing Earth’s forest resources. The data collected by Biomass will also capture subsurface geological structures in desert areas and the topography of surfaces hidden under dense vegetation. Observations from this new mission will also lead to better insight into rates of habitat loss and, therefore, the effect this may have on biodiversity in the forest environment.

- Ernest Hemingway, the famous American author, said:

“Earth is a fine place and worth fighting for.”

So let’s get Biomass into orbit to monitor it, learn about it and – fight for it.

• April 28, 2021: With challenges imposed by the COVID pandemic, engineers building and testing ESA’s Biomass satellite have had to come up with some clever working methods to keep on track while adhering to safety rules. The result is that the satellite structure is not only complete but has also undergone a series of demanding tests to ensure it will withstand the rigors of liftoff – all bringing the launch of this extraordinary forest carbon mapping mission one step closer. 37)

Figure 18: Biomass satellite structure being tested. Carrying a novel P-band synthetic aperture radar, the Biomass mission is designed to deliver crucial information about the state of our forests and how they are changing, and to further our knowledge of the role forests play in the carbon cycle (image credit: Airbus, D. Marques)

- Forests play a crucial role in Earth’s carbon cycle by absorbing and storing large amounts of carbon from the atmosphere – therefore helping to keep our planet cool. However, as swathes of forests continue to be cleared, carbon is being released back into the atmosphere.

- As we seek to slow the progress of climate change and prevent the loss of biodiversity, the health of the world’s forests is key. Knowing exactly how much carbon is stored in forests will help us understand the state of our forests, how they are changing and will advance our knowledge of the carbon cycle.

- This is where the Biomass mission comes in. Biomass – an Earth Explorer mission – takes forest counting to a new level by using a type of instrument that has never before been flown in space: a ‘P-band’ synthetic aperture radar. P-band is the longest radar wavelength available to Earth observation.

- From over 650 km above, the Biomass instrument will be able to ‘see’ through the leafy forest canopy and measure the height of the trees. This information will be used to work out how much biomass – a proxy for carbon – is being stored in forests.

- ESA’s Biomass systems engineering and satellite manager, Janice Patterson, explained, “The Biomass structure was designed by OHB in Italy and manufactured by APCO Technologies in Switzerland. The original plan was for OHB to also integrate and build the structure. However, due to COVID restrictions, the consortium of engineers could not travel as normal so had to come up with novel approaches to complete the activities.

- “To overcome this issue, the task of constructing the satellite was re-assigned to Airbus in the UK, the prime contractor, with remote support from OHB. This was skilfully carried out, which meant that the structure had been finalized by the end of 2020 and then shipped to the testing facility in Toulouse in early 2021.

- “We are now very happy to report that under the lead of Airbus and with the support of OHB, Arianespace and the Airbus test facility in France, the complete suite of mechanical tests have been successful, this included, sine vibration, acoustic, shock and clamp-band release tests.”

- Stefan Kiryenko, ESA’s lead mechanical engineer for Biomass, said, “Passing this testing campaign is a major milestone, and to see everyone steering towards a common goal is powerful and inspiring. The efficiency and superb teamwork that I witnessed was impressive. We have built a beautiful and flight-worthy satellite.”

- As well as the tests that simulated the vibrations and shocks of liftoff and the release of the clamp band that secures the satellite to the rocket’s launch adapter, OHB also carried out a specific ‘thermal elastic distortion’ test. The aim here is to show that the temperature variations the satellite will encounter in space will not affect its strict pointing requirements. The first indications are that these swings in temperature will not introduce any distortions that could impair the way it takes its measurements.

- Janice Patterson added, “These remarkable achievements are a credit to all the teams involved and special thanks goes to everyone who has spent months away from their families allowing us to pass this milestone.”

- The Biomass satellite will now return to the UK for further instrument integration.

Figure 19: Biomass feels the heat. ESA’s Biomass satellite undergoing a ‘thermal elastic distortion’ test, the aim of which is to show that the temperature variations that the satellite will encounter in space will not affect its strict pointing requirements. First indications are that these swings of temperature will not introduce any distortions that could impair the way it takes its measurements (image credit: Airbus, D. Marques)

• February 11, 2021: Biomass, the European Space Agency’s (ESA) forest measuring satellite is taking shape at Airbus’ site in Stevenage with the Structure Model Platform completed. In line with UK Government guidelines, the Stevenage site is COVID-secure – enabling spacecraft production to continue safely. 38)

Figure 20: Biomass, ESA's forest measuring satellite, is taking shape at Airbus's site in Stevenage with the structure model platform completed. In line with UK government guidelines, the Stevenage site is COVID secure - enabling spacecraft production to continue safely (image credit: Airbus)
Figure 20: Biomass, ESA's forest measuring satellite, is taking shape at Airbus's site in Stevenage with the structure model platform completed. In line with UK government guidelines, the Stevenage site is COVID-secure - enabling spacecraft production to continue safely (image credit: Airbus)

- Assembly of the satellite’s mechanical structure could not be carried out as planned due to COVID. But during April and May 2020, the Airbus team put in place a digital solution to enable collaboration with ESA and suppliers, ensuring progress continued on the development of the satellite’s mechanical structure.

- Airbus teams finalized the structure build in the second half of 2020 and integration hardware onto the Structure Model Platform was completed in early January 2021. The Structure Model is now at Airbus Toulouse for its mechanical test campaign.

- Richard Franklin, Managing Director of Airbus Defence and Space UK said: “Despite the pandemic, the teams have really stepped up finding innovative ways to keep manufacture on track. The progress made demonstrates the high level of skills and capabilities of the Airbus teams and their commitment to deliver on the project.”

- Michael Fehringer, ESA’s Biomass Project Manager said: “The status of the structure build as of today is a remarkable achievement given the number and variety of problems the teams had to face.”

• October 28, 2019: Today, ESA and Arianespace signed a contract that secures the launch of the Earth Explorer Biomass satellite. With liftoff scheduled on a Vega launch vehicle from French Guiana, this new mission is another step closer to mapping the amount of carbon stored in forests and how it changes over time through deforestation, for example. 39)

Figure 21: The contract was signed on 28 October 2019 by Josef Aschbacher, ESA’s Director of Earth Observation Programs, (right) and Stéphane Israël, Chief Executive Officer of Arianespace (image credit: ESA)

• February 12, 2019: Set to fly in 2023, ESA’s Biomass Earth Explorer satellite with its 12-m diameter radar antenna will pierce through woodland canopies to perform a global survey of Earth’s forests – and see how they change throughout Biomass five-year mission. 40)

Figure 22: Illustration of the Biomass satellite (image credit: Airbus DS)

- Trees are an integral element of our environment; they also hold clues to our collective future. Knowing the amount of carbon bound up in forest biomass will sharpen our understanding of climate change and its likely effects on the global carbon cycle.

- Biomass will achieve this using a ‘synthetic aperture radar’ to send down signals from orbit and record the resulting backscatter, building up maps of tree height and volume. To see through leafy treetops to the trees themselves, Biomass will employ long-wavelength ‘P-band’ radar, which has never previously flown in space. It will have its signals amplified to travel down from a 600-km altitude orbit down to Earth and back.

- ESA’s Directorate of Technology, Engineering and Quality worked with the Biomass mission team on the advanced signal amplifiers needed to make the mission feasible, based on the most promising semiconductor since silicon.

• October 16, 2018: How many trees are there on Earth? ESA’s Biomass mission will perform a global forest survey, harnessing the longest radar wavelength to pierce through woodland canopies. New microwave transistors made with the most promising semiconductor since silicon make this possible – and are now qualified for spaceflight. 41)

- Biomass’s five-year mission is to chart the biomass of Earth’s forests and its changes over time. It will contribute to the understanding of climate change and its effects on Earth’s system through the global carbon cycle. It does this using a ‘synthetic aperture radar’ to send down signals from orbit and record the resulting backscatter, to build up maps of tree height and volume, and sharpen estimates of global carbon stocks.

Figure 23: To see through leafy treetop to the trees themselves, ESA's forest-monitoring Biomass mission will employ long-wavelength ‘P-band’ radar, which has never previously flown in space. It will have its signals amplified to travel down from a 600-km-altitude orbit down to Earth and back (image credit: ESA) 42)
Figure 23: To see through leafy treetops to the trees themselves, ESA's forest-monitoring Biomass mission will employ long-wavelength ‘P-band’ radar, which has never previously flown in space. (image credit: ESA) 42)

- “This presented a technical challenge,” explains Florence Hélière, Biomass Payload Manager. “Because of the long, meter-scale wavelength of the P-band radar, traditional vacuum tube power amplifiers would be far too big and heavy for the satellite. — Instead, we turned to solid-state transistors as amplifiers – but no existing technology in the world provided the performance the instrument design needed. Fortunately, in parallel, another solution had become available, following years of ESA-led development.”

- These alternative transistors are based on gallium nitride (GaN), hailed as the most promising semiconductor since silicon. If you own a BluRay player you own a tiny crystal of GaN, part of the violet laser diode that reads discs.

- Versatile GaN’s ‘wide bandgap’ nature means it has the potential to provide 10 times more radio frequency output power than traditional semiconductors, while also operating at much higher temperatures. As a plus for space, it is also inherently radiation resistant, so can cope with the space environment including unpredictable space weather caused by the Sun.

Figure 24: Andrew Barnes, Senior ESA Technology Engineer (image credit: ESA - SJM Photography)

- “More than a decade ago, ESA saw the potential of GaN technology, and the importance of developing a reliable supply chain for space use,” says senior ESA technology engineer Andrew Barnes.

- “The result, in 2008, was the GaN Reliability and Technology Transfer initiative – GREAT2, working with European research institutes and industry to manufacture and test space-compatible GaN microwave transistors and integrated circuits. Our first GaN product flew aboard ESA’s Proba-V mission in 2013. - That early flight demonstration showed the Biomass team that gallium nitride was ready for them to take up. Then, in 2014, the hard work began. Building on the experience of GREAT2, supported by ESA’s Earth Observation Program, we had to flight-qualify around 120 items in all of these 15 W and 80 W GaN-based power transistors to show they could meet mission requirements.”

Figure 25: Transistors for Biomass: Gallium nitride-based transistors are required for the Biomass mission's P-band radar, and have undergone a test campaign. Around 70 items of these 15W and 80W GaN-based power transistors were required by the mission (image credit: ESA)

- The three-year program that followed was the most extreme set of quality control processes imaginable. The work was undertaken for ESA by United Monolithic Semiconductors, responsible for the transistor technology, and Tesat-Spacecom, overseeing their assembly, packaging and space qualification, with Airbus Defence and Space overseeing the overall Biomass mission.

- To begin with, the GaN wafer batches themselves underwent radio frequency and electrical testing, and were subjected to temperature extremes and squashed or pulled apart.

- As a next step, functional circuit samples were subjected to accelerated lifetime testing, running for more than 3000 hours with no RF power output degradation to pass ‘lot acceptance testing' (Figure 26).

- To safeguard them from the extremes of the orbital environment, the transistors needed to be fully laser-soldered within hermetic packages, followed by various tests to ensure a solid seal, ranging from X-ray inspection to hitting them and detecting the level of the echo.

- Once fully packaged, parts were tested randomly for the 15 W and 80 W qualification runs for a variety of trials such as vibration and other mechanical testing, microscopic inspection, endurance tests or signal output shape and character.

- “No failures were allowed during any testing,” added Andrew, “otherwise the entire lot had to be scrapped and manufacturing restarted.”

- The devices have also completed radiation testing – simulating the interaction with charged particles encountered in space – as well as for various destructive effects known to be triggered by operating high-power radio systems in a vacuum.

- “As a result, these GaN transistors are fully cleared for integration into the final Biomass radar instrument design,” comments Andrew, “providing the right technology at the right time for this crucial Earth-observing mission. And they are also available for other ESA and European missions in the future.”

Figure 26: Accelerated radio-frequency testing of 15 W Biomass radar power transistor (image credit: ESA)

• November 9, 2017: Microwave radio signals are able to pass freely through Earth’s atmosphere as well as empty space. They play a role in just about everything, including mission telemetry and telecommands, satellite services and broadcasting, navigation and timing signals and radar, along with other forms of active remote sensing. 43)

- ESA's Biomass mission is designed to track the status and dynamics of tropical forests using P-band radar. Because this frequency is so low, a vacuum tube amplifier would be too heavy and bulky for the type of satellite we envisage. Instead, Biomass has baselined solid state amplifiers using novel high-power semiconductor gallium nitride, harnessed for space through the ESA-led ‘GaN Reliability Enhancement and Technology Transfer Initiative’ (GREAT2) consortium.

- While the GaN technology has already been qualified, what we need to do is put that into a hermetically sealed package that can be flown in space – specially tailored to avoid any risk of electrical discharge or similar operating risks. Then put through rigorous lifetime testing to ensure reliability, arriving at a guaranteed mean time to failure.

- After the transistor is packaged at the solid-state power amplifier (SSPA) level, we're concerned about things like overall electrical performance and thermal dissipation, checking that waste heat is carried away without affecting component reliability – along with all the usual qualification steps of vibration, shock and thermal vacuum testing. The mission needs six SSPAs in total, each of these with three packaged GaN transistors inside. Nevertheless, we are qualifying a larger amount of packaged transistors to have a safe number of parts.

- Today that 6 x 6 mm prototype chip is now fabricated – also harnessing GaN – putting together a high-power amplifier, low-noise amplifier, a transmit-receive switch and a calibration coupler: what would normally involve an individual chip or circuit for each of these functions. The concept applies to any frequency band. In this case, we demonstrated the concept in C-band (for Sentinel-1) and it yielded three times more output power than the current amplifier on board these satellites, with savings of about 40% in terms of size.

- There were all kinds of challenges in integrating all these functions on such a small chip. For instance, having the high-power amplifier beside the low-noise amplifier – the heat from the former could for instance compromise the performance of the latter, but we were able to come up with system-level solutions, such as switching off elements when not in use.

Figure 27: Natanael Ayllon, ESA payload engineer, showing a prototype transmit/receive module on a single chip (image credit: ESA - SJM Photography)

• October 17, 2017: Thales Alenia Space has signed a contract with Airbus Defence and Space GmbH to develop the feed array system for the antenna on the European Space Agency’s Biomass spacecraft. This equipment is essential to guarantee full satellite performance. 44)

• October 2016: The SRR (System Requirements Review) was conducted in the summer of 2016. A successful SRR is an important step in the Project’s life cycle because it begins the procurement of the individual satellite components and the build-up of the full industrial consortium. Ground-based and airborne campaigns to collect data to support the algorithm development and validation are being conducted, underpinned by a study to tackle the end-to-end performance calibration of a P-band synthetic aperture radar system in the presence of the ionosphere. 45)

• May 3, 2016: ESA and Airbus Defence and Space UK signed a €229 million contract on 29 April to build the next Earth Explorer: the Biomass satellite, due to begin its mission in 2021. The satellite will provide global maps of how much carbon is stored in the world’s forests and how this stock is changing over time, mainly through the absorption of carbon dioxide, which is released from burning fossil fuels. Biomass will also provide essential support to UN treaties on the reduction of emissions from deforestation and forest degradation. 46)

- The spacecraft will carry the first spaceborne P-band synthetic aperture radar to deliver exceptionally accurate maps of tropical, temperate and boreal forest biomass that are not obtainable by ground measurement techniques. The mission will collect frequent information on global forests to determine the distribution of above-ground biomass in these forests and measure annual changes. The five-year mission will witness at least eight growth cycles in the world's forests.

- By using a P-band SAR(Synthetic Aperture Radar), the mission will use all-weather imaging from space to estimate forest biomass. Biomass will also be able to measure paleo aquifers in desert regions to find new water sources in arid regions as well as contribute to observations of ice sheet dynamics, subsurface geology and forest topography. Because Biomass will see through the forest canopy to the ground, terrain height maps will be provided, improving current Digital Elevation Models in densely forested areas. Biomass data will also support REDD+(Reducing Emissions from Deforestation and Forest Degradation), a UN climate change initiative aimed at reducing emissions due to deforestation, by systematically monitoring forests in vulnerable areas with no need for ground intervention.


Launch

Orbit:

Sun-synchronous near circular dawn-dusk orbit (LTAN of 6:00/18 hours), altitude of ~666 km, depending on the different mission phases. The orbit is designed to enable repeat pass interferometric acquisitions throughout the mission’s life and minimize the impact of ionospheric disturbances. The baseline observation principle is based on double-baseline interferometric acquisitions, with a repeat cycle of 17 days.

The strategy for meeting the interferometric baseline requirement is based on the selection of an orbit with a ‘controlled drift’. The amount of drift between successive orbital cycles is chosen to match the interferometric baseline requirement. In practice, the baseline is achieved by flying the satellite in an orbit where the altitude is slightly higher or lower than that of the exact repeating orbit. Because of this small drift, the resulting orbit will have a quasi-repeat cycle of 17 days for the baseline interferometric phase.

A double-baseline interferometric mode provides two interferometric acquisitions with temporal decorrelation within the requirements to improve retrieval accuracy. As shown in Figure 28, this mode consists of a set of three acquisitions with a fixed baseline to retrieve the forest height, while the orbit repeat cycle is kept to a minimum to ensure good temporal coherence between acquisitions spaced by two repeat cycles.

In such a way, each of the three swaths is imaged over three repeat cycles, before the satellite is rolled to observe the next one. The complete coverage is therefore achieved by matching the overall combined interferometric swath (obtained after nine repeat cycles) of 160 km with the orbit fundamental interval, achieving an orbit repeat cycle of 17 days and global coverage in just 5 months for the baseline interferometric phase.

Figure 28: Double-baseline interferometry using three interleaved swaths (major cycle). The blue lines represent the swaths, while the filled blocks are the areas where interferometric acquisition can be performed. The grey blocks represent acquisitions in the adjacent ground intervals (image credit: ESA)


Sensor Complement

P-SAR (P - Synthetic Aperture Radar)

P-SAR operates in a stripmap mode with a swath illuminated by a single antenna beam, i.e. an imaging configuration similar to that of the ERS-1/2 SAR. Global coverage is obtained by the interleaved stripmap operations among three complementary swaths as described previously. The beam re-pointing is performed through a roll maneuver of the spacecraft, as there is ample time over the poles for such operations. This solution using the spacecraft rolling was preferred over the possibility of electronic beam switching due to its simplicity (Ref. 25).

Instrument Concept A

A single sideband transmit pulse (linear FM) is generated, up-converted, amplified and sent to the polarization switch in the CEU (Central Electronics Unit). The polarization switch, operating at a low power level, toggles between the V and H transmit channels at each pulse repetition interval. The modulated transmit pulse is then amplified in the corresponding polarization channel in the transmit unit, routed to the circulator unit and radiated through the feed array. The HPA (High Power Amplifier) is made of three SSPAs (Solid-State Power Amplifiers) in parallel, each delivering a peak RF power of 120 W with a 10 % duty cycle and PRF (Pulse Repetition Frequency ) of 3000 Hz on average.

Because of the concentration of high peak power after the power combiner, multipaction must be avoided by an appropriate circuit design of the radar front-end part, between the HPA output and the power divider in the feed array.

In reception, the echo signals (V and H) are routed through the circulator unit to the receiving unit where filtering and amplification are performed. They are then routed to the CEU for analog-to-digital/down-conversion, data compression and packetization. In addition, the LNA (Low Noise Amplifiers) are protected by a limiter at their inputs against possible strong interference signals emitted by the SOTR (Space Objects Tracking Radars) and wind profilers.

The ICU (Instrument Control Unit) receives commands and information from the platform computer. It sets up the instrument operation parameters, controls image acquisitions, relays telemetry information and manages fault/limit checking and takes action where appropriate. It also maintains the instrument time reference, synchronized to an onboard GPS (Global Positioning System) clock.

The instrument power unit converts the 28 V DC unregulated power supply from the platform to appropriately conditioned DC power for all the electronics units, as well as provides the heater power for instrument thermal control. The instrument mass (including margin) is 202 kg with the NG reflector and 275 kg with the HC reflector. The maximum required DC power is 463 W for both reflector options and the maximum data rate is 115 Mbit/s prior to compression.

Figure 29: Illustration of instrument concept A (top) and concept B (bottom), image credit: ESA

Instrument Concept B

The linear transmit pulse is split in the BFN (Beam Forming Network) and routed to two parallel transmit chains and amplified. A polarization switch is placed after the HPA, to select the transmit polarization in each of the TRUs (Transmit/Receive Units), which delivers a peak RF power of 120 W with a 12 % duty cycle and a PRF of 3050 Hz on average. The two pairs of radiators (upper and lower) are fed separately by the respective TRUs and illuminate the reflector. Splitting the power into two parallel transmit channels helps avoid potential multipaction problems.

In reception, the echo signals from the two radiator pairs are filtered and amplified in four parallel receive chains (TRU-1: V and H and TRU-2: V and H). Those are recombined in the BFN to form the V and H signals and routed to the CEU. They are finally down-converted and digitized, followed by data compression and packetization. As any amplitude or phase imbalances between the channels would affect the beam pattern, the channel stability is ensured by the appropriate design of the TRUs, i.e. of the HPAs and the LNAs.

An additional phase equalization can be foreseen for compensating relative phase drifts due to ageing (included in the CEU). A limiter and an isolation switch at the LNA input protect them against possible strong interference signals. The instrument mass (including margin) is 206 kg. The maximum required DC power is 221 W and the maximum data rate is 117 Mbit/s prior to compression.

Both concepts use a single-offset reflector antenna system consisting of a feed array and a large deployable mesh reflector with a circular projected aperture diameter of 11.5 m – 12 m, depending on the concept. The selected configuration is characterized by a relatively short focal length to minimize the distance between the spacecraft and the reflector. Because of this, the reflector, when illuminated by a linearly polarized spherical wave from the feed, would produce significant cross-polar radiation (12–15 dB below the co-polar peak gain) in its main beam. The main beam has the form of a difference pattern (narrow null along the principal elevation plane).

To comply with the cross-polarization ratio requirement, a pre-compensation technique is then implemented at the level of the feed. Stacking the patches is necessary to achieve a sufficient bandwidth at the level of the feed subsystem (<10 MHz). The feed assembly is made of a multilayer sandwich structure, consisting of metalized carbon or Kevlar-fiber-reinforced plastic sheets and Kevlar honeycomb or Rohacell foam core, thus low mass. Concept A uses three pairs of radiators with tapered excitation in elevation, whereas only two pairs of radiators with equal excitation are used for Concept B.

Figure 30: Feed array consisting of 3 x 2 stacked circular patches and body-mounted on the satellite Concept A (left); Deployable feed array consisting of 2 x 2 stacked square patches on a support structure Concept B (right), image credit: ESA

The radio frequency and digital electronics of the Biomass SAR instrument use well-established technologies thanks to the low radar frequency (UHF band) and narrow system bandwidth (6 MHz). However, the combination of the low frequency and high peak RF power increases the risk of multipaction. Therefore, several specific risk-retirement activities were undertaken and specific measures were implemented in the radar front-end design.


The swath width is around 50 km, which is achievable in full-polarimetric mode at three incidences (Figure 31). The operating incidence range is between 23° and 35°, as required for the mission. 47)

Figure 31: P-SAR viewing geometry (image credit: BIOMASS Team)


P-band Antenna Feed S/S (Subsystem)

The BIOMASS SAR P-Band antenna consists of a large deployable reflector antenna system with an offset geometry that results in a high cross-polar level from the reflector. This is compensated with an adequate design of the reflector Feed S/S to generate a “cross-polar” pattern with proper amplitude and phase to cancel the reflector cross-polar down to admissible values. 48)


References

1) “ESA's Next Earth Explorer Satellite,” ESA Press Release No 13-2013, May 7, 2013, URL: http://www.esa.int/For_Media/Press_Releases/ESA_s_next_Earth_Explorer_satellite

2) Florence Hélière, Franco Fois, Marco Arcioni, Paolo Bensi, Michael Fehringer, Klaus Scipal, “Key Note on Biomass: a P-band SAR Polar-Interferometric Mission Selected as 7th Earth Explorer Mission,” Proceedings of the Advanced RF Sensors and Remote Sensing Instruments-Ka-band Earth Observation Radar Missions,” (ARSI'14 & KEO'14), ESA/ESTEC, Noordwijk, The Netherlands, Nov. 4-7, 2014

3) Florence Hélière, Adriano Carbone, J. G. Nelson Fonseca, Natanael Ayllon, Andrew Barnes, Michael Fehringer, ”Biomass P-band SAR,” Proceedings of EUSAR 2016, 11th European Conference on Synthetic Aperture Radar, Hamburg, Germany, June 6-9, 2016

4) Michael Rast, ”ESA’s Report to the 41st COSPAR Meeting,”(ESA SP-1333, June 2016), Istanbul, Turkey, July-August 2016, pp: 46-50, URL: http://esamultimedia.esa.int/multimedia/publications/SP-1333/SP-1333.pdf

5) IPCC 2007, ”Climate Change 2007: The Physical Science Basis,” (Eds. S. Solomon et al.), Contribution of Working Group I to the Fourth Assessment Report of the Intergovernmental Panel on Climate Change. Cambridge University Press, Cambridge, UK, URL: https://archive.ipcc.ch/pdf/assessment-report/ar4/wg1/ar4-wg1-frontmatter.pdf

6) Josep G. Canadell, Corinne Le Quéré, Michael R. Raupach, Christopher B. Field, Erik T. Buitenhuis, Philippe Ciais, Thomas J. Conway, Nathan P. Gillett, R. A. Houghton, Gregg Marland, ”Contributions to accelerating atmospheric CO2 growth from economic activity, carbon intensity, and efficiency of natural sinks,” PNAS (Proceedings of the National Academy of Sciences), Vol. 104, No 47, Nov. 20, 2007, pp: 18866-18870, URL: http://www.pnas.org/content/104/47/18866.full.pdf

7) ”Implementation Plan for the Global Observing System for Climate in Support of the UNFCCC,” GCOS–92, WMO Technical Document No. 1219. October 2004, World Meteorological Organization, Geneva, Switzerland,  URL:  https://web.archive.org/web/20130610000933/http://www.wmo.int/pages/prog/gcos/Publications/gcos-92_GIP.pdf

8) R. A. Houghton, Forrest Hall, Scott J. Goetz, ”Importance of biomass in the global carbon cycle,” Journal of Geophysical Research, Volume 114, Issue G2, G00E03, doi:10.1029/2009JG000935, 2009, URL: http://onlinelibrary.wiley.com/doi/10.1029/2009JG000935/epdf

9) Shaun Quegan, “Biomass: A Mission to determine global Biomass,” NCEO/CEOI (National Centre for Earth Observation/Centre for Earth Observation Instrumentation) Joint Science Conference, Nottingham, UK, Sept 18-20, 2012, [web source no longer available]

10) T. Le Toan, S. Quegan, M. W. J. Davidson, H. Balzter, P. Paillou, K. Papathanassiou, S. Plummer, F. Rocca, S. Saatchi, H. Shugart, L. Ulander, “The BIOMASS mission: Mapping global forest biomass to better understand the terrestrial carbon cycle,” Remote Sensing of Environment, Vol. 115, Issue 11, 15 November 2011, pp. 2850–2860

11) Mathew Williams, “The BIOMASS Mission: Science and Background,” 1st BIOMASS Science Workshop, ESA/ESRIN, Frascati, Italy, Jan. 27-30, 2015, URL: [web source no longer available]

12) Thuy Le Toan and the Biomass Mission Advisory Group, “The Biomass mission - How it works, what it measures?,” 1st BIOMASS Science Workshop, ESA/ESRIN, Frascati, Italy, Jan. 27-30, 2015, URL: [web source no longer available]

13) Shaun Quegan, “Facing the scientific challenges of the BIOMASS mission,” 1st BIOMASS Science Workshop, ESA/ESRIN, Frascati, Italy, Jan. 27-30, 2015, URL: [web source no longer available]

14) João M.B. Carreiras, Shaun Quegan, Thuy Le Toan, Dinh Ho Tong Minh, Sassan S. Saatchi, Nuno Carvalhais, Markus Reichstein, Klaus Scipal, ”Coverage of high biomass forests by the ESA BIOMASS mission under defense restrictions,” Remote Sensing of Environment, Volume 196, July 2017, Pages 154-162, URL: [web source no longer available]

15) Thomas A. R. Jenkins, Ewan D. Mackie, Robert W. Matthews, Gemma Miller, Timothy J. Randle, Miriam E. White, ”FC Woodland Carbon Code: Carbon Assessment Protocol (v2.0),” Forestry Commission, Version 2.0, 05 March 2018, URL:  https://www.woodlandcarboncode.org.uk/images/PDFs/WCC_CarbonAssessmentProtocol_V2.0_March2018.pdf

16) S. Mermoz, M. Rejou-Mechain, L. Villard, T. Le Toan, V. Rossi, S. Gourlet-Fleury, “Biomass of dense forests related to L-band SAR backscatter,” Proceedings of IGARSS (IEEE Geoscience and Remote Sensing Society) 2014, Québec, Canada, July 13-18, 2014

17) “Biomass monitoring mission for Carbon Assessment (BIOMASS),” CESBIO, 2013, URL: http://www.cesbio.ups-tlse.fr/us/indexbiomass.html

18) K. Scipal, M. Arcioni, J. Chave, J. Dall, F. Fois, T. LeToan, C-C. Lin, K. Papathanassiou, S. Quegan, F. Rocca, S. Saatchi, H. Shugart, L. Ulander, M. Williams, “The BIOMASS Mission- An ESA Earth Explorer Candidate to Measure the BIOMASS of the Earth's Forests,” Proceedings of IGARSS (IEEE International Geoscience and Remote Sensing Symposium) 2010, Honolulu, HI, USA, July 25-30, 2010, URL: http://orbit.dtu.dk/files/5222627/D36048EEd01.pdf

19) Klaus Scipal, Marco Arcioni, “Report for Mission Selection: Biomass,” ESA, SP-1324/1, May 2012, URL: http://esamultimedia.esa.int/docs/EarthObservation/SP1324-1_BIOMASSr.pdf

20) K. Fletcher, H. Rider, D. Wishart, “Report for Mission Selection: Biomass,” ESA SP-1324/1, May 2012, URL: http://esamultimedia.esa.int/docs/EarthObservation/SP1324-1_BIOMASSr.pdf

21) “ESA's Biomass satellite goes ahead,” ESA, Feb. 19, 2015, URL: http://www.esa.int/Our_Activities/Observing_the_Earth/ESA_s_Biomass_satellite_goes_ahead

22) ”Ready to build the BIOMASS forest mission,” ESA, May 3, 2016, URL: http://www.esa.int/Our_Activities/Observing_the_Earth/Ready_to_build_the_Biomass_forest_mission

23) M. Arcioni, P. Bensi, F. Fois, A. Gabriele, F. Hélière, C.-C. Lin, L. Massotti, K. Scipal, “ESA's Biomass Mission System and Payload Overview,” Proceedings of the ESA Living Planet Symposium, Edinburgh, UK, Sept. 9-13, 2013, SP-722, Dec. 2013

24) Dinh Ho Tong Minh, Thuy Le Toan, Fabio Rocca, Stefano Tebaldini, Ludovic Villard, Maxime Réjou-Méchain, Jérôme Chave, “Tomographic imaging of tropical forests: perspectives for the BIOMASS Mission,” Proceedings of EUSAR 2014 (10th European Conference on Synthetic Aperture Radar), Berlin, Germany, June 3-5, 2014

25) Florence Hélière, Franco Fois, Marco Arcioni, Paolo Bensi, Michael Fehringer, Klaus Scipal, “Biomass P-band SAR interferometric mission selected as 7th Earth Explorer Mission,” Proceedings of EUSAR 2014 (10th European Conference on Synthetic Aperture Radar), Berlin, Germany, June 3-5, 2014

26) Stephan Strauss, Charlotte Bewick, Vilfrido Lo Rizzo, Rolf Janovsky, Frank te Hennepe, Stefania Cornara, Giorgio Trinchero, Paolo Valle, Giuseppe Orlando, “System design challenges using P-band SAR observations from low Earth orbit for the Biomass mission,” Proceedings of the 65th International Astronautical Congress (IAC 2014), Toronto, Canada, Sept. 29-Oct. 3, 2014, paper: IAC-14.B1.2.10

27) “BIOMASS 2015 Program,” 1st BIOMASS Science Workshop, ESA/ESRIN, Frascati, Italy, Jan. 27-30, 2015, URL: [web source no longer available]

28) M. Arcioni, P. Bensi, M. Fehringer, F. Fois, F. Heliere, K. Scipal, “The Biomass Mission, status of the satellite system,” 1st BIOMASS Science Workshop, ESA/ESRIN, Frascati, Italy, Jan. 27-30, 2015, URL: [web source no longer available]

29) Philippe Paillou, Jorgen Dall, Klaus Scipal, “The BIOMASS Mission: Secondary Objectives,” 1st BIOMASS Science Workshop, ESA/ESRIN, Frascati, Italy, Jan. 27-30, 2015, URL: [web source no longer available]

30) Shaun Quegan, Thuy Le Toan, “The BIOMASS mission: a step forward in qualifying the Earth's carbon balance,” Proceedings of the IGARSS (International Geoscience and Remote Sensing Symposium) 2015, Milan, Italy, July 26-31, 2015

31) ”A Reflection Of Harris Expertise For Airbus UK,” Satnews Daily, July 28, 2016, URL: http://www.satnews.com/story.php?number=1684061282

32) ”Radio eye on tree-counting Biomass,” ESA Enabling & Support, 13 April 2022, URL: https://www.esa.int/ESA_Multimedia/Images/2022/04/Radio_eye_on_tree-counting_Biomass

33) ”Forecasting performance of a space antenna – before it gets built,” ESA Enabling & Support, 26 January 2022, URL: https://www.esa.int/Enabling_Support/Space_Engineering_Technology/Forecasting_performance_of_a_space_antenna_before_it_gets_built

34) ”ESA’s Biomass on track to target forests,” ESA Applications, 15 November 2021, URL: https://www.esa.int/Applications/Observing_the_Earth/Biomass/ESA_s_Biomass_on_track_to_target_forests

35) Luciana V. Gatti, Luana S. Basso, John B. Miller, Manuel Gloor, Lucas Gatti Domingues, Henrique L. G. Cassol, Graciela Tejada, Luiz E. O. C. Aragão, Carlos Nobre, Wouter Peters, Luciano Marani, Egidio Arai, Alber H. Sanches, Sergio M. Corrêa, Liana Anderson, Celso Von Randow, Caio S. C. Correia, Stephane P. Crispim & Raiane A. L. Neves, ”Amazonia as a carbon source linked to deforestation and climate change,” Nature, Vol. 595, pp: 388-393, Published: 14 July 2021, https://doi.org/10.1038/s41586-021-03629-6

36) ”The Biomass satellite and disappearing ‘football fields’,” Airbus News, 22 September 2021, URL:  https://web.archive.org/web/20211023165850/https://www.airbus.com/newsroom/news/en/2021/09/The-Biomass-satellite-and-disappearing-football-fields.html

37) ”Forest measuring satellite passes tests with flying colors,” ESA Applications, 28 April 2021, URL: https://www.esa.int/Applications/Observing_the_Earth/Biomass/Forest_measuring_satellite_passes_tests_with_flying_colours

38) ”Biomass forest sensing satellite shaping up,” Airbus Press Release, 11 February 2021, URL:  https://web.archive.org/web/20211016151625/https://www.airbus.com/newsroom/press-releases/en/2021/02/biomass-forest-sensing-satellite-shaping-up.html

39) ”Contract seals deal for Biomass satellite’s ride into space,” ESA / Applications / Observing the Earth, 28 October 2019, URL: https://www.esa.int/Applications/Observing_the_Earth/Contract_seals_deal_for_Biomass_satellite_s_ride_into_space

40) ”Biomass mission,” ESA, Technology image of the week, 12 February 2019, URL: http://m.esa.int/spaceinimages/Images/2019/02/Biomass_mission

41) ”Key components of tree-counting Biomass radar cleared for space,” ESA, 16 October 2018, URL: http://m.esa.int/Our_Activities/Space_Engineering_Technology/Key_components_of_tree-counting_Biomass_radar_cleared_for_space

42) ”P-band radar piercing through forest canopy,” ESA, URL: http://m.esa.int/spaceinimages/Images/2018/10/P-band_radar_piercing_through_forest_canopy

43) ”Delivering signal power to cross space,” ESA, 9 Nov. 2017, URL: http://m.esa.int/Our_Activities/Space_Engineering_Technology/Talking_technology/Delivering_signal_power_to_cross_space

44) ”Thales Alenia Space Measures Up to Win Contract for ESA Measuring Biomass” Satnews Daily, Oct. 17, 2017, URL: http://www.satnews.com/story.php?number=1619283488

45) ”Biomass status,” ESA Bulletin No 165-168, Oct. 2016, published in January 2017, URL: http://esamultimedia.esa.int/multimedia/publications/ESA-Bulletin-165-168/offline/download.pdf

46) ”Ready to build the Biomass forest mission,” ESA, May 3, 2016, URL: http://www.esa.int/Our_Activities/Observing_the_Earth/Ready_to_build_the_Biomass_forest_mission

47) Sophie Ramongassié, Paolo Valle, Giuseppe Orlando, Pier Giorgio Arpesi, Florence Helière, Marco Arcioni, “P-band SAR instrument for BIOMASS,” Proceedings of EUSAR 2014 (10th European Conference on Synthetic Aperture Radar), Berlin, Germany, June 3-5, 2014

48) Margarita Naranjo, Antonio Montesano, Fernando Monjas, Mario Gómez, Rodrigo Manrique, Florence Hélière, Kees Van’t Klooster, “BIOMASS P-band SAR Reflector Antenna - Feed S/S Breadboarding,” Proceedings of EUSAR 2014 (10th European Conference on Synthetic Aperture Radar), Berlin, Germany, June 3-5, 2014


The information compiled and edited in this article was provided by Herbert J. Kramer from his documentation of: ”Observation of the Earth and Its Environment: Survey of Missions and Sensors” (Springer Verlag) as well as many other sources after the publication of the 4th edition in 2002.


Spacecraft   Development Status   Launch   Sensor Complement   References   Back to top


FAQ