Pi-SAR2 (Polarimetric and interferometric SAR2)
Airborne Sensors
Pi-SAR2 (Polarimetric and interferometric SAR2) Airborne Instrument
The second generation airborne polarimetric and interferometric synthetic aperture radar system (Pi-SAR2) was designed and developed at NICT (National Institute of Information and Communications Technology) Tokyo, Japan from 2006 to 2009, as a successor to the Pi-SAR (X-band). The system provides high-resolution, X-band, polarimetric data. The spatial resolution is 0.3 m for the high-resolution mode in the azimuth and the slant range directions. Furthermore the system has a cross-track interferometric function for VV polarization that measure the ground height aiming at height accuracy of 2 m. 1) 2) 3)
The airborne X-band synthetic aperture radar system, called as Pi-SAR, has been developed by CRL and is flown since 1993. In 2006, NICT started to develop Pi-SAR2 as a successor of Pi-SAR.
Note: NICT is a merger of CRL (Communication Research Laboratory and the Telecommunications Advancement Organization of Japan (since 2004).
A prime objective of the two airborne SAR instruments is to provide quick imagery in disaster situations (such as earthquakes, volcano eruptions, or landslides). A very important aspect to obtain this information for large-scale disasters is through aerial photography taken from helicopters and other small-scale aircraft. However, this can be difficult in poor weather or at night-time, and getting detailed information over wide areas can take time because of the relatively low altitude. 4)
Background
The effectiveness of Pi-SAR has been demonstrated by covering actual volcanic eruption and earthquake disaster sites. Using this equipment, areas of over 10 km wide, flying distances of over 50 km can be observed in a single pass from an altitude of 12,000 m. The main benefit of SAR imagery is the fact that the observations are not obstructed by cloud or rain, and can be made during the night.
The development of Pi-SAR2 was tarted in 2006 to achieve higher performance for practical application during disasters with sub-meter spatial resolution. The maximum bandwidth of 500 MHz obtained a spatial resolution of 0.3 m in slant range. The chirp pulse is generated by the 12 bit D/A converter with a system clock of 1.6 GHz. - The initial demonstration flight of the Pi-SAR2 instrument was conducted in December 2008 (Ref. 4).
Parameter | Pi-SAR | Pi-SAR2 |
Center frequency | 9.55 GHz | 9.65/9.55 GHz |
Bandwidth | 100 MHz | 500/300/150 MHz (in modes) |
Slant range resolution | 1.5 m | 0.3/0.5/1.0 m |
Azimuth resolution | 1.5 m (4 looks) | 0.3 m (1 look) / 0.6 m (2 looks) |
Swath width | > 10 km | > 5 ~ 10 km |
NESZ (Noise Equivalent Sigma Zero) | < -33 dB | < -23/ -27/ -30 dB |
Source data rate | 32 MByte/s x 2 channels | 200 MByte/s x 4 channels |
Data recorder | D1 tape recorder x 2 channels | 3.5 inch HD array x 4 channels |
Radome location | forepart of body | base of wings |
Distance between main and sub antenna | 2.3 m | 2.6 m |
Antenna azimuth movement | - | sliding spotlight (optional mode) |
Pi-SAR2 Instrument
The Pi-SAR2 instrument provides high-resolution, X-band, polarimetric data. In both the azimuth and slant range directions, the resolution is 0.3 m for the high-resolution mode. Furthermore the system has a cross-track interferometric function for VV polarization that measure the ground height aiming at height accuracy of 2 m. The instrument features two antennas with vertical and horizontal polarizations for polarimetric observation and one auxiliary antenna with vertical polarization for interferometric observation.
XTI (Cross-Track Interferometry): XTI is useful from three points of view: a) monitoring natural disaster such as volcanic activity by using DEM (Digital Elevation Model) producing by XTI, b) orthorectifying the SAR image by using the DEM observed at the same time, and c) estimating the biomass by comparing the DEM of XTI with a different DEM.
Using the DEM of XTI is effective to detect the change of volume of a volcanic crater and a lava dome in spite of smoke from the volcano and under any weather conditions. It is convenient to correct the distortion of a SAR image without the registration. In the case of X-band, the height corresponds to the height at the crown of the tree. The tree height can be estimated by subtracting the height at ground surface such as digital map 50 m grid (elevation model) produced by the GSI (Geographical Survey Institute) as a ground height map.
For simultaneous polarimetric and interferometric observations, the swath width is 5 km for a flight altitude of 12000 m. The aim is to achieve a measurement height accuracy of < 2 m for the cross-track interferometric imagery.
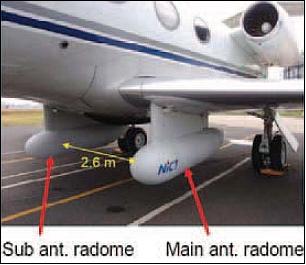
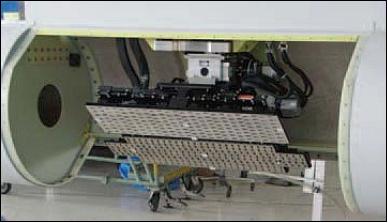
Interferometric SAR: To realize a simultaneous polarimetric and interferometric observation, three slotted waveguide planar array antennas (two vertical polarized antennas and a horizontal polarized antenna) are installed in two radomes at the left and right sides of an airplane. The distance between the main antenna in the left radome and the auxiliary antenna in the right radome is 2.6 m shown in Figure 7. The Pi-SAR2 system transmits microwave signals using the vertical antenna and the horizontal antenna, respectively; the echo data is received by three antennas. The data from each of the three antennas is recorded on hard disks at source data rate of 200 MB/s for each channel. The yaw angle is controlled in the range of ±9º to compensate for the drift angle.
Center frequency | 9.55/9.65/9.65 GHz (X-band) |
Bandwidth | 500/300/150 MHz |
Instrument mass | 537 kg (INS inclusive) |
Slant range resolution | 0.3/0.5/1.0 m |
Azimuth resolution | 0.3/0.6/1.2 m; (1/2/4 look) |
Noise equivalent NRCS | less than -23/-27/-30 dB |
Transmitter peak power | H: 7.5 kW V: 7.0 kW |
Antenna size (Az x El) | 668 mm x 200 mm |
Beam width (Az x El) | 3º x 35º |
D/A conversion for chirp | 12 bit DAC with 1.6 GHz clock |
A/D conversion of Rx | Real method: 8 bit ADC with 1.6 GHz sampling |
Source data recording rate | 800 (200 x 4 ch) MByte/s, Conduant TK400 |
Swath width (ground range) | 7.2/21/42 km |
Receiving channel | 3 ch (Vm, Hm, Vs) or 4 ch (Vm,Hm,Vf,Va) |
Combination of data | 6 ch (Quad Pol.+XTI) or 8 ch (Quad Pol.+ATI) |
Range of antenna rotation in yaw | ±9º |
Baseline for cross-track interferometry | 2.6 m |
Incidence angle | 10-65º variable |
Flight avionics system | Applanix POS AV610 |
Pi-SAR2 Processor (developed by NEC Corporation)
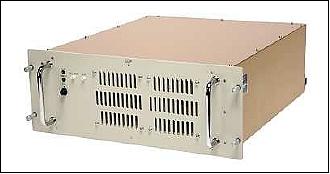
The processor model adopted the offset video methodfor high performance processing support, instead of the conventional I/Q video method. The offset video method is capable to generate the 300 MHz bandwidth chirp pulse and to process video signals at 720 MHz sampling rate for the input with 300 MHz bandwidth. 5)
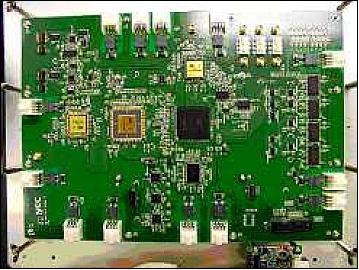
This system consists of one D/A (Digital/Analog) module and three A/D modules. The D/A module has a control I/F with a system controller, and generates and distributes a timing signal according to a received command as well as distributes a control command.
Technology introduction: For the conventional signal generator using the “I/Q video method”, it is necessary to generate the In-phase (I) and Quadrature-phase (Q) signals and to mix two signals using an analog I/Q modulator. - An the other hand, the signal generator of the adopted “offset video method” generates a signal by means of a D/A conversion of the digital waveform data, whose center frequency is offset and stored on a waveform memory (Figure 2).
Since the offset video method typically generates a signal in ¼ the time of a D/A conversion, the carrier leakage and harmonic leakage are decreased compared with the I/Q video method. In addition, since the offset video method consists of a single D/A converter, it is unnecessary to adjust the amplitude error and phase error between the I/Q signals and no image signal is generated.

The offset video method is also adopted for the signal processor using a similar reasoning. This method does not require strictly coherent sampling of the two signals (namely I-ch and Q-ch) which is necessary for the I/Q video method.
In conclusion, the following major outcomes have been achieved:
• Establishment of chirp pulse generating/processing technology by the offset video method
• Chirp pulse generation/processing in the bands of 150 MHz, 300 MHz, and 500 MHz
• Sampling rate: 1.6 GHz max.
Instrument Calibration
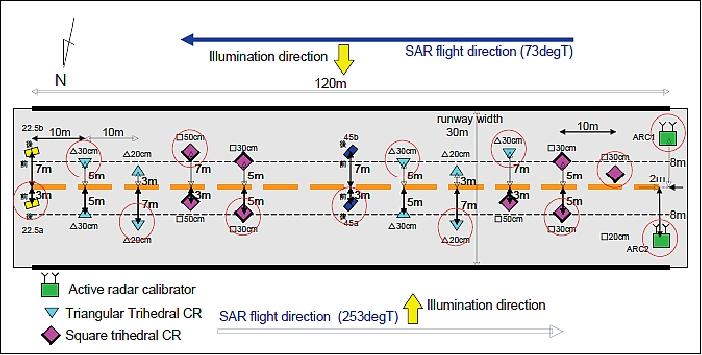
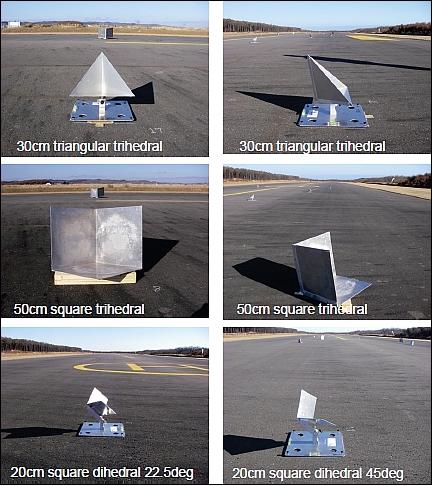
Ground based calibration experiment using corner reflectors (CR) in conjunction with the Pi-SAR2 test flight. The calibration experiments were conducted on Dec. 1 and 2, 2008 and on Feb. 2, 2010 at the runway of the Taiki aerospace experiment field in Hokkaido, Japan. The project used 20 CRs (different shape and radar cross section) for radiometric and polarimetric calibrations. Figure 4 shows the arrangement of CRs on the runway (red circles show the reflectors used for SAR flight direction of 73º). Photos of the CRs are shown in Figure 5. 6) 7)
Pi-SAR2 Platform
The Pi-SAR2 instrument is flown on a Grumman Gulfstream II aircraft of the service provider DAS (Diamond Air Service Inc.). The two antenna units are installed under the inner-wing. The baseline length of the cross-track interferometry is about 2.6 m. To archive the spatial resolution of 0.3 m, the position of platform has to be measured accurately. The Pi-SAR2 uses the POS AV instrumentation with the GPS receiver to correct the position and attitude data of the platform. The antenna beams are able to steer in yaw-axis between 9degrees to cancel the drift angle of the platform. By using the yaw-steering mechanism, the Pi-SAR2 is able to the observation with the sliding spotlight SAR. The antenna beams are able to steer in elevation to direct the boresight of the antenna to the target. The NESZ backscattering coefficient is kept to < -23 dB for platform altitudes of 12,000 m above ground.

Pi-SAR-2 Observation Support in Earthquake/Tsunami Stricken Japan
Japanese earthquake of March 11, 2011 (9.0 magnitude). The day after the earthquake, NICT conducted emergency monitoring of the Pacific coast and around the main roads of the Tokyo district using the Pi-SAR-2 on the Grumman Gulfstream of DAS (Diamond Air Service Inc).
The observation areas were scattered over a 500 km wide area. SAR images were processed in flight using the onboard processor. After landing, these SAR images were sent to the head office of NICT, distributed to headquarters for disaster control and uploaded onto the website. 8) 9) 10)
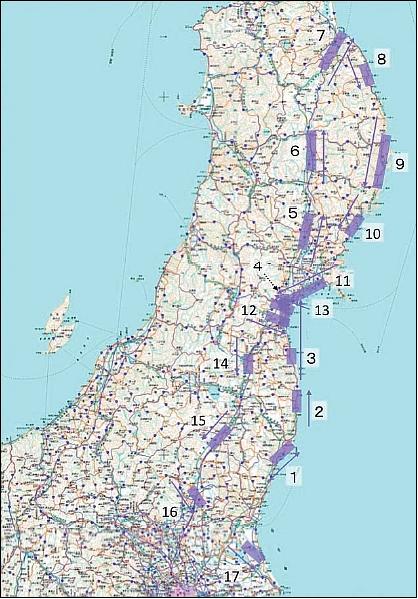
Legend to Figure 9: The rectangular parts in purple represent observed areas. The numbers indicate the order of the observations. Following the instructions from flight control, the Pi-SAR2 team did not make observations along some parts of our flight path.
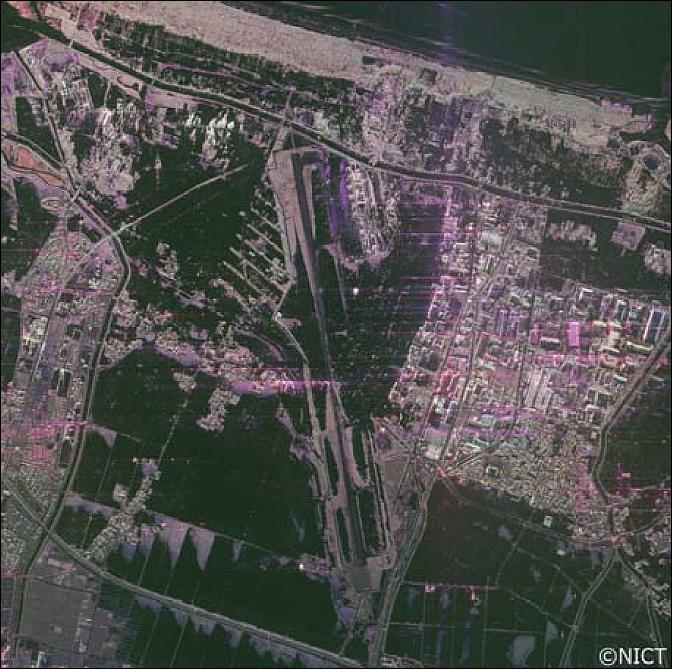
Legend to Figure 10: The black regions dominating the image are the areas flooded by the tsunami. Flight altitude of 8500 m. The image area is 5 km x 5 km.
The color composite images around Onagawa port are shown in Figures 11 and 12. The observation parameters around Onagawa are shown in Table 1. Figure 11 was taken on March 18, 2011 and Figure 12 was taken on August 25, 2011. The wave height of the tsunami at Onagawa reached over 14m (Ref. 10).
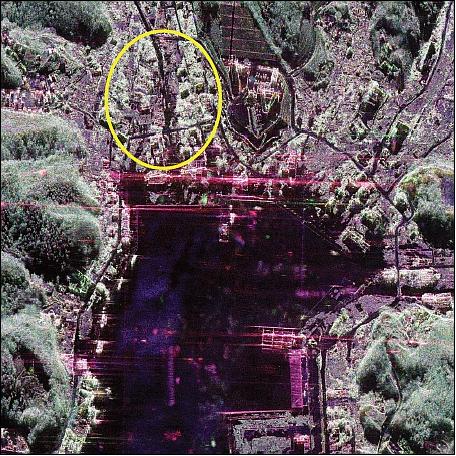
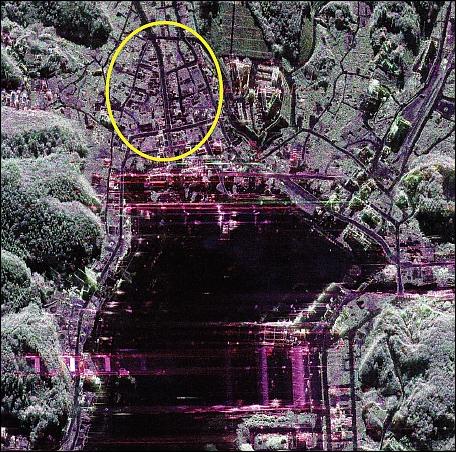
Legend to Figures 11 and 12: The color composite images around Onagawa port are shown. Red, green, and blue are allocated to HH, HV, and VV polarimetry, respectively. The image size is 1 km x 1 km.
Path No | 2011031809 | 2011082513 |
Site name | Onawaga | Onawaga |
Data | March 18, 2011 | August 25, 2011 |
Location | N38 deg 26’ 35.3’’, E141 deg 26’ 54.0’’ | N38 deg 26’ 35.3’’, E141 deg 26’ 54.0’’ |
Flight altitude | 8684 m | 8925 m |
Speed | 214 m/s | 186 m/s |
True heading | 176.6º | 176.3º |
Drift angle | -6.84º | -6.19º |
Incidence angle | 40.7º | 39.8º |
Image size (Az x Gr) | 1.0 km x 1.0 km | 1.0 km x 1.0 km |
Pixel spacing (Az x Gr) | 0.25 m x 0.25 m | 0.25 m x 0.25 m |
Resolution (Az x Gr) | 0.30 m x 0.46 m | 0.30 m x 0.47 m |
References
1) S. Uratsuka , T. Kobayashi , T. Umehara, T. Matsuoka , A. Nadai, M. Satake , J. Uemoto, “Airborne SAR Development at NICT: Concept for new Generation,” International Archives of the Photogrammetry, Remote Sensing and Spatial Information Science, Volume XXXVIII, Part 8, Kyoto, Japan, ISPRS, Aug. 9-13, 2010, , URL: http://www.isprs.org/proceedings/XXXVIII/part8/headline/NICT%20special%20Session%20-%201/NTS11_20100608020300.pdf
2) Tatsuharu Kobayashi, Toshihiko Umehara, Takeshi Matsuoka, Akitsugu Nadai, Makoto Satake, Shoichiro Kojima, Jyunpei Uemoto, Seiho Uratsuka, “Preliminary Results on cross-track Interferometric SAR Function of the Airborne SAR System (PI-SAR2) of NICT,” Proceedings of IGARSS (International Geoscience and Remote Sensing Symposium), Vancouver, Canada, July 24-29, 2011
3) Jyunpei Uemoto, Seiho Uratsuka, Toshihiko Umehara, Shin-ichi Yamamoto, Shinichi Taira, Makoto Satake, Shoichiro Kojima, Tatsuharu Kobayashi, Masaki Satoh, Kazuyoshi Kawasaki, Takeshi Matsuoka, Akitsugu Nadai, Ryutaro Suzuki, “Development of the onboard processor for Pi-SAR-2,” Proceedings of IGARSS (International Geoscience and Remote Sensing Symposium), Vancouver, Canada, July 24-29, 2011
4) Seiho Uratsuka, “Getting Disaster Situations Instantly, in Greater Detail,” NICT News, No 380, May 2009, pp. 1-2, URL: http://www.nict.go.jp/publication/NICT-News/0905/NICT_NEWS_0905_E.pdf
5) Shingo Matsuo, Takashi Fujimura, Isamu Oihara, Eiji Totsuka, Yoshitaka Ohura, Tsunekazu Kimura, “The digital wide band chirp pulse generator and processor for Pi-SAR2 ,” Proceedings of IGARSS (IEEE International Geoscience and Remote Sensing Symposium) 2010, Honolulu, HI, USA, July 25-30, 2010
6) Takeshi Matsuoka, Toshihiko Umehara, Akitsugu Nadai, Tatsuharu Kobayashi , Makoto Satake , Jyunpei Uemoto, Seiho Uratsuka, “Calibration experiments of X-band high performance airborne SAR system (Pi-SAR2),” International Archives of the Photogrammetry, Remote Sensing and Spatial Information Science, Volume XXXVIII, Part 8,, Kyoto, Japan, ISPRS, Aug. 9-13, 2010, URL: http://www.isprs.org/proceedings/XXXVIII/part8/headline/NICT%20special%20Session%20-%201/NTS13_20100608142200.pdf
7) Makoto Satake, Takeshi Matsuoka, Toshihiko Umehara, Tatsuharu Kobayashi, Akitsugu Nadai, Jyunpei Uemoto, Shoichiro Kojima, Seiho Uratsuka, “Calibration experiments of advanced X-band airborne SAR system, Pi-SAR2,” Proceedings of IGARSS (International Geoscience and Remote Sensing Symposium), Vancouver, Canada, July 24-29, 2011
8) Seiho Uratsuka, “Pi-SAR2 used for Emergency Observation of Area Stricken by the Great East Japan Earthquake,” NICT News 2011.5, URL: http://nightcap/en/data/pdf/NICT_1105_E. pdf
9) T. Kobayashi, T. Umehara, M. Satake, S. Kojima, J. Emote, T. Matsuoka, A. Nadai, S. Uratsuka, “Observations just after the great East Japan Earthquake by the airborne SAR (Pi-SAR2) of NICT,” Proceedings of IGARSS (International Geoscience and Remote Sensing Symposium), Vancouver, Canada, July 24-29, 2011
10) Tatsuharu Kobayashi, Toshihiko Umehara, Jyunpei Uemoto, Makoto Satake, Shoichiro Kojima, Takeshi Matsuoka, Akitsugu Nadai, Seiho Uratsuka, “Damage Detection of the Great East Japan Earthquake by the airborne SAR (PI-SAR2) of NICT,” Proceedings of IGARSS (International Geoscience and Remote Sensing Symposium), Munich, Germany, July 22-27, 2012
The information compiled and edited in this article was provided by Herbert J. Kramer from his documentation of: ”Observation of the Earth and Its Environment: Survey of Missions and Sensors” (Springer Verlag) as well as many other sources after the publication of the 4th edition in 2002. -Comments and corrections to this article are always welcome for further updates (eoportal@symbios.space).