APEX (Airborne PRISM Experiment)
Airborne Sensors
APEX (Airborne PRISM Experiment)
Overview
APEX is an airborne dispersive imaging spectrometer developed and built on behalf of ESA [within the framework of PRODEX (Programme développement d'expériences scientifiques)] and co-funded by a Swiss-Belgian consortium. APEX is intended as a simulator and a calibration and validation device for future spaceborne hyperspectral imagers. 1) 2) 3) 4) 5) 6) 7) 8) 9)
RSL (Remote Sensing Laboratory) of the University of Zürich (Irchel, Switzerland) is the instrument PI, while VITO (Flemish Institute for Technological Research) of Belgium is the CoI (Co-Investigator) in this constellation. The industrial consortium is composed out of joint Swiss/Belgian industries with the support of ESA EO-EP (detectors, calibration, technical management).
In phases C and D, an industrial consortium was formed under the prime contractor RUAG (Rüstungsunternehmungen AG) Aerospace (Emmen, Switzerland), responsible for the total system and the mechanical components, OIP (Oudenaarde, Belgium) contributing the spectrometer, and Netcetera (Zurich, Switzerland), responsible for the electronics, built APEX.
Some background of the APEX instrument development phases (Ref. 2):
• APEX was initiated by Klaus Itten of RSL following the MAC-Europe (Multi Aircraft Campaign) in 1991
• After several phases of reshaping an instrument proposal, ESA was identified as funding agency (1994)
• Belgium was asked to join in (1996)
• First instrument concept identified (1998)
• Requirements, specifications, feasibility studies (2001)
• Breadboarding activities - detectors, optical parts, (2003)
• Critical Design Review (2006)
• Acceptance flights (2009)
• APEX has been formally accepted by ESA at the end of 2010
• Operations 2011-2016
• During realization of the APEX instrument, it has ‘lost' all its spaceborne missions it was designed to simulate (PRISM, LSPIM, SPECTRA)
• In 2009, APEX is foreseen to simulate ESA's Sentinel missions, and to complement the FLEX (Fluorescent Explorer) technology demonstrator.
It took 15 years from the first ideas to the fully developed the APEX system.
APEX Instrument
APEX is an advanced scientific instrument for the European remote sensing community, recording hyperspectral data in approximately 300 bands in the spectral range between 380 nm and 2500 nm and at a spatial ground resolution of 2-5 m. The instrument is defined as a dispersive pushbroom imaging spectrometer operating in the solar reflected wavelength range. 10)
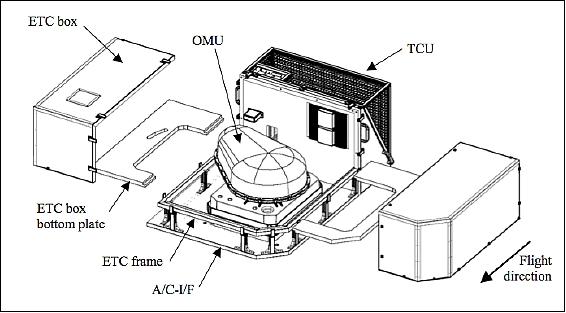
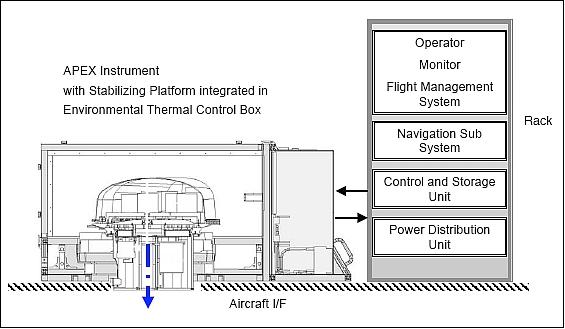
The APEX instrument consists of several sub-units. The OSU (Optical Sub-Unit) is the core element of the instrument including the sensitive optics, properly interfaced with customized FEE (Front-End Electronic) boards. The OSU is operated on a stabilized platform (STP) in order to dampen all the externally induced vibrations and ensure stable vertical measurements. The platform is controlled by the navigation system, which receives orientation information from an IMU (Inertial Measurement Unit) implemented on the OSU and position signals from a GPS receiver.
The orientation and position information are then synchronized with the image data by the CSU (Control and Storage Unit). Each data frame is thus time and day tagged and stored on a hard disk array. This information is finally transferred to the PAF (Processing and Archiving Facility), either over a Gigabit Ethernet or via a storage medium.
The instrument is temperature and pressure stabilized. The OMU (Opto-Mechanical Unit) is enclosed by the ETC (Environmental Thermal Control) box. The TCU (Thermal Control Unit) controls the temperature of the OMU cooling circuits and of the ETC box atmosphere. The SWIR (Short Wavelength Infrared) detector is directly linked with a dedicated cooling system that keeps its temperature at about -100oC, thus drastically reducing the thermal noise.
A custom A/C-I/F (Aircraft Interface) allows the Dornier Do-228 airplane to carry and operate the instrument during the mission phases.
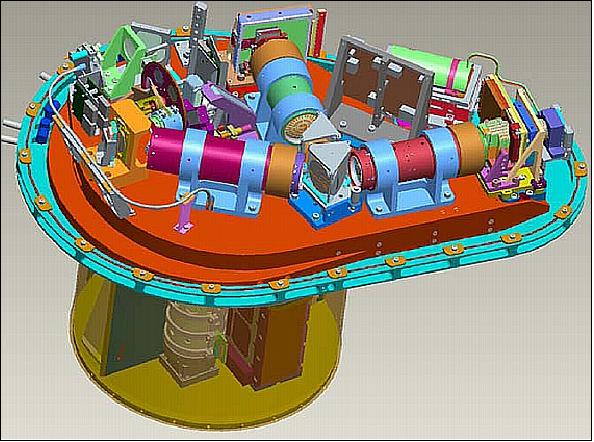
A detailed view of the OSU (Optical Sub-Unit) is provided in Figure 2. This subsystem is composed of the following elements:
- An entrance window, located underneath the folding mirror
- One folding mirror, guiding the entering light towards the ground imager
- A removable polarization scrambler that reduces the polarization sensitivity of the instrument
- A filter wheel, containing a series of neutral density filters in order to avoid saturation and a series of bandpass filters used in connection with the IFC (In-Flight Calibration facility)
- A ground imager that images the ground section on the spectrometer rectangular slit, whose dimensions are 0.04 mm x 40 mm
- A spectrometer section that decomposes the incoming light into its spectral components and re-images the slit image onto two array detectors.
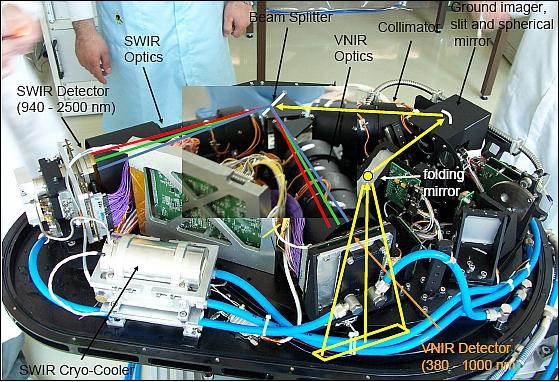
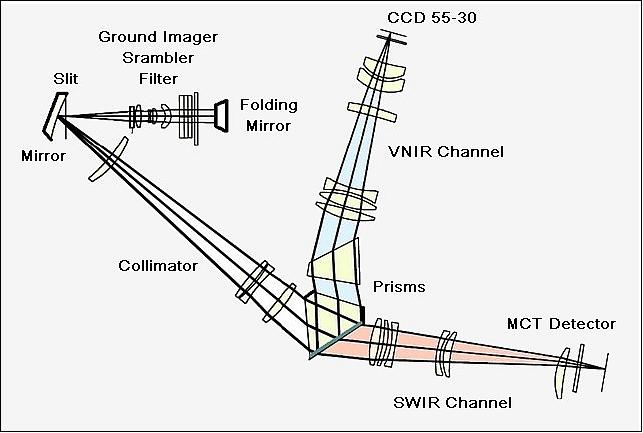
APEX is a dual-prism dispersive pushbroom imaging spectrometer using one ground imager with a slit in its imaging plane (Figure 4). Light enters the spectrometer part through a curved slit and a collimator redirects the light towards a beamsplitter, which separates the VNIR (Visible Near Infrared) wavelengths (380-1000 nm) from the SWIR (Short Wavelength Infrared) wavelengths (940-2,500 nm). The VNIR wavelengths are then dispersed from another face of the beamsplitter/prism and imaged by a CCD (Charged Coupled Device) detector after passing through a customized VNIR optics.
The SWIR wavelengths enter a further prism and are dispersed from a second surface of this prism. A focusing SWIR optic then projects the spectral components onto a CMOS (Complementary Metal Oxide Semiconductor) detector. The VNIR array detector can record up to 334 unbinned bands and SWIR 199 unbinned bands. Customized binning patterns can be applied in order to satisfy specific scientific applications.
One of the main features of APEX is providing spatial synchronization of the VNIR and SWIR images, otherwise offered separately from other sensors. This characteristic led to design the instrument with very stringent requirements in order to offer low data uncertainty. Therefore, the scanner has been optimized for non-uniformities, mainly caused by the intrinsic nature of the acquisition mechanism and by the non-linear nature of the light. In order to allow users implementing hyperspectral-based applications with a satisfactory radiometric resolution, the APEX bands will provide a high SNR (Signal-to-Noise-Ratio) in the range of 100-1000.
Parameter | VNIR (Visible & Near Infrared) | SWIR (Short Wave Infrared) |
Spectral range | 380-970 nm | 940-2500 nm |
Spectral bands | Up to 334 (default = 114) | 199 |
Spectral sampling interval | 0.5-8 nm (default: 11-8 nm) | 10-6 nm |
Spectral resolution (FWHM) | 0.6-6.3 nm | 13.5-7 nm |
Spatial pixels | 1024 | 1024 |
FOV (Field of View) | 28o | |
IFOV (Instantaneous FOV) | 0.028o (0.48 mrad) | |
Spatial sampling interval (cross-track) | 1.75 m @ 3500 m AGL (Above Ground Level) | |
Dynamic range | CCD, 14 bit encoding | CMOS, 13 bit encoding |
Pixel size | 22.5 µm x 22.5 µm | 30 µm x 30 µm |
Smile |
| 0.2 pixel |
Data capacity | 500 GB on SSD | |
Data transfer | Spectral frames: 30 Mbit/s via optical link | |
CTM (Calibration Test Master)
The APEX calibration strategy focuses on the measurement of several calibration and characterization parameters at selected pixels within the detector area. For this purpose, a calibration test master (CTM) is used. The CTM is a hardware/software facility that optimizes the time needed for the calibration by automatic generation of optical stimuli. Thus no manual action is required, apart from some secondary settings, e.g. switching on/off the light sources. The CTM interfaces APEX with both a laboratory ground facility, i.e. the CHB (Calibration Home Base) in Oberpfaffenhofen (Germany), and an IFC (In-Flight Calibration facility). The instrumentation in both the CHB and the IFC can be controlled remotely via a computer interface, thus enabling automatic measurements. 11) 12)
The CTM consists of three main elements:
- The controller, which is the core unit of the CTM
- The CSU (Control and Storage Unit), which is partly embedded in APEX and partly located on an external desktop computer
- The processor, whose function is to process all the calibration data.
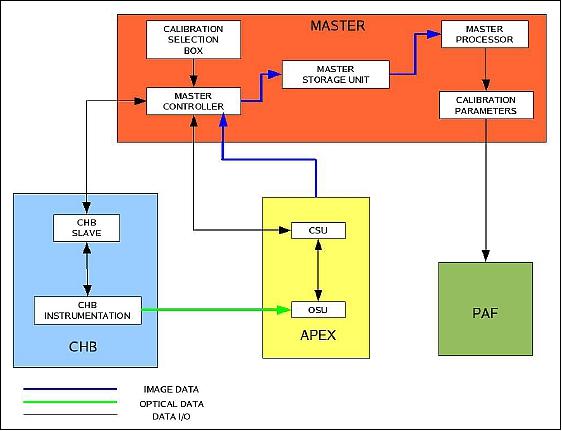
The CTM controller is embedded in the APEX instrument and sets up all the necessary parameters, i.e. APEX settings (e.g. frame rate, integration time) and calibration facility settings (e.g. monochromator wavelength, integrating sphere lamp intensity) for a particular calibration procedure. Once the setting is completed, the calibration measurements take place and the acquired data are stored in the storage unit.
The CTM processor is a complementary software utility, installed on dedicated external hardware, whose goal is to generate the calibration parameters necessary to calibrate the acquired raw data by processing all the data in the CTM storage unit. The PAF (Processing and Archiving Facility) utilizes the calibration parameters provided by the CTM for the level-0 to level-1 processing.
For automated procedures a certain number of sequential sub-requests for both the CHB (e.g. folding mirror height, scan angle, lamp voltage, etc.) and APEX are generated. For each subrequest to be processed by the hardware the controller generates a well-formatted file, which in turn will be transformed into an electric and/or mechanic signal. The measurements are carried out once the sub-requests have been executed by the relevant hardware. The time needed to process every sub-request has been estimated to be about 5 s but this can be reduced if no drastic changes on the setup are needed. The overall calibration phase therefore requires about one week time.
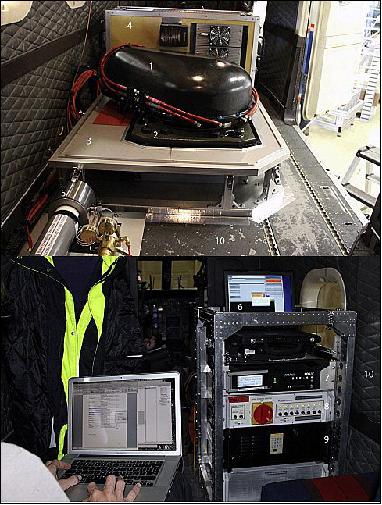
Legend to Figure 7: 1 APEX instrument, 2 stabilizing platform, 3 interface plate, 4 thermal control unit, 5 nitrogen supply, 6 flight management computer, 7 inertial navigation system and GPS, 8 power distribution, 9 central storage unit, 10 aircraft bay.
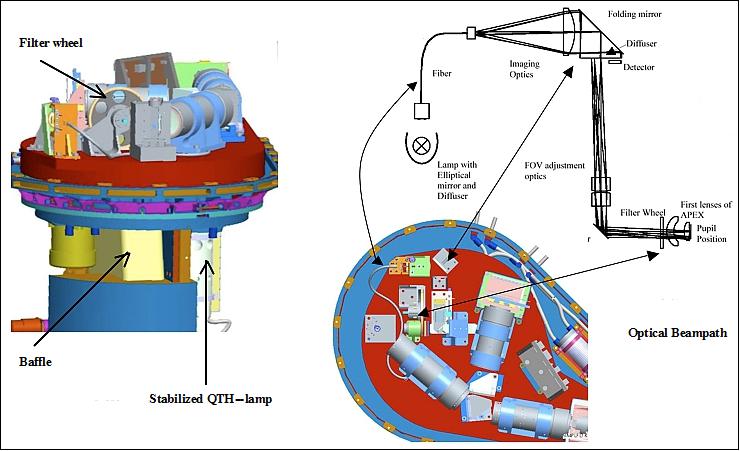
IFC (In-Flight Calibration Facility)
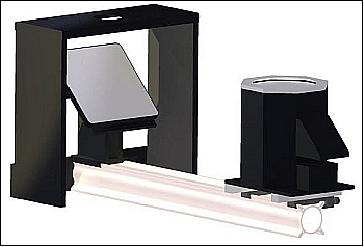
IFC is an integral part of the spectrometer. A mirror is being shifted in the optical path to reflect the light of the internal stabilized QTH (Quartz Tungsten Halogen) lamp / integrating sphere combination using a filter wheel, a fiber bundle and a diffuser. This setup is being used just before and after a regular data take in the form of a secondary calibration standard (Ref. 1).
Comparing IFC measurements taken in-flight with IFC measurements taken in the laboratory will allow assessing the stability of the instrument. If changes are such that the best detector performance cannot be guaranteed, the operational phase has to be terminated and APEX has to return to the laboratory for a fresh characterization and calibration, or to the manufacturer for an eventual upgrade of the instrument. - During IFC measurements a mirror will be moved into the optical path to reflect the light of the internal stabilized QTH (Quartz Tungsten Halogen) lamp through filter wheel openings into the APEX spectrometer.
Five different filters are mounted on the rotating filter wheel (Figure 8): a filter doped with rare earth material, three bandpass filters with small spectral bandwidths (at 694, 1,000 and 2,218 nm, respectively) and a NG4 attenuation filter used to avoid detector saturation at maximum radiance level in the VNIR channel. The sixth position on the filter-wheel is left empty with no filter inserted. The rare earth material filter from the US NIST (National Institute of Standards and Technology) will be used to determine APEX spectral stability, i.e. to trace any shifts in center-wavelength position of the bands.
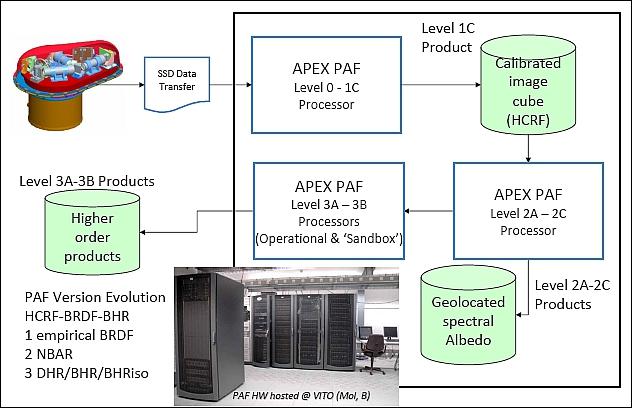
PAF (Processing and Archiving Facility)
The APEX PAF is hosted by VITO in the AOC (APEX Operations Center) in Mol, Belgium. The PAF is defined as the combination of all hardware and software components and their interfaces required for handling and processing APEX imagery and its related data.
A specific level 0-1 processing software module producing uniform, radiometrically calibrated data has been developed by RSL and is integrated into the PAF by VITO. An APEX CBC (Calibration Home Base) has been developed at DLR and serves as generic institution for the calibration of imaging spectrometers. Since special emphasis is on delivering reliable, well calibrated data, an in-flight calibration tool in form of a diffuser disk and specific absorption filters are used to monitor the stability of the APEX system. 13) 14) 15)
Scientific data products (Ref. 1):
After the Level 0-1 processing of APEX data, well-calibrated at-sensor radiance data, scaled to a 16-bit format are available. At this stage, three options are distinguished, based on their respective levels of uniformity.
1) Non-uniform data (Level 1A): these data are containing the originally measured radiometrically calibrated data, without any corrections for smile and frown or co-registration. As such, no interpolation has been performed on the data except for bad pixel replacement. The data are of interest for highest resolution applications such as atmospheric sensing in the VNIR spectral range.
2) Partially-uniform data (Level 1B): the specified quality of the APEX system defines small deviations regarding optical aberrations within each detector (i.e. below 0.2 pixels). When correcting for these smile and frown effects only, a set of detector-wise uniform data may be produced. Such data sets are well suited for applications making use of the spectral range of one detector only, e.g., geological applications in the SWIR or limnological applications in the VNIR.
3) Fully-uniform data (Level 1C): co-registration (i.e. synchronization) between the detectors is expected to be better than one pixel offset. Therefore, the creation of a fully uniform data set is feasible by interpolation of the SWIR detector outputs onto the spatial response of the (uniformized) VNIR detector. A spectral cut-off limit is defined between the detectors, in order to produce a contiguous spectrum across both detectors after interpolation. This level is expected to be the normal, and most requested output of the APEX calibration chain.
The Level 1 products are accompanied by geometric information, i.e., an index, which defines the orthometric locations of each pixel, which is produced on the basis of a DEM (Digital Elevation Model). In Level 1A, the index will refer to the reference centers of the pixels, in Level 1B, two indices will be required for the two detectors, respectively. The combination of Level 1 products with the geometric information leads to three kinds of Level 2A radiance products.
APEX Flight Campaigns
APEX was intensively tested with multiple test flights over Switzerland, Germany and Belgium and with pre- and after flight CHB (Calibration Home Base) campaigns in October 2008 and in June 2009. The Swiss and Belgian targets areas were selected in order to cover a variety of possible scientific applications. Flight lines have been executed over forests, crops, inland water, urban and coastal areas ito derive a wide spectrum of products of interest. Vicarious calibration campaign with extensive ground truth measurements has been carried out for all flight lines. 16) 17) 18)
• APEX has been installed on a Do-228 aircraft of DLR, Oberpfaffenhofen, Germany. The first test flight has been performed on October 31, 2008 over Wittenberge (Germany), acquiring 13 flight lines.
• The next APEX campaign on the DO-228-212 is planned for June 2010. 19)
• APEX announcements of opportunity (through VITO) starting in 2010
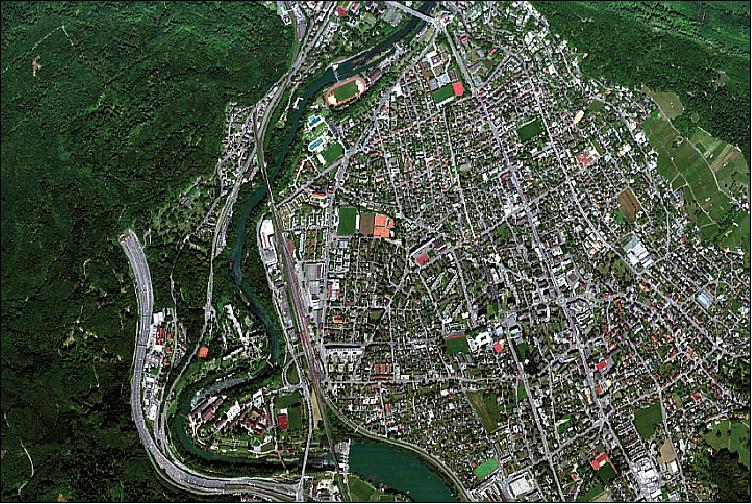
• OSD (Open Science Data Set): The APEX OSD was acquired during an APEX flight campaign in June 2011. APEX was mounted on a Dornier (DO-228) research aircraft operated by Flight Operation and Acquisition of DLR. Data were acquired on a clear day from a flight altitude of 4600 m above sea level with a heading of 56o in the vicinity of Baden, Switzerland. Data were recorded by a standard procedure with an integration time of 22 ms, involving dark current (DC) measurements at the start and end of each flight line (FLn) as shown in Figure 10. OSD serves as demonstrator for the current status of APEX. 20)
RAW to Level 1 processing: The OSD data were processed from RAW to Level1 in the dedicated APEX PAF (Processing and Archiving Facility). Level 1 processing comprised the radiometric, geometric and spectral calibration, relying on APEX calibration information generated during extensive system calibration at the CHB (Calibration Home Base) located at DLR Oberpfaffenhofen. The raw calibration data are entered into the APEX Calibration Information System (CALIS), essentially being a database system with intelligent processing and visualization interfaces. The APEX CALIS produces the calibration cubes, containing calibration coefficients for each single spectral/spatial pixel of the system. These cubes are then utilized within the APEX PAF to convert digital numbers to at sensor radiances.
The APEX system is fully operational since 2011 and ready to provide well-calibrated data as standard processing output of the APEX PAF and the VITO CDPC to the user community. 21) 22) 23) 24) 25)
APEX Advanced Radiometry Measurements
Following acceptance testing in 2009, APEX was transferred to the University of Zurich and VITO in spring 2010 for regular operations. Since summer 2010, APEX is producing science grade spectrometry measurements and has acquired > 3 TB of data corresponding to > 3 million scan-lines (approx. 30,000 km2) and several factors more in calibration and product data until the end of 2013. APEX has received airworthiness certification for two of DLR's research aircraft (Dornier DO-228-101 (D-CODE), Dornier DO-228-212 (D-CFFU)) with VITO and the University of Zurich providing instrument operators for data flights. In parallel, updates to the instrument, CHB, and PAF have been made to further improve the instruments measurements.
Table 3 summarizes the initial specifications used to design the instrument and list validated performances for all specifications.
Parameter | Specification | Performance |
FOV (Field of View) | ± 14 to ± 20o | 28.10o (± 14.05o) |
IFOV (Instantaneous Field of View) | 0.0275 to 0.0401o | 0.028o |
Flight altitude | 4,000–10,000 m above sea level | Onboard DO-228-101: 60–7620 m a.s.l. |
Spectral channels | VNIR: approx. 140 | VNIR: max. 334; nominal 114 |
Spectral range | 400–2500 nm | 372–2540 nm |
Spectral sampling interval | 400–1050 nm: < 5 nm, | 0.45–7.5 nm |
Spectral sampling width | < 1.5 x Spectral sampling interval | VNIR: 0.86–15 nm |
Center wavelength accuracy | < 0.2 nm | After laboratory calibration: < 0.1 nm |
SNR (Signal to Noise Ratio) | None specified | 625 (average of a 50% reflecting target, sun zenith at 24.4o) |
NEDR (Noise Equivalent Delta Radiance) | None specified | 0.1 mW/m2/sr/nm |
PSF (Point Spread Function) | ?1.75 x Sampling interval | < 1.5 x Sampling interval |
Smile | < 0.2 pixel | < 0.16 pixel for 90% of all pixels |
Frown (Keystone) | < 0.16 pixel | < 0.16 pixel for 80% of all pixels |
Co-registration | < 0.16 pixel | Average < 0.55 pixel |
Bad pixels | VNIR: clusters of bad pixels < 3 | VNIR: no bad pixels |
Scanning mechanism | Pushbroom | Pushbroom |
Absolute radiometric calibration uncertainty | ?2% | VNIR: 372–1015 nm: 4.2% |
Storage capacity on board (online/offline) | > 60 GB/> 150 GB | 500 GB on SSD |
Dynamic range | 12 to 16 bit | VNIR: 14 bit |
Positional knowledge | 20% of the ground sampling distance | 50% of ground sampling distance |
Attitude knowledge | 20% of IFOV | After boresight calibration: better than 5 pixels (<< 1% of FOV) |
Navigation system, flight line repeatability | ± 5% of FOV | After 3 years of operation: <50 pixels (<±2.5% of FOV) |
Positional and attitude data | Recording of data onto a housekeeping channel | Fully implemented and operational |
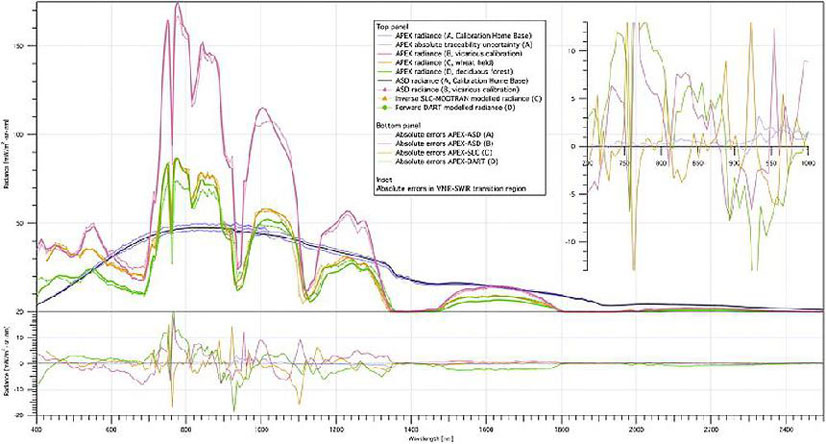
APEX radiometric performance is validated using a four-fold approach. Following calibration in the CHB, APEX is calibrated traceable to a primary calibration standard with less than 4% uncertainty (Figure 13A). Second, APEX is calibrated using radiance based vicarious calibration approaches with in-situ measurements performed using a field spectroradiometer (ASD FieldSpec Pro FR) and a sunphotometer (Figure 13B). Uncertainties are in the range of ? 6.5%, but lower spectral resolution of the field spectroradiometer as compared to APEX are limiting the calibration effort. Also with a spatial resolution of 1–2 m, identifying homogeneous areas on ground is very challenging. At this spatial scale, sports fields, concrete or other artificial targets are usually not homogeneous enough to serve as calibration surfaces. Therefore, validation efforts are also put in place using spatially distributed data and inverse (Figure 13C) as well as forward (Figure 13D) modeling approaches. The latter two still show deviations from the APEX measurements, largely due to simplified model approaches.
APEX Earth Science Applications Development
APEX Earth science applications span a wide range of products. While calibrated radiances are a standard product for many science grade instruments, we have developed individual and joint approaches for atmospheric correction and allowing minimizing the impact of surface anisotropy effects. These products are of high operational use, since increasingly well corrected surface reflectance data are required form a more operational or stakeholder oriented user community. However, a complete physically based surface anisotropy correction remains challenging. Instruments like APEX are limited in angular data acquisition as well as by having a relatively small FOV. Additional efforts are needed to constrain the BRDF correction, likely with the support of a priori information.
A second class of Earth science applications is reported, namely retrieving information from the atmosphere (VCD of NO2 as well as AOD), and deriving the concept of critical surface albedo, allowing to decouple atmospheric and land surface based products, further increasing the retrieval quality of the atmospheric products. Columnar retrievals of NO2 using airborne instruments cannot be compared with in-situ point measuring networks. However, current existing in situ measurements can be complemented by columnar NO2 information, allowing policy validation with a higher level of process understanding in the coupled surface–atmosphere system. Finally , AOD retrievals are optimized using simplified approaches, carefully balancing retrieval accuracy and computational requirements. The AOD information can be later used as prior information in an atmospheric compensation procedure in an iterative fashion.
Many of the current retrieval schemes used in spectroscopy rely on retrieving surface reflectance and subsequently infer biochemical or biophysical information. We demonstrate with APEX a new retrieval scheme by coupling a canopy–atmosphere model and invert the coupled model. This allows us to avoid two separate steps of atmospheric correction and invoking an inverse canopy model in a second step. The coupled model approach clearly shows advantages by minimizing interfacing complexity between these two models at the cost of increased inversion complexity. The particular model combination (SLC and MODTRAN) shows excellent performance in vegetation corresponding closest turbid media scattering, which is the physical foundation of the SLC model. Validation of this process is performed using a radiance based vicarious calibration procedure, ensuring consistency when comparing in-situ and airborne measurements.
Finally, simultaneous fluorescence line depth (FLD) and pigment retrieval approaches to APEX data were applied (Figure 6). Vegetation fluorescence (Fs) is derived using the constrained 3FLD approach. Because of a very low Fs signal, residual along-track striping is still visible in the APEX data. Fs values range between 0 to 10 mW m- 2 nm- 1 sr-1. Simultaneous field validation using a field spectroradiometer (ASD FieldSpec FR Pro) is carried out. A spectral deconvolution approach is used to minimize Fs retrieval differences between APEX and the field spectroradiometer measurements. In situ data were collected using a stratified random sampling approach while measuring reflected and emitted radiances at each calibration point (n = 16), resulting in a good agreement between airborne and in situ Fs (R2 = 0.87, relative RMSE = 27.76%). Spatial distribution of Fs, such as measured with APEX, can serve as proxy for instantaneous plant photosynthesis. Pigments are derived in relative units and visual validation suggests feasibility of the method. Measurements of pigments in leaves are well understood, however their validation using leaf pigment concentrations is ongoing, and leaf models including separate representation of these pigments and plant structure are sparse and not applied in an inverse fashion to remotely sensed data as of yet. Relative pigment abundances will support improved plant functioning and estimates of light use efficiency. Also they represent an important functional trait per se.
![Figure 14: Left: Fs retrieval following Damm et al. (2014) in absolute units [0–10 mW m-2 nm-1 sr-1, black–white]. Right: Pigment content retrieval following Gitelson et al. (2006) in relative units [0–100%]. Pigment abundances are red: carotenoids, green: chlorophyll-a and blue: anthocyanin (APEX data June 16, 2012; 10:48 UTC; Oensingen, Fluxnet site 314; 47.2863oN, 7.7343oE, Switzerland), image credit: APEX consortium (Ref. 10)](/api/cms/documents/163813/1581647/APEX_AutoB.jpeg)
Conclusions and Outlook
(Ref. 10)
The latest status of APEX with focus on advanced radiometry measurements and Earth science applications is reported. APEX has undergone a complete development cycle, ranging from modeling system specifications to analyzing APEX data in a coherent fashion. Following the start of the operational activities of APEX in 2010, small improvements were made to the hardware (more reliable electronics boards, update of storage capacity, etc.), and major improvements to sensor modeling, refinement of the PAF and development of science grade retrieval algorithms. APEX has very high compliance with its initial specifications (though not in all parts), and currently allows operational data acquisition of traceable radiometric measurements and production of Earth science applications.
The APEX instrument has demonstrated to deliver traceable spectroradiometric measurements. The PAF processes data using the latest calibration information, individually optimized for each single scene. This results in scene-specific band positions. While this is no threat to individually analyzing scenes, most of the commercially available software does not support convolution techniques ‘on-the-fly', putting a de-convolution/convolution effort on those users using multiple scenes for their analysis. Controversial discussions are ongoing, if APEX band settings should be resampled to a ‘common band set', or leaving the original measurements unaltered. Currently, the latter is the case.
APEX was designed using a robust approach to sensor modeling. Even though the instrument model was updated on a regular basis, a key challenge remains to develop a sensor independent model, allowing for forward and inverse modeling approaches. Currently, the APEX PAF contains substantial APEX specific correction algorithms, being inherent to the functioning and performance of this specific instrument. A more generic and generally applicable instrument and application model would serve all of the spectroscopy community much better, allowing for instrument and product cross-comparison in a much more coherent fashion.
While APEX, with its very high spectral resolution, is capable of simulating existing and future missions at very high accuracy, it can also be used to ensure consistency of indices-based approaches. Many of the existing narrow- (and broad-) band indices are developed using a specific instrument. High spectral resolution instruments can easily be convolved to fit original band settings, but can in addition be used as a model intermediate to ensure continuity and uncertainty estimates of different instruments in combination with in situ measurements. Availability of spatial and temporal discontinuous data of high spectral resolution is of key importance to fulfilling this goal.
APEX product development has shown key important development of band-specific products for advanced indices and combined indices for simultaneous retrieval of regional scale pigments and chlorophyll fluorescence. Equally, it was shown that inversion of coupled models substantially profit from high dimensional spectral data. Other, emerging applications using APEX will further demonstrate the usefulness of high dimensional data for applications. Key to all approaches is a continuing requirement for higher spectral resolution instruments with higher SNR and therefore higher dimensionality. This will further foster the development of new models or retrieval algorithms—both empirical and physical—allowing a new generation of spectroscopy instruments and science professionals to be trained and developing new ideas.
CHB (Calibration Home Base)
The Calibration Home Base (CHB) is an optical laboratory of the German Aerospace Center (DLR) in Oberpfaffenhofen for the calibration of airborne hyperspectral sensors and field spectrometers. It is a unique facility in Europe for precise characterization of the radiometric, geometric and spectral properties of bulky and heavy instruments up to 500 kg (including mechanical interface) in a wide spectral range from 380 nm to 14 µm. 26) 27)
The CHB for APEX at DLR was funded by ESA. The CHB provides all hard- and software tools required for radiometric, spectral and geometric on-ground characterization and calibration of the instrument and its internal references and on-board attachments, and to perform measurements on polarization- and straylight-sensitivity. This includes a test bed and the provision of the infrastructure. 28) 29) 30)
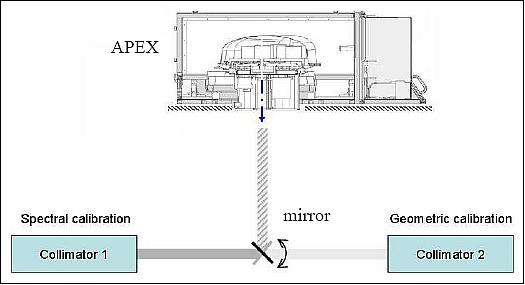
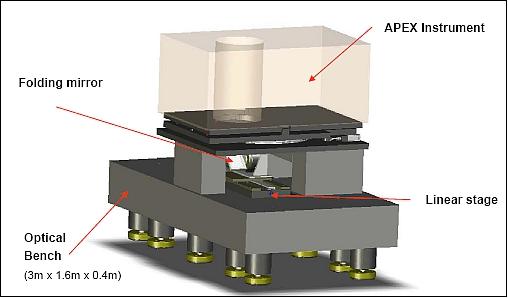
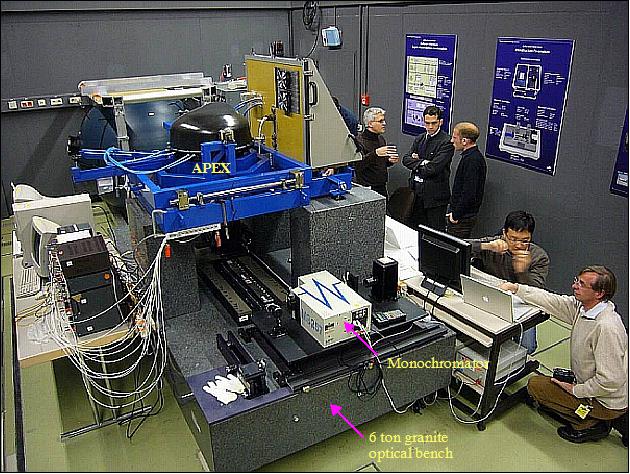
The quintessence of the new APEX CHB is a calibration bench hosting the equipment for the spatial and spectral calibration of the instrument. Therefore a new concept was decided where the sensor and the calibration equipment are fixed. This concept is based on a German patent of the DLR (DE 102 18 947 A 1). The folding mirror concept offers the possibility of using two different collimators (Figure 15), to facilitate sequential directing of the optical stimuli, providing sources for the spectral and spatial calibration tasks. The key element of the concept is the device for moving and flipping the folding mirror between the collimators. As the actual position and direction of the reflected beam depends on the translatory and angular position of the mirror, the accurate synchronization of both actuators is computer controlled and the position provided by very accurate sensors.
The entire mechanical configuration makes use of highly stable design, comprising a rigid granite optical bench, a vibrationally isolated foundation (seismic block) and a linear - and tiltable mirror positioned by means of special air bearings. This is necessary to achieve a high positioning accuracy on the order of a few µm and angular orientation accuracy on the order of a few arcseconds.
CHB Calibration Concept
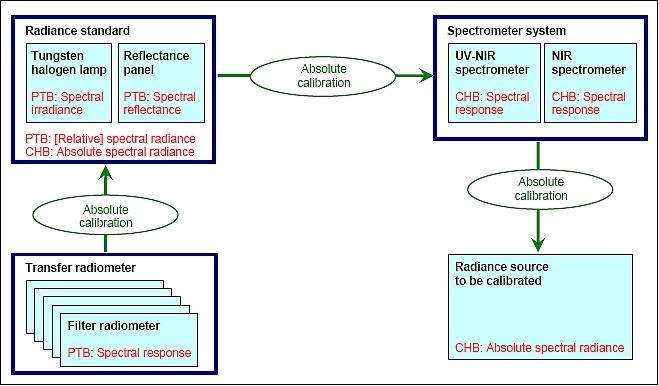
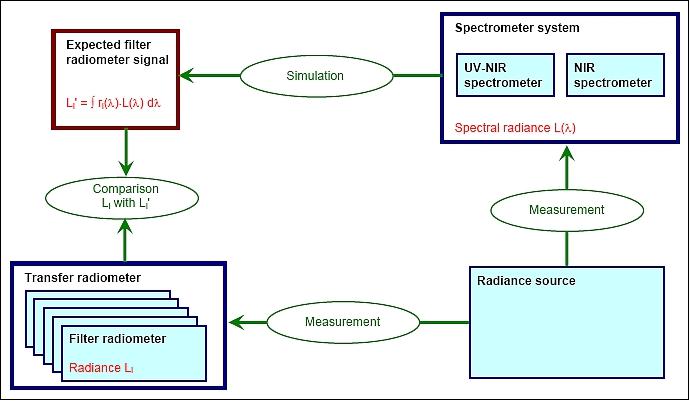
Radiometric calibration of radiance sources in the CHB will be based in the future on three hardware systems: a spectrometer system, a radiance standard, and a transfer radiometer. The concept is illustrated in Figure 19 (Ref. 26), Ref. 27).
Individual hardware components are shown as blue boxes. Bold blue frames mark systems consisting of several components. Red text notes the physical quantity to be calibrated and the laboratory performing calibration. The sequence of procedures is shown in green.
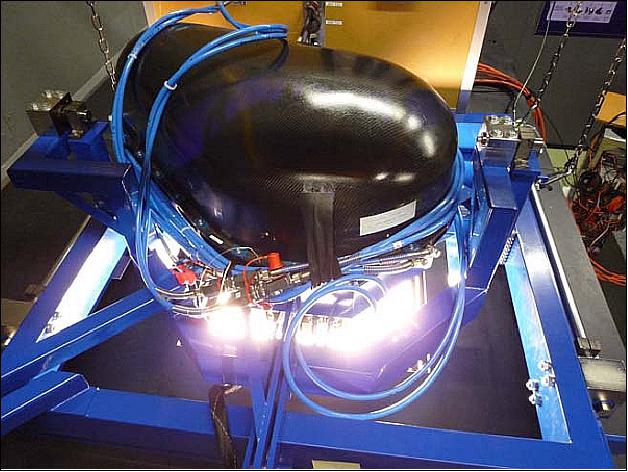
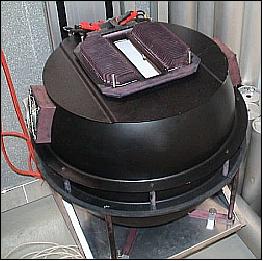
Small integrating sphere: Absolute radiometric calibration of sensors at CHB is currently (2009/10) based on an integrating sphere which is illuminated from the interior by four QTH lamps. The sphere (Figure 20) has a diameter of 50 cm and an exit port size of 20 cm x 4 cm. In November 2007 PTB calibrated the radiance spectrum in the spectral range of 350–2500 nm and characterized the homogeneity across the aperture. Long-term variations are so far monitored by measuring the radiance spectrum after warm-up, using a ZEISS MCS 501 UV-NIR spectrometer in the range of 450–950 nm and comparing it with the initial measurement after calibration. The new concept (Figure 19) replaces the ZEISS spectrometer by a transfer radiometer, and it allows re-calibration of the spectral radiance at each usage of the sphere instead of monitoring only.
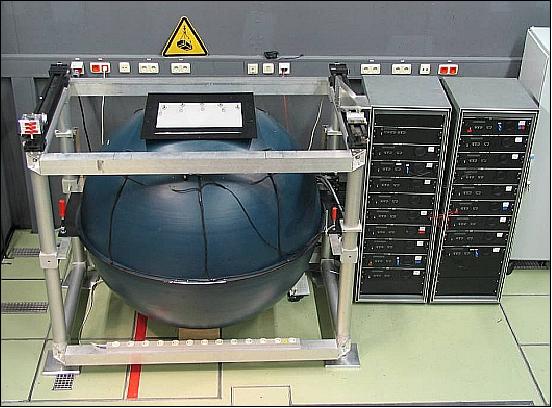
Large integrating sphere: A large integrating sphere (165 cm diameter, Figure 21) is available at CHB for radiometric characterization of instruments with a large field of view. It is illuminated from the interior by 18 stabilized lamps and provides a homogeneous radiance for an area of 55 cm x 40 cm (variations <0.5 % rms). The radiant exitance can be changed from 57 to 1524 W m-2 to adjust the brightness to instrument sensitivity and to measure the detector linearity. A photodiode inside the sphere monitors intensity changes.
The spectral radiance has been measured for 12 lamp combinations using a field spectrometer (ASD FieldSpec® FR). However, the accuracy of the spectrometer calibration is not really known; hence, the uncertainty of the measurements is unknown, i.e. the spectra are not traceable to SI units. For this reason, the sphere was used so far only for relative measurements. It is planned to perform reliable absolute radiometric calibration using the concept shown in Figure 19.
Radiance standard: The future radiation reference source will be a combination of reflectance panel and an FEL-type lamp (1000 W). This new radiance standard of CHB consists of two calibrated components: a tungsten-halogen lamp and a reflectance panel. These components are shown in Figure 22.
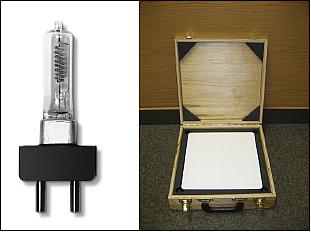
The tungsten-halogen lamp is of type 1000 W FEL (Gamma Scientific Model 5000-16C, serial number GS1032), which is widely used as an irradiance standard. An identical calibrated lamp is available as backup (serial number GS1033). The lamp is mounted in a lamp holder and powered by a highly stable power supply (Gamma Scientific Model 5000-2C). Lamp and lamp holder are installed inside a lamp housing, which is mounted on an optical bench. The reflectance panel (Labsphere SRT-99-100, serial number OD65B-7257) has a size of 25 cm x 25 cm. It is mounted at an angle of 45o on the bench, facing towards the opening of the lamp housing (Figure 23). The distance of 50 cm is measured accurately by mounting temporarily a lamp alignment jig instead of the lamp.
The calibration of the radiance standard is currently traceable to the National Institute of Standards and Technology (NIST). Irradiance of the tungsten-halogen lamps was calibrated by Gamma Scientific on 16 October 2009 for the spectral range of 250–1100 nm in steps of 5 nm. Reflectance of the panel was calibrated by Labsphere on 24 August 2009 for the range of 250–2500 nm in 50 nm intervals. It is planned to repeat these measurements in 2010 at PTB for the range 350–2500 nm, and to calibrate additionally the radiance of the complete setup at PTB.
Note: PTB (Physikalisch-Technische Bundesanstalt), Braunschweig, Germany, since 1887. PTB is the German national metrology institute (timekeeper) providing scientific and technical services (German equivalent of NIST).
Spectrometer system: A calibrated spectrometer system consisting of a UV-NIR and a NIR spectrometer will be used to measure the spectral radiance of the source. The quality of a measurement is described by two wavelength dependent parameters: spectral resolution and uncertainty. The first is a fixed instrument property, the second depends on instrument stability and calibration errors, which are mainly caused by stray light and detector non-linearity.
The current baseline is to use the ZEISS as UV-NIR spectrometer due to its high spectral resolution, and either the ASD or the SVC as NIR spectrometer (the more accurate one). Since the NIR instrument covers also the spectral range of the UV-NIR instrument, the overlapping region can be used to determine measurement errors.
Transfer radiometer: A transfer radiometer consisting of five filter radiometers will be used to improve absolute calibration of the radiance standard (Figure 19) and to determine the absolute error of radiometric measurements of a radiance source (Figure 24). Hence absolute accuracy of radiometric calibration in the CHB will be based in the future on the stability of the transfer radiometer. Until now it was based on the stability of the radiance of the small integrating sphere.
The new concept is based on the stability of detectors, which is expected to be < 0.5 % for each filter radiometer. Furthermore, it uses redundant hardware components (more detectors than necessary, two spectrometers with large spectral overlap) and redundant calibration of the radiance standard (lamp and reflectance panel are calibrated additionally to the complete system). These redundancies allow to identify erroneous hardware components and to reduce the uncertainty of calibration.
Under these conditions a significant improvement of accuracy seems feasible compared to the current set-up. A cooperation agreement was negotiated with PTB in order to achieve state-of-the-art calibration accuracy. The goal is to characterize spectral radiance of sources in the CHB at an expanded uncertainty (k=2) of 3 % for the range of 350–1700 nm until end 2010, and 5 % for the range of 1700–2500 nm until 2012. Such accuracy of the long-wave range is currently not feasible, even at PTB.
RASTA (Radiance Standard)
The New Traceable Radiance Standard of DLR.
So far (up to the end of 2011), absolute radiometric calibration was performed using an integrating sphere that is traceable to SI units through calibration at the German Metrology Institute PTB. However, the stability of the radiance output is not monitored regularly and reliably since the small size (diameter 50 cm, exit port 20 cm x 4 cm) and the design make it difficult to install a device at a reproducible position which is suited to measure accurately changes of the spectral radiance.
To fulfil the radiometric traceability requirements for the CHB, DLR has developed and constructed a novel type of spectral radiance transfer standard, RASTA, operating in the spectral range from 350 - 2500 nm. The RASTA consists basically of two elements: a 1000 W FEL type quartz halogen lamp and a Spectralon® diffuse reflection standard aligned in a well defined geometry. 31)
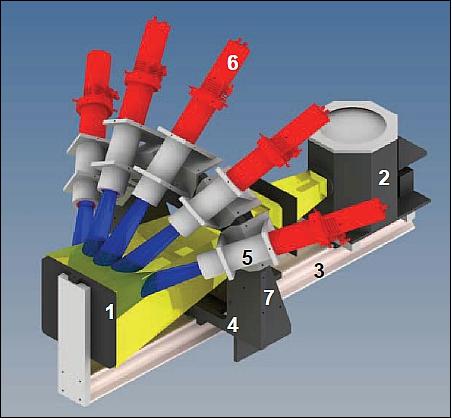
Legend to Figure 25: (1) reflectance panel, (2) lamp housing, (3) bar, (4) mounting adapter for measuring devices, (5) mounting adapter for radiometer, (6) radiometer, (7) space to mount additional sensor. Yellow: beam illuminating reflectance panel; blue: field of view of radiometer.
The mechanical configuration of RASTA is shown in Figure 25. A 1000 W FEL tungsten-halogen lamp (Gamma Scientific Model 5000-16C) serves as light source, which is widely used as an irradiance standard. It illuminates a reflectance panel perpendicularly with the dimension 25 cm x 25 cm (1). In order to minimize stray light contamination, the lamp is installed inside a lamp housing (2). The lamp housing is mounted moveably on a bar (3) to adjust the distance between lamp and reflectance panel. The distance can be measured accurately by mounting temporarily a lamp alignment jig instead of the lamp. A mounting adapter for measurement devices (4) is installed in front of the reflectance panel. It provides space for seven instruments arranged on a half circle around the optical axis, which is the line perpendicular to the panel center.
This setup allows all instruments to look at the panel at the same spot from the same distance and in the same angle of 45° to avoid differences in the radiance caused by spatial inhomogeneities. Five of the adapter spaces are used for radiometers (5,6) which monitor the stability of the system. The two horizontal spaces left and right of the panel (7) can be used for additional sensors, e.g., spectrometers which shall be calibrated. For radiometric calibration of large sensors, these can be placed besides the system using separate mounts.
RASTA has the following advantages compared to the previously used integrating sphere:
1) Monitoring and correction of radiance changes: The five radiometers form a redundant system to measure changes of the spectral radiance. Such changes are usually caused by aging of the lamp or contamination of the reflectance panel. Since the two causes have different wavelength dependency, they can be identified. If panel reflectivity has changed, the panel's reflectance spectrum has to be measured again. If the lamp irradiance has changed, the actual radiance spectrum can be determined since changes of the lamp irradiance are associated with changes of the lamp filament temperature. According to Planck's law, the irradiance changes (intensity and spectral shape) are determined by a single parameter (temperature), i.e. the five filter radiometers provide five-fold redundancy for measuring the irradiance changes.
2) Redundant calibration: Additionally to the radiance of the complete system, also lamp irradiance and panel reflectance have been calibrated at PTB. This redundancy allows to detect errors and reduces calibration uncertainty.
3) Size and shape: The reflectance panel has an area of 25 cm x 25 cm, while the exit port of the integrating sphere is 20 cm x 4 cm. The increased size makes the new source more useful for sensors with large field of view, and the square shape allows to illuminate symmetrically the entrance aperture of sensors with circular field of view like field spectrometers and cameras.
4) Flexible radiometry: Radiance sources of different intensity and spectral shape can be realized easily by exchanging the reflectance panel.
5) Reduced complexity: The radiance reflected from a panel that is illuminated by a single lamp can be calculated easily, while the radiance emitted from the sphere is difficult to model since neither the coating nor the lamps can be characterized if the sphere is not disassembled. The sphere is frequently used in combination with filters; however, these reflect some radiation back into the sphere, and the induced changes of sphere brightness are difficult to estimate. Modifications of the new source can be modeled easier, e.g. exchange of lamp or panel.
6) Maintenance: Re-calibration of a radiance source is necessary when its spectral radiance differs significantly from that during calibration. The main cause for changes are the lamps. Since RASTA uses a single lamp while the integrating sphere uses four, the probability of lamp failure is reduced and hence the interval of lamp exchange. Because a calibrated lamp is available as backup, it can be installed any time, eliminating periods of non-availability. Since the spectral radiance can be calculated using the irradiance of the lamp and the reflectance of the panel, only new components need to be calibrated, but not the entire system. The setup of Figure 25 allows further to calibrate the spectral irradiance of spare lamps by attaching the transfer spectrometer on the mounting adapter.
Stability is monitored using five radiometers which cover the wavelength range from 350 to 2500 nm. These highly stable detectors (Gamma Scientific series TIA-3000) with a large dynamic range of 8 decades, have been developed by Gamma Scientific in cooperation with NIST for the purpose to perform SI traceable radiometric calibration at high accuracy. Three of the radiometers use silicon detectors and optical filters to define the wavelength range (ranges: 320-500 nm, 450-650 nm, 650-1050 nm), another one is an InGaAs detector (range: 850–1700 nm), still a further one is an Extended Range InGaAs detector (range: 850–2500 nm).
RASTA has been calibrated at PTB in November 2011 in the wavelength range from 350 to 2500 nm. The expanded uncertainty (k=2) is below 1.7 % in the range 525 - 1700 nm and increases steadily towards shorter and longer wavelengths (3.4 % at 350 nm, 15 % at 2500 nm). The system is applied primarily for the radiometric calibration of spectrometers. One of these (SVC HR-1024) is used as transfer spectrometer to calibrate radiance sources operated in the CHB. By calibrating the transfer spectrometer shortly before usage and using the radiometers as independent detectors, the radiance spectrum of unknown sources can be measured at an uncertainty that is only slightly higher than that of RASTA.
References
1) Klaus I. Itten, Francesco Dell'Endice, Andreas Hueni, Mathias Kneubühler, Daniel Schläpfer, Daniel Odermatt, Felix Seidel , Silvia Huber, Jürg Schopfer, Tobias Kellenberger, Yves Bühler, Petra D'Odorico, Jens Nieke, Edoardo Alberti, Koen Meuleman, "APEX - the Hyperspectral ESA Airborne Prism Experiment," Sensors, Vol. 8, Issue 19, Oct. 2008, pp. 6235-6259; DOI: 10.3390/s8106235, URL: http://www.mdpi.com/1424-8220/8/10/6235/pdf
2) Michael Schaepman, Edoardo Alberti, Francesco Dell'Endice, Petra D'Odorico, Andreas Hüni, Klaus Itten, Koen Meuleman, Bart Bomans, Daniel Schläpfer , Gerd Ulbrich, "APEX Airborne Prism Experiment," Second HyspIRI NASA Decadal Survey Mission Science Workshop, Pasadena, CA, USA, Aug. 11-13, 2009,
4) Klaus I. Itten, "The Emergence of Imaging Spectrometry in Europe," 6th EARSeL Workshop on Imaging Spectroscopy, Tel-Aviv, Israel, March 16-19, 2009, URL: http://www.earsel.org/workshops/IS_Tel-Aviv_2009/PDF/earsel-PROCEEDINGS/3019%20Itten.pdf
5) Walter Debruyn, Ils Reusen, Pieter Kempeneers, Bart Deronde, "The Airborne Imaging Spectrometer APEX (Airborne Prism EXperiment) : Overview and Status Questions," EARSeL Workshop on Remote Sensing for Developing Countries, Cairo, Egypt, Sept. 26-29, 2004 URL: http://publications.vgt.vito.be/documents/WD/apex-gent-v3.pdf
6) J. Nieke, K. I. Itten, J. W. Kaiser, D. Schläpfer, J. Brazile, W. Debruyn, K. Meuleman, P. Kempeneers, A. Neukom, H. Feusi, P. Adolph, R. Moser, T. Schilliger, M. Quickelberghe, J. Alder, D. Mollet, L. Vos, P. Kohler, M. Meng, J. Piesbergen, P. Strobl, M. E. Schaepman, J. Gavira, G. Ulbrich, R. Meynart, "APEX: Current status of the airborne dispersive pushbroom imaging spectrometer," International Symposium on Optical Science and Technology, SPIE 49th Annual Meeting, Denver, CO, USA, Aug. 2-6, 2004
7) M. E. Schaepman, K. I. Itten, and The APEX Team, "Status of the Airborne Dispersive Pushbroom Imaging Spectrometer APEX (Airborne Prism Experiment)," Proceedings of IGARSS 2003, Toulouse, France, July 21-25, 2003
8) M. E. Schaepman, L. de Vos, K. I. Itten, "APEX-airborne PRISM experiment: hyperspectral radiometric performance analysis for the simulation of the future ESA land surface processes earth explorer mission," Proceedings of SPIE, Vol. 3438, Imaging Spectrometry IV, Michael R. Descour, Sylvia S. Shen, Editors, Oct. 1998, pp. 253-262
9) Jens Nieke, Klaus I. Itten, Johannes W. Kaiser, Daniel Schläpfer, Jason Brazile, Walter Debruyn, Koen Meuleman, Pieter Kempeneers, Andreas Neukom, Hans Feusi, Peter Adolph, Renzo Moser, Thomas Schilliger, Marie van Quickelberghe, John Alder, Dominique Mollet, Lieve De Vos, Peter Kohler, Markus Meng, Jens Piesbergen, Peter Strobl, Michael E. Schaepman, José Gavira, Gerd Ulbrich, Roland Meynart, "APEX: Current Status of the Airborne Dispersive Pushbroom Imaging Spectrometer," SPIE's 49th Annual Meeting, Denver, CO, USA, Aug 2-6, 2004, SPIE Vol. 5542, 2004
10) Michael E. Schaepman, Michael Jehle, Andreas Hueni, Petra D'Odorico, Alexander Damm, Jürg Weyermann, Fabian D. Schneider, Valérie Laurent, Christoph Popp, Felix C. Seidel, Karim Lenhard, Peter Gege, Christoph Küchler, Jason Brazile, Peter Kohler, Lieve De Vos, Koen Meuleman, Roland Meynart, Daniel Schläpfer, Mathias Kneubühler, Klaus I. Itten, "Advanced radiometry measurements and Earth science applications with the Airborne Prism Experiment (APEX)," Remote Sensing of Environment, Vol. 158, 2015, pp: 207-219, doi:10.1016/j.rse.2014.11.014, URL: http://www.sciencedirect.com/science/article/pii/S0034425714004568
11) Francesco Dell'Endice, Jens Nieke, Jason Brazile, Daniel Schläpfer, Andreas Hueni, Klaus Itten, "Automatic Calibration Correction Scheme for APEX (Airborne Prism Experiment)," Proceedings of the 5th EARSeL Workshop on Imaging Spectroscopy. Bruges, Belgium, April 23-25 2007
12) Jens Nieke, Johannes W. Kaiser, Daniel Schläpfer, Jason Brazile, Klaus I. Itten, Horst Schwarzer, Peter Strobl, Michael E. Schaepman, Gerd Ulbrich, and the APEX team, "Calibration Methodology for the Airborne Dispersive Pushbroom Imaging Spectrometer (APEX)," URL: http://earth.esa.int/workshops/ivos05/pres/09_nieke.pdf
13) Jens Nieke, Daniel 2 Schläpfer, Francesco Dell'Endice, Jason Brazile, Klaus I. Itten, "Uniformity of Imaging Spectrometry Data Products," IEEE Transactions on Geoscience and Remoter Sensing, Vol. 46, No 10, Oct. 2008, URL: http://www.daniel-schlaepfer.ch/pdf/2008/Nieke_TGARS08_uniformity.pdf
14) Daniel Schläpfer, Jens Nieke, Francesco Dell'Endice, Andreas Hüni, Jan Biesemans, Koen Meuleman, Klaus I. Itten, "Optimized Workflow for APEX Level 2/3 Processing," Proceedings of the 5th EARSeL Workshop on Imaging Spectroscopy. Bruges, Belgium, April 23-25 2007, URL: https://www.researchgate.net/publication/233779049_Andreas_Hueni_Sindy_Sterckx_Michael_Jehle_Petra_D'Odorico_Kristin_Vreys_Bart_Bomans_Jan_Biesemans_Koen_Meuleman_Michael_E_Schaepman_Operational_status_of_apex_and_characteristics_of_the_apex_open_scie
15) Michael E. Schaepman, Daniel Schläpfer, Jason Brazile, Stephan Bojinski, "Processing of large-volume airborne imaging spectrometer data: the APEX approach," Proceedings of SPIE, San Diego, CA, USA, Vol. 4816, pp. 72-79, 2002
16) Klaus Itten, Koen Meuleman, Michael Schaepman, Edoardo Alberti, Bart Bomans, Francesco Dell'Endice, Petra D'Odorico, Andreas Hueni, Mathias Kneubuehler, Jens Nieke, Daniel Schläpfer, Gerd J. Ulbrich, and the APEX team, "First Test Results of the Airborne Dispersive Pushbroom Spectrometer APEX," URL: [web source no longer available]
17) Peter Gege, Jochen Fries, Peter Haschberger, Paul Schötz, Horst Schwarzer, Peter Strobl, Birgit Suhr, Gerd Ulbrich, Willem Jan Vreeling, "Calibration facility for airborne imaging spectrometers," ISPRS Journal of Photogrammetry and Remote Sensing, Vol. 64, Issue 4, July 2009, pp 387-397
18) E. Alberti, F. Dell'Endice, P. D'odorico, A. Hueni, M. E. Schaepman, K. Meuleman, J. Biesemans, R. Dryemaeker, S. Sterckx, S. Adriaensen, S. Kempenaers, B. Bomans, D. Schläpfer, Y. Rezaei, "APEX Status: Instrument Development and Performance," Proceedings of the Hyperspectral Workshop 2010, Frascati, Italy, M;arch 17-19, 2010, ESA SP-683
19) Koen Meuleman, "APEX Status: Instrument Performance, Operations and Product Generation," May 12, 2010, URL: http://eo.belspo.be/Docs/Resources/Presentations/BEODay2010/APEX.pdf
20) Andreas Hueni, Sindy Sterckx, Michael Jehle, Petra D'Odorico, Kristin Vreys, Bart Bomans, Jan Biesemans, Koen Meuleman, Michael E. Schaepman, "Operational status of APEX and characteristics of the APEX Open Science Data Set," Proceedings of IGARSS (International Geoscience and Remote Sensing Symposium), Munich, Germany, July 22-27, 2012, URL: [web source no longer available]
21) "APEX flyer 2012," URL: http://www.apex-esa.org/sites/default/files/APEXFlyer2012.pdf
22) Petra D'Odorico, "Monitoring the Spectral Performance of the APEX Imaging Spectrometer for Inter-Calibration of Satellite Missions," RSL, University of Zürich, 2012, URL: https://web.archive.org/web/20170808205929/http://www.geo.uzh.ch/microsite/rsl-documents/research/publications/other-sci-communications/wscz2007-odermatt-3356120576/wscz2007-odermatt.pdf
23) "APEX Open Science Data Set," URL: http://www.apex-esa.org/sites/default/files/APEX_OSD_Leaflet_V1.pdf
24) "APEX Airborne PRISM Experiment," 2012, URL: http://www.apex-esa.org/sites/default/files/APEXFlyer2012.pdf
25) Michael E. Schaepman and the APEX team, "Advanced Earth Science Products using APEX," 2012 HyspIRI Science Workshop, NASA Decadal Survey Mission, Washington, DC, USA, Oct. 16-18, 2012, URL: http://hyspiri.jpl.nasa.gov/downloads/2012_Workshop/day3/2_20121018_APEX_HyspiriWS_Final.pdf
26) P. Gege, J. Fries, P. Haschberger, K. Lenhard, P. Schötz, Ch. J. Schwarz, T. Schwarzmaier, "Concept for Improved Radiometric Calibration of Radiance Sources at the CHB Facility," Proceedings of the Hyperspectral Workshop 2010, Frascati, Italy, M;arch 17-19, 2010, ESA SP-683
27) Peter Gege, Jochen Fries, Peter Haschberger, Paul Schötz, Horst Schwarzer, Peter Strobl, Birgit Suhr, Gerd Ulbrich, Willem Jan Vreeling, "Calibration facility for airborne imaging spectrometers," ISPRS Journal of Photogrammetry and Remote Sensing, Volume 64, Issue 4, July 2009, pp. 387-397
28) Peter Gege, Jochen Fries, Peter Haschberger, Paul Schötz,Horst Schwarzer, Peter Strobl, Birgit Suhr, Gerd Ulbrich, Willem Jan Vreeling, "Calibrationfacility for airborneimagingspectrometers," ISPRS Journal of Photogrammetry and Remote Sensing, Vol. 64, Issue 4, July 2009, pp. 387–397
29) B. Suhr, P. Gege, P. Strobl, J. W. Kaiser, J. Nieke, K. I. Itten, G.Ubrich, "Calibration Home Base for the Airborne Imaging Spectrometer APEX," Proceedings of the 4th EARSeL Workshop on Imaging Spectroscopy - New quality in environmental studies, Warsaw, Poland, April 25-27, 2005, URL: http://www.earsel.org/workshops/IS_Warsaw_2005/papers/Methods
_Data_Processing/54_Suhr_513_521.pdf
30) "CHB - Calibration Home Base," CHB flyer, DLR, URL: http://www.opairs.aero/media/download/pdf/CHB-Flyer_110406_en.pdf
31) Thomas Schwarzmaier, Andreas Baumgartner, Peter Gege, Claas Köhler, Karim Lenhard, "DLR's New Traceable Radiance Standard "RASTA"," Proceedings of IGARSS (International Geoscience and Remote Sensing Symposium), Munich, Germany, July 22-27, 2012, URL: http://elib.dlr.de/78116/1/RASTA_IGARSS_Paper.pdf
The information compiled and edited in this article was provided by Herbert J. Kramer from his documentation of: "Observation of the Earth and Its Environment: Survey of Missions and Sensors" (Springer Verlag) as well as many other sources after the publication of the 4th edition in 2002. - Comments and corrections to this article are always welcome for further updates (eoportal@symbios.space).