Lidar (Light detection and ranging)
Instrument Types
Lidar (Light Detection and Ranging) is a method of determining ranges using reflected laser light to produce 3D geospatial maps of a target area. Lidar has terrestrial applications including 3D scanning and autonomous vehicle guidance, as well as Earth remote sensing applications including the production of high resolution topographic maps. Remote sensing lidar observations are commonly made by airborne or satellite based instruments.
Related Resources
Remote sensing lidar instruments measure reflected laser radiation from the atmosphere or surface of the Earth. The timings of the returning laser pulses provide range measurements that allow for the construction of precise three-dimensional maps of the detected surface. Lidar works on the same principle as radar (Radio Detection and Ranging), but pulses light from a laser source instead of radio waves. The shorter wavelengths of light compared to radio waves allow for greater resolution in observations, however its higher energy prevents penetration through optically thick layers like clouds - meaning observations of surface features require clear conditions. This property however allows for atmospheric observations, using backscattered light off clouds to obtain aerosol properties and data. 1) 2)
Lidar observations give scientists and cartographers insights into natural and man-made environments with high precision and accuracy. In comparison to airborne lidar systems, satellite lidar systems benefit from rapid revisit periods and multiple passes over the same area, creating remote sensing applications in agriculture, forestry and conservation, geology, atmosphere, mining, disaster monitoring and more. 2)
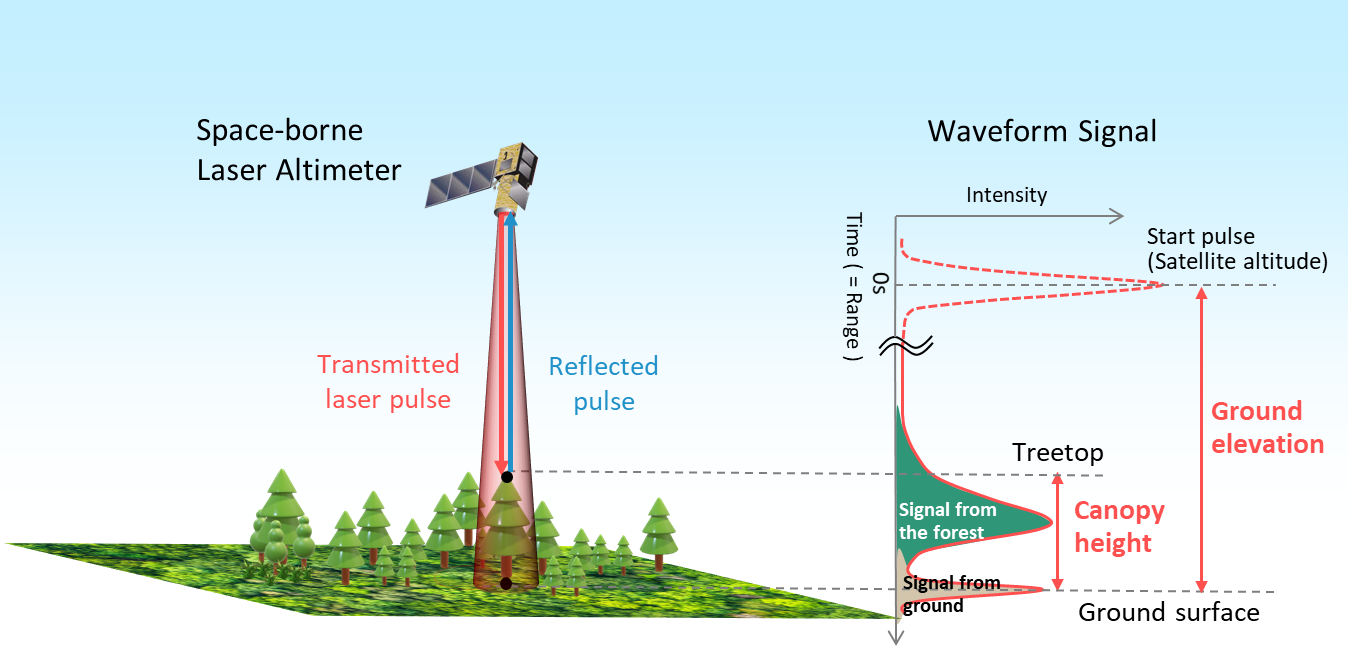
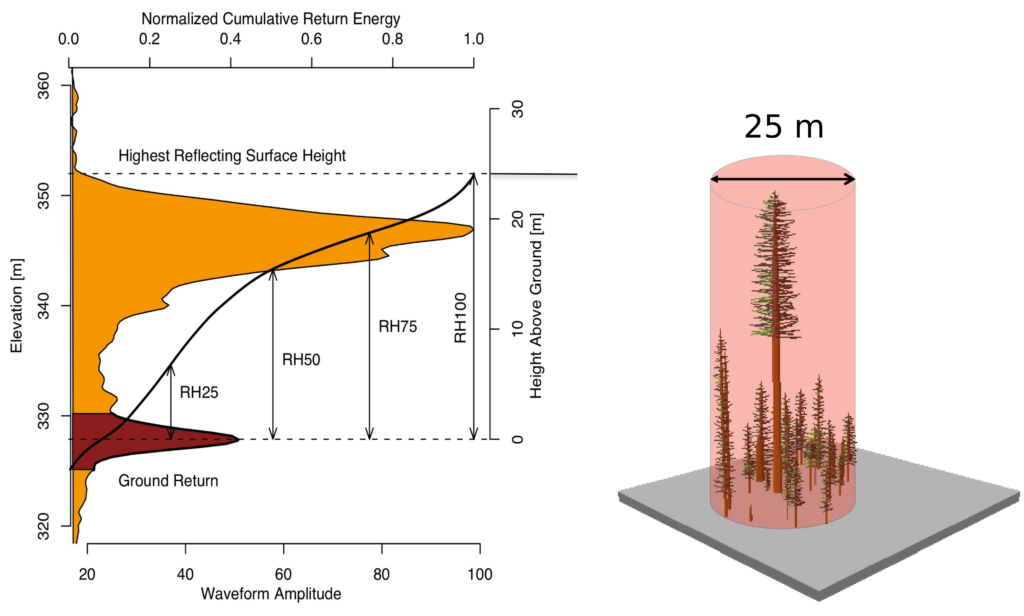
A lidar instrument typically consists of a laser, scanner and GPS (Global Positioning System) receiver. As a lidar satellite orbits Earth, its laser source emits pulses of light which reflect off features of the Earth’s surface and return to the satellite’s receiver telescope. Shorter delays in the return of the pulses correspond to the photons travelling shorter distances and thus having reflected off taller features, and longer delays correspond to smaller features. The return times are compared to the known distance of the satellite to the Earth’s surface. 3)
Another type of lidar instrument are atmospheric lidars, which study atmospheric properties using a light scattering process, from the ground up to the top of the atmosphere. Lidars used to detect features on the Earth’s surface use solid surface reflection, which bounces photons from the ground and back up to the satellite’s receiving telescope - whereas for cloud and aerosol measurements, lidars measure backscattered laser light from within the atmosphere.
High spectral resolution lidars (HSRL) are atmospheric lidars with the capability of separating the contributions from aerosol (Mie) and molecular (Rayleigh) scattering into two channels, which provides the aerosol optical depth (AOD), a measure of the aerosol’s extinction effect. These lidar systems can provide information on properties such as particle altitude, optical properties, wind speed and direction, and atmospheric gas concentrations. Satellites provide the capability for repeat measurements over the same location, in which the lidar data can be used to aid our understanding of the vertical and horizontal transport of particles and gases in the atmosphere. Elastic backscatter lidars cannot measure aerosol extinction, but can provide information on the altitude and vertical thickness of aerosol and cloud layers, as well as further optical properties that affect the climate. 4)
Example Products
Topographic lidar products
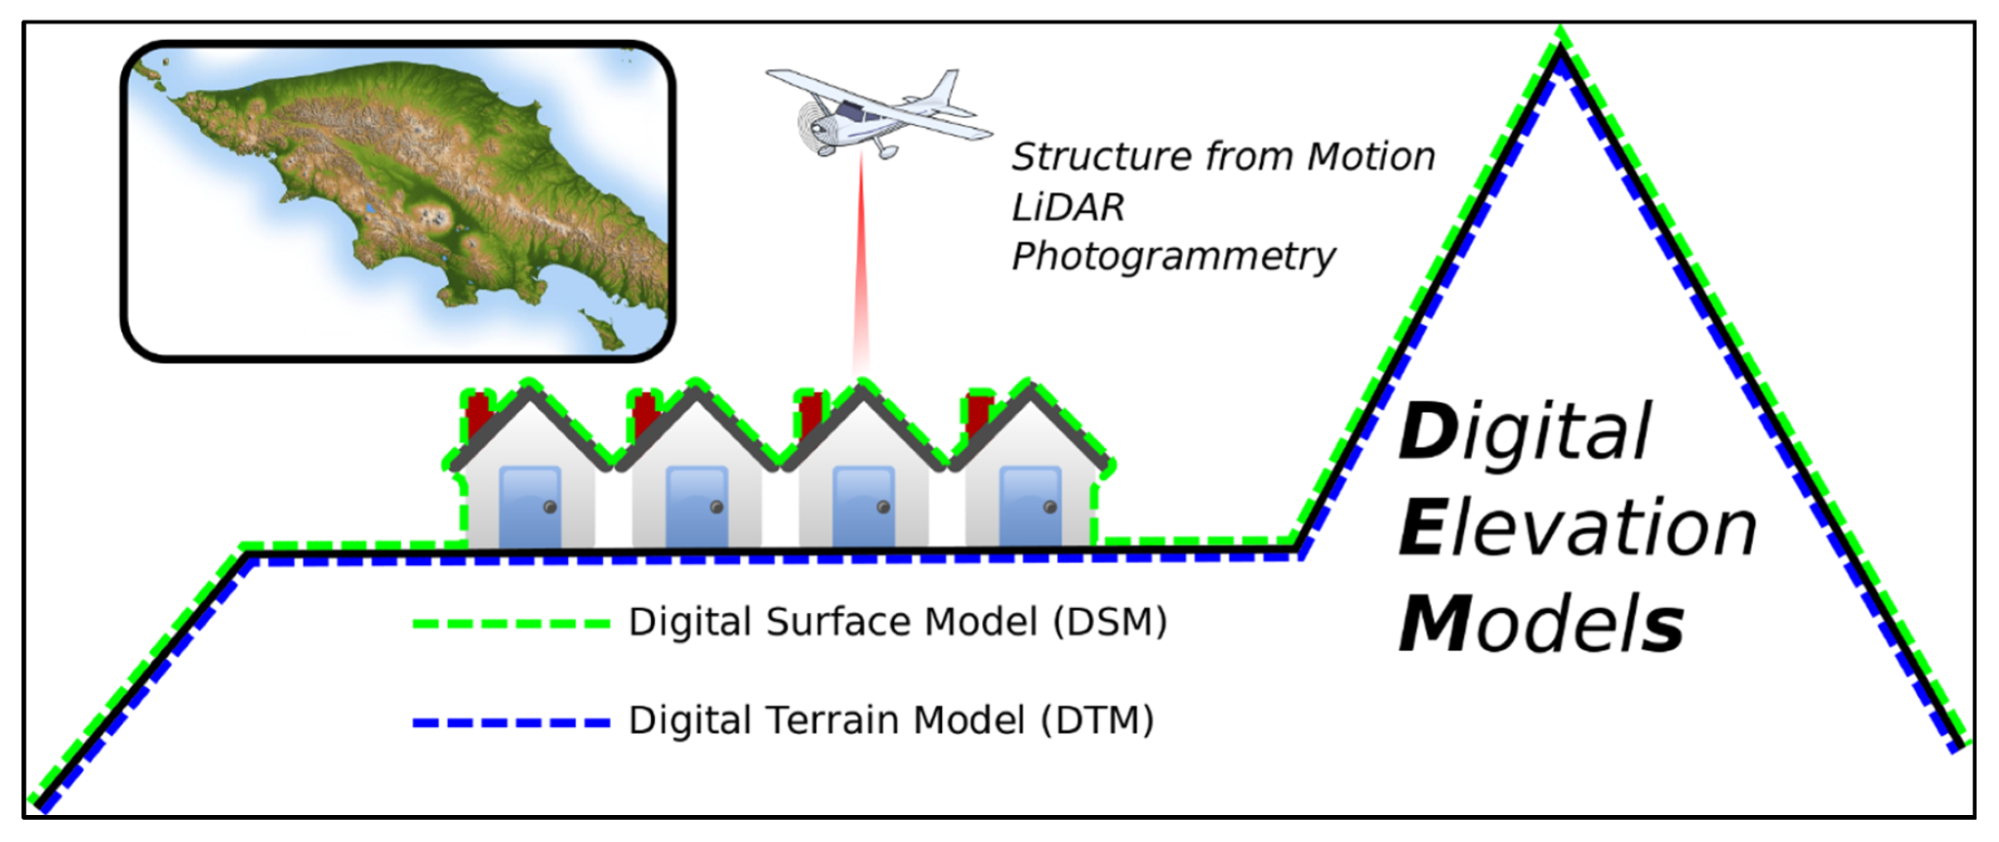
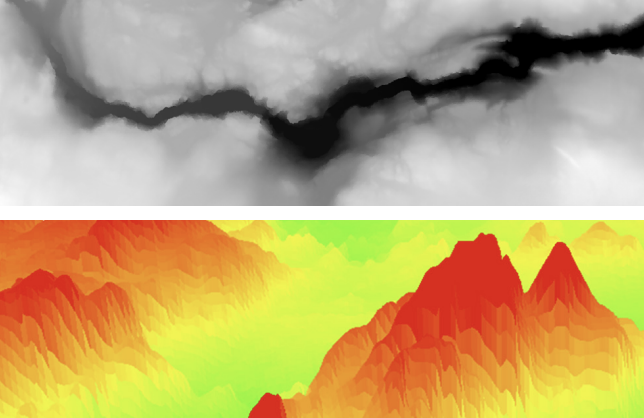
Terrestrial lidar data is most commonly represented in topographic models known as Digital Elevation Models (DEMs). Digital Terrain Models (DTMs) and Digital Surface Models (DSMs) are types of DEM. 8) 10)
DSMs and DTMs are terrestrial lidar products that display topographical information of a target area. The distinction between the two is that DSMs are delineations of all the reflective surface echoes from above bare-Earth, measuring both natural and human-made structures including buildings, vegetation, tree canopies and more. DTMs concern only bare-Earth, where vegetation and human-made artefacts are filtered out.
DSMs and DTMs fall under the umbrella of DEMs, where high spatial resolution instruments can distinguish between the two. With a low spatial resolution where fine structures need not be identified, for example a large-scale survey of a country, the generic DEM term is used.
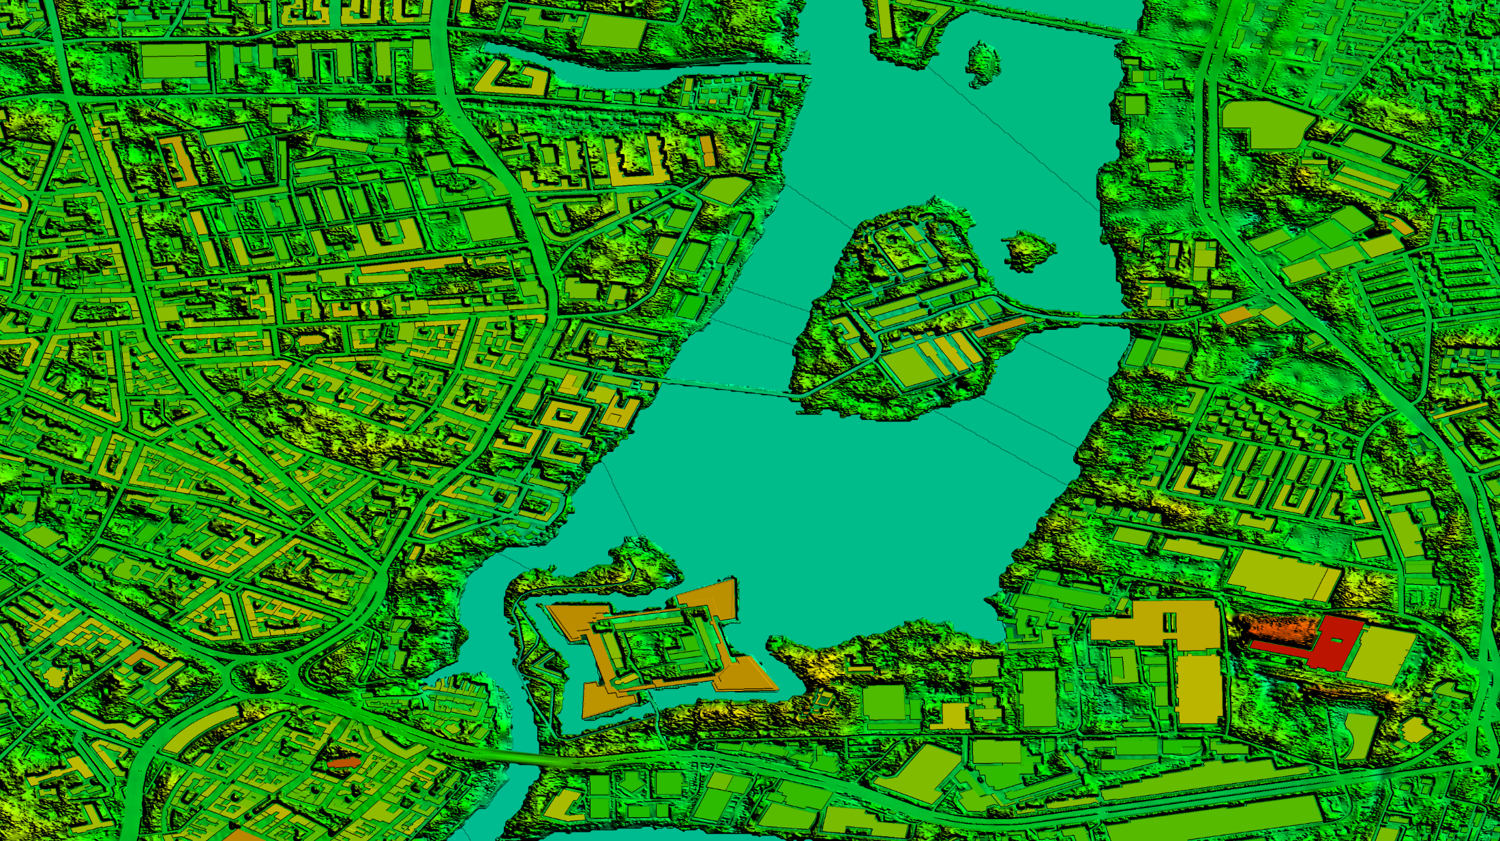
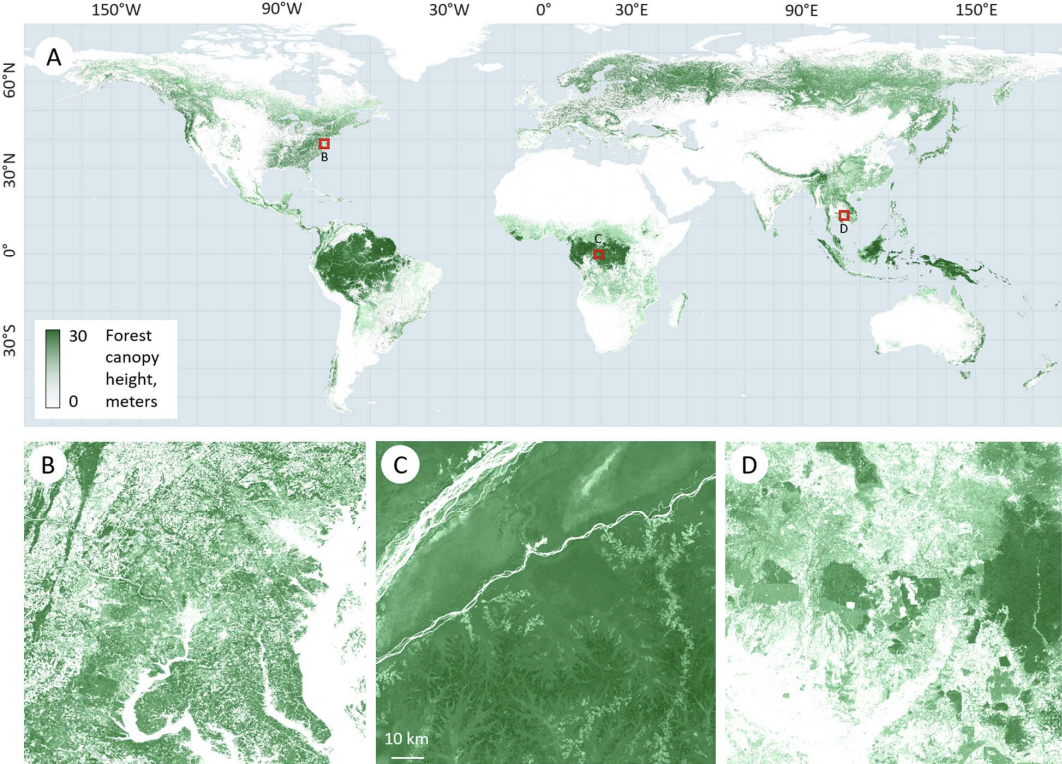
DSMs have applications in urban planning, since they can identify the bare-Earth and all its elevated features, as well as for visualisation, crisis and vegetation management, navigation and more. A common type of DSM is a Canopy Height Model (CHM), as shown in Figure 3. DTMs can be used to augment a DSM to derive height information of objects on the Earth’s surface.
DEMs are not exclusively obtainable by satellite-borne lidar instruments, they can also be produced by other remote sensing methods including synthetic aperture radar interferometry (InSAR), stereo photogrammetry, differential GPS (DGPS), and ground surveying.
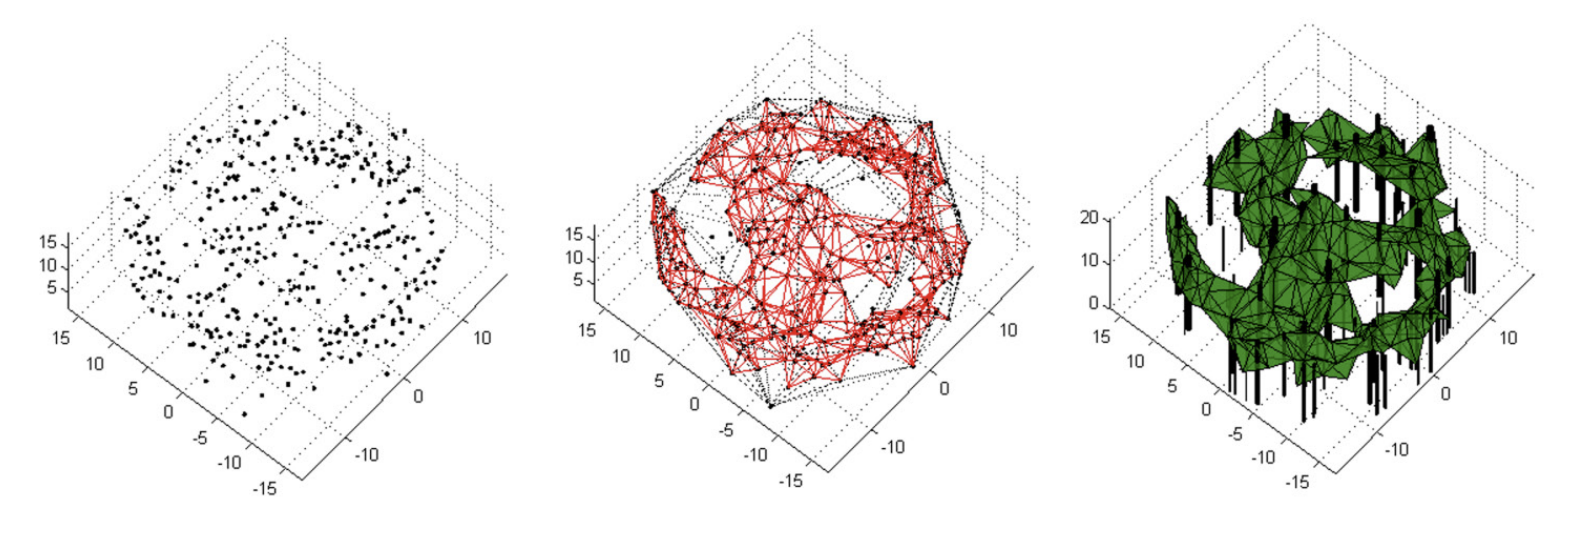
3D DEMs can be produced for more complex analyses, where areas of interest can be depicted with polygons.
NASA’s Global Ecosystems Dynamics Investigation Lidar (GEDI) mission creates 3D CHMs consisting of footprint and gridded data sets of forested areas around the globe. Vertical lidar profiles of forestry obtained by GEDI allow scientists to characterise the effects on ecosystems caused by climate change and land use. This knowledge will enable the improvement of our understanding of climate change and understanding of Earth’s carbon cycle and biodiversity. 14)
GEDI’s data products range from level 1 - 4, in order of increasing level of data processing undergone after collection. L1 data products include raw or geolocated waveforms, ground elevation and canopy top height; L2 concerns canopy cover fraction (CCF) and leaf area index (LAI) measurements, L3 data covers gridded L2 metrics, and L4 includes footprint level above ground biomass and gridded metrics above ground biomass density. 15)
GEDI data is also used to create a wider range of science products, including high resolution maps from the combination of data from both GEDI’s forest canopy height measurements and 30 m spatial resolution Landsat analysis-ready data (ARD). This collaboration has provided some of the most accurate estimates of carbon emissions due to deforestation. 16)
Bathymetric lidar products
Satellite-derived bathymetry (SDB) is a process that uses water-penetrating green light to measure marine depth information and seafloor topography. Variations in relief can be represented with colours (as shown in Figure 7 with imagery from Kompsat-3), contour lines or isobaths. SDB enables the production of bathymetric charts, detection of underwater objects, monitoring of shallow coastal areas, as well as facilitating geological studies, marine habitat monitoring and coastal planning. 6)
The wavelengths of light pulsed by terrestrial lidar instruments are unable to penetrate the surface of water, and they attenuate near the surface. To map terrain below the surface, bathymetric lidar instruments emit laser pulses at shorter wavelengths which are able to penetrate through water and return echoes from the seafloor. The depth the lidar pulse can travel underwater is dependent on the clarity of the water; a pulse will reach further through clearer water. 8)
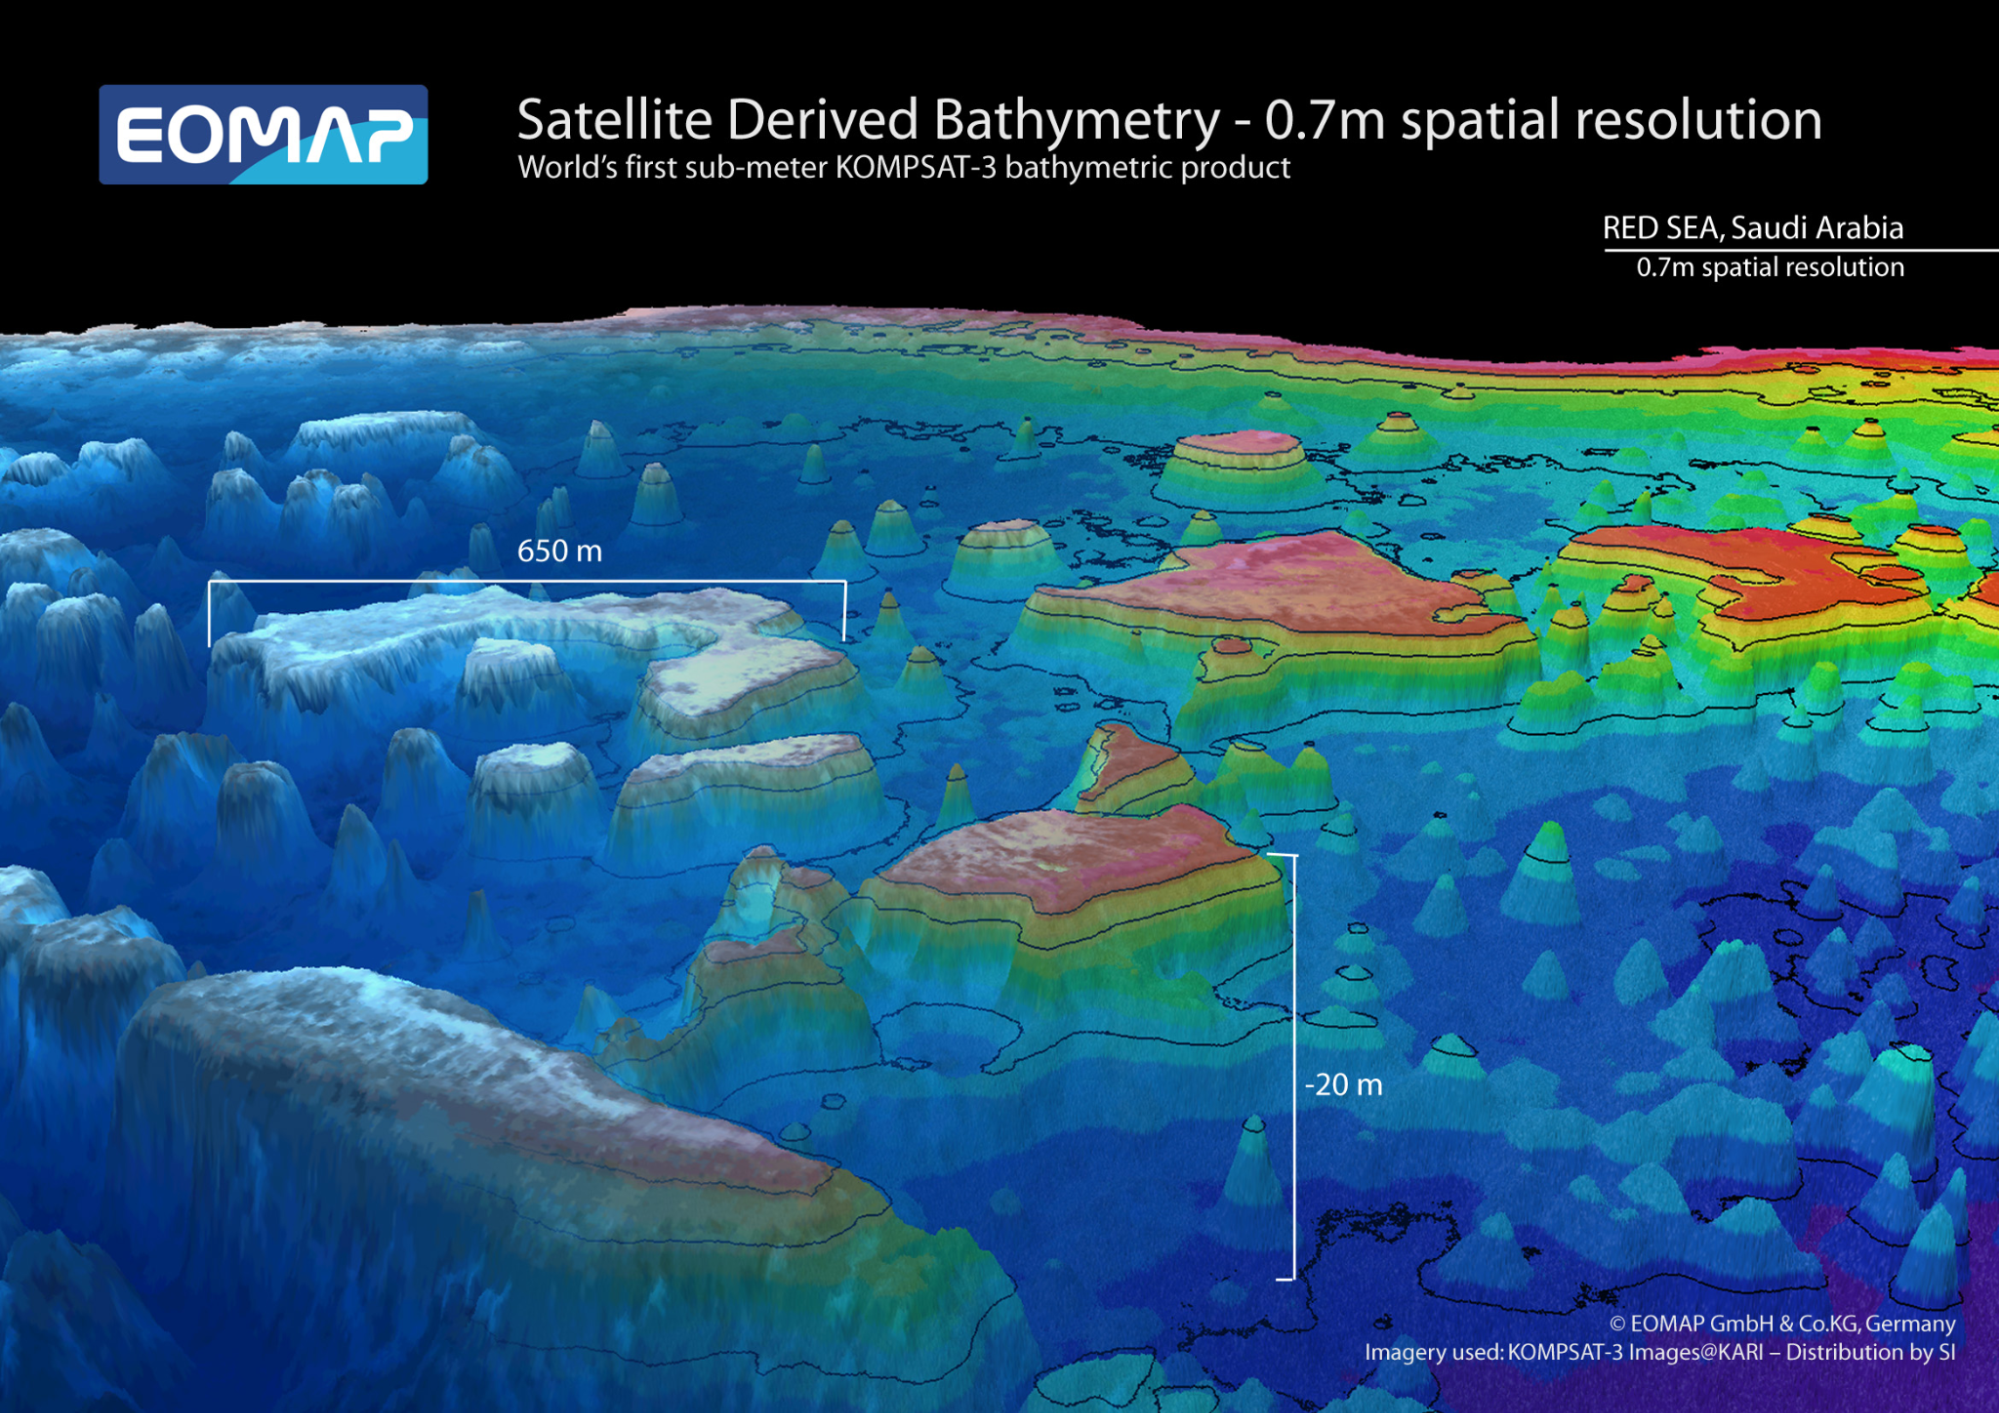
SDB has advantages over airborne and vessel-based bathymetric systems with increased data acquisition rates and the ability to rapidly survey previously inaccessible areas. Bathymetric lidar systems are also capable of gathering relative reflectance imagery, which permits the remote classification of seabed types and geology. Marine depth measurements are obtained by measuring the difference between the green and returning infrared light. The absolute reflectance and thus seafloor type is obtained from the returning pulse’s intensity. 7)
Atmospheric lidar products
Atmospheric lidar data is commonly displayed in ‘lidar curtains’, which are plots showing vertical properties and information of clouds and aerosols. Scientists can use atmospheric lidar data to precisely determine cloud and aerosol layer altitudes and their overlap extent, in order to identify the cloud composition and aerosol abundances. 12)
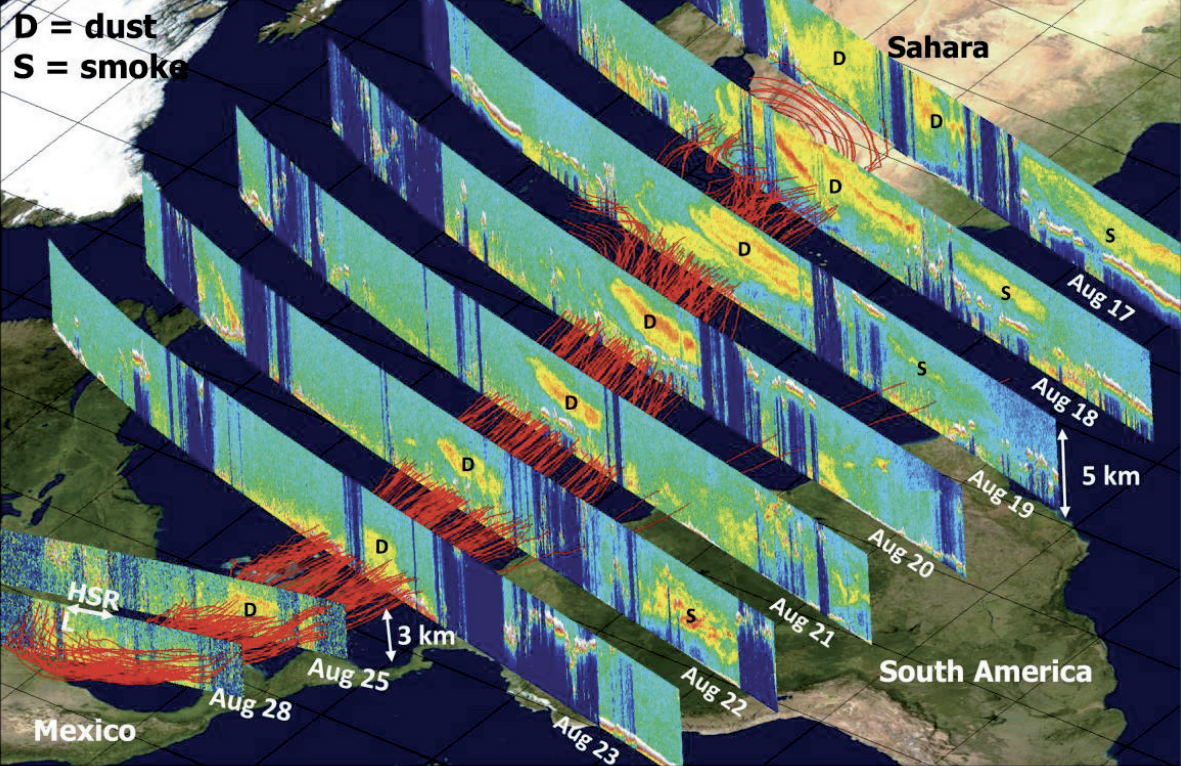
Atmospheric lidar data is commonly represented in this format, with the lidar curtains layered on top of the satellite’s orbital tracks, projected over a map of the Earth’s surface. This delineation displays both the observation locations and the atmospheric processes in study. Lidar data can also be displayed side-by-side with the satellite’s orbital track map, however since the data is measured in a vertical format, visualisation becomes more difficult. 13)
Related Missions
CALIPSO (Cloud-Aerosol Lidar and Infrared Pathfinder Satellite Observations)
CALIPSO is a joint NASA (National Aeronautics and Space Administration) and CNES (French Space Agency) cloud and aerosol observation satellite with the objective to determine the role of clouds and aerosols in regulating the Earth’s climate. Launched in April 2006, the satellite uses a cloud-aerosol lidar with orthogonal polarisation (CALIOP), which is a two-wavelength laser transmitter, to obtain vertical profiles of clouds and aerosols from detected backscatter.
Aeolus / formerly ADM (Atmospheric Dynamics Mission)
Aeolus is an ESA (European Space Agency) mission launched in August 2018 and concluded in April 2023, with the objective to provide wind profile measurements on a global scale. Aeolus was the first satellite of it's type, and carried the Atmospheric Laser Doppler Instrument (ALADIN), which uses the Doppler Wind Lidar (DWL) technique to retrieve wind speeds by direct line-of-sight lidar measurements, using Doppler shifted backscattered light from atmospheric molecules and particles advected by wind.
ICESat-2 (Ice, Cloud and land Elevation Satellite-2)
Launched in September 2018, ICESat-2 is the NASA follow-up mission to ICESat with the objective to measure sea ice topography, global vegetation and cloud and cloud and atmospheric properties. ICEsat uses the Advanced Topographic Laser Altimeter System (ATLAS), a photon-counting lidar that acquires high resolution data of both the Earth’s surface and atmospheric backscatter from molecules, clouds and aerosols.
ISS: GEDI (Global Ecosystems Dynamics Investigations lidar)
GEDI is a NASA mission onboard the International Space Station (ISS) that produced elevation profiles of forests and habitat quality on Earth; the instrument operated between December 2018 and March 2023 and is in storage before continuing operations in 2024. The instrument studied a range of climates including canopy structure and tundra environments in northern latitudes, and its data will help scientists understand changes to natural carbon storage within the carbon cycle.
EarthCARE (Earth Clouds, Aerosols and Radiation Explorer)
EarthCARE is a joint European / Japanese Earth observation mission that plans to study natural and anthropogenic climate change from 2024. EarthCARE will make observations of clouds, aerosols and radiation parameters to provide essential data for numerical modelling and global studies of vertical profiles of aerosols, vertical distributions of atmospheric liquid water and ice, and atmospheric radiative heating and cooling. EarthCARE houses an atmospheric lidar (ATLID), a backscatter lidar instrument transmitting UV light (355 nm) to provide high resolution atmospheric echoes.
ICESat (Ice, Cloud and land Elevation Satellite)
NASA Laser altimetry mission flown between 2003 and 2010 that measured the mass balance of polar ice sheets alongside atmospheric measurements. Read more
ISS: CATS (Cloud Aerosol Transport System)
NASA atmospheric lidar mission onboard the ISS between 2015 and 2018 to assess the global climate impacts of clouds and aerosols. Read more
MERLIN (Methane Remote Sensing Lidar Mission)
CNES-DLR minisatellite climate mission planned to launch in 2028 and operate until 2031, with the objective to measure the global effects of atmospheric methane. Read more
References
1) “Lidars,” The Earth Observation Handbook, CEOS, December 2013, URL: http://www.eohandbook.com/eohb2014/sat_earth_obs_lidars.html
2) “What is lidar?,” National Oceanic and Atmospheric Administration, January 2023, URL: https://oceanservice.noaa.gov/facts/lidar.html
3) “NASA Launched Two Lidar Sensors to Monitor Biomass,” LIDAR News, January 2019, URL: https://blog.lidarnews.com/nasa-launched-lidar-sensors/
4) “Sensing Our Earth from Above,” NASA Langley Atmospheric Science Data Center & the Science Dictorate, April 11, 2022, URL: https://science.larc.nasa.gov/lidar/
5) Carn, Simon & Krueger, A. & Krotkov, Nickolay & Yang, Kai & Evans, Keith. (2008). “Tracking volcanic sulfur dioxide clouds for aviation hazard mitigation,” Natural Hazards, November 2008, Vol 51, pages 325-343, DOI: 10.1007/s11069-008-9228-4.
6) NOAA, “What is bathymetry?,” National Ocean Service, 20 January 2023, URL: https://oceanservice.noaa.gov/facts/bathymetry.html
7) Xin Liu, “Lidar Seafloor Classification,” Hydro International, 17 May 2011, URL: https://www.hydro-international.com/content/article/lidar-seafloor-classification
8) Markus Melin, “Remote Sensing: Lidar,” WWF, 2017, URL: https://www.wwf.org.uk/sites/default/files/2019-04/Lidar-WWF-guidelines.pdf
9) Arbeck, “The Difference between Digital Surface Model (DSM) and Digital Terrain Models (DTM) when Talking about Digital Elevation Models (DEM),” 2015, URL: https://commons.wikimedia.org/wiki/File:The_difference_between_Digital_Surface_Model_(DSM)_and_Digital_Terrain_Models_(DTM)_when_talking_about_Digital_Elevation_models_(DEM).svg
10) Nikita Marwaha, Elizabeth Duffy, “Everything you need to know about Digital Elevation Models (DEMs), Digital Surface Models (DSMs), and Digital Terrain Models (DTMs),” UP42, 12 March 2021, URL: https://up42.com/blog/everything-you-need-to-know-about-digital-elevation-models-dem-digital
11) “Hemispheric Transport of Air Pollution,” United Nations Economic Commission for Europe, 2010, URL: https://unece.org/sites/default/files/2021-06/AirPollutionStudies20en.pdf
12) “CALIPSO: A Global Perspective of Clouds and Aerosols from Space,” NASA earth observatory, 26 July 2002, URL: https://earthobservatory.nasa.gov/features/CALIPSO/CALIPSO3.php
13) Sarah Chow, “Visualise Vertical LiDAR Curtains with NASA’s Data Curtains from Space,” Cesium, 15 September 2015, URL: https://cesium.com/blog/2015/09/15/data-curtains/
14) “ISS: GEDI (Global Ecosystems Dynamics Investigation Lidar),” eoPortal, 14 June 2016, URL: https://www.eoportal.org/satellite-missions/iss-gedi
15) “GEDI Products,” GEDI Ecosystem Lidar,” URL: https://gedi.umd.edu/data/products/
16) Peter Potapov, “Mapping global forest canopy height through integration of GEDI and Landsat data,” Remote Sensing of Environment, 2021, URL: https://www.sciencedirect.com/science/article/pii/S0034425720305381
The information compiled and edited in this article was provided by Herbert J. Kramer from his documentation of: "Observation of the Earth and Its Environment: Survey of Missions and Sensors" (Springer Verlag) as well as many other sources after the publication of the 4th edition in 2002. - Comments and corrections to this article are always welcome for further updates (eoportal@symbios.space).